an introduction to psychometric theory - … · 3.nunnally & bernstein (1994) an old classic...
TRANSCRIPT
Intro Conceptual Overview 2 disciplines Theory testing R Using R Basic R References
An introduction to Psychometric Theory
William Revelle
Department of PsychologyNorthwestern UniversityEvanston, Illinois USA
March, 2017
1 / 83
Intro Conceptual Overview 2 disciplines Theory testing R Using R Basic R References
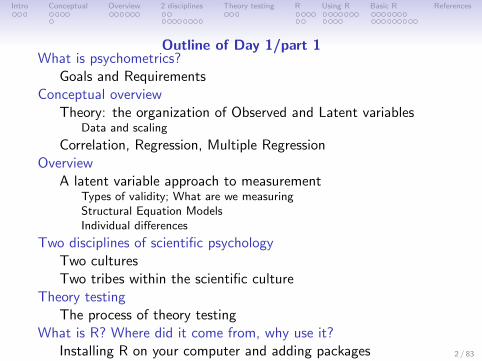
Outline of Day 1/part 1What is psychometrics?
Goals and RequirementsConceptual overview
Theory: the organization of Observed and Latent variablesData and scaling
Correlation, Regression, Multiple RegressionOverview
A latent variable approach to measurementTypes of validity; What are we measuringStructural Equation ModelsIndividual differences
Two disciplines of scientific psychologyTwo culturesTwo tribes within the scientific culture
Theory testingThe process of theory testing
What is R? Where did it come from, why use it?Installing R on your computer and adding packagesInstalling and using packages
Implementations of RBasic R capabilities: Calculation, Statistical tables, GraphicsData sets
Basic statistics and graphics4 steps: read, explore, test, graphBasic descriptive and inferential statistics
2 / 83
Intro Conceptual Overview 2 disciplines Theory testing R Using R Basic R References
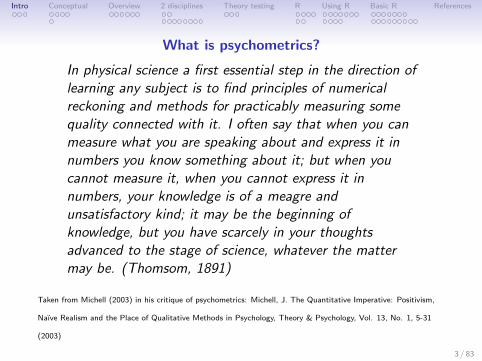
What is psychometrics?
In physical science a first essential step in the direction oflearning any subject is to find principles of numericalreckoning and methods for practicably measuring somequality connected with it. I often say that when you canmeasure what you are speaking about and express it innumbers you know something about it; but when youcannot measure it, when you cannot express it innumbers, your knowledge is of a meagre andunsatisfactory kind; it may be the beginning ofknowledge, but you have scarcely in your thoughtsadvanced to the stage of science, whatever the mattermay be. (Thomsom, 1891)
Taken from Michell (2003) in his critique of psychometrics: Michell, J. The Quantitative Imperative: Positivism,
Naıve Realism and the Place of Qualitative Methods in Psychology, Theory & Psychology, Vol. 13, No. 1, 5-31
(2003)
3 / 83
Intro Conceptual Overview 2 disciplines Theory testing R Using R Basic R References
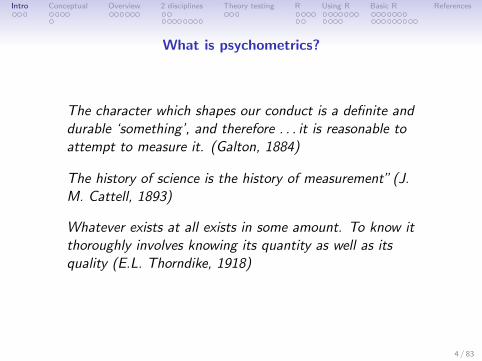
What is psychometrics?
The character which shapes our conduct is a definite anddurable ‘something’, and therefore . . . it is reasonable toattempt to measure it. (Galton, 1884)
The history of science is the history of measurement” (J.M. Cattell, 1893)
Whatever exists at all exists in some amount. To know itthoroughly involves knowing its quantity as well as itsquality (E.L. Thorndike, 1918)
4 / 83
Intro Conceptual Overview 2 disciplines Theory testing R Using R Basic R References
What is psychometrics?
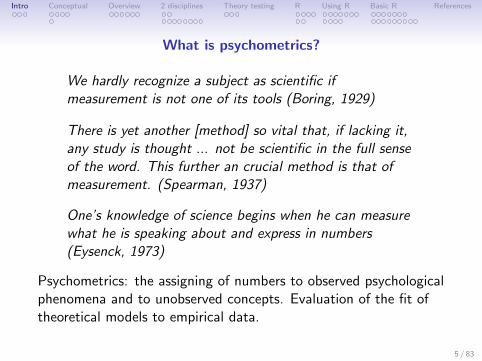
We hardly recognize a subject as scientific ifmeasurement is not one of its tools (Boring, 1929)
There is yet another [method] so vital that, if lacking it,any study is thought ... not be scientific in the full senseof the word. This further an crucial method is that ofmeasurement. (Spearman, 1937)
One’s knowledge of science begins when he can measurewhat he is speaking about and express in numbers(Eysenck, 1973)
Psychometrics: the assigning of numbers to observed psychologicalphenomena and to unobserved concepts. Evaluation of the fit oftheoretical models to empirical data.
5 / 83
Intro Conceptual Overview 2 disciplines Theory testing R Using R Basic R References
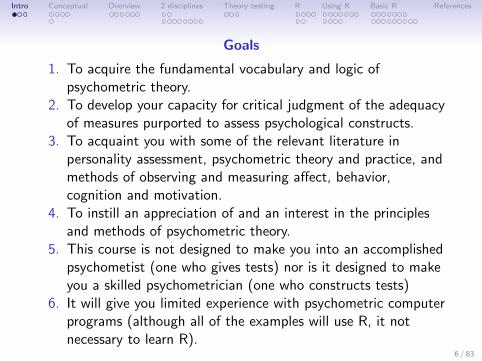
Goals
1. To acquire the fundamental vocabulary and logic ofpsychometric theory.
2. To develop your capacity for critical judgment of the adequacyof measures purported to assess psychological constructs.
3. To acquaint you with some of the relevant literature inpersonality assessment, psychometric theory and practice, andmethods of observing and measuring affect, behavior,cognition and motivation.
4. To instill an appreciation of and an interest in the principlesand methods of psychometric theory.
5. This course is not designed to make you into an accomplishedpsychometist (one who gives tests) nor is it designed to makeyou a skilled psychometrician (one who constructs tests)
6. It will give you limited experience with psychometric computerprograms (although all of the examples will use R, it notnecessary to learn R).
6 / 83
Intro Conceptual Overview 2 disciplines Theory testing R Using R Basic R References
Requirements
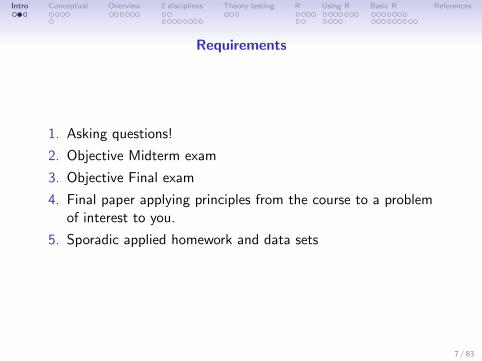
1. Asking questions!
2. Objective Midterm exam
3. Objective Final exam
4. Final paper applying principles from the course to a problemof interest to you.
5. Sporadic applied homework and data sets
7 / 83
Intro Conceptual Overview 2 disciplines Theory testing R Using R Basic R References
Texts (required and recommended supplements)
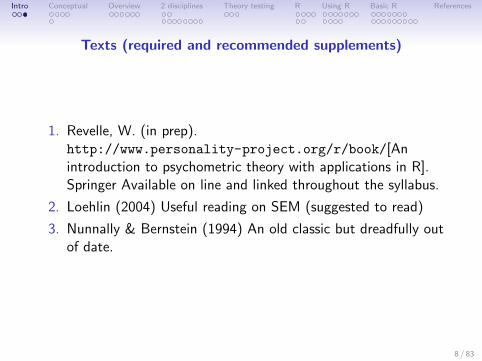
1. Revelle, W. (in prep).http://www.personality-project.org/r/book/[Anintroduction to psychometric theory with applications in R].Springer Available on line and linked throughout the syllabus.
2. Loehlin (2004) Useful reading on SEM (suggested to read)
3. Nunnally & Bernstein (1994) An old classic but dreadfully outof date.
8 / 83
Intro Conceptual Overview 2 disciplines Theory testing R Using R Basic R References
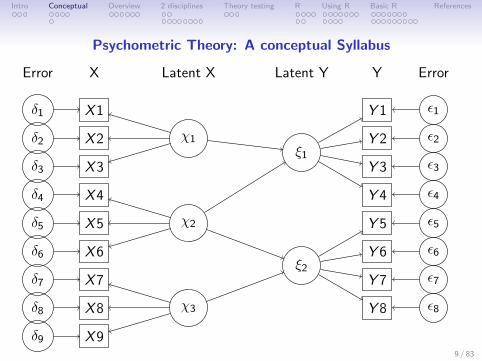
Psychometric Theory: A conceptual Syllabus
X
X 1
X 2
X 3
X 4
X 5
X 6
X 7
X 8
X 9
Error
δ1
δ2
δ3
δ4
δ5
δ6
δ7
δ8
δ9
χ1
χ2
χ3
ξ1
ξ2
Y
Y 1
Y 2
Y 3
Y 4
Y 5
Y 6
Y 7
Y 8
Error
ε1
ε2
ε3
ε4
ε5
ε6
ε7
ε8
Latent X Latent Y
9 / 83

Intro Conceptual Overview 2 disciplines Theory testing R Using R Basic R References
Observed Variables
X
X 1
X 2
X 3
X 4
X 5
X 6
X 7
X 8
X 9
Error
δ1
δ2
δ3
δ4
δ5
δ6
δ7
δ8
δ9
χ1
χ2
χ3
ξ1
ξ2
Y
Y 1
Y 2
Y 3
Y 4
Y 5
Y 6
Y 7
Y 8
Error
ε1
ε2
ε3
ε4
ε5
ε6
ε7
ε8
Latent X Latent Y
10 / 83
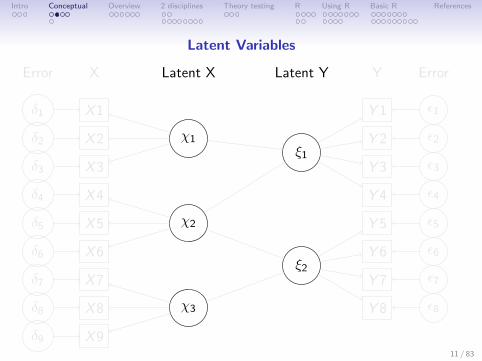
Intro Conceptual Overview 2 disciplines Theory testing R Using R Basic R References
Latent Variables
X
X 1
X 2
X 3
X 4
X 5
X 6
X 7
X 8
X 9
Error
δ1
δ2
δ3
δ4
δ5
δ6
δ7
δ8
δ9
χ1
χ2
χ3
ξ1
ξ2
Y
Y 1
Y 2
Y 3
Y 4
Y 5
Y 6
Y 7
Y 8
Error
ε1
ε2
ε3
ε4
ε5
ε6
ε7
ε8
Latent X Latent Y
11 / 83
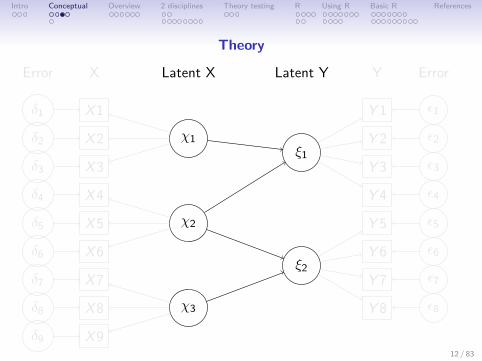
Intro Conceptual Overview 2 disciplines Theory testing R Using R Basic R References
Theory
X
X 1
X 2
X 3
X 4
X 5
X 6
X 7
X 8
X 9
Error
δ1
δ2
δ3
δ4
δ5
δ6
δ7
δ8
δ9
χ1
χ2
χ3
ξ1
ξ2
Y
Y 1
Y 2
Y 3
Y 4
Y 5
Y 6
Y 7
Y 8
Error
ε1
ε2
ε3
ε4
ε5
ε6
ε7
ε8
Latent X Latent Y
12 / 83
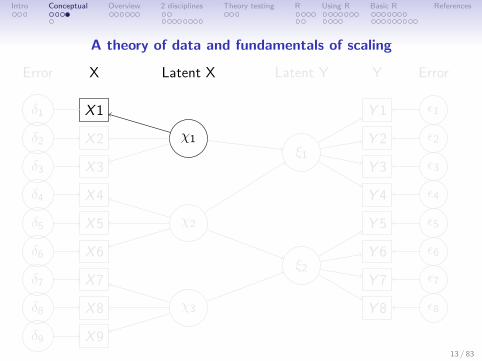
Intro Conceptual Overview 2 disciplines Theory testing R Using R Basic R References
A theory of data and fundamentals of scaling
X
X 1
X 2
X 3
X 4
X 5
X 6
X 7
X 8
X 9
Error
δ1
δ2
δ3
δ4
δ5
δ6
δ7
δ8
δ9
χ1
χ2
χ3
ξ1
ξ2
Y
Y 1
Y 2
Y 3
Y 4
Y 5
Y 6
Y 7
Y 8
Error
ε1
ε2
ε3
ε4
ε5
ε6
ε7
ε8
Latent X Latent Y
13 / 83
Intro Conceptual Overview 2 disciplines Theory testing R Using R Basic R References
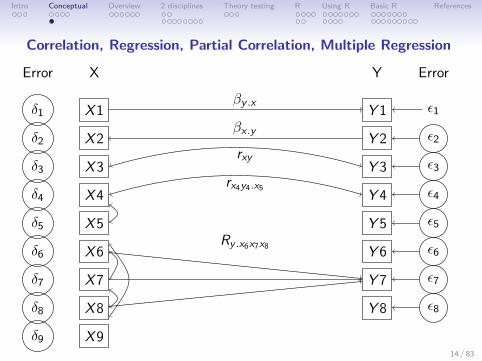
Correlation, Regression, Partial Correlation, Multiple Regression
X
X 1
X 2
X 3
X 4
X 5
X 6
X 7
X 8
X 9
Error
δ1
δ2
δ3
δ4
δ5
δ6
δ7
δ8
δ9
Y
Y 1
Y 2
Y 3
Y 4
Y 5
Y 6
Y 7
Y 8
Error
ε1
ε2
ε3
ε4
ε5
ε6
ε7
ε8
βy .x
βx .y
rxy
rx4y4.x5
Ry .x6x7x8
14 / 83
Intro Conceptual Overview 2 disciplines Theory testing R Using R Basic R References
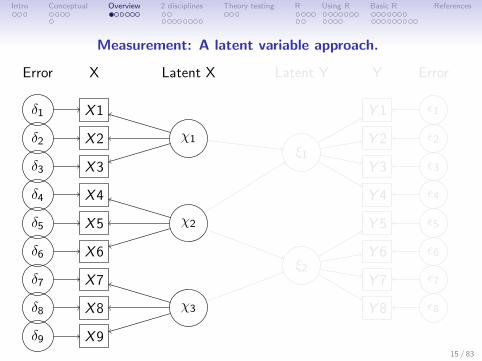
Measurement: A latent variable approach.
X
X 1
X 2
X 3
X 4
X 5
X 6
X 7
X 8
X 9
Error
δ1
δ2
δ3
δ4
δ5
δ6
δ7
δ8
δ9
χ1
χ2
χ3
ξ1
ξ2
Y
Y 1
Y 2
Y 3
Y 4
Y 5
Y 6
Y 7
Y 8
Error
ε1
ε2
ε3
ε4
ε5
ε6
ε7
ε8
Latent X Latent Y
15 / 83
Intro Conceptual Overview 2 disciplines Theory testing R Using R Basic R References
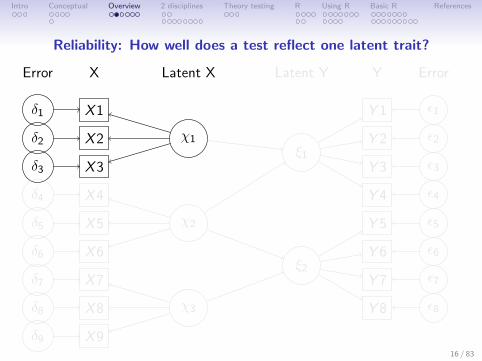
Reliability: How well does a test reflect one latent trait?
X
X 1
X 2
X 3
X 4
X 5
X 6
X 7
X 8
X 9
Error
δ1
δ2
δ3
δ4
δ5
δ6
δ7
δ8
δ9
χ1
χ2
χ3
ξ1
ξ2
Y
Y 1
Y 2
Y 3
Y 4
Y 5
Y 6
Y 7
Y 8
Error
ε1
ε2
ε3
ε4
ε5
ε6
ε7
ε8
Latent X Latent Y
16 / 83
Intro Conceptual Overview 2 disciplines Theory testing R Using R Basic R References
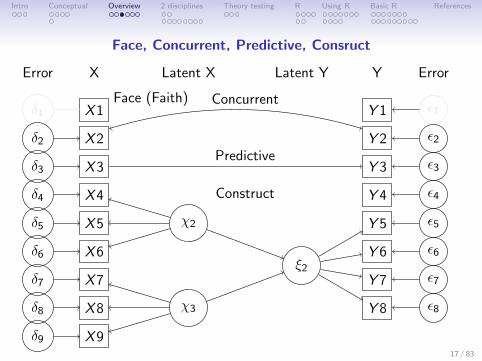
Face, Concurrent, Predictive, Consruct
X
X 1
X 2
X 3
X 4
X 5
X 6
X 7
X 8
X 9
Error
δ1
δ2
δ3
δ4
δ5
δ6
δ7
δ8
δ9
χ2
χ3
ξ2
Y
Y 1
Y 2
Y 3
Y 4
Y 5
Y 6
Y 7
Y 8
Error
ε1
ε2
ε3
ε4
ε5
ε6
ε7
ε8
Latent X Latent Y
Face (Faith) Concurrent
Predictive
Construct
17 / 83
Intro Conceptual Overview 2 disciplines Theory testing R Using R Basic R References
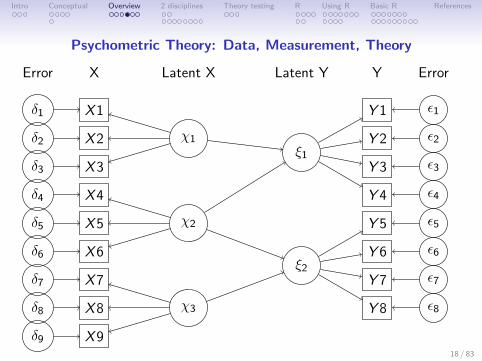
Psychometric Theory: Data, Measurement, Theory
X
X 1
X 2
X 3
X 4
X 5
X 6
X 7
X 8
X 9
Error
δ1
δ2
δ3
δ4
δ5
δ6
δ7
δ8
δ9
χ1
χ2
χ3
ξ1
ξ2
Y
Y 1
Y 2
Y 3
Y 4
Y 5
Y 6
Y 7
Y 8
Error
ε1
ε2
ε3
ε4
ε5
ε6
ε7
ε8
Latent X Latent Y
18 / 83
Intro Conceptual Overview 2 disciplines Theory testing R Using R Basic R References
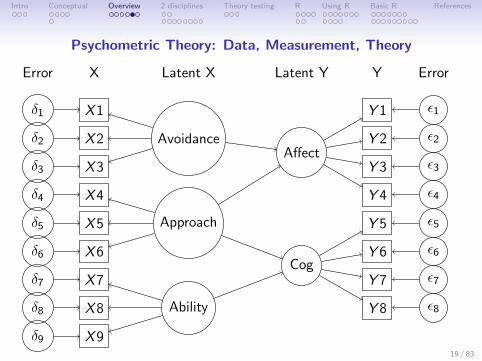
Psychometric Theory: Data, Measurement, Theory
X
X 1
X 2
X 3
X 4
X 5
X 6
X 7
X 8
X 9
Error
δ1
δ2
δ3
δ4
δ5
δ6
δ7
δ8
δ9
Avoidance
Approach
Ability
Affect
Cog
Y
Y 1
Y 2
Y 3
Y 4
Y 5
Y 6
Y 7
Y 8
Error
ε1
ε2
ε3
ε4
ε5
ε6
ε7
ε8
Latent X Latent Y
19 / 83
Intro Conceptual Overview 2 disciplines Theory testing R Using R Basic R References
Overview
1. Overview: An introduction to Psychometric Theory• What is Psychometrics?• What is R?
2. Weeks 1-2: Theory of Data, Issues in Scaling.
3. Weeks 2-3: More than you ever wanted to know aboutcorrelation.
• A review (?) of linear algebra.
4. Weeks 4-5 Dimension reduction through factor analysis,principal components analyze and cluster analysis.
5. Week 6-7 Classical Test Theory and Item Response Theory.
6. Week 8-9 Structural Equation Modeling and applied scaleconstruction.
20 / 83

Intro Conceptual Overview 2 disciplines Theory testing R Using R Basic R References
Eysenck and the process of science
Prologue: two broad themes to be discussed and interwoven
1. The two disciplines of scientific psychology
1.1 Two broad cultures of intellectual activity (Snow, 1959)1.2 Two broad cultures of psychology (Kimble, 1984)1.3 Two disciplines within scientific psychology (Cronbach, 1957,
1975) and (Eysenck, 1966, 1987a, 1997).
2. The process of theory construction and validation
2.1 Science from hunch to law (Eysenck, 1976, 1985)2.2 Good theories as alive and generative: the example of theories
of Extraversion.
I will emphasize the power of integrating psychometric andexperimental techniques in a programmatic study of personalityand individual differences.
21 / 83
Intro Conceptual Overview 2 disciplines Theory testing R Using R Basic R References
The two cultures of intellectual inquiry
C.P. Snow (1959) considered two cultures of intellectual inquiry:
“I believe the intellectual life of the whole of westernsociety is increasingly being split into two polar groups.”.. “I felt I was moving among two groups–comparable inintelligence, identical in race, not grossly different insocial origin, earning about the same incomes, who hadalmost ceased to communicate at all, who in intellectual,moral and psychological climate had so little in common... one might have crossed an ocean.”
22 / 83
Intro Conceptual Overview 2 disciplines Theory testing R Using R Basic R References
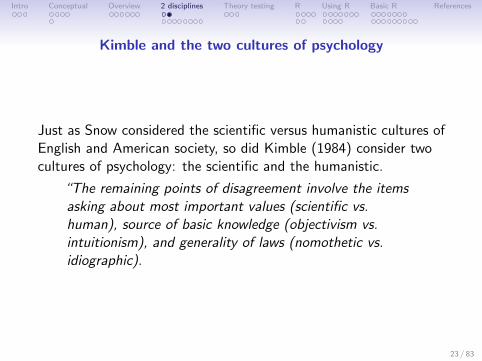
Kimble and the two cultures of psychology
Just as Snow considered the scientific versus humanistic cultures ofEnglish and American society, so did Kimble (1984) consider twocultures of psychology: the scientific and the humanistic.
“The remaining points of disagreement involve the itemsasking about most important values (scientific vs.human), source of basic knowledge (objectivism vs.intuitionism), and generality of laws (nomothetic vs.idiographic).
23 / 83

Intro Conceptual Overview 2 disciplines Theory testing R Using R Basic R References
Two competing tribes/paradigms within scientific psychology
But even within the culture of scientific psychology, we have twocompeting tribes who differ in their basic paradigmatic view of howto do science: the correlational vs. experimental paradigmsdiscussed by Cronbach (1957, 1975) and Eysenck (1966, 1987a,1997). Both pleaded for an integration of the two tribes. Neitherwas overly successful.Others who have tried to reconcile these differences include Vale &Vale (1969), and Underwood (1975).In a prior review Revelle & Oehlberg (2008) we reported that thisdichotomy still continues. Today I will try to go beyond thisdichotomy by showing how theory development and theory testingrequires a mixture of the inductive power of correlations with thedeductive power of experimental techniques. For we as individualdifferences psychologists are most able to unify the two disciplines.
24 / 83
Intro Conceptual Overview 2 disciplines Theory testing R Using R Basic R References
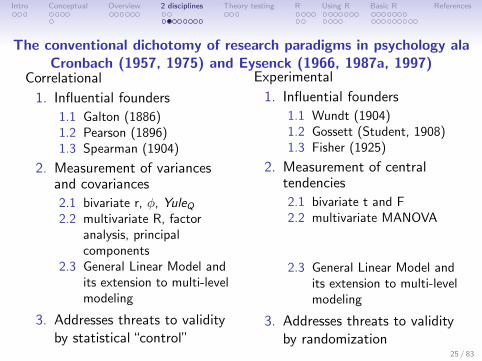
The conventional dichotomy of research paradigms in psychology alaCronbach (1957, 1975) and Eysenck (1966, 1987a, 1997)
Correlational
1. Influential founders
1.1 Galton (1886)1.2 Pearson (1896)1.3 Spearman (1904)
2. Measurement of variancesand covariances
2.1 bivariate r, φ, YuleQ2.2 multivariate R, factor
analysis, principalcomponents
2.3 General Linear Model andits extension to multi-levelmodeling
3. Addresses threats to validityby statistical “control”
Experimental
1. Influential founders
1.1 Wundt (1904)1.2 Gossett (Student, 1908)1.3 Fisher (1925)
2. Measurement of centraltendencies
2.1 bivariate t and F2.2 multivariate MANOVA
2.3 General Linear Model andits extension to multi-levelmodeling
3. Addresses threats to validityby randomization
25 / 83

Intro Conceptual Overview 2 disciplines Theory testing R Using R Basic R References
Two disciplines: two viewpoints
Table: The naive perspective from both sides–the other side is easy, whydon’t they just do it right? Our variables are complicated, wellarticulated, theirs are simple, just use any one.
Individual Differences Experimental
Personality Task PerformanceAbility
26 / 83
Intro Conceptual Overview 2 disciplines Theory testing R Using R Basic R References
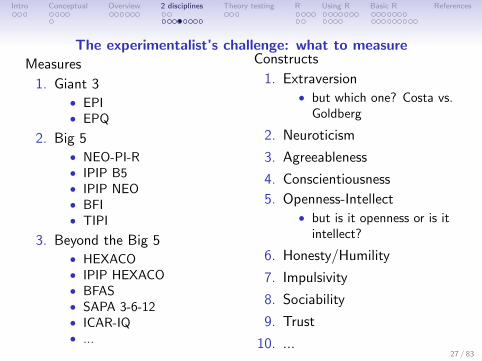
The experimentalist’s challenge: what to measure
Measures
1. Giant 3• EPI• EPQ
2. Big 5• NEO-PI-R• IPIP B5• IPIP NEO• BFI• TIPI
3. Beyond the Big 5• HEXACO• IPIP HEXACO• BFAS• SAPA 3-6-12• ICAR-IQ• ...
Constructs
1. Extraversion• but which one? Costa vs.
Goldberg
2. Neuroticism
3. Agreeableness
4. Conscientiousness
5. Openness-Intellect• but is it openness or is it
intellect?
6. Honesty/Humility
7. Impulsivity
8. Sociability
9. Trust
10. ...27 / 83
Intro Conceptual Overview 2 disciplines Theory testing R Using R Basic R References
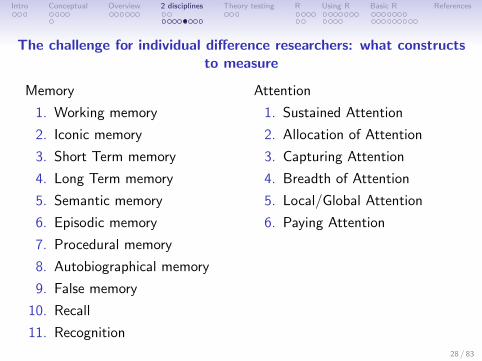
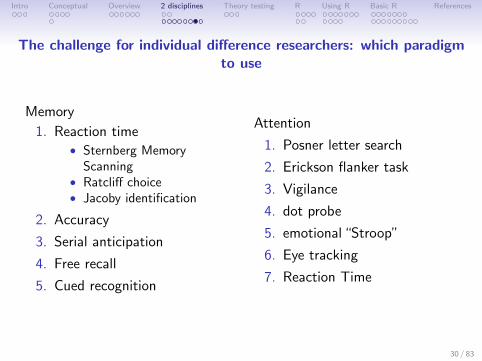
The challenge for individual difference researchers: what constructsto measure
Memory
1. Working memory
2. Iconic memory
3. Short Term memory
4. Long Term memory
5. Semantic memory
6. Episodic memory
7. Procedural memory
8. Autobiographical memory
9. False memory
10. Recall
11. Recognition
Attention
1. Sustained Attention
2. Allocation of Attention
3. Capturing Attention
4. Breadth of Attention
5. Local/Global Attention
6. Paying Attention
28 / 83
Intro Conceptual Overview 2 disciplines Theory testing R Using R Basic R References
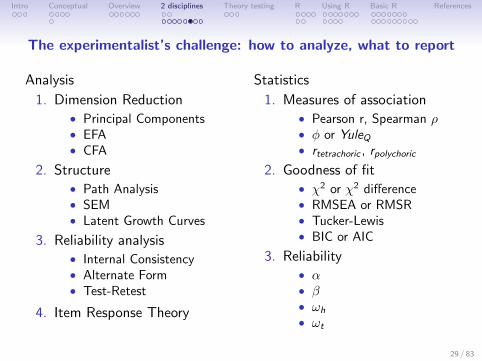
The experimentalist’s challenge: how to analyze, what to report
Analysis
1. Dimension Reduction• Principal Components• EFA• CFA
2. Structure• Path Analysis• SEM• Latent Growth Curves
3. Reliability analysis• Internal Consistency• Alternate Form• Test-Retest
4. Item Response Theory
Statistics
1. Measures of association• Pearson r, Spearman ρ• φ or YuleQ• rtetrachoric , rpolychoric
2. Goodness of fit• χ2 or χ2 difference• RMSEA or RMSR• Tucker-Lewis• BIC or AIC
3. Reliability• α• β• ωh
• ωt
29 / 83
Intro Conceptual Overview 2 disciplines Theory testing R Using R Basic R References
The challenge for individual difference researchers: which paradigmto use
Memory
1. Reaction time• Sternberg Memory
Scanning• Ratcliff choice• Jacoby identification
2. Accuracy
3. Serial anticipation
4. Free recall
5. Cued recognition
Attention
1. Posner letter search
2. Erickson flanker task
3. Vigilance
4. dot probe
5. emotional “Stroop”
6. Eye tracking
7. Reaction Time
30 / 83
Intro Conceptual Overview 2 disciplines Theory testing R Using R Basic R References
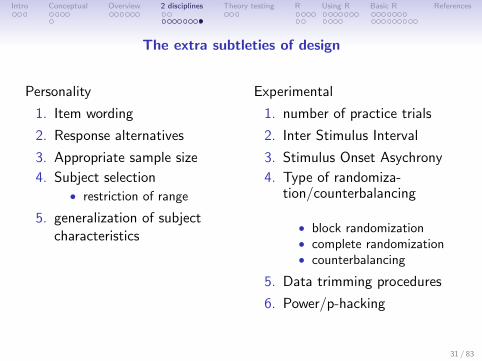
The extra subtleties of design
Personality
1. Item wording
2. Response alternatives
3. Appropriate sample size
4. Subject selection• restriction of range
5. generalization of subjectcharacteristics
Experimental
1. number of practice trials
2. Inter Stimulus Interval
3. Stimulus Onset Asychrony
4. Type of randomiza-tion/counterbalancing
• block randomization• complete randomization• counterbalancing
5. Data trimming procedures
6. Power/p-hacking
31 / 83
Intro Conceptual Overview 2 disciplines Theory testing R Using R Basic R References
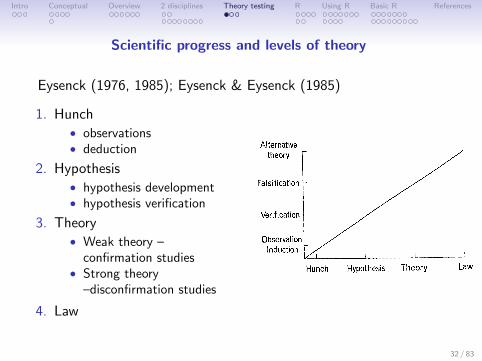
Scientific progress and levels of theory
Eysenck (1976, 1985); Eysenck & Eysenck (1985)
1. Hunch• observations• deduction
2. Hypothesis• hypothesis development• hypothesis verification
3. Theory• Weak theory –
confirmation studies• Strong theory
–disconfirmation studies
4. Law
32 / 83
Intro Conceptual Overview 2 disciplines Theory testing R Using R Basic R References
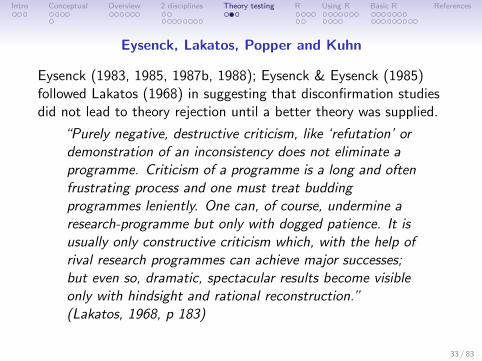
Eysenck, Lakatos, Popper and Kuhn
Eysenck (1983, 1985, 1987b, 1988); Eysenck & Eysenck (1985)followed Lakatos (1968) in suggesting that disconfirmation studiesdid not lead to theory rejection until a better theory was supplied.
“Purely negative, destructive criticism, like ‘refutation’ ordemonstration of an inconsistency does not eliminate aprogramme. Criticism of a programme is a long and oftenfrustrating process and one must treat buddingprogrammes leniently. One can, of course, undermine aresearch-programme but only with dogged patience. It isusually only constructive criticism which, with the help ofrival research programmes can achieve major successes;but even so, dramatic, spectacular results become visibleonly with hindsight and rational reconstruction.”(Lakatos, 1968, p 183)
33 / 83
Intro Conceptual Overview 2 disciplines Theory testing R Using R Basic R References
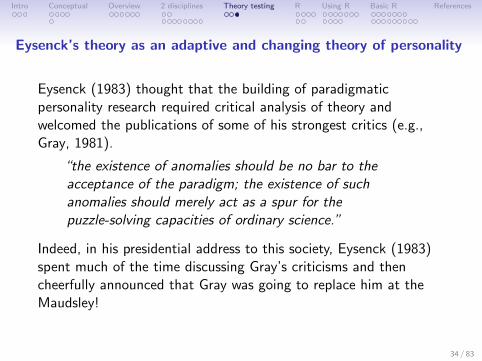
Eysenck’s theory as an adaptive and changing theory of personality
Eysenck (1983) thought that the building of paradigmaticpersonality research required critical analysis of theory andwelcomed the publications of some of his strongest critics (e.g.,Gray, 1981).
“the existence of anomalies should be no bar to theacceptance of the paradigm; the existence of suchanomalies should merely act as a spur for thepuzzle-solving capacities of ordinary science.”
Indeed, in his presidential address to this society, Eysenck (1983)spent much of the time discussing Gray’s criticisms and thencheerfully announced that Gray was going to replace him at theMaudsley!
34 / 83

Intro Conceptual Overview 2 disciplines Theory testing R Using R Basic R References
Use R
35 / 83
Intro Conceptual Overview 2 disciplines Theory testing R Using R Basic R References
R: Statistics for all of us
1. What is it?
2. Why use it?
3. Common (mis)perceptions of R
4. Examples for psychologists• graphical displays• basic statistics• advanced statistics• Although programming is easy in R, that is beyond the scope
of today
36 / 83
Intro Conceptual Overview 2 disciplines Theory testing R Using R Basic R References
R: What is it?
1. R: An international collaboration
2. R: The open source - public domain version of S+
3. R: Written by statistician (and all of us) for statisticians (andthe rest of us)
4. R: Not just a statistics system, also an extensible language.• This means that as new statistics are developed they tend to
appear in R far sooner than elsewhere.• R facilitates asking questions that have not already been asked.
5. R: encourages publications of ”Reproducible Research”• integrate data, code, text into one document• Sweave and knitr
37 / 83
Intro Conceptual Overview 2 disciplines Theory testing R Using R Basic R References
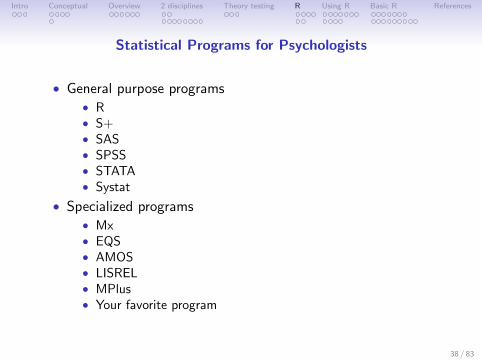
Statistical Programs for Psychologists
• General purpose programs• R• S+• SAS• SPSS• STATA• Systat
• Specialized programs• Mx• EQS• AMOS• LISREL• MPlus• Your favorite program
38 / 83
Intro Conceptual Overview 2 disciplines Theory testing R Using R Basic R References
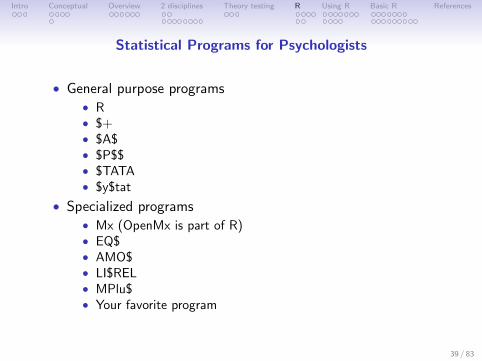
Statistical Programs for Psychologists
• General purpose programs• R• $+• $A$• $P$$• $TATA• $y$tat
• Specialized programs• Mx (OpenMx is part of R)• EQ$• AMO$• LI$REL• MPlu$• Your favorite program
39 / 83
Intro Conceptual Overview 2 disciplines Theory testing R Using R Basic R References
R: A way of thinking
• “R is the lingua franca of statistical research. Work in all otherlanguages should be discouraged.” (Jan de Leeuw , 2003)
• “This is R. There is no if. Only how.” (Simon ’Yoda’Blomberg, 2005)
• “Overall, SAS is about 11 years behind R and S-Plus instatistical capabilities (last year it was about 10 years behind)in my estimation.” (Frank Harrell, 2003)
• ”I quit using SAS in 1991 because my productivity jumped atleast 20% within one month of using S-Plus.” (Frank Harrell,2003)
Taken from the R.-fortunes (selections from the R.-help list serve)
40 / 83
Intro Conceptual Overview 2 disciplines Theory testing R Using R Basic R References
More fortunes
“You must realize that R is written by experts in statistics andstatistical computing who, despite popular opinion, do not believethat everything in SAS and SPSS is worth copying. Some thingsdone in such packages, which trace their roots back to the days ofpunched cards and magnetic tape when fitting a single linear modelmay take several days because your first 5 attempts failed due tosyntax errors in the JCL or the SAS code, still reflect the approachof “give me every possible statistic that could be calculated fromthis model, whether or not it makes sense”. The approach taken inR is different. The underlying assumption is that the useR isthinking about the analysis while doing it. ” (Douglas Bates, 2007)
41 / 83
Intro Conceptual Overview 2 disciplines Theory testing R Using R Basic R References
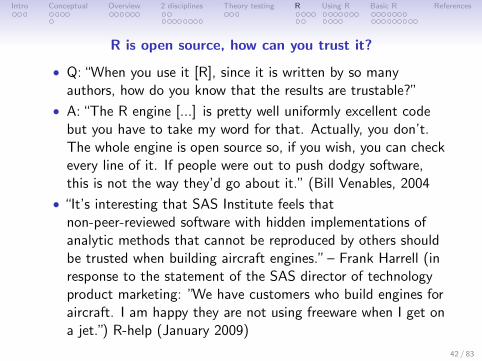
R is open source, how can you trust it?
• Q: “When you use it [R], since it is written by so manyauthors, how do you know that the results are trustable?”
• A: “The R engine [...] is pretty well uniformly excellent codebut you have to take my word for that. Actually, you don’t.The whole engine is open source so, if you wish, you can checkevery line of it. If people were out to push dodgy software,this is not the way they’d go about it.” (Bill Venables, 2004
• “It’s interesting that SAS Institute feels thatnon-peer-reviewed software with hidden implementations ofanalytic methods that cannot be reproduced by others shouldbe trusted when building aircraft engines.” – Frank Harrell (inresponse to the statement of the SAS director of technologyproduct marketing: ”We have customers who build engines foraircraft. I am happy they are not using freeware when I get ona jet.”) R-help (January 2009)
42 / 83
Intro Conceptual Overview 2 disciplines Theory testing R Using R Basic R References
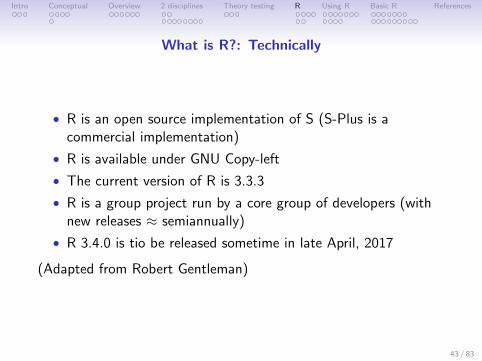
What is R?: Technically
• R is an open source implementation of S (S-Plus is acommercial implementation)
• R is available under GNU Copy-left
• The current version of R is 3.3.3
• R is a group project run by a core group of developers (withnew releases ≈ semiannually)
• R 3.4.0 is tio be released sometime in late April, 2017
(Adapted from Robert Gentleman)
43 / 83
Intro Conceptual Overview 2 disciplines Theory testing R Using R Basic R References
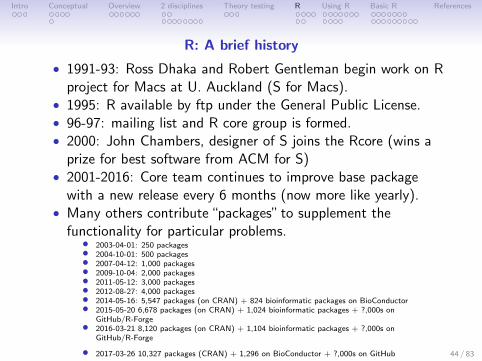
R: A brief history
• 1991-93: Ross Dhaka and Robert Gentleman begin work on Rproject for Macs at U. Auckland (S for Macs).
• 1995: R available by ftp under the General Public License.• 96-97: mailing list and R core group is formed.• 2000: John Chambers, designer of S joins the Rcore (wins a
prize for best software from ACM for S)• 2001-2016: Core team continues to improve base package
with a new release every 6 months (now more like yearly).• Many others contribute “packages” to supplement the
functionality for particular problems.• 2003-04-01: 250 packages• 2004-10-01: 500 packages• 2007-04-12: 1,000 packages• 2009-10-04: 2,000 packages• 2011-05-12: 3,000 packages• 2012-08-27: 4,000 packages• 2014-05-16: 5,547 packages (on CRAN) + 824 bioinformatic packages on BioConductor• 2015-05-20 6,678 packages (on CRAN) + 1,024 bioinformatic packages + ?,000s on
GitHub/R-Forge• 2016-03-21 8,120 packages (on CRAN) + 1,104 bioinformatic packages + ?,000s on
GitHub/R-Forge
• 2017-03-26 10,327 packages (CRAN) + 1,296 on BioConductor + ?,000s on GitHub 44 / 83
Intro Conceptual Overview 2 disciplines Theory testing R Using R Basic R References
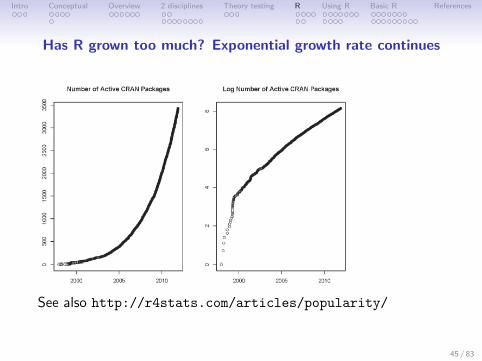
Has R grown too much? Exponential growth rate continues
See also http://r4stats.com/articles/popularity/
45 / 83
Intro Conceptual Overview 2 disciplines Theory testing R Using R Basic R References
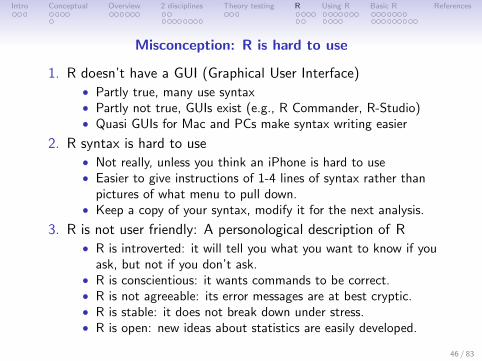
Misconception: R is hard to use
1. R doesn’t have a GUI (Graphical User Interface)• Partly true, many use syntax• Partly not true, GUIs exist (e.g., R Commander, R-Studio)• Quasi GUIs for Mac and PCs make syntax writing easier
2. R syntax is hard to use• Not really, unless you think an iPhone is hard to use• Easier to give instructions of 1-4 lines of syntax rather than
pictures of what menu to pull down.• Keep a copy of your syntax, modify it for the next analysis.
3. R is not user friendly: A personological description of R• R is introverted: it will tell you what you want to know if you
ask, but not if you don’t ask.• R is conscientious: it wants commands to be correct.• R is not agreeable: its error messages are at best cryptic.• R is stable: it does not break down under stress.• R is open: new ideas about statistics are easily developed.
46 / 83

Intro Conceptual Overview 2 disciplines Theory testing R Using R Basic R References
Misconceptions: R is hard to learn
1. With a brief web based tutorialhttp://personality-project.org/r, 2nd and 3rd yearundergraduates in psychological methods and personalityresearch courses are using R for descriptive and inferentialstatistics and producing publication quality graphics.
2. More and more psychology departments are using it forgraduate and undergraduate instruction.
3. R is easy to learn, hard to master• R-help newsgroup is very supportive• Multiple web based and pdf tutorials see (e.g.,http://www.r-project.org/)
• Short courses using R for many applications
4. Books and websites for SPSS and SAS users trying to learn R(e.g.,http://oit.utk.edu/scc/RforSAS&SPSSusers.pdfby Bob Muenchen).
47 / 83
Intro Conceptual Overview 2 disciplines Theory testing R Using R Basic R References
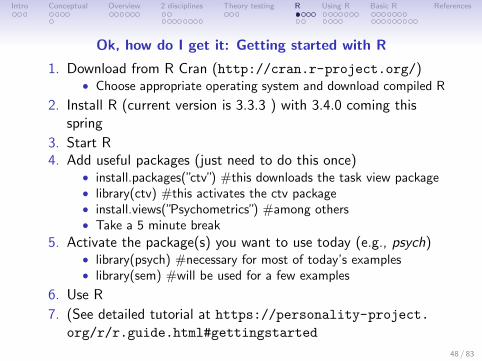
Ok, how do I get it: Getting started with R
1. Download from R Cran (http://cran.r-project.org/)• Choose appropriate operating system and download compiled R
2. Install R (current version is 3.3.3 ) with 3.4.0 coming thisspring
3. Start R4. Add useful packages (just need to do this once)
• install.packages(”ctv”) #this downloads the task view package• library(ctv) #this activates the ctv package• install.views(”Psychometrics”) #among others• Take a 5 minute break
5. Activate the package(s) you want to use today (e.g., psych)• library(psych) #necessary for most of today’s examples• library(sem) #will be used for a few examples
6. Use R
7. (See detailed tutorial at https://personality-project.org/r/r.guide.html#gettingstarted
48 / 83
Intro Conceptual Overview 2 disciplines Theory testing R Using R Basic R References
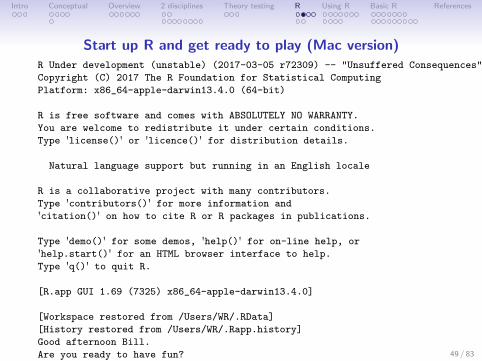
Start up R and get ready to play (Mac version)R Under development (unstable) (2017-03-05 r72309) -- "Unsuffered Consequences"
Copyright (C) 2017 The R Foundation for Statistical Computing
Platform: x86_64-apple-darwin13.4.0 (64-bit)
R is free software and comes with ABSOLUTELY NO WARRANTY.
You are welcome to redistribute it under certain conditions.
Type 'license()' or 'licence()' for distribution details.
Natural language support but running in an English locale
R is a collaborative project with many contributors.
Type 'contributors()' for more information and
'citation()' on how to cite R or R packages in publications.
Type 'demo()' for some demos, 'help()' for on-line help, or
'help.start()' for an HTML browser interface to help.
Type 'q()' to quit R.
[R.app GUI 1.69 (7325) x86_64-apple-darwin13.4.0]
[Workspace restored from /Users/WR/.RData]
[History restored from /Users/WR/.Rapp.history]
Good afternoon Bill.
Are you ready to have fun? 49 / 83
Intro Conceptual Overview 2 disciplines Theory testing R Using R Basic R References
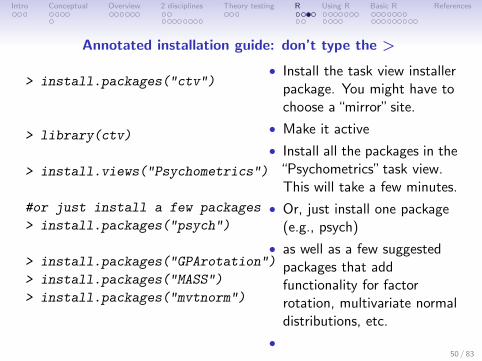
Annotated installation guide: don’t type the >
> install.packages("ctv")
> library(ctv)
> install.views("Psychometrics")
#or just install a few packages
> install.packages("psych")
> install.packages("GPArotation")
> install.packages("MASS")
> install.packages("mvtnorm")
• Install the task view installerpackage. You might have tochoose a “mirror” site.
• Make it active
• Install all the packages in the“Psychometrics” task view.This will take a few minutes.
• Or, just install one package(e.g., psych)
• as well as a few suggestedpackages that addfunctionality for factorrotation, multivariate normaldistributions, etc.
•50 / 83
Intro Conceptual Overview 2 disciplines Theory testing R Using R Basic R References
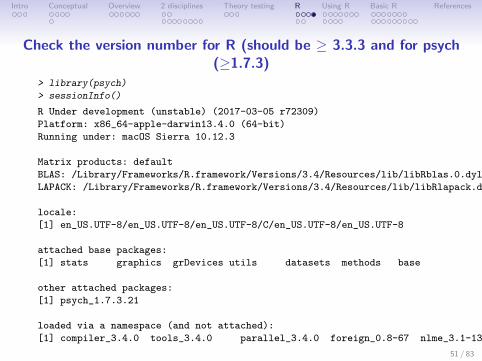
Check the version number for R (should be ≥ 3.3.3 and for psych(≥1.7.3)
> library(psych)
> sessionInfo()
R Under development (unstable) (2017-03-05 r72309)
Platform: x86_64-apple-darwin13.4.0 (64-bit)
Running under: macOS Sierra 10.12.3
Matrix products: default
BLAS: /Library/Frameworks/R.framework/Versions/3.4/Resources/lib/libRblas.0.dylib
LAPACK: /Library/Frameworks/R.framework/Versions/3.4/Resources/lib/libRlapack.dylib
locale:
[1] en_US.UTF-8/en_US.UTF-8/en_US.UTF-8/C/en_US.UTF-8/en_US.UTF-8
attached base packages:
[1] stats graphics grDevices utils datasets methods base
other attached packages:
[1] psych_1.7.3.21
loaded via a namespace (and not attached):
[1] compiler_3.4.0 tools_3.4.0 parallel_3.4.0 foreign_0.8-67 nlme_3.1-131 mnormt_1.5-4 grid_3.4.0 lattice_0.20-34
51 / 83
Intro Conceptual Overview 2 disciplines Theory testing R Using R Basic R References
R is extensible: The use of “packages”
• More than 10,327 packages are available for R (and growingdaily)
• Can search all packages that do a particular operation byusing the sos package
• install.packages("sos") #if you haven’t already• library(sos) # make it active once you have it
• findFn(”X”) #will search a web data base for allpackages/functions that have ”X”
• findFn(”principal components analysis ”) #will return 2,554matches and reports the top 400 and download 385 links to174 packages
• findFn(”Item Response Theory”) # will return 503 matcheswith 326 links in 76 packages
• findFn(”INDSCAL ”) # will return 20 matches in 5 packages.
• install.packages(”X”) will install a particular package (add it toyour R library – you need to do this just once)
• library(X) #will make the package X available to use if it hasbeen installed (and thus in your library)
52 / 83

Intro Conceptual Overview 2 disciplines Theory testing R Using R Basic R References
A small subset of very useful packages
• General use• core R• MASS• lattice (core)• lme4 (core)• psych• Zelig
• Special use• ltm• sem• lavaan• OpenMx• GPArotation• mvtnorm• > 10,327
known• + ?
• General applications• most descriptive and inferential stats• Modern Applied Statistics with S• Lattice or Trellis graphics• Linear mixed-effects models• Personality and psychometrics• General purpose toolkit
• More specialized packages• Latent Trait Model (IRT)• SEM and CFA (multiple groups)• SEM and CFA (multiple groups )• SEM and CFA (multiple groups +)• Jennrich + Browne rotations• Multivariate distributions• Thousands of more packages on CRAN• Code on webpages/journal articles
53 / 83
Intro Conceptual Overview 2 disciplines Theory testing R Using R Basic R References
Implementations
1. Base R in the Unix/Linux/Mac X11 framework
2. Base R on the Mac/PC• Mac has prompts at bottom of window
3. Graphical User Interfaces• R Commander• R studio as a convenient shell
54 / 83
Intro Conceptual Overview 2 disciplines Theory testing R Using R Basic R References
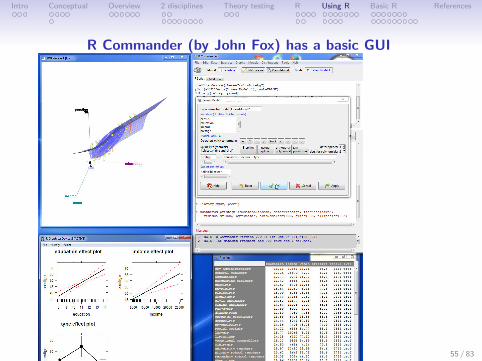
R Commander (by John Fox) has a basic GUI
55 / 83
Intro Conceptual Overview 2 disciplines Theory testing R Using R Basic R References
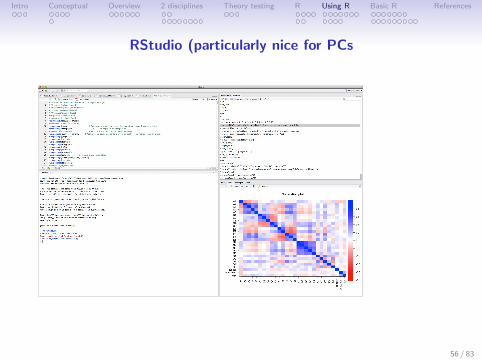
RStudio (particularly nice for PCs
56 / 83
Intro Conceptual Overview 2 disciplines Theory testing R Using R Basic R References
Using R
1. Install the relevant packages (just once!)• Either one at a time, or by using a “task view”
2. Make the packages you want to use“active”by library(packagename) e.g., library(psych)
• For each session• Can be automatized
3. Use the functions in a package• To see all functions in a package go to the index of the package
or use the objects function: e.g., objects(package:psych)• Apply a function to data• All functions require an object to act upon. Most require this
in parentheses. All functions return an object. This may besaved for later.
• function(object) #apply the function to the object, showresult
• sqrt(2)• result <- function(object) #apply the function to object, save
result• answer <- alpha(ability) #lots and lots of output is saved
57 / 83
Intro Conceptual Overview 2 disciplines Theory testing R Using R Basic R References
What makes R useful?
1. The basic philosophy of open source allows one to see thecode and modify it.
2. Object oriented meaning that all functions return objects thatcan be acted upon by other functions.
• e.g.., output of mean and sd is included in describe ordescribeBy
• Output of cor is used in fa, alpha, etc.• Can add other functions (e.g.tetrachoric to do correlations
instead of cor
3. R is vectorized, so that if it works for X, it will work for ~X
58 / 83
Intro Conceptual Overview 2 disciplines Theory testing R Using R Basic R References
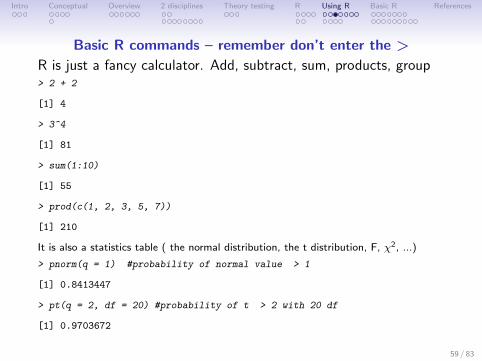
Basic R commands – remember don’t enter the >
R is just a fancy calculator. Add, subtract, sum, products, group> 2 + 2
[1] 4
> 3^4
[1] 81
> sum(1:10)
[1] 55
> prod(c(1, 2, 3, 5, 7))
[1] 210
It is also a statistics table ( the normal distribution, the t distribution, F, χ2, ...)
> pnorm(q = 1) #probability of normal value > 1
[1] 0.8413447
> pt(q = 2, df = 20) #probability of t > 2 with 20 df
[1] 0.9703672
59 / 83
Intro Conceptual Overview 2 disciplines Theory testing R Using R Basic R References
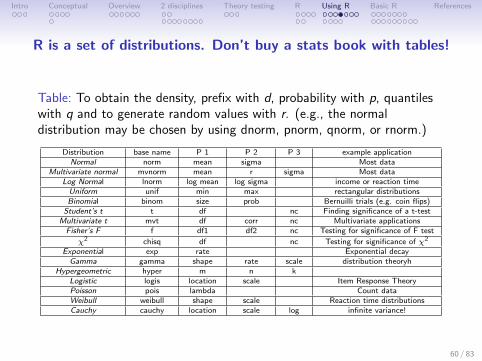
R is a set of distributions. Don’t buy a stats book with tables!
Table: To obtain the density, prefix with d, probability with p, quantileswith q and to generate random values with r. (e.g., the normaldistribution may be chosen by using dnorm, pnorm, qnorm, or rnorm.)
Distribution base name P 1 P 2 P 3 example applicationNormal norm mean sigma Most data
Multivariate normal mvnorm mean r sigma Most dataLog Normal lnorm log mean log sigma income or reaction timeUniform unif min max rectangular distributionsBinomial binom size prob Bernuilli trials (e.g. coin flips)
Student’s t t df nc Finding significance of a t-testMultivariate t mvt df corr nc Multivariate applicationsFisher’s F f df1 df2 nc Testing for significance of F test
χ2 chisq df nc Testing for significance of χ2
Exponential exp rate Exponential decayGamma gamma shape rate scale distribution theoryh
Hypergeometric hyper m n kLogistic logis location scale Item Response TheoryPoisson pois lambda Count dataWeibull weibull shape scale Reaction time distributionsCauchy cauchy location scale log infinite variance!
60 / 83
Intro Conceptual Overview 2 disciplines Theory testing R Using R Basic R References
R can draw distributions
-3 -2 -1 0 1 2 3
0.0
0.1
0.2
0.3
0.4
A normal curve
x
prob
abili
ty o
f x
curve(dnorm(x),-3,3,ylab=”probability of x”,main=”A normal curve”)61 / 83
Intro Conceptual Overview 2 disciplines Theory testing R Using R Basic R References
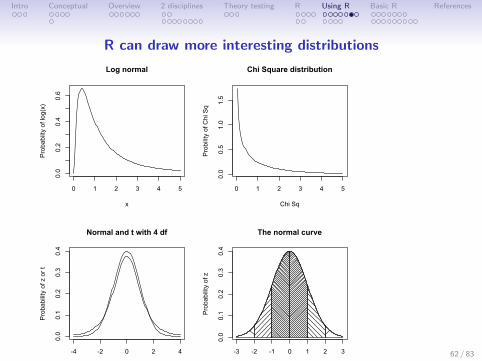
R can draw more interesting distributions
0 1 2 3 4 5
0.0
0.2
0.4
0.6
Log normal
x
Pro
babi
ity o
f log
(x)
0 1 2 3 4 5
0.0
0.5
1.0
1.5
Chi Square distribution
Chi SqP
robi
lity
of C
hi S
q
-4 -2 0 2 4
0.0
0.1
0.2
0.3
0.4
Normal and t with 4 df
z or t
Pro
babi
lity
of z
or t
-3 -2 -1 0 1 2 3
0.0
0.1
0.2
0.3
0.4
Pro
babi
lity
of z
The normal curve
62 / 83
Intro Conceptual Overview 2 disciplines Theory testing R Using R Basic R References
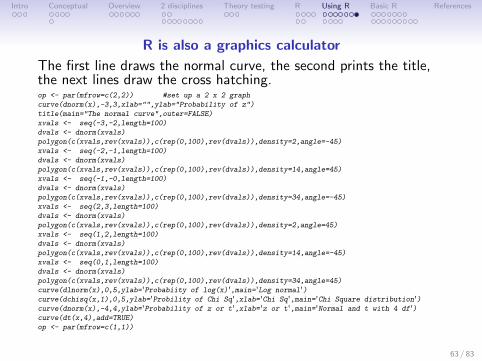
R is also a graphics calculator
The first line draws the normal curve, the second prints the title,the next lines draw the cross hatching.op <- par(mfrow=c(2,2)) #set up a 2 x 2 graph
curve(dnorm(x),-3,3,xlab="",ylab="Probability of z")
title(main="The normal curve",outer=FALSE)
xvals <- seq(-3,-2,length=100)
dvals <- dnorm(xvals)
polygon(c(xvals,rev(xvals)),c(rep(0,100),rev(dvals)),density=2,angle=-45)
xvals <- seq(-2,-1,length=100)
dvals <- dnorm(xvals)
polygon(c(xvals,rev(xvals)),c(rep(0,100),rev(dvals)),density=14,angle=45)
xvals <- seq(-1,-0,length=100)
dvals <- dnorm(xvals)
polygon(c(xvals,rev(xvals)),c(rep(0,100),rev(dvals)),density=34,angle=-45)
xvals <- seq(2,3,length=100)
dvals <- dnorm(xvals)
polygon(c(xvals,rev(xvals)),c(rep(0,100),rev(dvals)),density=2,angle=45)
xvals <- seq(1,2,length=100)
dvals <- dnorm(xvals)
polygon(c(xvals,rev(xvals)),c(rep(0,100),rev(dvals)),density=14,angle=-45)
xvals <- seq(0,1,length=100)
dvals <- dnorm(xvals)
polygon(c(xvals,rev(xvals)),c(rep(0,100),rev(dvals)),density=34,angle=45)
curve(dlnorm(x),0,5,ylab='Probabiity of log(x)',main='Log normal')curve(dchisq(x,1),0,5,ylab='Probility of Chi Sq',xlab='Chi Sq',main='Chi Square distribution')curve(dnorm(x),-4,4,ylab='Probability of z or t',xlab='z or t',main='Normal and t with 4 df')curve(dt(x,4),add=TRUE)
op <- par(mfrow=c(1,1))
63 / 83
Intro Conceptual Overview 2 disciplines Theory testing R Using R Basic R References
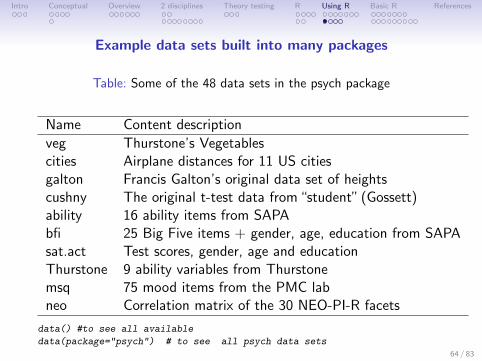
Example data sets built into many packages
Table: Some of the 48 data sets in the psych package
Name Content description
veg Thurstone’s Vegetablescities Airplane distances for 11 US citiesgalton Francis Galton’s original data set of heightscushny The original t-test data from “student” (Gossett)ability 16 ability items from SAPAbfi 25 Big Five items + gender, age, education from SAPAsat.act Test scores, gender, age and educationThurstone 9 ability variables from Thurstonemsq 75 mood items from the PMC labneo Correlation matrix of the 30 NEO-PI-R facets
data() #to see all available
data(package="psych") # to see all psych data sets64 / 83

Intro Conceptual Overview 2 disciplines Theory testing R Using R Basic R References
A simple scatter plot using plot shows Fisher’s Iris data set
4.5 5.0 5.5 6.0 6.5 7.0 7.5 8.0
2.0
2.5
3.0
3.5
4.0
Fisher Iris data
Sepal.Length
Sepal.Width
plot(iris[1:2],xlab="Sepal.Length",ylab="Sepal.Width"
,main="Fisher Iris data")
65 / 83
Intro Conceptual Overview 2 disciplines Theory testing R Using R Basic R References
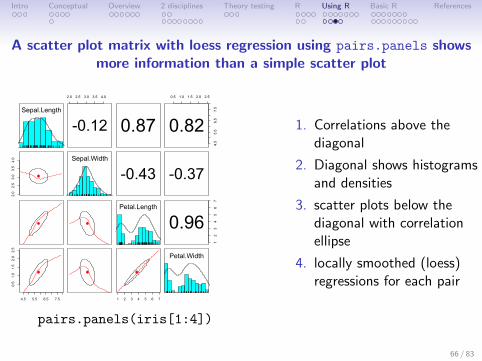
A scatter plot matrix with loess regression using pairs.panels showsmore information than a simple scatter plot
Sepal.Length
2.0 2.5 3.0 3.5 4.0
-0.12 0.87
0.5 1.0 1.5 2.0 2.5
4.5
5.5
6.5
7.5
0.82
2.0
2.5
3.0
3.5
4.0 Sepal.Width
-0.43 -0.37
Petal.Length1
23
45
67
0.96
4.5 5.5 6.5 7.5
0.5
1.0
1.5
2.0
2.5
1 2 3 4 5 6 7
Petal.Width
1. Correlations above thediagonal
2. Diagonal shows histogramsand densities
3. scatter plots below thediagonal with correlationellipse
4. locally smoothed (loess)regressions for each pair
pairs.panels(iris[1:4])
66 / 83
Intro Conceptual Overview 2 disciplines Theory testing R Using R Basic R References
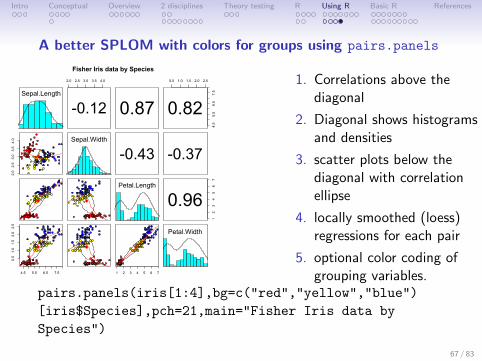
A better SPLOM with colors for groups using pairs.panels
Sepal.Length
2.0 2.5 3.0 3.5 4.0
-0.12 0.87
0.5 1.0 1.5 2.0 2.5
4.5
5.5
6.5
7.5
0.82
2.02.53.03.54.0 Sepal.Width
-0.43 -0.37
Petal.Length
12
34
56
7
0.96
4.5 5.5 6.5 7.5
0.51.01.52.02.5
1 2 3 4 5 6 7
Petal.Width
Fisher Iris data by Species
1. Correlations above thediagonal
2. Diagonal shows histogramsand densities
3. scatter plots below thediagonal with correlationellipse
4. locally smoothed (loess)regressions for each pair
5. optional color coding ofgrouping variables.
pairs.panels(iris[1:4],bg=c("red","yellow","blue")
[iris$Species],pch=21,main="Fisher Iris data by
Species")
67 / 83
Intro Conceptual Overview 2 disciplines Theory testing R Using R Basic R References
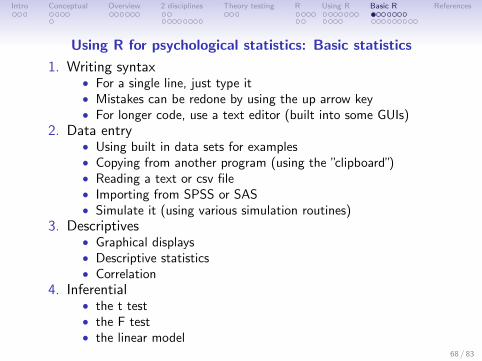
Using R for psychological statistics: Basic statistics
1. Writing syntax• For a single line, just type it• Mistakes can be redone by using the up arrow key• For longer code, use a text editor (built into some GUIs)
2. Data entry• Using built in data sets for examples• Copying from another program (using the ”clipboard”)• Reading a text or csv file• Importing from SPSS or SAS• Simulate it (using various simulation routines)
3. Descriptives• Graphical displays• Descriptive statistics• Correlation
4. Inferential• the t test• the F test• the linear model
68 / 83
Intro Conceptual Overview 2 disciplines Theory testing R Using R Basic R References
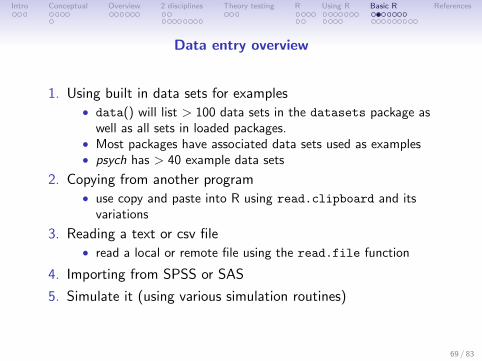
Data entry overview
1. Using built in data sets for examples• data() will list > 100 data sets in the datasets package as
well as all sets in loaded packages.• Most packages have associated data sets used as examples• psych has > 40 example data sets
2. Copying from another program• use copy and paste into R using read.clipboard and its
variations
3. Reading a text or csv file• read a local or remote file using the read.file function
4. Importing from SPSS or SAS
5. Simulate it (using various simulation routines)
69 / 83

Intro Conceptual Overview 2 disciplines Theory testing R Using R Basic R References
Examples of built in data sets from the psych package
> data(package="psych")
Bechtoldt Seven data sets showing a bifactor solution.
Dwyer 8 cognitive variables used by Dwyer for an example.
Reise Seven data sets showing a bifactor solution.
all.income (income) US family income from US census 2008
bfi 25 Personality items representing 5 factors
blot Bond's Logical Operations Test - BLOT
burt 11 emotional variables from Burt (1915)
cities Distances between 11 US cities
epi.bfi 13 personality scales from the Eysenck Personality Inventory
and Big 5 inventory
affect Two data sets of affect and arousal scores as a function of
personality and movie conditions.
galton Galton's Mid parent child height data
income US family income from US census 2008
iqitems 16 multiple choice IQ items
msq 75 mood items from the Motivational State Questionnaire
for N = 3896
neo NEO correlation matrix from the NEO_PI_R manual
sat.act 3 Measures of ability: SATV, SATQ, ACT
Thurstone The classic Thurstone 9 variable problem
veg (vegetables) Paired comparison of preferences for 9 vegetables
70 / 83
Intro Conceptual Overview 2 disciplines Theory testing R Using R Basic R References
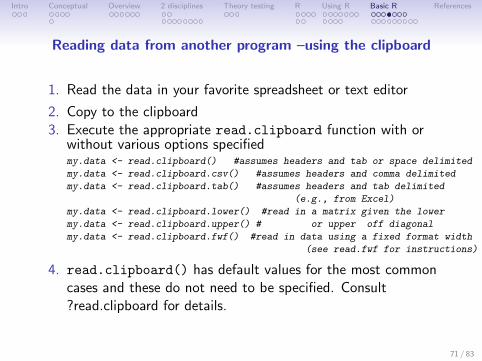
Reading data from another program –using the clipboard
1. Read the data in your favorite spreadsheet or text editor
2. Copy to the clipboard3. Execute the appropriate read.clipboard function with or
without various options specifiedmy.data <- read.clipboard() #assumes headers and tab or space delimited
my.data <- read.clipboard.csv() #assumes headers and comma delimited
my.data <- read.clipboard.tab() #assumes headers and tab delimited
(e.g., from Excel)
my.data <- read.clipboard.lower() #read in a matrix given the lower
my.data <- read.clipboard.upper() # or upper off diagonal
my.data <- read.clipboard.fwf() #read in data using a fixed format width
(see read.fwf for instructions)
4. read.clipboard() has default values for the most commoncases and these do not need to be specified. Consult?read.clipboard for details.
71 / 83
Intro Conceptual Overview 2 disciplines Theory testing R Using R Basic R References
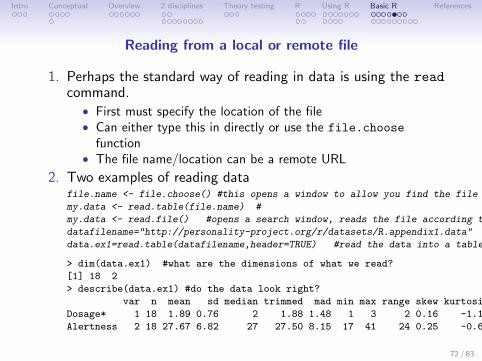
Reading from a local or remote file
1. Perhaps the standard way of reading in data is using the readcommand.
• First must specify the location of the file• Can either type this in directly or use the file.choose
function• The file name/location can be a remote URL
2. Two examples of reading datafile.name <- file.choose() #this opens a window to allow you find the file
my.data <- read.table(file.name) #
my.data <- read.file() #opens a search window, reads the file according to the suffix
datafilename="http://personality-project.org/r/datasets/R.appendix1.data"
data.ex1=read.table(datafilename,header=TRUE) #read the data into a table
> dim(data.ex1) #what are the dimensions of what we read?
[1] 18 2
> describe(data.ex1) #do the data look right?
var n mean sd median trimmed mad min max range skew kurtosis se
Dosage* 1 18 1.89 0.76 2 1.88 1.48 1 3 2 0.16 -1.12 0.18
Alertness 2 18 27.67 6.82 27 27.50 8.15 17 41 24 0.25 -0.68 1.61
72 / 83
Intro Conceptual Overview 2 disciplines Theory testing R Using R Basic R References
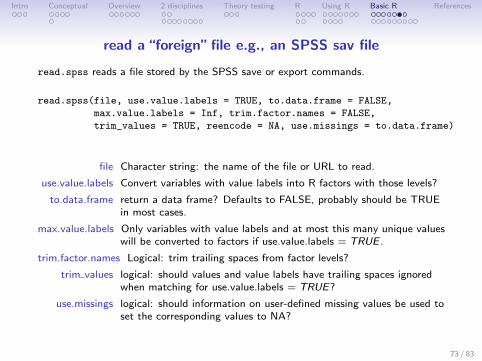
read a “foreign” file e.g., an SPSS sav file
read.spss reads a file stored by the SPSS save or export commands.
read.spss(file, use.value.labels = TRUE, to.data.frame = FALSE,
max.value.labels = Inf, trim.factor.names = FALSE,
trim_values = TRUE, reencode = NA, use.missings = to.data.frame)
file Character string: the name of the file or URL to read.
use.value.labels Convert variables with value labels into R factors with those levels?
to.data.frame return a data frame? Defaults to FALSE, probably should be TRUEin most cases.
max.value.labels Only variables with value labels and at most this many unique valueswill be converted to factors if use.value.labels = TRUE .
trim.factor.names Logical: trim trailing spaces from factor levels?
trim values logical: should values and value labels have trailing spaces ignoredwhen matching for use.value.labels = TRUE?
use.missings logical: should information on user-defined missing values be used toset the corresponding values to NA?
73 / 83
Intro Conceptual Overview 2 disciplines Theory testing R Using R Basic R References
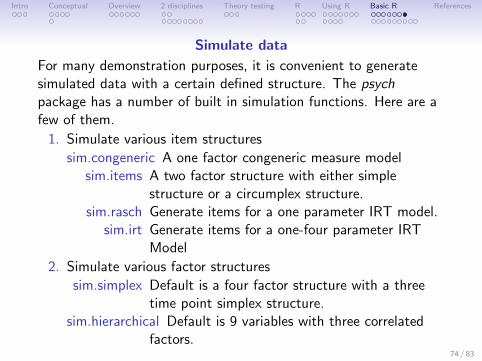
Simulate data
For many demonstration purposes, it is convenient to generatesimulated data with a certain defined structure. The psychpackage has a number of built in simulation functions. Here are afew of them.
1. Simulate various item structures
sim.congeneric A one factor congeneric measure modelsim.items A two factor structure with either simple
structure or a circumplex structure.sim.rasch Generate items for a one parameter IRT model.
sim.irt Generate items for a one-four parameter IRTModel
2. Simulate various factor structures
sim.simplex Default is a four factor structure with a threetime point simplex structure.
sim.hierarchical Default is 9 variables with three correlatedfactors.
74 / 83
Intro Conceptual Overview 2 disciplines Theory testing R Using R Basic R References
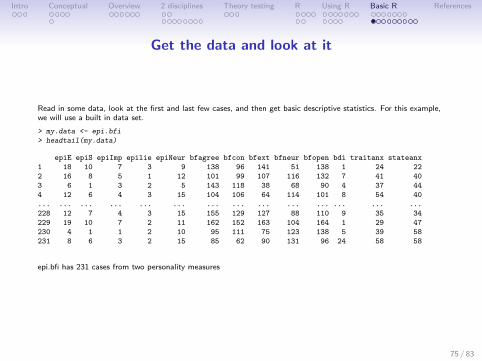
Get the data and look at it
Read in some data, look at the first and last few cases, and then get basic descriptive statistics. For this example,we will use a built in data set.
> my.data <- epi.bfi
> headtail(my.data)
epiE epiS epiImp epilie epiNeur bfagree bfcon bfext bfneur bfopen bdi traitanx stateanx
1 18 10 7 3 9 138 96 141 51 138 1 24 22
2 16 8 5 1 12 101 99 107 116 132 7 41 40
3 6 1 3 2 5 143 118 38 68 90 4 37 44
4 12 6 4 3 15 104 106 64 114 101 8 54 40
... ... ... ... ... ... ... ... ... ... ... ... ... ...
228 12 7 4 3 15 155 129 127 88 110 9 35 34
229 19 10 7 2 11 162 152 163 104 164 1 29 47
230 4 1 1 2 10 95 111 75 123 138 5 39 58
231 8 6 3 2 15 85 62 90 131 96 24 58 58
epi.bfi has 231 cases from two personality measures
75 / 83
Intro Conceptual Overview 2 disciplines Theory testing R Using R Basic R References
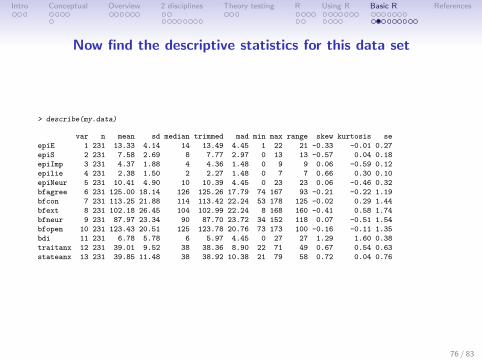
Now find the descriptive statistics for this data set
> describe(my.data)
var n mean sd median trimmed mad min max range skew kurtosis se
epiE 1 231 13.33 4.14 14 13.49 4.45 1 22 21 -0.33 -0.01 0.27
epiS 2 231 7.58 2.69 8 7.77 2.97 0 13 13 -0.57 0.04 0.18
epiImp 3 231 4.37 1.88 4 4.36 1.48 0 9 9 0.06 -0.59 0.12
epilie 4 231 2.38 1.50 2 2.27 1.48 0 7 7 0.66 0.30 0.10
epiNeur 5 231 10.41 4.90 10 10.39 4.45 0 23 23 0.06 -0.46 0.32
bfagree 6 231 125.00 18.14 126 125.26 17.79 74 167 93 -0.21 -0.22 1.19
bfcon 7 231 113.25 21.88 114 113.42 22.24 53 178 125 -0.02 0.29 1.44
bfext 8 231 102.18 26.45 104 102.99 22.24 8 168 160 -0.41 0.58 1.74
bfneur 9 231 87.97 23.34 90 87.70 23.72 34 152 118 0.07 -0.51 1.54
bfopen 10 231 123.43 20.51 125 123.78 20.76 73 173 100 -0.16 -0.11 1.35
bdi 11 231 6.78 5.78 6 5.97 4.45 0 27 27 1.29 1.60 0.38
traitanx 12 231 39.01 9.52 38 38.36 8.90 22 71 49 0.67 0.54 0.63
stateanx 13 231 39.85 11.48 38 38.92 10.38 21 79 58 0.72 0.04 0.76
76 / 83

Intro Conceptual Overview 2 disciplines Theory testing R Using R Basic R References
Boxplots are a convenient descriptive device
Show the Tukey “boxplot” for the Eysenck Personality Inventoryboxplot(my.data[1:5]) #just the first 5 variables
epiE epiS epiImp epilie epiNeur
05
1015
20
Boxplots of EPI scales
77 / 83
Intro Conceptual Overview 2 disciplines Theory testing R Using R Basic R References
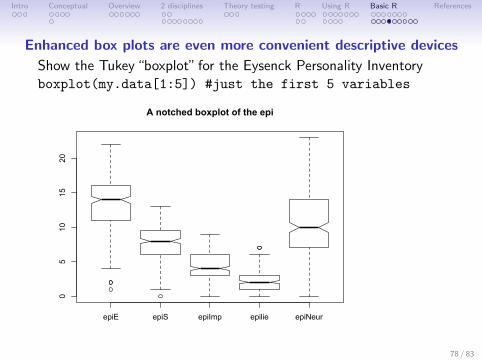
Enhanced box plots are even more convenient descriptive devices
Show the Tukey “boxplot” for the Eysenck Personality Inventoryboxplot(my.data[1:5]) #just the first 5 variables
epiE epiS epiImp epilie epiNeur
05
1015
20
A notched boxplot of the epi
78 / 83
Intro Conceptual Overview 2 disciplines Theory testing R Using R Basic R References
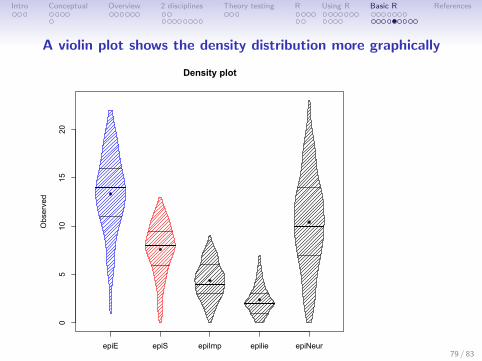
A violin plot shows the density distribution more graphically
Density plot
Observed
epiE epiS epiImp epilie epiNeur
05
1015
20
79 / 83
Intro Conceptual Overview 2 disciplines Theory testing R Using R Basic R References
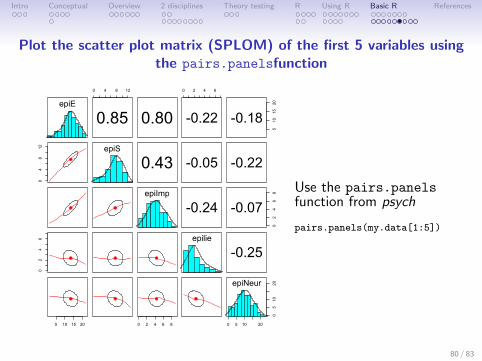
Plot the scatter plot matrix (SPLOM) of the first 5 variables usingthe pairs.panelsfunction
epiE
0 4 8 12
0.85 0.80
0 2 4 6
-0.22
510
1520
-0.18
04
812 epiS
0.43 -0.05 -0.22
epiImp
-0.24
02
46
8
-0.07
02
46 epilie
-0.25
5 10 15 20 0 2 4 6 8 0 5 10 20
05
1020epiNeur
Use the pairs.panelsfunction from psych
pairs.panels(my.data[1:5])
80 / 83
Intro Conceptual Overview 2 disciplines Theory testing R Using R Basic R References
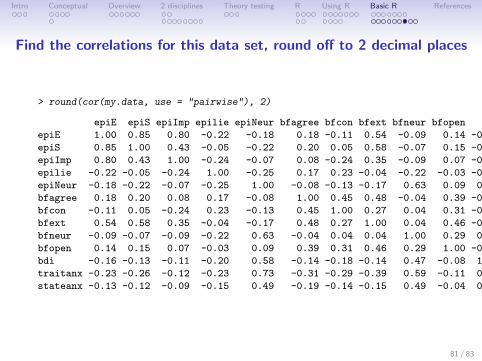
Find the correlations for this data set, round off to 2 decimal places
> round(cor(my.data, use = "pairwise"), 2)
epiE epiS epiImp epilie epiNeur bfagree bfcon bfext bfneur bfopen bdi traitanx stateanx
epiE 1.00 0.85 0.80 -0.22 -0.18 0.18 -0.11 0.54 -0.09 0.14 -0.16 -0.23 -0.13
epiS 0.85 1.00 0.43 -0.05 -0.22 0.20 0.05 0.58 -0.07 0.15 -0.13 -0.26 -0.12
epiImp 0.80 0.43 1.00 -0.24 -0.07 0.08 -0.24 0.35 -0.09 0.07 -0.11 -0.12 -0.09
epilie -0.22 -0.05 -0.24 1.00 -0.25 0.17 0.23 -0.04 -0.22 -0.03 -0.20 -0.23 -0.15
epiNeur -0.18 -0.22 -0.07 -0.25 1.00 -0.08 -0.13 -0.17 0.63 0.09 0.58 0.73 0.49
bfagree 0.18 0.20 0.08 0.17 -0.08 1.00 0.45 0.48 -0.04 0.39 -0.14 -0.31 -0.19
bfcon -0.11 0.05 -0.24 0.23 -0.13 0.45 1.00 0.27 0.04 0.31 -0.18 -0.29 -0.14
bfext 0.54 0.58 0.35 -0.04 -0.17 0.48 0.27 1.00 0.04 0.46 -0.14 -0.39 -0.15
bfneur -0.09 -0.07 -0.09 -0.22 0.63 -0.04 0.04 0.04 1.00 0.29 0.47 0.59 0.49
bfopen 0.14 0.15 0.07 -0.03 0.09 0.39 0.31 0.46 0.29 1.00 -0.08 -0.11 -0.04
bdi -0.16 -0.13 -0.11 -0.20 0.58 -0.14 -0.18 -0.14 0.47 -0.08 1.00 0.65 0.61
traitanx -0.23 -0.26 -0.12 -0.23 0.73 -0.31 -0.29 -0.39 0.59 -0.11 0.65 1.00 0.57
stateanx -0.13 -0.12 -0.09 -0.15 0.49 -0.19 -0.14 -0.15 0.49 -0.04 0.61 0.57 1.00
81 / 83
Intro Conceptual Overview 2 disciplines Theory testing R Using R Basic R References
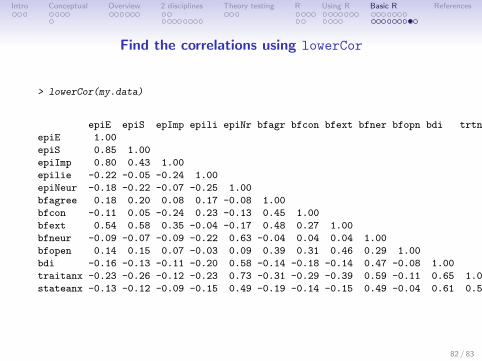
Find the correlations using lowerCor
> lowerCor(my.data)
epiE epiS epImp epili epiNr bfagr bfcon bfext bfner bfopn bdi trtnx sttnx
epiE 1.00
epiS 0.85 1.00
epiImp 0.80 0.43 1.00
epilie -0.22 -0.05 -0.24 1.00
epiNeur -0.18 -0.22 -0.07 -0.25 1.00
bfagree 0.18 0.20 0.08 0.17 -0.08 1.00
bfcon -0.11 0.05 -0.24 0.23 -0.13 0.45 1.00
bfext 0.54 0.58 0.35 -0.04 -0.17 0.48 0.27 1.00
bfneur -0.09 -0.07 -0.09 -0.22 0.63 -0.04 0.04 0.04 1.00
bfopen 0.14 0.15 0.07 -0.03 0.09 0.39 0.31 0.46 0.29 1.00
bdi -0.16 -0.13 -0.11 -0.20 0.58 -0.14 -0.18 -0.14 0.47 -0.08 1.00
traitanx -0.23 -0.26 -0.12 -0.23 0.73 -0.31 -0.29 -0.39 0.59 -0.11 0.65 1.00
stateanx -0.13 -0.12 -0.09 -0.15 0.49 -0.19 -0.14 -0.15 0.49 -0.04 0.61 0.57 1.00
82 / 83
Intro Conceptual Overview 2 disciplines Theory testing R Using R Basic R References
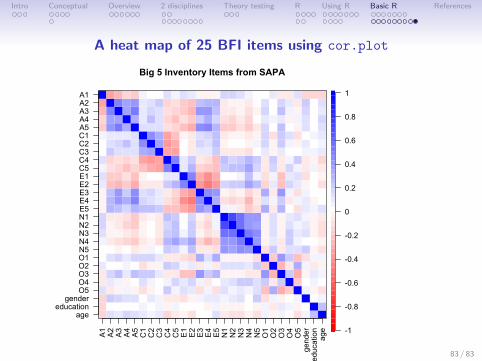
A heat map of 25 BFI items using cor.plot
Big 5 Inventory Items from SAPA
ageeducationgender
O5O4O3O2O1N5N4N3N2N1E5E4E3E2E1C5C4C3C2C1A5A4A3A2A1
A1A2A3A4A5C1C2C3C4C5E1E2E3E4E5N1N2N3N4N5
O1
O2
O3
O4
O5
gender
education
age -1
-0.8
-0.6
-0.4
-0.2
0
0.2
0.4
0.6
0.8
1
83 / 83
Intro Conceptual Overview 2 disciplines Theory testing R Using R Basic R References
Cronbach, L. J. (1957). The two disciplines of scientificpsychology. American Psychologist, 12, 671–684.
Cronbach, L. J. (1975). Beyond the two disciplines of scientificpsychology. American Psychologist, 30, 116–127.
Eysenck, H. (1983). Is there a paradigm in personality research?Journal of Research in Personality, 17(4), 369 – 397.
Eysenck, H. J. (1966). Personality and experimental psychology.Bulletin of the British Psychological Society, 19, 1–28.
Eysenck, H. J. (1976). The Measurement of personality.Lancaster: MTP.
Eysenck, H. J. (1985). The place of theory in a world of facts. InAnnals of theoretical psychology, volume 3 (pp. 17–72). PlenumPress.
Eysenck, H. J. (1987a). The growth of unified scientificpsychology: Ordeal by quackery. In A. W. Staats & L. P. Mos(Eds.), Annals of Theoretical Psychology, volume 5 chapter 3,(pp. 91–113). Plenum Press.
83 / 83
Intro Conceptual Overview 2 disciplines Theory testing R Using R Basic R References
Eysenck, H. J. (1987b). ”there is nothing more practical than agood theory” (kurt lewin) –true or false? In W. J. Baker, M. E.Hyland, H. V. Rappard, & A. W. Staats (Eds.), Current Issues inTheoretical Psychology, volume 40 (pp. 49–63). North Holland.
Eysenck, H. J. (1988). The growth of a unified scientificpsychology. In A. Staats & L. Mos (Eds.), Annals of TheoreticalPsychology, volume 5 of Annals of Theoretical Psychology (pp.91–113). Springer US.
Eysenck, H. J. (1997). Personality and experimental psychology:The unification of psychology and the possibility of a paradigm.Journal of Personality and Social Psychology, 73(6), 1224–1237.
Eysenck, H. J. & Eysenck, M. W. (1985). Personality andIndividual Differences: A natural science approach. New York:Plenum.
Fisher, R. A. (1925). Statistical methods for research workers.Edinburgh: Oliver and Boyd.
83 / 83
Intro Conceptual Overview 2 disciplines Theory testing R Using R Basic R References
Galton, F. (1886). Regression towards mediocrity in hereditarystature. Journal of the Anthropological Institute of Great Britainand Ireland, 15, 246–263.
Gray, J. A. (1981). A critique of Eysenck’s theory of personality. InH. J. Eysenck (Ed.), A Model for Personality (pp. 246–277).Berlin: Springer.
Kimble, G. A. (1984). Psychology’s two cultures. AmericanPsychologist, 39(8), 833 – 839.
Lakatos, I. (1968). Criticism and the methodology of scientificresearch programmes. Proceedings of the Aristotelian Society,69, pp. 149–186.
Loehlin, J. C. (2004). Latent variable models: an introduction tofactor, path, and structural equation analysis (4th ed.).Mahwah, N.J.: L. Erlbaum Associates.
Nunnally, J. C. & Bernstein, I. H. (1994). Psychometric theory(3rd ed.). New York,: McGraw-Hill.
83 / 83
Intro Conceptual Overview 2 disciplines Theory testing R Using R Basic R References
Pearson, K. P. (1896). Mathematical contributions to the theory ofevolution. iii. regression, heredity, and panmixia. PhilisopicalTransactions of the Royal Society of London. Series A, 187,254–318.
Revelle, W. (in prep). An introduction to psychometric theory withapplications in R. Springer.
Revelle, W. & Oehlberg, K. (2008). Integrating experimental andobservational personality research – the contributions of HansEysenck. Journal of Personality, 76(6), 1387–1414.
Snow, C. P. (1959). ”the rede lecture, 1959”. In The Two Cultures:and a Second Look (pp. 1–21). Cambridge University Press.
Spearman, C. (1904). The proof and measurement of associationbetween two things. The American Journal of Psychology,15(1), 72–101.
Student (1908). The probable error of a mean. Biometrika, 6(1),1–25.
83 / 83
Intro Conceptual Overview 2 disciplines Theory testing R Using R Basic R References
Underwood, B. J. (1975). Individual differences as a crucible intheory construction. American Psychologist, 30, 128–134.
Vale, J. & Vale, C. (1969). Individual differences and general lawsin psychology: a reconciliation. American Psychologist, 24(12),1093–1108.
Wundt, W. (1904). Principles of Physiological Psychology(Translated from the Fifth German Edition (1902) ed.). London:Swan Sonnenschein.
83 / 83