a multi state factor analytic and psychometric meta ... · a further outcome was reflected in the...
TRANSCRIPT

© Journal of Agricultural Education
Volume 53, Number 2, pp 139–152
DOI: 10.5032/jae.2012.02139
139
A Multi–State Factor–Analytic and Psychometric
Meta–Analysis of Agricultural Mechanics Laboratory
Management Competencies
Billy R. McKim, Assistant Professor
Texas A&M University
P. Ryan Saucier, Assistant Professor
Texas State University – San Marcos
For more than 20 years, the 50 agricultural mechanics laboratory management competencies identified by Johnson and Schumacher in 1989 have served as the basis for numerous needs assessments of secondary agriculture teachers. This study reevaluated Johnson and Schumacher’s instrument, as modified by Saucier, Schumacher, Funkenbusch, Terry, and Johnson (2008), to reduce the number of competencies and update the constructs of agricultural mechanics laboratory management competencies through factor–analytic and psychometric analyses. Five–hundred and three in–service secondary agriculture teachers from six states, surveyed between the spring of 2008 and the spring of 2010, served as the population for this study. As a result, the 70 agricultural mechanics laboratory management competencies included in the instrument modified by Saucier et al. (2008) were reduced to 33 competencies, in eight constructs. A further outcome was reflected in the psychometric evaluation of the eight constructs, which resulted in acceptable internal consistency reliabilities that ranged from .82 to .96. Multi–state benchmarks for agricultural mechanics laboratory management abilities of secondary agriculture teachers were also proposed. The results further indicated that the revised constructs were appropriate to assess agricultural mechanics laboratory management competencies across Huberman’s (1989) five teacher career stages. Keywords: factor analysis; psychometrics; meta–analysis; agricultural mechanics; laboratory management
Introduction
Laboratories are essential learning environments for quality secondary agriculture programs (Baker, Thoron, Myers, & Cody, 2008; Thoron & Myers, 2010). A review of literature identified that much of the instruction within the secondary agricultural mechanics curriculum takes place in a laboratory setting (Johnson & Schumacher, 1989; Saucier & McKim, 2011; Saucier, Terry, & Schumacher, 2009)—in some states, nearly 60% of the curriculum taught in agriculture courses included agricultural mechanics competencies (McKim & Saucier, 2011). Furthermore, Saucier et al. (2009) found that Missouri agricultural educators spent almost 10 hours per week supervising students in an agricultural mechanics laboratory. With the frequent use of
laboratories by agricultural educators, the need for safe and effective laboratory instruction seems apparent.
For safe and effective laboratory instruction to take place, agricultural educators must be competent and knowledgeable in the area of laboratory management (Saucier et al., 2009). Hubert, Ullrich, Lindner, and Murphy (2003) stated, “If skill development is the focus of laboratory instruction, then thorough attention to all its components, including safety instruction, is essential” (p. 3). Fletcher and Johnson (1990) found that agricultural mechanics students are exposed to equipment, materials, tools, and supplies that are potentially hazardous to their health and could cause injury or death. Additionally, Phipps, Osborne, Dyer, and Ball (2008) noted that the agriculture teacher is responsible for identifying safety hazards,

McKim & Saucier A Multi–State Factor…
Journal of Agricultural Education 140 Volume 53, Number 2, 2012
providing daily safety instruction, and maintaining safe working conditions for students in an agricultural mechanics laboratory.
Considering the amount of instructional time spent in agricultural mechanics laboratories across the U.S., it is critical that a needs assessment be conducted to determine the agricultural mechanics laboratory management needs of secondary agriculture teachers. To do so, a valid and reliable data collection instrument must be used to accurately gauge the agricultural mechanics laboratory management abilities of secondary agriculture teachers.
In 1989, Johnson and Schumacher identified 50 agricultural mechanics laboratory management competencies to assess the agricultural mechanics laboratory management abilities of secondary agriculture teachers. In the more than 20 years since Johnson and Schumacher identified those competencies, numerous studies (Johnson, Schumacher, & Stewart, 1990; McKim & Saucier, 2011; Saucier & McKim, 2011; Saucier & McKim, 2010; Saucier, Schumacher, Funkenbusch, Terry, & Johnson, 2008; Saucier et al., 2009; Schlautman & Shilletto, 1992; Swan, 1992) have been conducted using some iteration of the instrument. In 2008, Saucier et al. modified Johnson and Schumacher’s instrument to split multiple–component—double–barreled and triple–barreled—competencies into single–component competencies. Thus, the original 50 competencies were expanded to 70 competencies.
Theoretical Framework
Bandura’s theory of self–efficacy (1997) was used to guide this study. According to Bandura, self–efficacy is defined as the “beliefs in one’s capabilities to organize and execute the course of action required to produce given attainments” (p. 3). Additionally, self–efficacy influences a person’s choices, actions, the amount of effort they give, how long they persevere when faced with obstacles, their resilience, their thought patterns and emotional reactions, and the level of achievement they ultimately attain (Bandura, 1986).
In 2008, Knobloch found that the predetermined beliefs of teachers often influence how they connect academic content in the classroom to real–life applications in the
laboratory. According to a review of literature, these beliefs are developed in part to personal beliefs about the curriculum or content (Borko & Putnam, 1996; Moseley, Reinke, & Bookout, 2002; Pajares, 1992), availability of time, availability instructional resources, level of preparation regarding the content (Thompson & Balschweid, 1999), comfort level with the content, (Knobloch & Ball, 2003), perceived value of the content (Lawrenz, 1985), past experiences with the content area (Calderhead, 1996; Thompson & Balschweid, 1999), teaching environment (Knobloch, 2001), and motivation (Bandura, 1997; Tschannen–Moran, Woolfolk–Hoy, & Hoy, 1998). A teacher’s development and performance can also influenced by the interaction of these personal and environmental factors and the situations in which they teach (Knobloch, 2001).
Psychometric theory as described by Nunnally (1967) served as a secondary framework and guided the analyses of this study. Measuring secondary agriculture teachers’ perceived level of efficacy to perform agricultural mechanics laboratory management competencies requires the measurement of psychological attributes, in the case of this study, self–efficacy. Psychometric “…measurement consists of rules for assigning numbers to objects to represent quantities of attributes. The term ‘rules’ indicates that procedures for assigning numbers must be explicitly formulated…” (Nunnally, 1967, p. 2). In this study, a numerical measure was attained by asking subjects to rate the importance of a series of agricultural mechanics laboratory management competencies and their self–perceived ability to perform those competencies. Measures of several unitary attributes (competencies) are then combined to form an overall objective appraisal or construct (Nunnally, 1967).
Purpose and Research Objectives
Numerous studies regarding agricultural mechanics needs assessment (McKim & Saucier, 2011; Saucier & McKim, 2011; Saucier & McKim, 2010; Saucier et al., 2008; Saucier et al., 2009; Schlautman & Shilletto, 1992; Swan, 1992) have been conducted using some iteration of the instrument developed by Johnson and Schumacher (1989). Those studies have

McKim & Saucier A Multi–State Factor…
Journal of Agricultural Education 141 Volume 53, Number 2, 2012
provided guidance for the profession and for the advancement of agricultural mechanics in secondary and post–secondary settings.
Since 1989, Johnson and Schumacher’s instrument has been modified and revised by researchers for various reasons, e.g. double– and triple–barreled questions, etc. By expanding the original 50 competencies to 70, subjects were asked to answer no less than 140 questions when considering, for each competency, subjects were asked to assess both the importance of the competency and their ability to perform it. The length of a questionnaire has been noted to have an effect on item response rates, accuracy of data collected, and individuals’ willingness to participate, in both mailed (Dillman, Sinclair, & Clark, 1993) and web–based (Galesic & Bosnjak, 2009) surveys. Thus, reducing the number of items, while retaining as much of the original information as possible (Field, 2009), would likely increase the willingness of individuals to participate in the survey, increase item response rates, and the accuracy of data collected (Dillman et al., 1993; Galesic & Bosnjak)—a task often accomplished through factor–analytic and psychometric analyses (Field, 2009). A review of the literature did not yield an obvious factor–analytic or psychometric analysis of Johnson and Schumacher’s original competencies or the expanded version (Saucier et al., 2008), in the more than 20 years since the original instrument was developed. Given the major revisions and expansions to the instrument and the extended amount of time elapsed since the previous assessment, a reassessment of Johnson and Schumacher’s instrument, as revised, was warranted.
Moreover, a validation and reassessment of the reliability of a data collection instrument to be used to accurately gauge the agricultural mechanics laboratory management abilities of secondary agriculture teachers addresses challenges identified in the National Research Agenda: American Association for Agricultural Education’s Research Priority Areas for 2011 – 2015 (Doerfert, 2011), including assessing the efficiency and effectiveness of agricultural education programs at all levels. The outcome of this study will provide a more succinct and accurate measure of secondary agriculture teachers’ professional development needs as related to agricultural mechanics laboratory management.
Therefore, the purpose of this study was to reevaluate the instrument developed by Johnson and Schumacher (1989), as modified by Saucier et al. (2008), and propose multi–state benchmarks for in–service secondary agriculture teachers. This study was guided by three research objectives:
1. Assess the factor–analytic and psychometric
properties of the agricultural mechanics laboratory management instrument, based on the perceptions of secondary agriculture teachers regarding the importance of agricultural mechanics laboratory management competencies.
2. Describe the self–perceived agricultural mechanics laboratory management abilities of secondary agriculture teachers, to propose multi–state benchmarks for agricultural mechanics laboratory management competencies.
3. Using the construct outcomes of the factor–analytic and psychometric analyses included in research objective one, determine if the self–perceived agricultural mechanics laboratory management abilities of secondary agriculture teachers differ by teacher career stage.
Method and Results
Given the number of studies that have been
conducted using some iteration of Johnson and Schumacher’s instrument (1989), including studies of preservice and in–service secondary agriculture teachers, a meta–analytical approach was used for this study. “Meta–analysis is a form of secondary analysis of preexisting data that aims to summarize and compare results from different studies (Newton & Rudestam, 1999, p. 281). Furthermore, meta–analyses “serve to combine results from multiple studies and, consequently, allow us to diminish our reliance on statistical tests from individual studies” (p. 281). Therefore, a form of meta–analysis was conducted by including the results of studies conducted across six states within a two year period.
Conflicting findings existed in the literature regarding the effect of developmental stages of teachers on teacher efficacy (Burris, McLaughlin, McCulloch, Brashears, & Fraze, 2010; Layfield & Dobbins, 2002). Therefore,

McKim & Saucier A Multi–State Factor…
Journal of Agricultural Education 142 Volume 53, Number 2, 2012
teacher career stage was considered to be a variable of interest. Thus, Huberman’s (1989) Teacher Career Cycle Model provided guidance in the analysis of the data for this study. Within Huberman’s model, teacher career stage is divided into five phases: Career entry–discovery and survival (1 to 3 years), stabilization (4 to 6 years), experimentation/diversification (7 to 18 years), serenity (19 to 30 years), and disengagement (31 years and beyond). Instrumentation
The instrument developed by Johnson and Schumacher (1989) included 50 competencies developed with input from a national panel of agricultural mechanics education experts, through a Delphi technique. The 50 item instrument was again used by Johnson (1989) to assess secondary agriculture teachers’ perceptions of importance of agricultural mechanics laboratory management competencies. As part of his study, Johnson conducted a principal component analysis with a varimax rotation to assess the statistical validity of his instrument, which yielded a five factor solution capable of explaining 46% of the variance. Johnson reported reliability estimates (Cronbach’s α) that ranged from .63 to .88. Johnson and Schumacher’s instrument was later modified by Johnson et al. (1990) to include a double–matrix format to assess the perceived importance of each competency and the perceived ability of the individual to perform each competency. The instrument was again modified by Saucier et al. (2008) who expanded the original 50 competencies to 70 competencies, as previously noted.
Data for this study were collected using the instrument developed by Johnson and Schumacher (1989), as modified to include 70 competencies by Saucier et al. (2008). Modifications to the design and format of the data collection instrument were guided by Dillman’s (2007) suggestions. In the two–section data collection instrument, subjects were asked to respond to 70 statements representing agricultural mechanics laboratory management competencies, presented in a double–matrix
configuration. The 5–point summated rating scale in a double–matrix configuration allowed subjects to respond to each statement twice; once rating the perceived importance of each competency (1 = No Importance, 2 = Below Average Importance, 3 = Average Importance, 4 = Above Average Importance, 5 = Utmost Importance), and once rating the individual’s ability to perform each competency (1 = No Ability, 2 = Below Average Ability, 3 = Average Ability, 4 = Above Average Ability, 5 = Exceptional Ability).
Prior to data collection, a panel of eight experts was asked to assess face and content validity of the instrument. Each member of the panel was considered an expert in the areas of agricultural education, agricultural systems management, instrument development, and/or research methods. A pilot test was conducted using individuals not selected in the samples for the study. Initial estimates of reliability of the instrument were calculated using the results of the pilot test, which yielded Cronbach’s alpha coefficients for the importance and ability scales that ranged from .95 to .97 (n = 30). Population
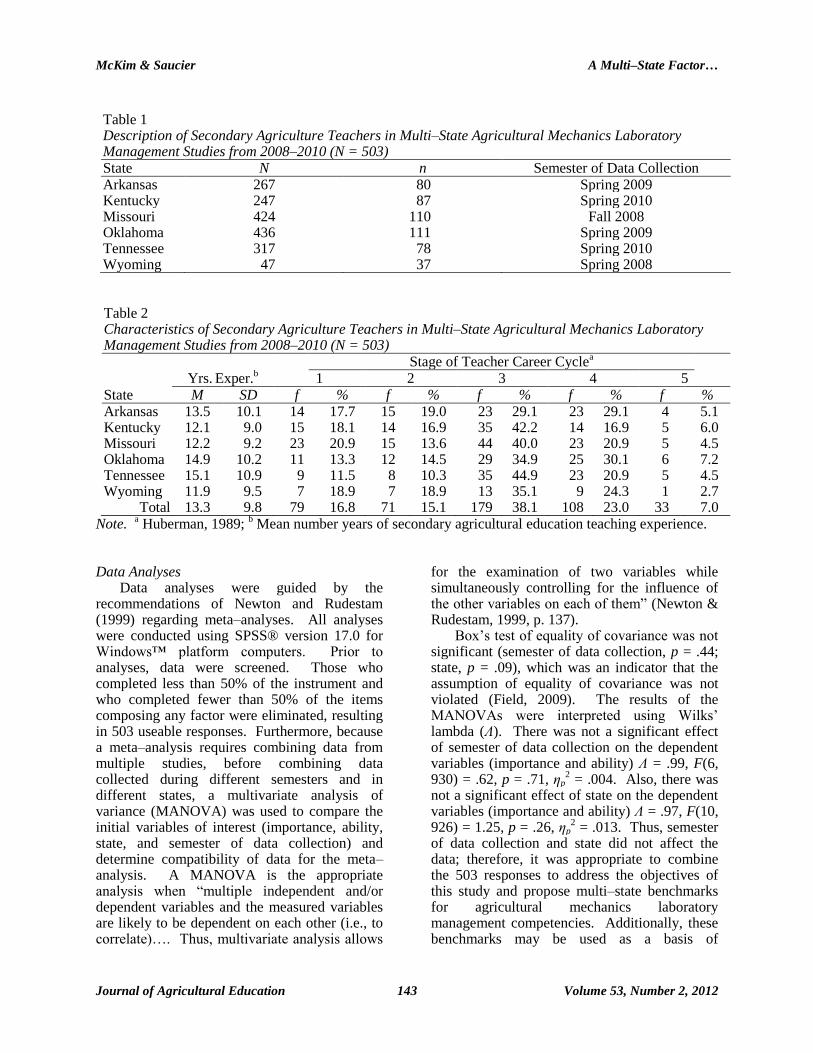
Data included in this study were collected from in–service secondary agriculture teachers in six states between the spring of 2008 and the spring of 2010 (see Table 1). Data collection efforts were made independently in each state. In each data collection effort, five points of contact were attempted (Dillman, Smyth, & Christian, 2009). Because of the nature of a meta–analysis—combining data from multiple studies—the objectives of this study were not inferential in nature. A more extensive description of the population (N = 503), including state, population of secondary agriculture teachers in each state, number of respondents, and semester of data collection, is provided in Table 1. Table 2 provides an overview of the secondary agriculture teachers’ experience and the corresponding stage of teacher career cycle as defined by Huberman (1989), which served as one basis of comparison for analyses.
McKim & Saucier A Multi–State Factor…
Journal of Agricultural Education 143 Volume 53, Number 2, 2012
Table 1 Description of Secondary Agriculture Teachers in Multi–State Agricultural Mechanics Laboratory Management Studies from 2008–2010 (N = 503) State N n Semester of Data Collection Arkansas
267 80 Spring 2009
Kentucky 247 87 Spring 2010
Missouri 424 110 Fall 2008
Oklahoma 436 111 Spring 2009
Tennessee 317 78 Spring 2010
Wyoming 47 37 Spring 2008
Table 2 Characteristics of Secondary Agriculture Teachers in Multi–State Agricultural Mechanics Laboratory Management Studies from 2008–2010 (N = 503)
Stage of Teacher Career Cyclea
Yrs. Exper.
b 1 2 3 4 5
State M SD f % f % f % f % f % Arkansas 13.5 10.1 14 17.7 15 19.0 23 29.1 23 29.1 4 5.1 Kentucky 12.1 9.0 15 18.1 14 16.9 35 42.2 14 16.9 5 6.0 Missouri 12.2 9.2 23 20.9 15 13.6 44 40.0 23 20.9 5 4.5 Oklahoma 14.9 10.2 11 13.3 12 14.5 29 34.9 25 30.1 6 7.2 Tennessee 15.1 10.9 9 11.5 8 10.3 35 44.9 23 20.9 5 4.5 Wyoming 11.9 9.5 7 18.9 7 18.9 13 35.1 9 24.3 1 2.7
Total 13.3 9.8 79 16.8 71 15.1 179 38.1 108 23.0 33 7.0 Note.
a Huberman, 1989;
b Mean number years of secondary agricultural education teaching experience.
Data Analyses
Data analyses were guided by the recommendations of Newton and Rudestam (1999) regarding meta–analyses. All analyses were conducted using SPSS® version 17.0 for Windows™ platform computers. Prior to analyses, data were screened. Those who completed less than 50% of the instrument and who completed fewer than 50% of the items composing any factor were eliminated, resulting in 503 useable responses. Furthermore, because a meta–analysis requires combining data from multiple studies, before combining data collected during different semesters and in different states, a multivariate analysis of variance (MANOVA) was used to compare the initial variables of interest (importance, ability, state, and semester of data collection) and determine compatibility of data for the meta–analysis. A MANOVA is the appropriate analysis when “multiple independent and/or dependent variables and the measured variables are likely to be dependent on each other (i.e., to correlate)…. Thus, multivariate analysis allows
for the examination of two variables while simultaneously controlling for the influence of the other variables on each of them” (Newton & Rudestam, 1999, p. 137).
Box’s test of equality of covariance was not significant (semester of data collection, p = .44; state, p = .09), which was an indicator that the assumption of equality of covariance was not violated (Field, 2009). The results of the MANOVAs were interpreted using Wilks’ lambda (Λ). There was not a significant effect of semester of data collection on the dependent variables (importance and ability) Λ = .99, F(6, 930) = .62, p = .71, ηp
2 = .004. Also, there was
not a significant effect of state on the dependent variables (importance and ability) Λ = .97, F(10, 926) = 1.25, p = .26, ηp
2 = .013. Thus, semester
of data collection and state did not affect the data; therefore, it was appropriate to combine the 503 responses to address the objectives of this study and propose multi–state benchmarks for agricultural mechanics laboratory management competencies. Additionally, these benchmarks may be used as a basis of

McKim & Saucier A Multi–State Factor…
Journal of Agricultural Education 144 Volume 53, Number 2, 2012
comparison, to assess agricultural mechanics laboratory management competency of secondary agriculture teachers.
Common methods variance (CMV) has been routinely noted as a pervasive problem in social science research, “one that undermines good science and biases empirical conclusions” (Lance, Dawson, Birkelbach, & Hoffman, 2010, p. 436). CMV is important when involving self–reported measures, such as collecting independent variables and dependent variables via the same method; e.g. self–administered questionnaire. Among the various methods of assessment reported to be effective in controlling for CVM (e.g. Harmon’s single factor test, partial correlation, etc.) those based on factor analysis tend to be the most rigorous (Meade, Watson, & Kroustalis, 2007). Therefore, a principal component analysis was conducted, using SPSS® version 17.0 for Windows™ platform computers, as a method for controlling CVM. Field’s (2009) outline of methods for analyses and interpretation of the data served as the primary guidance for the exploratory factor analysis. Tabachnick and Fidell (2007) served as a secondary source of guidance. Research Objective One
The purpose of research objective one was to assess the factor–analytic and psychometric properties of the agricultural mechanics laboratory management instrument, based on the perceptions of secondary agriculture teachers regarding the importance of agricultural mechanics laboratory management competencies. Hence, 70 importance scale
items from the instrument revised by Saucier et al. (2008) were included in the principal component analysis using a varimax rotation; coefficients with an absolute value less than .45 were suppressed to eliminate double–loadings. The Kaiser–Meyer–Olkin (KMO) measure of sampling adequacy was .95 and the Bartlett test of sphericity was significant (p < .001). All commonalities were greater than .48. Field (2009) noted that KMO values above .90 are considered to be superb; therefore, data were suitable for factor analytic procedures.
Sixteen items were not included in the components because they had coefficients with an absolute value less than .45. Six items were removed, because they loaded in components consisting of less than three items. Cronbach’s alpha coefficients associated with the eight components were calculated and ranged from .82 to .95 (n = 457). According to Field (2009), alpha coefficients of .80 or greater are considered to be acceptable. Therefore, six components, consisting of 15 items, were removed, because the associated alpha coefficients were less than .80. The remaining 33 items composed the eight–component solution that accounted for 73.15% of the total variance; components were then treated as independent constructs and served as the dependent variables for the study. Eigenvalues, percentages of variance, cumulative percentages, and Cronbach’s alpha coefficients for each construct are reported in Table 3. Construct loadings from the principal component analysis of the items are reported in Table 4.
Table 3 Eigenvalues, Percentages of Variance, and Cumulative Percentages for Constructs
Eigenvalue % of variance Cumulative % Cronbach's α Construct 1 3.897 11.808 11.808 .887 Construct 2 3.685 11.167 22.975 .853 Construct 3 3.130 9.485 32.461 .858 Construct 4 3.059 9.271 41.732 .875 Construct 5 2.802 8.491 50.222 .953 Construct 6 2.685 8.135 58.358 .957 Construct 7 2.612 7.916 66.273 .836 Construct 8 2.269 6.877 73.150 .823

McKim & Saucier A Multi–State Factor…
Journal of Agricultural Education 145 Volume 53, Number 2, 2012
Table 4 Construct Loadings from Principal Component Analysis with Varimax Rotation Item Loading Construct 1: Hazardous Material Management
Safely storing hazardous materials 0.820 Safely disposing of hazardous materials 0.817 Safely handling hazardous materials 0.803 Properly installing and maintaining safety devices and emergency equipment 0.521 Correcting hazardous laboratory conditions 0.479
Construct 2: Laboratory Equipment Maintenance Making minor repairs to the agricultural mechanics laboratory facility 0.622 Making minor agricultural mechanics lab equipment repairs 0.617 Performing routine maintenance of agricultural mechanics lab equipment 0.611 Installing stationary power equipment 0.579 Utilizing technical manuals to order replacement/repair parts for agricultural
mechanics lab equipment 0.484 Construct 3: Curriculum and Lesson Development
Maintaining a file of educational projects/activities for students 0.790 Developing a file of educational projects/activities for students 0.772 Selecting current references/technical manuals 0.561 Identifying current references/technical manuals 0.522
Construct 4: Program Public Relations and Recruitment Implementing student recruitment activities for the agricultural mechanics program 0.834 Planning student recruitment activities for the agricultural mechanics program 0.829 Conducting an agricultural mechanics public relations program 0.721 Planning an agricultural mechanics public relations program 0.694
Construct 5: Student Behavior Management Maintaining a student discipline policy 0.839 Enforcing a student discipline policy 0.800 Developing a student discipline policy 0.792
Construct 6: Laboratory Activity Preparation Identifying equipment required to teach agricultural mechanics skills 0.781 Identifying tools required to teach agricultural mechanics skills 0.749 Identifying supplies required to teach agricultural mechanics skills 0.721
Construct 7: Laboratory Facility and Program Management Developing an agricultural mechanics laboratory budget 0.709 Operating within the constraints of an agricultural mechanics budget 0.621 Estimating time required for students to complete projects/activities 0.517 Maintaining computer based student academic records 0.508 Promoting laboratory safety by color coding equipment/marking safety zones/posting
appropriate safety signs and warnings 0.471 Developing objective criteria for evaluation of student projects/activities 0.462
Construct 8: Personal Protection Equipment Management Storing protective equipment for student use 0.748 Maintaining protective equipment for student use 0.705 Selecting protective equipment for student use 0.658
According to Field (2009), individual items should measure the same underlying dimension, in this case, agricultural mechanics laboratory management competencies. Field noted that intercorrelations should range between “about
.3” to no higher than .80 (p. 648). “If any variables have lots of correlations below .3 then consider excluding them” (p. 648). Intercorrelations greater than .80 could indicate issues related to multicolinearity, thus, those

McKim & Saucier A Multi–State Factor…
Journal of Agricultural Education 146 Volume 53, Number 2, 2012
items should be removed as well. None of the remaining 33 items had an associated correlation scores less than .30 or greater than .80 (see Table 5). Similarly, constructs should correlate, even if measuring different aspects of the same thing. One bivariate correlation score of .23
existed between constructs 4 and 5; however, the constructs were not eliminated, because one low correlation among 27 acceptable bivariate correlations was not considered sufficient cause to eliminate the constructs.
Table 5 Bivariate Correlations Between Constructs Construct 1 2 3 4 5 6 7 8
1 — 2 .498 — 3 .388 .640 — 4 .331 .439 .456 — 5 .467 .537 .413 .227 — 6 .485 .669 .507 .367 .568 — 7 .471 .670 .610 .444 .583 .606 — 8 .548 .472 .359 .382 .415 .430 .470 —
Research Objective Two
The purpose of research objective two was to describe the self–perceived agricultural mechanics laboratory management abilities of the 503 secondary agriculture teachers to propose multi–state benchmarks for agricultural mechanics laboratory management
competencies. Hence, mean, median, and standard deviation for secondary agriculture teachers’ perceived ability to perform each agricultural mechanics laboratory management competency are reported in Table 6, by construct.

McKim & Saucier A Multi–State Factor…
Journal of Agricultural Education 147 Volume 53, Number 2, 2012
Table 6 Mean Scores for Agriculture Teachers’ Abilities to Perform Competencies by Construct Ability Item M SD Mdn
Construct 1: Hazardous Material Management Safely handling hazardous materials 3.95 0.82 4.00 Safely storing hazardous materials 3.88 0.87 4.00 Correcting hazardous laboratory conditions 3.79 0.81 4.00 Properly installing and maintaining safety devices and emergency
equipment 3.73 0.83 4.00 Safely disposing of hazardous materials 3.70 0.93 4.00 Making minor agricultural mechanics lab equipment repairs 3.78 0.86 4.00
Construct 2: Laboratory Equipment Maintenance Performing routine maintenance of agricultural mechanics lab equipment 3.75 0.85 4.00 Utilizing technical manuals to order replacement/repair parts for
agricultural mechanics lab equipment 3.66 0.84 4.00 Making minor repairs to the agricultural mechanics laboratory facility 3.61 0.87 4.00 Installing stationary power equipment 3.50 0.90 3.00
Construct 3: Curriculum and Lesson Development Maintaining a file of educational projects/activities for students 3.45 0.83 3.00 Developing a file of educational projects/activities for students 3.44 0.82 3.00 Identifying current references/technical manuals 3.34 0.76 3.00 Selecting current references/technical manuals 3.31 0.78 3.00
Construct 4: Program Public Relations and Recruitment Planning student recruitment activities for the agricultural mechanics
program 3.38 0.84 3.00 Implementing student recruitment activities for the agricultural mechanics
program 3.31 0.83 3.00 Conducting an agricultural mechanics public relations program 3.14 0.85 3.00 Planning an agricultural mechanics public relations program 3.12 0.80 3.00
Construct 5: Student Behavior Management Enforcing a student discipline policy 3.98 0.85 4.00 Developing a student discipline policy 3.96 0.82 4.00 Maintaining a student discipline policy 3.96 0.82 4.00
Construct 6: Laboratory Activity Preparation Identifying tools required to teach agricultural mechanics skills 3.93 0.81 4.00 Identifying equipment required to teach agricultural mechanics skills 3.90 0.80 4.00 Identifying supplies required to teach agricultural mechanics skills 3.87 0.79 4.00
Construct 7: Laboratory Facility and Program Management Maintaining computer based student academic records 3.72 0.92 4.00 Operating within the constraints of an agricultural mechanics budget 3.63 0.90 4.00 Developing objective criteria for evaluation of student projects/activities 3.57 0.76 4.00 Developing an agricultural mechanics laboratory budget 3.56 0.86 3.00 Estimating time required for students to complete projects/activities 3.42 0.82 3.00 Promoting laboratory safety by color coding equipment/marking safety
zones/posting appropriate safety signs and warnings 3.42 0.88 3.00 Construct 8: Personal Protection Equipment Management
Selecting protective equipment for student use 4.13 0.73 4.00 Maintaining protective equipment for student use 3.86 0.79 4.00 Storing protective equipment for student use 3.76 0.79 4.00
Note. 1 = No Ability, 2 = Below Average Ability, 3 = Average Ability, 4 = Above Average Ability, 5 = Exceptional Ability

McKim & Saucier A Multi–State Factor…
Journal of Agricultural Education 148 Volume 53, Number 2, 2012
Summated mean and standard deviation for
each agricultural mechanics laboratory management construct, based on the self–perceived abilities of secondary agriculture teachers, are reported in Table 7. These summated means are proposed as multi–state benchmarks for agricultural mechanics
laboratory management competencies. Based on the responses of 503 secondary agriculture teachers, in six states, teachers should have at least an above average ability to perform each agricultural mechanics laboratory management competency.
Table 7 Construct Benchmark Scores for Agriculture Teachers’ Ability to Perform Competencies Construct M SD Student Behavior Management 3.95 0.80 Personal Protection Equipment Management 3.91 0.68 Laboratory Activity Preparation 3.90 0.77 Hazardous Material Management 3.80 0.71 Laboratory Equipment Maintenance 3.65 0.73 Laboratory Facility and Program Management 3.55 0.64 Curriculum and Lesson Development 3.38 0.67 Program Public Relations and Recruitment 3.23 0.69
Note. 1 = No Ability, 2 = Below Average Ability, 3 = Average Ability, 4 = Above Average Ability, 5 = Exceptional Ability Research Objective Three
The purpose of research objective three was to use the construct outcomes of the factor–analytic and psychometric analyses included in research objective one to determine if the self–perceived agricultural mechanics laboratory management abilities of secondary agriculture teachers differed by teacher career stage. Testing if teacher career stage (Huberman, 1989) had an effect on the self–perceived ability of the 503 secondary agriculture teachers to perform agricultural mechanics laboratory management competencies was important, because if a significant effect existed, the revised competencies and constructs from this study could not be used to assess teachers in each career stages.
Hence, construct scores, based on secondary agriculture teachers’ perceived ability to perform each competency, served as the dependent variables; teacher career stage served as the independent variable. The alpha level was set a priori at .05. The result of the MANOVA was interpreted using Wilk’s lambda (Λ). There was not a significant effect of teacher career stage on the dependent variables, the constructs identified in research objective one, Λ = .91, F(32, 1683.24) = 1.34, p = .10, ηp
2 = .02.
Additionally, the observed power (1 - β = .965)
met the minimum power cut–off of 0.80, meaning that significant differences did not exist due to chance or error. Therefore, when interpreted by summated construct mean, the revised 33 competencies are appropriate for future assessments of secondary agriculture teachers to perform agricultural mechanics laboratory management competencies, for all five teacher career stages.
Conclusions, Implications, & Recommendations
As a result of this study, the 70 agricultural
mechanics laboratory management competencies included in the instrument modified by Saucier et al. were reduced to 33 competencies through factor–analytic procedures. A further outcome was reflected in the psychometric evaluation of the newly identified eight agricultural mechanics laboratory management constructs, which resulted in acceptable internal consistency reliabilities, as measured by Cronbach’s alpha coefficients greater than .80 (Field, 2009).
Prior to this study, a benchmark for agricultural mechanics laboratory management abilities of secondary agriculture teachers was not obvious in the literature. Although it is important to acknowledge that the benchmarks

McKim & Saucier A Multi–State Factor…
Journal of Agricultural Education 149 Volume 53, Number 2, 2012
proposed in this study are not normative data, the benchmarks serve as a point of reference for future needs assessments of secondary agriculture teachers’ ability to perform agricultural mechanics laboratory management competencies. Because the 33 competencies were appropriate to assess agricultural mechanics laboratory management competencies across all five teacher career stages, as interpreted by construct mean, those competencies and benchmarks provide an updated, succinct, and accurate measure for assessing secondary agriculture teachers’ professional development needs related to agricultural mechanics laboratory management.
Because beliefs of teachers are developed in part to the level of preparation regarding the content (Thompson & Balschweid, 1999), comfort level with the content, (Knobloch & Ball, 2003), perceived value of the content (Lawrenz, 1985), and past experiences with the content area (Calderhead, 1996; Thompson & Balschweid, 1999), teacher education programs and entities responsible for revising National Council for Accreditation of Teacher Education (NCATE) standards should ensure that preservice teachers are receiving adequate education and exposure to the areas of agricultural mechanics laboratory management identified in this study. Although adding or replacing coursework in teacher preparation programs may be difficult at many institutions, teacher educators can engrain the concept of self–directed learning (Knowles, Holton III, & Swanson, 2005) in their students, so that when needs are identified, teachers understand that it is their obligation to remediate or expand their knowledge and abilities.
The National Research Agenda: American Association for Agricultural Education’s Research Priority Areas for 2011 – 2015 indicated the need to identify the professional development needs of agricultural educators and
assess the efficiency and effectiveness of agricultural education programs at all levels. The 33 competencies identified in this study are a valid and reliable means to assess secondary agriculture teachers professional development needs related to agricultural mechanics laboratory management. Furthermore, the benchmarks proposed in this study can serve as a comparison for future needs assessments that include the 33 items identified in this study. Therefore, state agencies or associations responsible for conducting assessments of secondary agriculture teachers’ ability to perform agricultural mechanics laboratory management competencies should use the competencies and benchmarks proposed in this study to assess the secondary agriculture teachers ability to perform agricultural mechanics laboratory management competencies in their states.
To further address the professional development needs of secondary agriculture teachers, competency–based needs assessments should be developed for other areas of agricultural mechanics, such as technical competencies, and program planning, development, and evaluation (Garton & Chung, 1997). Also, methods of evaluating professional development needs should extend beyond common measures of self–perceived competency. Researchers should consider other avenues of assessing teacher competency, such as authentic assessment or performance–based assessment, much like those used in industry. Although the focus of this study was confined to laboratory management competencies related to agricultural mechanics, the need for safe and effective laboratory instruction and management spans far beyond the scope of agricultural mechanics—and perhaps agricultural education—to include other core–academic and career and technology education pathways.
References
Baker, A. J., Thoron, A. C., Myers, B. E., & Cody, T. J. (2008). The influence of laboratory experience
timing on student knowledge–level achievement in an undergraduate introductory agricultural mechanics course. NACTA Journal, 52(1), 6–9.
Bandura, A. (1986). Social foundations of thought and action: A social cognitive theory. Englewood
Cliffs, NJ: Prentice Hall.

McKim & Saucier A Multi–State Factor…
Journal of Agricultural Education 150 Volume 53, Number 2, 2012
Bandura, A. (1997). Self–efficacy: The exercise of control, New York, NY: W.H. Freeman. Borko, H., & Putnam, R. H. (1996). Learning to teach. In D. C. Berlinger & R. C. Calfee (Eds.),
Handbook of educational psychology (pp. 673–708). New York, NY: MacMillan. Burris, S., McLaughlin, E. K., McCulloch, A., Brashears, T., & Fraze, S. (2010). A comparison of first
and fifth year agriculture teachers on personal teaching efficacy, general teaching efficacy, and content efficacy. Journal of Agricultural Education, 51(1), 22–31. doi:10.5032/jae.2010.01022
Calderhead, J. (1996). Teachers: Beliefs and knowledge. In D. C. Berlinger & R. C. Calfee (Eds.),
Handbook of educational psychology (pp. 709–725). New York, NY: MacMillian. Dillman, D. A. (2007). Mail and Internet surveys: The tailored design method (2nd ed.). Hoboken, NJ:
John Wiley and Sons, Inc. Dillman, D. A., Sinclair, M. D., & Clark, J. R. (1993). Effects of questionnaire length, respondent–
friendly design and a difficult question on response rates for occupant–addressed census mail surveys. Public Opinion Quarterly, 57(3), 289–304. doi: 10.1086/269376
Dillman, D. A., Smyth, J. D., & Christian, L. M. (2009). Internet, mail, and mixed–mode surveys: The
tailored design method (3rd ed.). Hoboken, NJ: Wiley and Sons. Doerfert, D. L. (Ed.) (2011). National research agenda: American Association for Agricultural
Education’s research priority areas for 2011–2015. Lubbock, TX: Texas Tech University, department of Agricultural Education and Communications.
Field, A. (2009). Discovering statistics using SPSS: And sex and drugs and rock 'n' roll (3rd ed.). Los
Angeles, CA: Sage. Fletcher, W. E., & Johnson, D. M. (1990, November). Safety practices and equipment used in Mississippi
secondary agricultural mechanics laboratories. Paper presented at the 17th Annual National Agricultural Education Research Meeting, Cincinnati, OH.
Galesic, M., & Bosnjak, M. (2009). Effects of questionnaire length on participation and indicators of
response quality in a web survey. Public Opinion Quarterly, 73(2), 349–360. doi:10.1093/poq/nfp031
Garton, B. L., & Chung, N. (1997). An assessment of the inservice needs of beginning teachers of
agriculture using two assessment models. Journal of Agricultural Education, 38(3), 51–58. doi:10.5032/jae.1997.03051
Huberman, M. (1989). The professional cycle of teachers. Teachers College Record, 91(1), 31–57. Hubert, D., Ullrich, D., Lindner, J., & Murphy, T. (2003). An examination of Texas agriculture teacher
safety attitudes based on a personal belief scale from common safety and health practices. Journal of Agricultural Systems Technology and Management, 17(1), 1–13.
Johnson, D. M. (1989). Agricultural mechanics laboratory management competencies: Perceptions of
Missouri agriculture teachers concerning importance and ability (Unpublished doctoral dissertation). University of Missouri, Columbia, MO.
McKim & Saucier A Multi–State Factor…
Journal of Agricultural Education 151 Volume 53, Number 2, 2012
Johnson, D. M., & Schumacher, L. G. (1989). Agricultural mechanics specialists identification and evaluation of agricultural mechanics laboratory management competencies: A modified Delphi approach. Journal of Agricultural Education, 30(3), 23–28. doi:10.5032/jae.1989.03023
Johnson, D. M., Schumacher, L. G., & Stewart, B. R. (1990). An analysis of the agricultural mechanics
laboratory management inservice needs of Missouri agriculture teachers. Journal of Agricultural Education, 31(2), 35–39. doi:10.5032/jae.1989.03023
Knobloch, N. A. (2008). Factors of teacher beliefs related to integrating agriculture into elementary
school classrooms. Agriculture and Human Values, 25(4), 529–539. doi:10.1007/s10460–008–9135–z
Knobloch, N. A. (2001, December). The influence of peer teaching and early field experience on teaching
efficacy beliefs of preservice educators in agriculture. Paper presented at the 28th National Agricultural Education Research Conference, New Orleans, LA.
Knobloch, N. A., & Ball, A. (2003). An examination of elementary teachers’ and agricultural literacy
coordinators’ beliefs related to the integration of agriculture. Retrieved from http://www.agriculturaleducation.org/LinkPages/AgLiteracyK8.asp
Knowles, M. S., Holton III, E. F., & Swanson, R. A. (2005). The adult learner. San Diego, CA: Elsevier. Lance, C. E., Dawson, B., Birkelbach, D., & Hoffman, B. J. (2010). Method effects, measurement error,
and substantive conclusions. Organizational Research Methods, 13(3), 435–455. doi:10.1177/1094428109352528
Lawrenz, F. (1985). Impact on a five week energy education program on teacher beliefs and attitudes.
School Science and Mathematics, 85(1), 27–36. doi: 10.1007/BF02277231 Layfield, K. D., & Dobbins, T. R. (2002). Inservice needs and perceived competencies of South Carolina
agricultural educators. Journal of Agricultural Education, 43(4) 46–55. doi:10.5032/jae.2002.04046
McKim, B. R., & Saucier, P. R. (2011). Agricultural mechanics laboratory management professional
development needs of Wyoming secondary agriculture teachers. Journal of Agricultural Education, 52(3) 75–86. doi:10.5032/jae.2011.03075
Meade, A. W., Watson, A. M., & Kroustalis, C. M. (2007, April). Assessing common methods bias in
organizational research. Paper presented at the annual meeting of the Society for Industrial and Organizational Psychology, New York, NY.
Moseley, C., Reinke, K., & Bookout, V. (2002). The effect of teaching outdoor environmental education
on preservice teachers’ attitudes toward self–efficacy and outcome expectancy. Journal of Environmental Education, 34(1), 9–15. doi:10.1080/00958960209603476
Newton, R. R., & Rudestam, K. E. (1999). Your statistical consultant. Thousand Oaks, CA: Sage. Nunnally, J. C. (1967). Psychometric theory. New York, NY: McGraw–Hill. Pajares, M. F. (1992). Teachers’ beliefs and educational research: Cleaning up a messy construct. Review
of Research in Education, 62(3), 307–332. doi:10.3102/00346543062003307
McKim & Saucier A Multi–State Factor…
Journal of Agricultural Education 152 Volume 53, Number 2, 2012
Phipps, L. J., Osborne, E. W., Dyer, J. E., & Ball, A. L. (2008). Handbook on agricultural education in public schools (6th ed.). Clifton Park, NY: Thomson Delmar Learning.
Saucier, P. R., & McKim, B. R. (2010, October). A meta–analysis of teacher self–efficacy towards
agricultural mechanics laboratory management. Paper presented at the 2010 National Agricultural Mechanics Committee Blue Ribbon Poster Session, Indianapolis, IN.
Saucier, P. R., & McKim, B. R. (2011). Assessing the learning needs of student teachers in Texas
regarding management of the agricultural mechanics laboratory: Implications for the professional development of early career teachers in agricultural education. Journal of Agricultural Education, 52(4), 24–43. doi:10.5032/jae.2011.04024
Saucier, P. R., Schumacher, L. G., Funkenbusch, K., Terry, Jr. R., & Johnson, D. M. (2008, June).
Agricultural mechanics laboratory management competencies: A review of perceptions of Missouri agricultural science teachers concerning importance and performance ability. Paper presented at the 2008 Annual International Meeting of the American Society of Agricultural and Biological Engineers, Providence, RI.
Saucier, P. R., Terry, Jr., R., & Schumacher, L. G. (2009, February). Laboratory management in–service
needs of Missouri agricultural educators. Paper presented at the Southern Region Conference of the American Association for Agricultural Education, Atlanta, GA.
Schlautman, N. J., & Silletto, T. A. (1992). Analysis of laboratory management competencies in Nebraska
agricultural education programs. Journal of Agricultural Education, 33(4), 2–8. doi:10.5032/jae.1992.04002
Swan, M. K. (1992, December). An analysis of agricultural mechanics safety practices in agricultural
science laboratories. Paper presented at the American Vocational Association Convention, St. Louis, MO.
Tabachnick, B. G., & Fidell, L. S. (2007). Using multivariate statistics (5th ed.). Boston, MA: Pearson. Thompson, G. W., & Balschweid, M. (1999). Attitudes of Oregon agricultural science and technology
teachers toward integrating science. Journal of Agricultural Education, 40(3), 21–29. doi:10.5032/jae.1999.03021
Thoron, A. C., & Myers, B. E. (2010). The effect of using vee maps versus standard laboratory reports on
achieving content knowledge. Journal of Agricultural Education, 51(3), 12–22. doi:10.5032/jae.2010.03012
Tschannen–Moran, M., Woolfolk–Hoy, A., Hoy, W.K. (1998). Teacher efficacy: Its meaning and
measure. Review of Educational Research, 68(2), 202–248. doi:10.3102/00346543068002202 BILLY R. MCKIM is an Assistant Professor in the Department of Agricultural Leadership, Education, and Communications at Texas A&M University, 2116 TAMU, College Station, TX 77843–2116, [email protected]
P. RYAN SAUCIER is an Assistant Professor of Agricultural Education and Agricultural Systems Management in the Department of Agriculture at Texas State University – San Marcos, 212 Agriculture, San Marcos, TX 78666, [email protected]