readability of reassigned scalograms and extraction of ... · readability of reassigned scalograms...
TRANSCRIPT

Readability of reassigned scalograms and extraction of spectra features for signal analysis
S. Mekaoui1, A. Houacine1 & T. Gharbi2 1Department of Telecommunications, L.C.P.T.S, Algeria 2Institut des Microtechniques. Laboratoire d’ Optique P.M. Duffieux, UFR, France
Abstract
In this paper, wavelet scalogram is being used. The wavelet scalogram presents some disadvantages. This is particularly true for time-frequency analysis and representation which present inconvenient cross-terms. MMG signals (Mechano-myograms) are acquired via a home probe high sensitive optical sensor. The data obtained from 2 healthy subjects and 2 patients sat and tested under drastic conditions are analyzed to characterize the dynamic properties of the MMG and to determine their frequency contents as well. We developed the reassignment form of the scalogram which improves its resolution and readability. A plot of the scalogram contours is also presented to test the direct readability of the scalogram representations. Spectra features are extracted and relevant parameters are assessed such as the power spectral density, the mean frequency, the average frequency and the well known ratio HF% that characterizes the dynamic characteristics of the tested muscles. For that purpose, the number of subjects had been increased to 24 healthy subjects and up to 18 patients affected by different specific muscular diseases. Keywords: MMG Signals (Mechano-myograms), Reassigned Wavelet Scalogram, power spectral density, mean and average frequencies, MMG rms value, MMG average value, HF % ratio value.
1 Introduction
Muscular sounds actually known as Mechano-myograms (MMG signals) are acquired with the help of a high sensitive optical sensor. These signals are non-
© 2007 WIT PressWIT Transactions on Biomedicine and Health, Vol 12, www.witpress.com, ISSN 1743-3525 (on-line)
Modelling in Medicine and Biology VII 331
doi:10.2495/BIO070311

stationary and of random form with a very low amplitude. The study is focused on the characterization of their frequency contents and the extraction of spectra features that represent their dynamic properties. For that purpose we tested forearm muscles (e.g. Flexors) of many healthy subjects and patients. Time-frequency analysis was implemented to overcome the shortcomings of the FFT analysis. Among several TFA methods, was the most popular called Hitherto method [1, 2, 3], who initiated the time-frequency plane. Hitherto method was specifically devoted to the analysis of non stationary signal, [2, 3]. TFA methods revealed their limitations on finding a good trade-off between time and frequency resolutions. The limitation imposed by the Heisenberg-Gabor inequality [1, 2, 3, 4, 5, 6, 10], which made the trade-off unavoidable compelled the authors to find a solution. Thus, a compromise was to be found between time and frequency resolutions for whatever non stationary signal. To overcome these drawbacks, at the same time, other authors [2, 3, 4, 5, 6, 10, 14], proposed other time varying signal analysis tools on a concept of scale rather than frequency such as the Wavelet scalogram [2, 6]. Other tools like the affine smoothed version of Pseudo-Wigner-Ville distribution [2, 10], were implemented either. However, bilinear time-frequency distributions such as Wigner-Ville distribution have good concentration in time-frequency plane but present the disadvantage of interference terms (cross-terms) that can blur the readability in the time frequency plane of auto-terms (significant). Many attempts had been tried by the authors to overcome these inconvenient drawbacks. Unfortunately, those attempts were all tending to a loss in time-frequency concentration, [9, 10, 11, 12, 14, 15, 16]. The Wavelet scalogram is limited by the Heisenberg-Gabor inequality and presents the same weaknesses in the time scale-plane. To remove these shortcomings, authors implemented a modified form of the wavelet scalogram called the reassignment method of the wavelet scalogram [1, 2, 3, 4, 6, 12]. This method preserved energy properties and made both time and scale resolutions rightly enhanced.
2 Wavelet scalogram background
2.1 Continuous wavelet scalogram
The concept of the continuous wavelet scalogram is to subdivide a signal x(t) into a set or a family of zero mean functions called the “wavelets” derived from an elementary function Ψ (the “mother wavelet”) by translation in time and dilation in scale of the later. Then the following relation is tenable, [1, 2, 5, 6, 12, 14, 15,16]:
( ) ( ) ( )dsstxatCWT atx*,,, ψψ ∫
+∞
∞−
= , with: ( ) ( )
−
= −
atsaxx
at ψψ 2/1, , (1)
The parameter a corresponds to a scale factor. Time and frequency resolutions are limited by the Heisenberg-Gabor inequality, [1, 2, 3, 4, 5].
© 2007 WIT PressWIT Transactions on Biomedicine and Health, Vol 12, www.witpress.com, ISSN 1743-3525 (on-line)
332 Modelling in Medicine and Biology VII

2.2 Wavelet scalogram
The wavelet scalogram is then defined by:
( ) ( ) 2,,,, ψatCWTaTxSC x= , where: ψ is the wavelet function. (2) The scalogram is interpreted as the smoothed version of the Pseudo-Wigner-Ville distribution. One should refer to [2, 6, 10, 12, 14, 15, 16], to learn more.
2.3 Reassignment method of the wavelet scalogram
The concept of reassignment was based on the previous assumptions. As depicted, one has to find a compromise between time and frequency resolutions. It appears that it was necessary to enhance the readability of the scalogram and make the concentration of significant terms goodly localized in the scalogram and get more improved readability reducing in maximum cross-terms. So we chose the reassignment form to attain these goals, [2, 6].
3 Methods
3.1 Subjects
Four adults, 2 healthy subjects and 2patients were tested in this study. The MMG signals were acquired via a home probe. Many other patients affected with muscle diseases such as current dystrophies and atrophies were tested. Some of them were affected by Steinert and one by Marie-Charcot-Tooth disease.
3.2 Data analysis
3.2.1 Power Spectral Density Power spectral density is to be extracted from the MMG’s spectra. This parameter is estimated using the Welsh method and then noted as:
( ) ( )fSL
fSL
ll∑=
1; where: l represents the index of the interval, (3)
In respect to the frequency limits of the MMG’s range (e.g. [0 45] Hz). 3.2.2 The average frequency The average frequency in a determined range of frequencies is defined by:
( )
( )∑
∑
=
==1
0
1
0
.
f
ff
f
ffav
fS
fSfF ; where: ( )fS is the power spectral density, (4)
3.2.3 Mean frequency The mean frequency is given by:
© 2007 WIT PressWIT Transactions on Biomedicine and Health, Vol 12, www.witpress.com, ISSN 1743-3525 (on-line)
Modelling in Medicine and Biology VII 333

∑∑==
=1
0
)()(f
Ff
F
ff mean
mean
fSfS ; (5)
where: meanF is the mean frequency and )( fS is the power spectral density. 3.2.4 Mean value of the MMG signal The mean value of MMG corresponds to the mean time average value of the rectified MMG signal (in micrometers) and given by:
rectifiedMMGmean YV = ; (6)
where: MMGY is the amplitude of the MMG signal. 3.2.6 Root-mean-square value of the MMG The root-mean-square value of the MMG signal is calculated from the previous equation of the power spectral density in the limits of the MMG’s determined frequency range [0 45] Hz and is determined by:
( )∑=
=
=45
0
1
0
f
frms fSV ; where: 00 =f Hz and 451 =f Hz, (7)
3.2.7 The ratio HF% This ratio was defined as the ratio of the power spectral density in the range of [0 45] Hz to the power spectral density in the range of [6 45] Hz for whatever type of muscles, thus:
( )
( )∑
∑
=
== 45
6
45
15%
f
f
fS
fSHF ; This ratio reflects the contribution of the fast fibers, (8)
3.2.8 Statistics 24 healthy subjects were tested and with patients up to 18 subjects in clinical environment. Then, for each extracted feature, a statistical analysis is proceeded with the help of the well-known Origin 6.1 software.
4 Results and discussion
4.1 Reassigned wavelet scalogram results
The results presented in this section concerns two healthy subjects and two patients respectively. The first sub-section of results is organized so that for each MMG signal there exists four sub-windows. The first sub-window gives the display of the acquired MMG signal, whereas the second shows the power
© 2007 WIT PressWIT Transactions on Biomedicine and Health, Vol 12, www.witpress.com, ISSN 1743-3525 (on-line)
334 Modelling in Medicine and Biology VII

spectral density of the analyzed signal. The third sub-window displays the reassigned wavelet scalogram and finally the fourth illustrates the contours plot of the scalogram. The healthy subjects are named Heal.1 and Heal.2, whereas patients are named Pat.1 and Pat.2. Considering figure 1 which gives the results for the healthy subjects, it can be noticed that a good concentration of energy peaks around 10 Hz and 20 Hz and a poor one around 12 Hz and 15 Hz [Heal. 1]. Reassigned wavelet contours plot shows clearly this assertion and reveals several frequencies at the same instant. The power spectral density displayed shows a concentration of frequencies in the lower range of the power spectrum whose frequency axis is normalized to the highest value. These observed differences on frequencies at different instants are mainly due to the fact that force increases along with the increasing number of fibers which are recruited since contraction. This process seems to evolve steadily until the subject is in a state of total exhaustion. Readability of reassigned wavelet scalograms for Heal.2, indicate that energy peaks are distributed around 5 Hz and 12 Hz with a high level of brightness and relatively poor around 10 Hz, 15Hz, and 20 Hz [Heal.2]. Nevertheless, we should notice the appearance of the blurring 7 Hz (Heal.2) well-known by the clinicians to correspond to only muscle tremors. The examination of the power spectral density yields the same observation as in the case of Heal.1. In the case of patients, Figure 2 gives the patients results which are organized as in the case of healthy subjects. It can be seen from the displayed reassigned scalograms that Pat.1 had developed a very poor effort probably due to the nature of the muscular disease and hence an awful grasping of the strain gauge as the scalogram shows few energy peaks around 5 Hz and 10 Hz and a very small number with very poor energy around 15 Hz and 20 Hz. Only tremors and clear noticeable large transients are observed in the acquired MMG signal. The contours plot neatly reveals this fact. Real exhaustion at the beginning of the measurement protocol is obvious. Similar observations are noticed in the second case (Pat.2) who did his best to grasp firmly the strain gauge but unsuccessfully and was unable to fulfil the fixed force consigns of the experimental protocol. The generated frequencies revealed by both the scalogram and the contours plot are confusedly dispersed around 5 Hz and 20 Hz. with lower intensities. Obviously, only fast fibers responded to the excitation as the frequencies are localized in the high frequency range of the most significant MMG’s frequency range. Patients were not able to stand more than 15 seconds of experimentation.
4.2 Statistical results and analysis
Figures 3 – 6 provide graphic representations of the extracted spectra features of the MMG signals namely: Average frequency versus average force, mean frequency versus average force, MMG amplitude rms value versus maximum force, HF% ratio versus maximum force, for either healthy subjects or patients.
© 2007 WIT PressWIT Transactions on Biomedicine and Health, Vol 12, www.witpress.com, ISSN 1743-3525 (on-line)
Modelling in Medicine and Biology VII 335

Figure 1: Results of 2 Healthy subjects. For each of them, first sub-window gives the acquired MMG signal, second sub-window the power spectral density of his MMG signal. Third and fourth illustrate respectively the reassigned wavelet scalogram of the MMG signal and its contours plot.
© 2007 WIT PressWIT Transactions on Biomedicine and Health, Vol 12, www.witpress.com, ISSN 1743-3525 (on-line)
336 Modelling in Medicine and Biology VII

Figure 2: Results of 2 unhealthy subjects. For each of them first sub-window gives the acquired MMG signal, second sub-window the power spectral density of his MMG signal. Third and fourth illustrate respectively the reassigned wavelet scalogram of the MMG signal and its contours plot.
© 2007 WIT PressWIT Transactions on Biomedicine and Health, Vol 12, www.witpress.com, ISSN 1743-3525 (on-line)
Modelling in Medicine and Biology VII 337
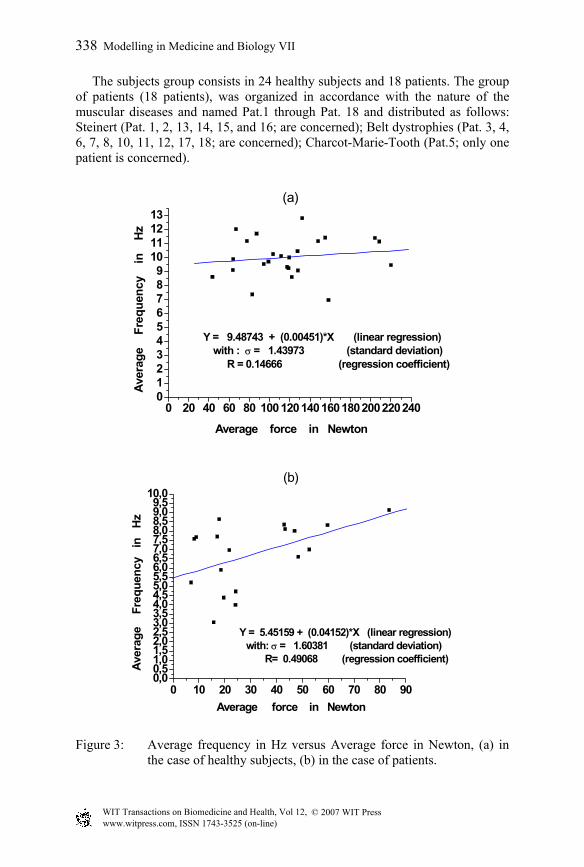
The subjects group consists in 24 healthy subjects and 18 patients. The group of patients (18 patients), was organized in accordance with the nature of the muscular diseases and named Pat.1 through Pat. 18 and distributed as follows: Steinert (Pat. 1, 2, 13, 14, 15, and 16; are concerned); Belt dystrophies (Pat. 3, 4, 6, 7, 8, 10, 11, 12, 17, 18; are concerned); Charcot-Marie-Tooth (Pat.5; only one patient is concerned).
0 20 40 60 80 1001201401601802002202400123456789
10111213
(a)
Y = 9.48743 + (0.00451)*X (linear regression) with : σ = 1.43973 (standard deviation)
R = 0.14666 (regression coefficient)
Ave
rage
F
requ
ency
in
H
z
Average force in Newton
0 10 20 30 40 50 60 70 80 900,00,51,01,52,02,53,03,54,04,55,05,56,06,57,07,58,08,59,09,5
10,0(b)
Y = 5.45159 + (0.04152)*X (linear regression)with: σ = 1.60381 (standard deviation)
R= 0.49068 (regression coefficient)
Ave
rage
F
requ
ency
in
H
z
Average force in Newton
Figure 3: Average frequency in Hz versus Average force in Newton, (a) in the case of healthy subjects, (b) in the case of patients.
© 2007 WIT PressWIT Transactions on Biomedicine and Health, Vol 12, www.witpress.com, ISSN 1743-3525 (on-line)
338 Modelling in Medicine and Biology VII

Figure 3 gives the statistical variation of the average frequency versus average force in both groups that made the comparison easier. This feature characterizes the evolving of the MMG signal amplitude in the period of stability of the muscular contraction. The linear regression estimated yields a positive slope. It can be observed that in the case of healthy subjects few values are dispersed whereas in the case of patients, we observed dispersed values with a greater standard deviation. In both cases, the average frequency varies linearly with the force. In order to check on this tendency we have chosen to study the mean frequency of the MMG signal versus average force. Figure 4, gives the results of this second spectrum feature and its assessment. So, we noticed in the case of healthy subjects that the mean frequency takes smaller values and a greater standard deviation when the regression is still linear with a positive slope inferring to a linear function of the average force. In the case of patients, the mean, the mean frequency seems to behave similarly. Globally the values of the mean frequency are goodly correlated with a higher regression coefficient. Figure 5 illustrates the MMG rms value in terms of maximum force for either healthy subjects or patients. The only relevancy is the poor and dispersed values in the case of patients and the quadratic form of this feature. This compelled us to test and estimate another interesting feature from the MMG acquired and which in fact best characterizes the activity of fast muscle fibers. This parameter is called the HF% ratio. Figure 6 gives the variations of this important feature in terms of maximum force. Examining figure 6, we observed that this ratio varies from 5 % to 35 %. In the case of patients, affected with different muscular diseases it appears that in maximum this ratio goes under 30 % and its minimum is around 5 %. In this case we did not notice significant differences with healthy subjects except that for special diseases like Steinert and Charcot-Marie-Tooth the values of HF % are smaller than in the case of healthy subjects.
© 2007 WIT PressWIT Transactions on Biomedicine and Health, Vol 12, www.witpress.com, ISSN 1743-3525 (on-line)
Modelling in Medicine and Biology VII 339

0 20 40 60 80 100 120 140 160 180 200 220 2400123456789
10111213 (a)
Y = 8.73749 + (0.00457)*X (linear regression)with : σ = 1.91959 (standard deviation)
R = 0.11204 (regression coefficient) Mea
n f
requ
ency
in
H
z
Average force in Newton
0 10 20 30 40 50 60 70 80 900,00,51,01,52,02,53,03,54,04,55,05,56,06,57,07,58,08,59,09,5
10,0(b)
Y= 3.82434 + (0.05038)*X (linear regression)with : σ = 1.79811 (standard deviation)
R = 0.52035 ( regression coefficient )
M
ean
fr
eque
ncy
in
H
z
Average force in Newton
Figure 4: Mean frequency vs. av. force, (a) healthy subjects, (b) patients.
© 2007 WIT PressWIT Transactions on Biomedicine and Health, Vol 12, www.witpress.com, ISSN 1743-3525 (on-line)
340 Modelling in Medicine and Biology VII

0 50 100 150 200 250 300 350 400 450 500 550 6000,00,10,20,30,40,50,60,70,80,91,01,11,2
(a)
Y = 0.82228+(-7.65784*10 - 5 )*X + (4.62216*10 - 7 )*X 2 (quadratic) with: σ = 0.13662 ( standard deviation )
R 2 = 0.05233 (quad. reg. coefficient )
MM
G
rms
val
ue
( in
µm )
Maximum force in Newton
0 50 100 150 200 250 300 350 400 450 5000,00,10,20,30,40,50,60,70,80,91,01,11,21,31,41,51,61,71,8
(b)
Y = 1.01514+(-0.00162)*X+(5.78208*10 - 6 )*X 2 (quadratic)with : σ = 0.44966 ( standard deviation )
R 2 = 0.06897 ( quad. reg. coefficient ) MM
G
rms
val
ue (
in
µm )
Maximum force in Newton
Figure 5: MMG rms value vs max. force, (a) healthy subjects, (b) patients.
© 2007 WIT PressWIT Transactions on Biomedicine and Health, Vol 12, www.witpress.com, ISSN 1743-3525 (on-line)
Modelling in Medicine and Biology VII 341

0 50 100 150 200 250 300 350 400 450 500 550 6000,02,55,07,5
10,012,515,017,520,022,525,027,530,032,5
(a)
H
F%
ratio
(
in p
erce
ntag
es )
Maximum force in Newton
Figure 6: HF % ratio vs. max. force, (a) healthy subjects, (b) patients.
5 Conclusion
The first aim of this work was to show the readability of the reassigned Wavelet scalogram of the MMG signals acquired from the flexors forearm muscles of many healthy subjects and patients affected with some well-known muscular diseases. The most relevant fact is the improvement of the readability of the reassigned wavelet scalograms and hence, a better concentration of the most significant frequencies is obtained in both cases. The contours plot emphasizes these observations and the estimated Power spectral densities confirmed the frequency range of the MMG signals. Moreover, tremors were read on the reassigned wavelet scalograms and especially in the case of patients. We found that these tremors were revealed by concentration of frequencies in the vicinity of 7 Hz and were due to awful adaptation with the grasping of the gauge. Also as it had been observed for patients that power spectra were shifted to the lower frequencies during fatigue. Moreover, reassigned scalograms showed a better localization in time of the frequency contents. The second part of this work dealt with the statistical assessment of some spectra features that can best characterize the muscle dynamic properties such as average frequency, mean frequency, average value and rms value of the MMG signal, and finally the important HF % ratio. The average and rms value of the MMG amplitude are known as features which represent the evolution of the MMG amplitude for whatever healthy or patient subject. The analysis of these parameters clearly illustrated that the frequency and amplitude of MMG signals are in linear relationship with force for both cases of subjects. We also found that the disparity of values of the rms
© 2007 WIT PressWIT Transactions on Biomedicine and Health, Vol 12, www.witpress.com, ISSN 1743-3525 (on-line)
342 Modelling in Medicine and Biology VII

MMG and its average are in the same order whereas for the average frequency it is smaller than the mean frequency for both groups. In addition these two parameters are in linear relationship with force whereas those previously cited are in quadratic relationship with force. Then, we had implemented the HF % ratio which can serve as good tool to assess the contribution of fast fibers as a peculiar indicator for affected muscles.
References
[1] Z. Peng, F. Chu and Y. He, Vibration Signal Analysis and Feature Extraction based on Reassigned Wavelet Scalograms. Journal of Sound and Vibration, 253 (5), pp. 1087-1100, 2002.
[2] F. Auger and P. Flandrin, Improving the Readability of Time-Frequency and Time-Scale Representations by the Reassignment Method. IEEE Transactions on Signal Processing, Vol. 43, N°5, pp. 1068-1089, 1995.
[3] B. Gramatikov, J. Brinker, S. Y. Chun, N. V. Thakor, Wavelet analysis and time-frequency distributions of the body surface ECG before and after angioplasty. Elsevier Method and Programs in Biomedicine, 62, pp. 87-98, 2000.
[4] I. Djurovic and L. Stankovic, Time-frequency representation based on the reassigned S-Method. J. of Signal Processing, Vol. 77, Issue 1, pp. 115-120, 1999.
[5] O. Rioul and P. Flandrin, Time-Scale Energy Distributions: a general class extending Wavelet Transforms. IEEE Trans. On Signal Processing, SP- 40(7), pp. 1746-1757, 1992.
[6] P. Flandrin, E. Chassande-Mottin, P. Abry, Reassigned Scalograms and their fast Algorithms. Proceedings of the SPIE-95, 2569, pp.152-158, San Diego, USA, 1995.
[7] J. Lin, Feature Extraction of Machine Sound using Wavelet and its Application in Fault Diagnosis. Elsevier NDT & E International 34, pp. 25-30.
[8] D. Barchiesi and T. Gharbi, Local spectral information in the near field with wavelet analysis and entropy. J. of Applied Optics, Vol. 38, N° 31, pp. 6587- 6596, 1999.
[9] C. Li, C. Zheng and C. Tai, Detection of ECG characteristic points using Wavelet Transforms.
[10] Leon Cohen, Time-frequency Distributions – A Review, Proceedings of the IEEE, Vol. 77, N°7,
[11] T. Gharbi et al, Optical near field data analysis through time-frequency distributions application to characterization and separation of the image content by reassignment. J. of Optical Society of America, Vol.17, N 12, 2000.
[12] C. Torrence and G.P. Compo, A Practical Guide to Wavelet Analysis. Bulletin of the American Meteorological Society, 61-78, Vol.79, 5, 1998.
[13] J.C. Wood and D.T. Barry, Time-Frequency Analysis of Skeletal Muscle and Cardiac Vibrations. Proceedings of the IEEE Vol. 84, N 9, 1986.
© 2007 WIT PressWIT Transactions on Biomedicine and Health, Vol 12, www.witpress.com, ISSN 1743-3525 (on-line)
Modelling in Medicine and Biology VII 343

[14] Marie Farge, Wavelet Transforms and their Applications to Turbulence. Annual Review Fluid Mechanics, 24, pp.395-457, 1992.
[15] G. Kaïser, A Friendly Guide to Wavelets (Book, Sixth printing), (1999) Library of Congress and Cataloguing, Printed by Quin Woodbine, Woodbine N.J. USA.
[16] R. Polikar, Fundamental Concepts and an Overview of the Wavelet Theory, Wavelet tutorial (2002), Second edition, Engineering, Rowan, 2002, USA.
[17] S.R. Perry et al, Mean Power Frequency and amplitude of the Mechanomyographic and Electromyographic Signals during incremental cycle Ergometry. J. of Electromyography and Kinesiology, 11 pp. 299-305, 2001.
[18] P. Madeleine, P. Bajaj, K. Sognard and L.A. Nielsen, Mechanomyography and Electromyography force Relationships during Concentric and Eccentric Contractions. J. of Electromyography and Kinesiology 11, pp. 113-121, 2001.
[19] W.A. Mackay, D.J. Gramond, H.C. Kwan and J.J. Murphay, Measurements of Human Forearm Viscoelasticity. Journal of Biomechanics, Vol 19, N°3, pp. 231-238, 1986, UK.
[20] M. Ouamer, M. Boiteux, M. Petitjean, L. Travens, A. Salès, Acoustic myography during voluntary isometric contraction reveals non-propagative lateral vibration. Journal of Biomechanics 32, 1279-1285, 1999.
© 2007 WIT PressWIT Transactions on Biomedicine and Health, Vol 12, www.witpress.com, ISSN 1743-3525 (on-line)
344 Modelling in Medicine and Biology VII