recent trends in pennsylvania housing prices analysis of new data released february 24 th, 2009 on...
TRANSCRIPT

Recent Trends in Pennsylvania Housing Prices
Analysis of New Data Released February 24th, 2009 on Pennsylvania Housing Prices
by the Federal Housing Finance Agency (FHFA).
Mark Price PhDLabor Economist Keystone Research [email protected]
Keystone Research Center
For a narrated version of this presentation go to http://www.papolicyblog.com/pablog/2009/02/housing_price_c_1.html
The Pennsylvania Policy Blog provides regular concise summaries and charts using the latest data on the economic crisis, with a little more edge than usual from KRC! www.papolicyblog.com

Keystone Research Center
Summary of Findings• Inflation-adjusted home prices in Pennsylvania fell in the 4th quarter of 2008 by
4.3%• Although this is an improvement over the 3rd Quarter, when prices fell by 8%, it
reflects a sharp reduction in inflation in the 4th quarter. Looking at home prices without adjusting for inflation indicates that the Pennsylvania housing market weakened further between the 3rd and 4th quarters of 2008.
• Although home prices continue to fall in Pennsylvania, the price declines experienced so far are smaller than those observed for the US and in neighboring states including Ohio, New Jersey, Delaware and Maryland.
• Among metropolitan areas in Pennsylvania, the biggest declines in home prices in the most recent quarter occurred in the Newark-Union (NJ-PA, MSAD), Allentown-Bethlehem-Easton (PA-NJ), Reading (PA), and Philadelphia (PA, MSAD).
• Although the scale of the excesses of the housing bubble was greater in other parts of the country, home prices here in Pennsylvania did rise rapidly at the height of the US housing bubble. And here in Pennsylvania, like elsewhere in the country, those places where prices grew the most during the bubble are now the places experiencing the largest declines in home prices.
• However it is important to note that the weaknesses in the housing market has dramatically slowed the growth in housing prices in most parts of Pennsylvania.

Keystone Research Center
Some Notes Before You ProceedInflation Adjustments• In the next few slides, data on the change in home prices are presented .
At the top of each slide, a note appears identifying whether the data has been adjusted for inflation or not.
• Adjusting for inflation is generally the best way to compare values over time.
• Figure 3 presents Pennsylvania housing price change before and after adjusting for inflation. The last year has been marked by a surge in food and energy prices in the 2nd and 3rd quarter and then a sudden worsening of the recession in the 4th quarter, which sharply reduced the rate of change in consumer prices.
• When examining inflation-adjusted housing prices, the slowdown in overall inflation between the 3rd and 4th quarter obscures the continuing decline in housing prices. Housing prices not adjusting for inflation (nominal) reveal a continuing decline in housing prices in Pennsylvania since the 4th quarter of 2006.

Keystone Research Center
Some Notes Before You ProceedTwo Home Prices Indexes• Data is presented first from the Federal Housing Finance Agency’s
(FHFA) purchase-only house price index for Pennsylvania. This is the most accurate measure of housing prices because it reflects prices derived from actual sales.
• Near the end of the presentation data is presented from the FHFA’s all-transactions house price index which includes housing price data derived from both home purchases and home refinance transactions. Indexes that include refinance transactions are somewhat less accurate since they include the estimation of home values by home appraisers. However, this is the only data set from which it is possible to examine housing price change in Pennsylvania’s metropolitan areas. This means that the decline in housing prices observed in Pennsylvania’s metropolitan areas is understated. To illustrate this effect consider that in Pennsylvania the purchase-only house price index in the most recent quarter shows nominal home prices falling by 3%, but the PA all-transactions index shows prices falling by just 0.8%.
• The most widely reported house price index is the S&P/Case-Shiller index but this index does not have data for Pennsylvania.

NOMINAL HOUSING PRICE CHANGEHOME PRICES DERIVED FROM HOME SALES ONLY
-10%
-5%
0%
5%
10%
15%19
92-1
1993
-1
1994
-1
1995
-1
1996
-1
1997
-1
1998
-1
1999
-1
2000
-1
2001
-1
2002
-1
2003
-1
2004
-1
2005
-1
2006
-1
2007
-1
2008
-1
Figure 1. Home Prices Continue to Decline in Pennsylvania and the United States
PA USA
Source. Keystone Research Center estimates based on Federal Housing Finance Agency (FHFA) purchase-only house price index.
Year Over Year Change in Quarterly Home Prices (Nominal) 1991-2008
Keystone Research Center

NOMINAL HOUSING PRICE CHANGEHOME PRICES DERIVED FROM HOME SALES ONLY
2.0%0.7%
-1.4% -1.8%-3.0%
-0.8%
-3.1%
-4.8%-6.1%
-8.3%
-15.0%
-10.0%
-5.0%
0.0%
5.0%
2006-4 to 2007-4 2007-1 to 2008-1 2007-2 to 2008-2 2007-3 to 2008-3 2007-4 to 2008-4
Figure 2. The Decline in Housing Prices in Pennsylvania Lags Behind the Nationwide Decline in Housing Prices
PA USA
Source. Keystone Research Center estimates based on Federal Housing Finance Agency (FHFA) purchase-only house price index.
Year Over Year Change in Quarterly Home Prices (Nominal) 2006-2008
Keystone Research Center

2.0%
0.7%
-1.4%-1.8%
-3.0%-2.3%
-3.8%
-6.3%
-8.0%
-4.3%
-10.0%
-8.0%
-6.0%
-4.0%
-2.0%
0.0%
2.0%
4.0%
2006-4 to 2007-4 2007-1 to 2008-1 2007-2 to 2008-2 2007-3 to 2008-3 2007-4 to 2008-4
Figure 3. Inflation Has Moderated As The Economy Has Weakened And Home Prices Continue to Decline in Pennsylvania
PA - Nominal Home Prices
PA - Inflation-Adjusted Home Prices
Source. Keystone Research Center estimates based on Federal Housing Finance Agency (FHFA) purchase-only home price index.
Year Over Year Change in Quarterly Home Prices 2006-2008
Note. Inflation-Adjustment based on the CPI-U-All Items Less Shelter.
NOMINAL AND INFLATION-ADJUSTED HOUSING PRICE CHANGEHOME PRICES DERIVED FROM HOME SALES ONLY
Keystone Research Center

NOMINAL HOUSING PRICE CHANGEHOME PRICES DERIVED FROM HOME SALES ONLY
Keystone Research Center
-0.9%
-3.0% -3.3% -3.9%
-6.2%-7.3% -7.6%
-11.8%
-8.3%
-18.0%
-14.0%
-10.0%
-6.0%
-2.0%
WV PA NY DC OH NJ DE MD USA
Figure 4. In the Most Recent Quarter, Home Prices in Pennsylvania Have Fallen Less Than in Other States in the
Mid-Atlantic RegionPercent Change in Home Prices (Nominal) Since the Fourth Quarter of 2007
Source. Keystone Research Center estimates based on Federal Housing Finance Agency 's purchase-only house price index.
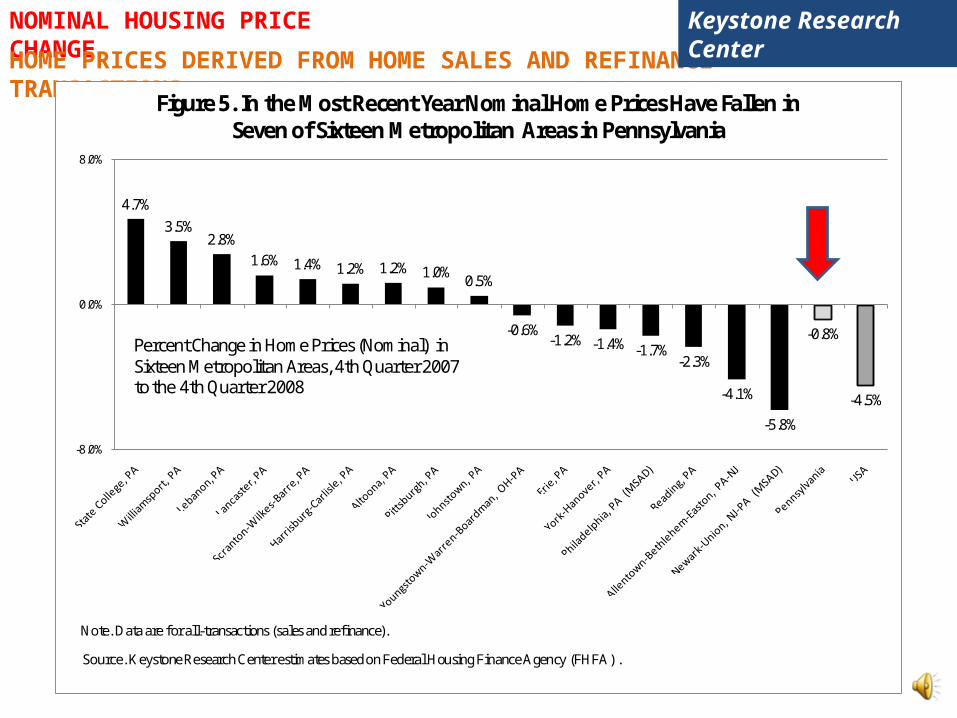
NOMINAL HOUSING PRICE CHANGE
HOME PRICES DERIVED FROM HOME SALES AND REFINANCE TRANSACTIONS
4.7%3.5%
2.8%1.6% 1.4% 1.2% 1.2% 1.0% 0.5%
-0.6%-1.2% -1.4% -1.7%
-2.3%
-4.1%
-5.8%
-0.8%
-4.5%
-8.0%
0.0%
8.0%
Figure 5. In the Most Recent Year Nominal Home Prices Have Fallen in Seven of Sixteen Metropolitan Areas in Pennsylvania
Note. Data are for all-transactions (sales and refinance).
Percent Change in Home Prices (Nominal) in Sixteen Metropolitan Areas, 4th Quarter 2007 to the 4th Quarter 2008
Source. Keystone Research Center estimates based on Federal Housing Finance Agency (FHFA) .
Keystone Research Center
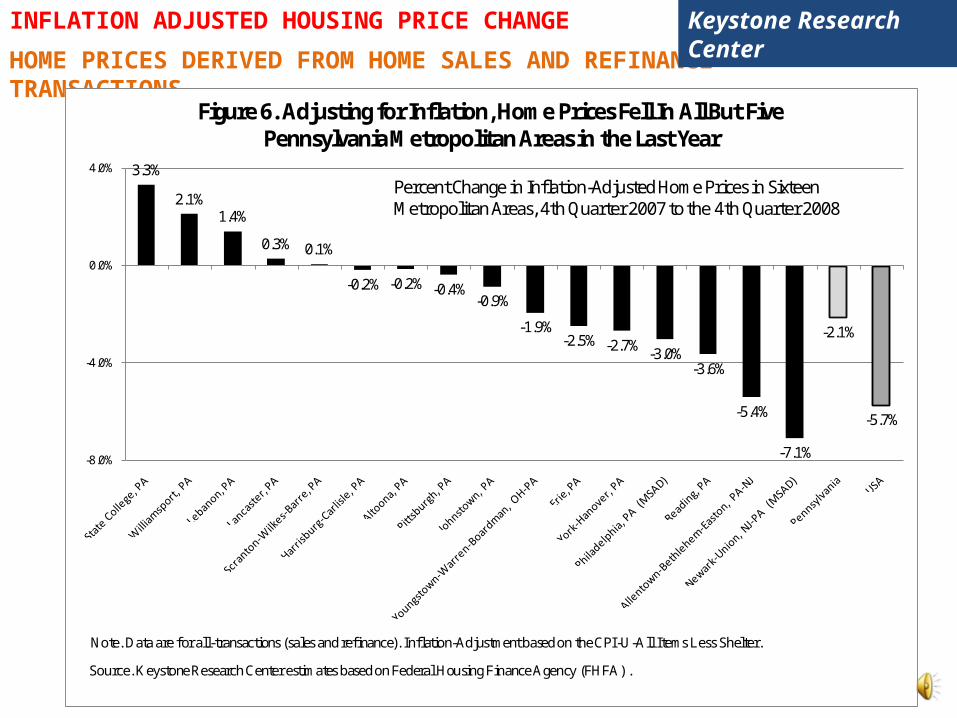
INFLATION ADJUSTED HOUSING PRICE CHANGE
HOME PRICES DERIVED FROM HOME SALES AND REFINANCE TRANSACTIONS
Keystone Research Center
3.3%
2.1%1.4%
0.3% 0.1%
-0.2% -0.2% -0.4%-0.9%
-1.9%-2.5% -2.7% -3.0%
-3.6%
-5.4%
-7.1%
-2.1%
-5.7%
-8.0%
-4.0%
0.0%
4.0%
Figure 6. Adjusting for Inflation, Home Prices Fell In All But Five Pennsylvania Metropolitan Areas in the Last Year
Note. Data are for all-transactions (sales and refinance). Inflation-Adjustment based on the CPI-U-All Items Less Shelter.
Percent Change in Inflation-Adjusted Home Prices in Sixteen Metropolitan Areas, 4th Quarter 2007 to the 4th Quarter 2008
Source. Keystone Research Center estimates based on Federal Housing Finance Agency (FHFA) .

INFLATION ADJUSTED HOUSING PRICE CHANGE
HOME PRICES DERIVED FROM HOME SALES AND REFINANCE TRANSACTIONS
Keystone Research Center
-15%
-10%
-5%
0%
5%
10%
15%
20%
25%
Figure 7. From Boom To Bust: Inflation-Adjusted Change in Home Prices in Pennsylvania Before the Housing Bubble Burst (2003-2005) and Since
(2006-2008)
2003-4QT to 2005-4QT2006-4QT to 2008-4QT
Note. Data are for all-transactions (sales and refinance). Inflation-Adjustment based on the CPI-U-All Items Less Shelter.
Source. Keystone Research Center estimates based on Federal Housing Finance Agency (FHFA) .
Percent Change in Inflation-Adjusted Home Prices in Sixteen Metropolitan Areas

Keystone Research Center
Summary of Findings• Inflation-adjusted home prices in Pennsylvania fell in the 4th quarter of 2008 by
4.3%• Although this is an improvement over the 3rd Quarter, when prices fell by 8%, it
reflects a sharp reduction in inflation in the 4th quarter. Looking at home prices without adjusting for inflation indicates that the Pennsylvania housing market weakened further between the 3rd and 4th quarters of 2008.
• Although home prices continue to fall in Pennsylvania, the price declines experienced so far are smaller than those observed for the US and in neighboring states including Ohio, New Jersey, Delaware and Maryland.
• Among metropolitan areas in Pennsylvania, the biggest declines in home prices in the most recent quarter occurred in the Newark-Union (NJ-PA, MSAD), Allentown-Bethlehem-Easton (PA-NJ), Reading (PA), and Philadelphia (PA, MSAD).
• Although the scale of the excesses of the housing bubble was greater in other parts of the country, home prices here in Pennsylvania did rise rapidly at the height of the US housing bubble. And here in Pennsylvania, like elsewhere in the country, those places where prices grew the most during the bubble are now the places experiencing the largest declines in home prices.
• However it is important to note that the weaknesses in the housing market has dramatically slowed the growth in housing prices in most parts of Pennsylvania.

Keystone Research Center
Conclusion• The passage of the American Recovery and Reinvestment
Act is an encouraging development which will likely help stabilize home prices in Pennsylvania.
• The Pennsylvania economy shed 59,100 jobs in the 4th quarter of 2008, and the state will likely experience similarly large losses in the next couple of months. As the economic stimulus is implemented, it will noticeably slow the pace of job loss in the commonwealth. By stabilizing the labor market, the economic stimulus package will prevent home foreclosures which, in Pennsylvania, are often driven by unforeseen job loss.
• It is also a positive sign that the Obama administration is moving forward with plans to help prevent foreclosures and to beginning to seriously tackle the problems in the financial sector.