recent trends in spending patterns of supplemental
TRANSCRIPT

1
James Mabli [email protected]
James Mabli is Associate Director of Human Services Research, Mathematica Policy Research, Cambridge, Massachusetts.
Rosalie Malsberger [email protected]
Rosalie Malsberger is a graduate student in epidemiology at the Harvard School of Public Health.
Recent trends in spending patterns of Supplemental Nutrition Assistance Program participants and other low-income AmericansUsing Consumer Expenditure Survey data for the period 2004–2010, this article examines spending on food by Supplemental Nutrition Assistance Program (SNAP) participants, whether this spending changed over time, whether participants spent more on food than did program nonparticipants, and whether spending on nonfood goods and services differed between participants and nonparticipants. The article found that spending on food at home increased since 2006 by a greater amount for SNAP participants than it did for eligible nonparticipants, with participants’ spending eventually surpassing nonparticipants’ spending by 2010. As the largest share of total spending, housing expenditures increased steadily for both participants and nonparticipants, with SNAP participants spending amounts similar to those spent by eligible nonparticipants.
As the largest federal nutrition assistance program, the Supplemental Nutrition Assistance Program (SNAP) ensures that low-income Americans have adequate access to food by providing them with an in-kind benefit to be spent on food each month. With nearly 44.5 million individuals participating in SNAP in an average month in fiscal year 2011 and with $71.8 billion spent on benefits in fiscal year 2011, it is important to assess how much SNAP participants spend on food each month, whether this spending amount has changed over time, and whether SNAP participants spend more on food than do nonparticipants.1
The amount a household spends on food is not decided in isolation, but as part of a decision how to best allocate resources (income) across various goods and services, including rent or mortgage payments; utilities bills, such as electric and telephone services; transportation; and education. Although extensive research has been conducted on how households distribute their resources across broad groups of goods and services,2 little research has
September 2013

U.S. BUREAU OF LABOR STATISTICS
2
MONTHLY LABOR REVIEW
focused on how these distributions differ across groups of low-income households. This is especially true for households participating in, eligible for, or nearly eligible for SNAP.
This article uses data from the Consumer Expenditure Survey (CE) for the period 2004–2010 to examine trends in expenditures on major budget categories of goods and services for SNAP participants, program-eligible nonparticipants, and higher income nonparticipants. The analysis is repeated by looking at expenditure shares, defined as the percentage of total expenditures spent on each category of goods and services. Next, the article compares expenditures in 2010, the most recent year for which data are available, on specific (minor) budget categories across the three participation and eligibility groups.
DataThe analysis relies on CE data for the period 2004–2010. The CE, which has been conducted for the Bureau of Labor Statistics (BLS) since 1980, collects data on consumer expenditures for goods and services used in day-to- day living. It also collects information on demographic characteristics and annual household income. The survey allows data users to relate the expenditures and income of consumers to the demographic characteristics of those consumers.
The CE consists of two separate surveys: the weekly Diary Survey and the Quarterly Interview Survey (henceforth referred to as CE Interview). The samples for the two surveys are drawn separately, and each survey has its own data collection technique. The data are released annually, with a 1-year lag from data collection to release. For example, the reference period of the 2005 CE data covers the four quarters of 2005 and the first quarter of 2006 for the CE Interview and the four quarters of 2005 for the Diary Survey. The findings in this article are based solely on estimates that use the CE Interview.
The CE Interview collects information from about 7,500 to 8,000 consumer units (families and single consumers) once every 3 months over five consecutive quarters, resulting in 38,000 to 39,000 records in the dataset.3 The survey is designed to collect information on expenditures that respondents can remember for a period of 3 months or longer. These expenditures include large purchases, such as property, automobiles, or major appliances; recurring expenditures, such as rent, utility bills, or insurance premiums; continuing expenses, such as apparel, food, and educational supplies; and other expenses, such as those related to employment and travel or vacations. The survey excludes nonprescription drugs, housekeeping supplies, and personal care products.
The purpose of first-quarter data collection is to obtain demographic information and an inventory of household goods. Some first-quarter data on expenses are also collected, but these data are not included in the analysis files. The second through fifth quarterly interviews collect the expenditure information. In addition, the second and fifth surveys collect information on annual income, employment, and credit liabilities. The income amount includes the value of SNAP benefits received. The fifth, and final, survey also collects information on asset balances, changes to asset balances in the previous 12 months, and finance charges on credit liabilities.
MethodologyAll analyses are conducted for consumer units. The CE defines a consumer unit as (1) occupants related by blood, marriage, adoption, or some other legal arrangement; (2) a single person living alone or sharing a household with others, but who is financially independent; or (3) two or more persons living together who share responsibility for at

U.S. BUREAU OF LABOR STATISTICS
3
MONTHLY LABOR REVIEW
least two out of three major types of expenses—food, housing, and other expenses. Students living in university- sponsored housing also are included in the sample as separate consumer units.
The CE describes consumer units’ spending on a diverse set of goods and services. To minimize the bias associated with respondents recalling expenditures over longer periods, the expenditure information is collected on a quarterly basis. Other household characteristics, such as income and SNAP participation, are available as 12- month measures.
The CE data include information about the total amount of SNAP benefits received by consumer-unit members in the previous 12 months, indicating which consumer units are receiving benefits. The data analysis points to a range of 6.5 million to 11.3 million consumer units who participated in the program during the 2004–2010 period. As shown in table 1, the annual SNAP receipt in CE data is, on average, 62 percent lower than the monthly receipt identified in official administrative counts.4
Sources: U.S. Bureau of Labor Statistics, Consumer Expenditure Interview Survey, 2004–2010, calendar year totals; U.S. Department of Agriculture, SNAP Quality Control sample data, fiscal years 2004–2010.
The underreporting of SNAP benefits in the CE data suggests that a nontrivial number of SNAP participants are categorized as nonparticipants in the analysis. As a result, the investigation may identify fewer spending differences between SNAP participants and eligible nonparticipants than it would find if SNAP participation were not as underreported. Therefore, all findings should be interpreted with this in mind.
This article focuses on differences in spending patterns among SNAP participants and other low-income consumer units. Two consumer groups in the latter category are defined for comparison purposes: eligible nonparticipants and higher income nonparticipants. Eligible nonparticipants are consumer units whose 12-month income is either at or under 130 percent of poverty (the federal gross income limit for SNAP eligibility), but who are not identified as SNAP participants. The CE data do not contain sufficient information to determine if consumer units would pass an asset test that is part of the SNAP eligibility determination. Nor does the analysis account for whether consumer units need to pass a net income test, which reflects income deductions for medical, shelter, dependent care, and earnings expenses. The analysis also does not attempt to account for higher income units who could be eligible for the program through categorical eligibility rules.5 Higher income nonparticipants—the second comparison group—
Year
Consumer Expenditure Survey,
annual number of consumer units in calendar year
(in thousands)
SNAP Quality Control data,
average monthly number of SNAP units
(in thousands)
2004 6,525 10,0692005 6,926 10,8522006 7,185 11,3132007 6,398 11,5612008 7,519 12,4642009 9,634 14,9812010 11,283 18,369
Table 1. Number of SNAP participants, by data source, 2004–2010

U.S. BUREAU OF LABOR STATISTICS
4
MONTHLY LABOR REVIEW
are identified as consumer units who do not participate in SNAP and whose income is greater than 130 percent of poverty but less than 300 percent of poverty.
Many consumer units take out loans for the purchase of homes and vehicles, and their monthly payment is split between principal and interest on the loan. Although the CE definition of expenditures includes the interest component of these payments, it excludes the principal component. This exclusion can cause expenditure totals for homeowners and vehicle owners to be downward biased. In a similar analysis of spending patterns that focused only on 2005, Laura Castner and James Mabli examined outlays, which include the principal and interest components of loan payments instead of expenditures, and found that the results were robust to the exclusion of these payments.6
Mean expenditures are estimated for each calendar year with the use of the methodology described in the CE- Interview documentation and the programs provided by BLS.7 Expenditure shares are estimated by dividing the mean expenditures for a specific category of goods and services by the mean total expenditures spent on all goods and services. All estimates are weighted on the basis of a survey weight for the total sample, called FINLWT21. Standard errors are calculated with the use of replicate weights provided by BLS. All estimates are adjusted to 2010 dollars with the use of annual values of the Consumer Price Index for All Urban Consumers.
The analysis estimates mean annual expenditures and expenditure shares for each of the three SNAP participation and eligibility groups. When interpreting findings, readers should consider the compositional differences among the three groups. For example, the average sizes of consumer units for SNAP participants, eligible nonparticipants, and higher income nonparticipants are 3.2, 2.1, and 2.5, respectively; the percentages of consumer units with children within these groups are 59 percent, 26 percent, and 33 percent, respectively.
The analysis accounts for differences in the size and composition of consumer units in two ways. First, because total expenditures are likely affected by size and composition, the analysis provides shares of total expenditures (in addition to absolute expenditures) when presenting expenditures on major budget categories of goods and services over time by participation and eligibility group. Second, when statistically comparing 2010 spending patterns across groups, the analysis presents findings according to whether consumer units contain children (age 17 and under).8 Some selected analyses also compare differences in expenditures across the three groups according to whether consumer units contain elderly members (age 65 and older) and according to whether consumer units rent or own the dwellings in which they live.
Changes over time in expenditures on major budget categories of goods and servicesFigures 1 through 8 present annual total expenditures and annual shares of total expenditures spent on each major budget category by SNAP participants, eligible nonparticipants, and higher income nonparticipants. Budget categories include food, housing, apparel, healthcare, transportation, and other goods and services. Given that food expenditures are an important outcome measure for SNAP, the analysis divides them into spending on food at home and spending on food away from home and regards these components as separate major categories of goods and services.

U.S. BUREAU OF LABOR STATISTICS
5
MONTHLY LABOR REVIEW
Total expenditures. The three participation and eligibility groups exhibited different trends in total expenditures over the study period. (See figure 1.) Total expenditures by SNAP participants increased by $674 from 2004 to 2006, increased more sharply from 2006 to 2009, and decreased slightly from 2009 to 2010. The total increase was $2,052. By comparison, expenditures by eligible nonparticipants increased by $2,339 from 2004 to 2006, increased less sharply from 2006 to 2008, and decreased slightly from 2008 to 2010, for a total increase of $2,056. Higher income nonparticipants exhibited the smallest increase in expenditures over time—$1,514 from 2004 to 2010—with most of this increase occurring from 2004 to 2006. By 2010, total expenditures by SNAP participants exceeded expenditures by eligible nonparticipants by about $1,300; yet, total spending for both groups was markedly (about $10,000) lower than that for higher income nonparticipants.

U.S. BUREAU OF LABOR STATISTICS
6
MONTHLY LABOR REVIEW
Expenditures on food at home. SNAP participants’ spending on food at home decreased between 2004 and 2005 and then increased sharply between 2006 and 2010 (from about $4,000 to more than $4,500 per year). (See figure 2.) This dynamic differs from the change in spending on food at home by eligible nonparticipants and higher income nonparticipants; for both groups, expenditures in this category increased until 2008 and then decreased between 2008 and 2010. These diverging trends have resulted in SNAP participants having the highest annual spending on food at home in 2010 across the three groups. This finding does not simply reflect an increase in total expenditures, because, from 2007 to 2010, the share of total expenditures spent on food at home increased the most for SNAP participants (by close to 2 percentage points, with little change in the shares of the nonparticipant

U.S. BUREAU OF LABOR STATISTICS
7
MONTHLY LABOR REVIEW
groups). In 2010, SNAP participants continued to maintain the highest expenditure share among the three groups, at about 18 percent. By comparison, the shares for eligible nonparticipants and higher income nonparticipants were 15 percent and about 13 percent, respectively.
Expenditures on food away from home. All three consumer groups had relatively flat profiles of spending on food away from home from 2004 to 2006, followed by sharp increases (between $400 and $650, depending on group) in 2007. (See figure 3.) Spending by SNAP participants and eligible nonparticipants then gradually declined through 2010. Higher income nonparticipants, however, exhibited a small decrease in spending from 2007 to 2008,
U.S. BUREAU OF LABOR STATISTICS
8
MONTHLY LABOR REVIEW
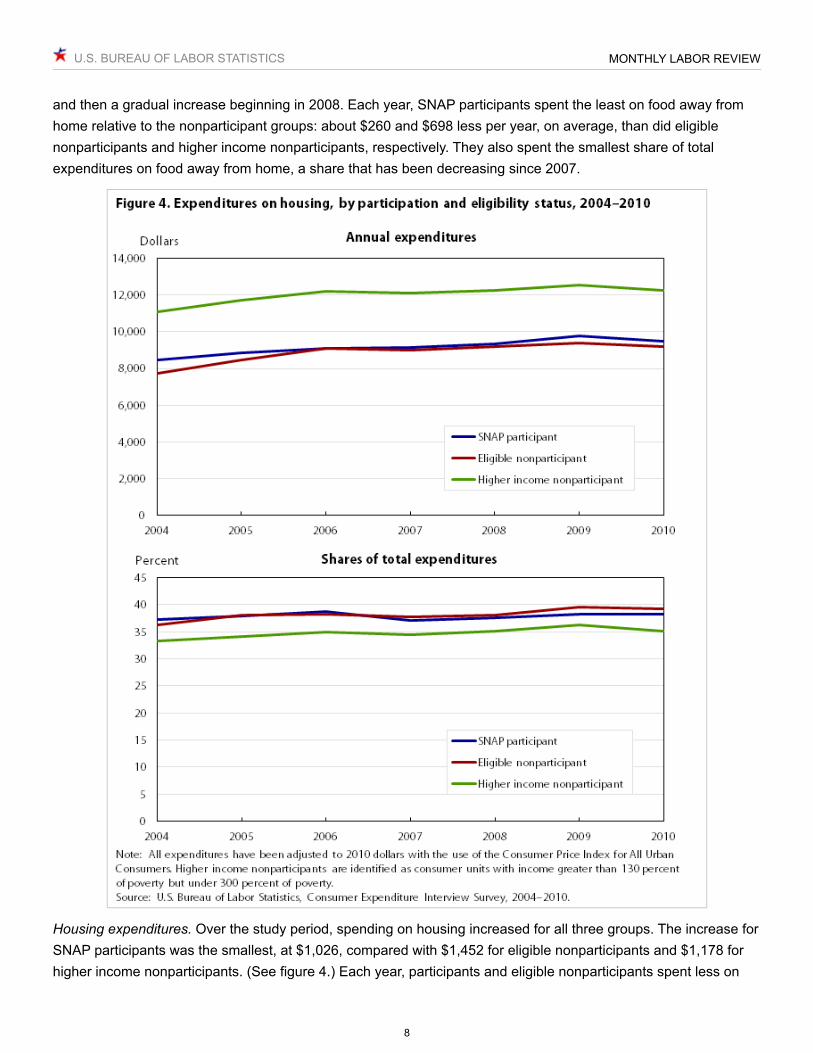
and then a gradual increase beginning in 2008. Each year, SNAP participants spent the least on food away from home relative to the nonparticipant groups: about $260 and $698 less per year, on average, than did eligible nonparticipants and higher income nonparticipants, respectively. They also spent the smallest share of total expenditures on food away from home, a share that has been decreasing since 2007.
Housing expenditures. Over the study period, spending on housing increased for all three groups. The increase for SNAP participants was the smallest, at $1,026, compared with $1,452 for eligible nonparticipants and $1,178 for higher income nonparticipants. (See figure 4.) Each year, participants and eligible nonparticipants spent less on
U.S. BUREAU OF LABOR STATISTICS
9
MONTHLY LABOR REVIEW
housing than did higher income nonparticipants; however, these households spent a greater share of total expenditures on housing.
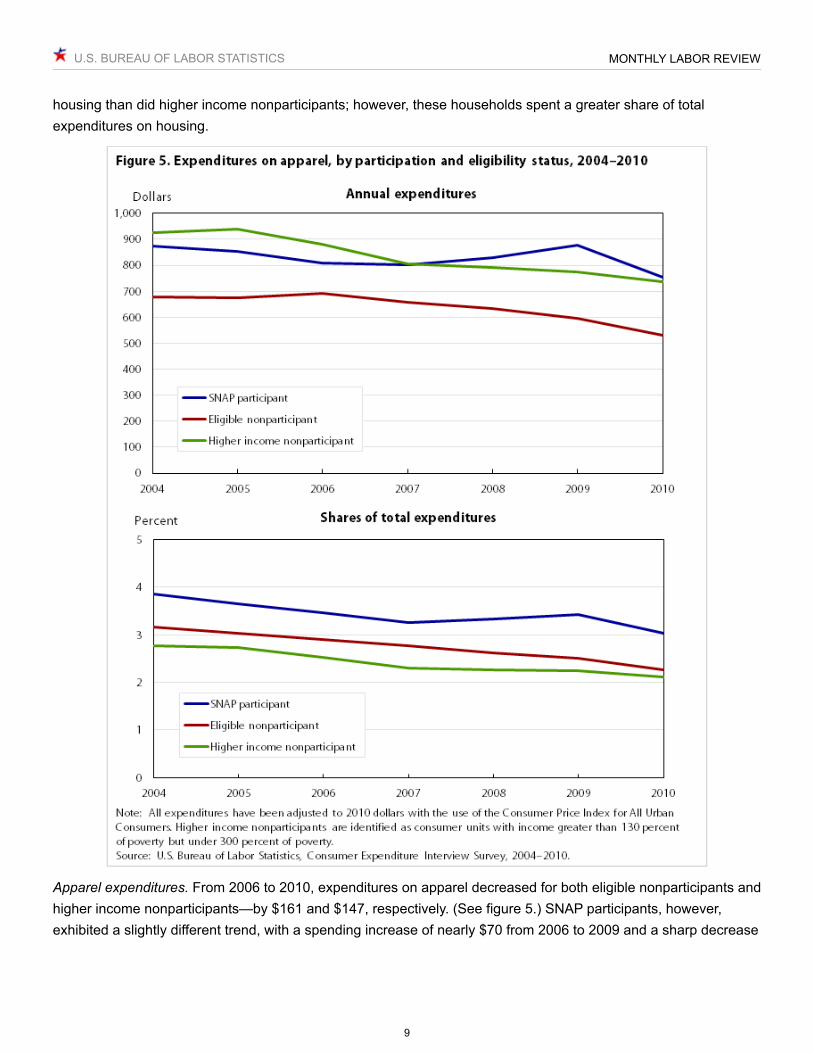
Apparel expenditures. From 2006 to 2010, expenditures on apparel decreased for both eligible nonparticipants and higher income nonparticipants—by $161 and $147, respectively. (See figure 5.) SNAP participants, however, exhibited a slightly different trend, with a spending increase of nearly $70 from 2006 to 2009 and a sharp decrease

U.S. BUREAU OF LABOR STATISTICS
10
MONTHLY LABOR REVIEW
of $125 from 2009 to 2010. For each group of consumer units, the trend in the share of total expenditures spent on apparel was fairly similar to the trend in absolute apparel expenditures.
Healthcare expenditures. Each year, SNAP participants spent the least on healthcare among the three groups, maintaining about a $650 difference from eligible nonparticipants and close to a $2,000 difference from higher income nonparticipants. (See figure 6.) Spending by participants increased by $133 from 2007 to 2008 and remained fairly stable from 2008 to 2010. Spending by eligible nonparticipants exhibited a more gradual increase over the 2007–2010 period, whereas spending by higher income nonparticipants jumped by more than $300 from

U.S. BUREAU OF LABOR STATISTICS
11
MONTHLY LABOR REVIEW
2008 to 2010. For all groups, the trends in the share of total expenditures spent on healthcare were similar to the trends in absolute healthcare expenditures.
Transportation expenditures. From 2005 to 2010, SNAP participants spent more on transportation than did eligible nonparticipants. (See figure 7.) The expenditure differential between the two groups was the largest in 2007 ($927 difference) but has diminished in subsequent years ($510 difference in 2010). Each year, spending on transportation has consistently been much greater for higher income nonparticipants than it has been for SNAP participants and eligible nonparticipants. For SNAP participants, the share of total expenditures spent on

U.S. BUREAU OF LABOR STATISTICS
12
MONTHLY LABOR REVIEW
transportation increased between 2004 and 2007 and decreased between 2007 and 2010. By contrast, the spending share of eligible nonparticipants, while more erratic, has generally experienced a decreasing trend.
Other expenditures. The major budget category of “other” expenditures includes spending on entertainment, personal care, reading and education, tobacco, cash contributions, personal insurance and pensions, and miscellaneous goods and services. Although spending in this category exhibited little change over time for higher income nonparticipants and eligible nonparticipants, it increased by $810 for SNAP participants from 2006 to 2009,

U.S. BUREAU OF LABOR STATISTICS
13
MONTHLY LABOR REVIEW
and then fell slightly. (See figure 8.) The share of total expenditures for SNAP participants also climbed over the 2006–2009 period.
Differences in spending patterns of SNAP participants and nonparticipants in 2010Thus far, the article has presented trends in expenditures on goods and services that have been aggregated into major budget categories. It is also useful to examine differences in consumer spending across more narrowly defined subcategories within each of these major categories. This approach can reveal whether certain subcategories of expenditures are driving the aggregate results. More important, the approach brings into focus subcategories that are policy relevant. For example, by disaggregating the housing category into its components, one can compare distributions of expenditures on utilities, rent, and other shelter expenses across the three participation and eligibility groups.
The analysis in this section uses 2010 data and discusses expenditure differences that are statistically significant at the 0.10, 0.05, or 0.01 level. For each major budget category, spending differences are examined across participation and eligibility groups among all consumer units and according to whether consumer units have children. For selected major budget categories, findings are examined separately by presence of elderly household members and according to whether consumer units rent or own their dwellings.
Components of food expenditures. SNAP participants spent more on food in 2010 than did eligible nonparticipants. (See table 2.) SNAP participants spent $4,559 on food at home, whereas eligible nonparticipants spent $3,502—a difference of $1,057. Higher income nonparticipants spent $4,360 on food at home, but their overall spending on food exceeded that of SNAP participants and eligible nonparticipants. For spending on food away from home, SNAP participants spent less relative to eligible nonparticipants; in 2010, participants spent $774 and eligible nonparticipants spent $1,091—a difference of $317.
Notes:
(1) Statistically different from zero at the 0.01 level, two-tailed test.
(2) Statistically different from zero at the 0.05 level, two-tailed test.
Note: Higher income nonparticipants are identified as consumer units with income greater than 130 percent of poverty but under 300 percent of poverty. Component expenditures may not add to totals because of rounding.
Source: U.S. Bureau of Labor Statistics, Consumer Expenditure Interview Survey, 2010.
Category SNAP participants Eligible nonparticipants Higher income nonparticipants
Food $5,334 $4,593(1) $5,962(1)
Food at home 4,559 3,502(1) 4,360(2)
Food away from home 774 1,091(1) 1,603(1)
Food away, excluding meals as pay 756 1,060(1) 1,573(1)
Meals as pay 19 31 30
Table 2. Expenditures on food, by participation and eligibility status, 2010

U.S. BUREAU OF LABOR STATISTICS
14
MONTHLY LABOR REVIEW
The analysis found statistically significant differences between SNAP participants and eligible nonparticipants in expenditures on food at home for consumer units without children, but not for units with children. (See table 3.) SNAP participants with children and eligible nonparticipants with children spent about the same on food at home— $5,499 and $5,575, respectively. Among consumer units without children, participants spent $3,229 on food at home, or $442 more than did eligible nonparticipants. For spending on food away from home, participants spent less than nonparticipants did, regardless of the presence of children in the unit, although the difference was larger for units without children.
A separate examination of food spending patterns according to whether consumer units contained elderly members produced findings similar to those for all consumer units. (See table 3.) For both units with and units without elderly members, SNAP participants spent more on food at home and less on food away from home than did eligible nonparticipants.
Notes:
(1) Statistically different from zero at the 0.01 level, two-tailed test.
(2) Statistically different from zero at the 0.05 level, two-tailed test.
(3) Statistically different from zero at the 0.10 level, two-tailed test.
Note: Higher income nonparticipants are identified as consumer units with income greater than 130 percent of poverty but under 300 percent of poverty. Component expenditures may not add to totals because of rounding.
Source: U.S. Bureau of Labor Statistics, Consumer Expenditure Interview Survey, 2010.
Category
Consumer units with children Consumer units without children
SNAP
participants
Eligible
nonparticipants
Higher income
nonparticipants
SNAP
participants
Eligible
nonparticipants
Higher income
nonparticipants
Food $6,493 $6,847 $7,752(1) $3,694 $3,816 $5,082(1)
Food at home 5,499 5,575 5,802(2) 3,229 2,787(1) 3,650(1)
Food away from home 993 1,272(1) 1,949(1) 465 1,029(1) 1,432(1)
Food away, excluding meals as pay
967 1,250(1) 1,919(1) 457 995(1) 1,403(1)
Meals as pay 26 21 30 8 34(2) 29(1)
CategoryConsumer units with elderly Consumer units without elderly
SNAP participants
Eligible nonparticipants
Higher income nonparticipants
SNAP participants
Eligible nonparticipants
Higher income nonparticipants
Food 4,369 4,087 5,132(1) 5,493 4,822(1) 6,380(1)
Food at home 3,859 3,250(1) 3,832 4,675 3,616(1) 4,625Food away from home 509 837(1) 1,299(1) 818 1,206(1) 1,755(1)
Food away, excluding meals as pay
500 832(1) 1,288(1) 798 1,164(1) 1,717(1)
Meals as pay 9 5 12 20 42(3) 39(1)
Table 3. Expenditures on food, by participation and eligibility status and presence of children and elderly, 2010

U.S. BUREAU OF LABOR STATISTICS
15
MONTHLY LABOR REVIEW
Components of housing expenditures. Although SNAP participants and eligible nonparticipants spent similar amounts on housing overall in 2010 (the difference between their respective spending amounts of $9,485 and $9,207 was not statistically significant at the 0.05 level), they exhibited more sizable differences in some shelter and utilities expenditures, and to a lesser extent in spending on household furnishings and equipment. (See table 4.) SNAP participants spent $829 less on owned dwellings, $766 more on rented dwellings, and $172 less on “other lodging,” which includes lodging away from home. Relative to higher income nonparticipants, SNAP participants also spent considerably less on owned dwellings and considerably more on rented dwellings.
Notes:
(1) Statistically different from zero at the 0.01 level, two-tailed test.
Category SNAP participantsEligible nonparticipantsHigher income nonparticipants
Housing $9,485 $9,207 $12,254(1)
Shelter 5,598 5,833 7,458(1)
Owned dwellings 1,397 2,226(1) 4,174(1)
Mortgage interest 786 1,016(1) 2,010(1)
Property taxes 339 716(1) 1,310(1)
Maintenance, repairs, insurance, and other 272 493(1) 854(1)
Rented dwellings 4,146 3,380(1) 3,021(1)
Rent, excluding rent as pay 3,795 3,233(1) 2,959(1)
Rent as pay 352 147(1) 62(1)
Other lodging 55 227(1) 263(1)
Utilities, fuels, and public services 2,904 2,442(1) 3,412(1)
Natural gas 300 265(2) 402(1)
Electricity 1,259 1,044(1) 1,350(2)
Fuel oil and other fuel 61 81 142(1)
Fuel oil 27 38 77(1)
Other fuels 34 44 64(1)
Telephone 946 736(1) 1,079(1)
Water and other public services 339 316 438(1)
Household operations 432 441 649(1)
Domestic services 219 239 325(1)
Domestic services, excluding childcare 41 156(1) 157(1)
Babysitting and daycare 178 82(1) 168Other household expenses 214 202 324(1)
House furnishings and equipment 550 491(3) 734(1)
Household textiles 47 41 58(2)
Furniture 187 144 208Floor coverings 5 5 17(1)
Major appliances 96 75 134(2)
Small appliances and miscellaneous housewares 35 34 49(1)
Miscellaneous household equipment 180 193 269(1)
Table 4. Expenditures on housing, by participation and eligibility status, 2010
See footnotes at end of table.

U.S. BUREAU OF LABOR STATISTICS
16
MONTHLY LABOR REVIEW
(2) Statistically different from zero at the 0.05 level, two-tailed test.
(3) Statistically different from zero at the 0.10 level, two-tailed test.
Note: Higher income nonparticipants are identified as consumer units with income greater than 130 percent of poverty but under 300 percent of poverty. Component expenditures may not add to totals because of rounding.
Source: U.S. Bureau of Labor Statistics, Consumer Expenditure Interview Survey, 2010.
In 2010, spending on utilities, fuels, and public services was $2,904 for SNAP participants, $2,442 for eligible nonparticipants, and $3,412 for higher income nonparticipants. Thus, SNAP participants spent $462 more on this category than did eligible nonparticipants and $508 less than did higher income nonparticipants. Electricity and telephone expenditures account for most of the spending differences between participants and eligible nonparticipants.
According to CE data, household operations include domestic services, such as housekeeping, gardening, babysitting, and daycare; pest control; moving, storage, and freight services; repair of household appliances; and other services. Although SNAP participants spent nearly the same amount on household operations as did eligible nonparticipants, the two groups differed more considerably in their spending on domestic services. Participants spent $115 less on domestic services, excluding childcare, and $96 more on babysitting and daycare. Both participants and eligible nonparticipants spent less on household operations than did higher income nonparticipants.
Similarities in overall spending on housing by SNAP participants and eligible nonparticipants mask spending variations that reflect compositional differences between the two groups. (See table 5.) A separate examination of consumer units with children and consumer units without children reveals that SNAP participants spent less on housing than did eligible nonparticipants; the difference was $1,458 for units with children and $752 for units without children. For units with children, participants and eligible nonparticipants spent statistically similar amounts on (1) rent and (2) utilities, fuels, and public services; for units without children, however, participants spent more on both sets of goods and services than did eligible nonparticipants.
Category
Consumer units with children Consumer units without children
SNAP
participants
Eligible
nonparticipants
Higher income
nonparticipants
SNAP
participants
Eligible
nonparticipants
Higher income
nonparticipants
Housing $11,007 $12,465(1) $15,944(1) $7,332 $8,084(2) $10,438(1)
Shelter 6,359 7,621(1) 9,778(1) 4,522 5,217(1) 6,317(1)
Owned dwellings 1,612 2,807(1) 5,817(1) 1,093 2,026(1) 3,366(1)
Mortgage interest 968 1,677(1) 3,744(1) 528 789(1) 1,157(1)
Property taxes 371 747(1) 1,426(1) 294 706(1) 1,254(1)
Maintenance, repairs, insurance, and other
273 383 647(1) 271 531(1) 956(1)
Rented dwellings 4,677 4,601 3,713(1) 3,395 2,959(2) 2,680(1)
Rent, excluding rent as pay 4,273 4,382 3,632(2) 3,117 2,837 2,628(2)
Table 5. Expenditures on housing, by participation and eligibility status and presence of children, 2010
See footnotes at end of table.

U.S. BUREAU OF LABOR STATISTICS
17
MONTHLY LABOR REVIEW
Notes:
(1) Statistically different from zero at the 0.01 level, two-tailed test.
(2) Statistically different from zero at the 0.05 level, two-tailed test.
(3) Statistically different from zero at the 0.10 level, two-tailed test.
Note: Higher income nonparticipants are identified as consumer units with income greater than 130 percent of poverty but under 300 percent of poverty. Component expenditures may not add to totals because of rounding.
Source: U.S. Bureau of Labor Statistics, Consumer Expenditure Interview Survey, 2010.
Category
Consumer units with children Consumer units without children
SNAP
participants
Eligible
nonparticipants
Higher income
nonparticipants
SNAP
participants
Eligible
nonparticipants
Higher income
nonparticipants
Rent as pay 404 218(2) 81(1) 278 122(1) 52(1)
Other lodging 70 213 248(1) 35 232(1) 271(1)
Utilities, fuels, and public services 3,348 3,462 4,202(1) 2,276 2,091(3) 3,024(1)
Natural gas 337 362 470(1) 247 231 369(1)
Electricity 1,445 1,495 1,658(1) 995 889(3) 1,199(1)
Fuel oil and other fuel 52 63 119(1) 75 88 153(1)
Fuel oil 20 19 56(1) 38 44 88(2)
Other fuels 32 44 63(2) 36 43 65(2)
Telephone 1,123 1,113 1,413(1) 696 606(2) 915(1)
Water and other public services 391 428 542(1) 264 277 387(1)
Household operations 606 627 1,033(1) 187 377(1) 460(1)
Domestic services 348 364 594(1) 36 195(1) 192(1)
Domestic services, excluding childcare 46 63 105(1) 34 188(1) 183(1)
Babysitting and daycare 302 301 489(1) 3 7 10(3)
Other household expenses 258 262 439(1) 150 181 267(1)
House furnishings and equipment 694 756 931(1) 347 400 638(1)
Household textiles 61 60 74 28 34 50(1)
Furniture 234 228 282 120 115 171Floor coverings 7 13 31(1) 2 3 11(1)
Major appliances 117 135 171(2) 68 54 116(1)
Small appliances and miscellaneous housewares
40 39 56(2) 28 32 45(2)
Miscellaneous household equipment
236 282 318(2) 101 162(1) 245(1)
Table 5. Expenditures on housing, by participation and eligibility status and presence of children, 2010

U.S. BUREAU OF LABOR STATISTICS
18
MONTHLY LABOR REVIEW
When utilities are included in consumer units’ rental payments, expenditures on utilities are typically reflected in expenditures on rented dwellings. Table 6 reveals whether the differences in expenditures on housing and housing components between participants and eligible nonparticipants can be explained by differences in the propensity of these groups to rent or own. For both consumer units who rent and units who own, SNAP participants spent less on shelter and more on utilities, fuels, and public services than did eligible nonparticipants.
Category
Consumer units who rent
the dwelling in which they live
Consumer units who own
the dwelling in which they live
SNAP
participants
Eligible
nonparticipants
Higher income
nonparticipants
SNAP
participants
Eligible
nonparticipants
Higher income
nonparticipants
Housing $9,593 $9,219 $12,517(1) $9,906 $10,204 $12,260(1)
Shelter 6,188 6,705(3) 8,794(1) 4,788 5,545(2) 6,858(1)
Owned dwellings 8 36 98(1) 4,620 5,079(3) 6,484(1)
Mortgage interest 2 22(3) 58(2) 2,606 2,312 3,117(3)
Property taxes 4 11 25(2) 1,117 1,632(1) 2,038(1)
Maintenance, repairs, insurance, and other
3 2 15(3) 897 1,135 1,328(1)
Rented dwellings 6,154 6,595 8,599(1) 41 90 19Rent, excluding rent as pay 5,689 6,391(2) 8,511(1) 41 90 19
Rent as pay 464 204(1) 89(1) 0 0 0Other lodging 26 74(2) 96(1) 126 376(2) 355(1)
Utilities, fuels, and public services 2,457 1,809(1) 2,526 4,022 3,430(1) 3,922
Natural gas 251 179(1) 247 428 394 492Electricity 1,067 798(1) 989(3) 1,726 1,457(1) 1,559(2)
Fuel oil and other fuel 32 17 37 126 161 202(2)
Fuel oil 19 5(3) 10 44 79 116(1)
Other fuels 13 12 27 81 82 86Telephone 873 657(1) 1,025(1) 1,156 887(1) 1,112Water and other public services 235 159(1) 227 586 531 558
Household operations 421 284(1) 567(1) 471 665(2) 694(1)
Domestic services 226 111(1) 253 208 413(2) 365(2)
Domestic services, excluding childcare 30 33 49(1) 66 320(1) 218(1)
Babysitting and daycare 195 78(1) 204 142 93 146
Other household expenses 196 172 314(1) 263 253 329(1)
House furnishings and equipment 527 421(2) 630(3) 624 564 786(3)
Household textiles 45 39 53 52 45 60
Table 6. Expenditures on housing, by participation and eligibility status and home-ownership status, 2010
See footnotes at end of table.

U.S. BUREAU OF LABOR STATISTICS
19
MONTHLY LABOR REVIEW
Notes:
(1) Statistically different from zero at the 0.01 level, two-tailed test.
(2) Statistically different from zero at the 0.05 level, two-tailed test.
(3) Statistically different from zero at the 0.10 level, two-tailed test.
Note: Higher income nonparticipants are identified as consumer units with income greater than 130 percent of poverty but under 300 percent of poverty. Component expenditures may not add to totals because of rounding.
Source: U.S. Bureau of Labor Statistics, Consumer Expenditure Interview Survey, 2010.
Components of apparel expenditures. In 2010, SNAP participants spent $223 more on apparel than did eligible nonparticipants, whereas participants and higher income nonparticipants spent similar amounts. (See table 7.) Examining the component categories of apparel shows that, compared with eligible nonparticipants, participants spent more on apparel for children ages 15 and under and less on adult clothing for men. Participants also spent more on footwear than did eligible nonparticipants. Many of these differences reflect the presence of children in consumer units. Separately examining consumer units with children and consumer units without children shows that apparel spending was similar for participants and eligible nonparticipants, although, for units with children, participants generally spent more on children’s apparel.
Category
Consumer units who rent
the dwelling in which they live
Consumer units who own
the dwelling in which they live
SNAP
participants
Eligible
nonparticipants
Higher income
nonparticipants
SNAP
participants
Eligible
nonparticipants
Higher income
nonparticipants
Furniture 199 135(2) 214 163 167 205Floor coverings 5 3 9(3) 5 8 22(1)
Major appliances 79 37(1) 83 144 125 164Small appliances and miscellaneous housewares
34 28 41(3) 35 41 53(2)
Miscellaneous household equipment
165 178 230(1) 225 178 282
Table 6. Expenditures on housing, by participation and eligibility status and home-ownership status, 2010
CategoryAll consumer units
SNAP participants Eligible nonparticipants Higher income nonparticipants
Apparel and services $753 $530(1) $735Men's and boys' apparel 147 115(1) 180(1)
Men, 16 years and over 64 89(1) 127(1)
Boys, 2 to 15 years 83 26(1) 53(1)
Women's and girls' apparel 236 201(2) 271(2)
Women, 16 years and over 140 158 212(1)
Table 7. Expenditures on apparel products and services, by participation and eligibility status and presence of children, 2010
See footnotes at end of table.

U.S. BUREAU OF LABOR STATISTICS
20
MONTHLY LABOR REVIEW
Notes:
(1) Statistically different from zero at the 0.01 level, two-tailed test.
(2) Statistically different from zero at the 0.05 level, two-tailed test.
(3) Statistically different from zero at the 0.10 level, two-tailed test.
Note: Higher income nonparticipants are identified as consumer units with income greater than 130 percent of poverty but under 300 percent of poverty. Component expenditures may not add to totals because of rounding.
Source: U.S. Bureau of Labor Statistics, Consumer Expenditure Interview Survey, 2010.
CategoryAll consumer units
SNAP participants Eligible nonparticipants Higher income nonparticipants
Girls, 2 to 15 years 96 42(1) 60(1)
Apparel for children, under 2 years 127 45(1) 53(1)
Footwear 109 81(1) 108Other apparel products and services 133 89(1) 123
CategoryConsumer units with children
SNAP participants Eligible nonparticipants Higher income nonparticipantsApparel and services 1,030 932 1,136
Men's and boys' apparel 200 186 298(1)
Men, 16 years and over 61 91(2) 157(1)
Boys, 2 to 15 years 139 95(1) 141Women's and girls' apparel 321 335 406(1)
Women, 16 years and over 162 179 248(1)
Girls, 2 to 15 years 159 156 158Apparel for children, under 2 years 201 137(1) 123(1)
Footwear 153 161 175(3)
Other apparel products and services 154 113(2) 134
CategoryConsumer units without children
SNAP participants Eligible nonparticipants Higher income nonparticipantsApparel and services 360 392 538(1)
Men's and boys' apparel 73 91 122(1)
Men, 16 years and over 68 88 112(1)
Boys, 2 to 15 years 5 3 10(1)
Women's and girls' apparel 117 154(3) 205(1)
Women, 16 years and over 109 151(2) 194(1)
Girls, 2 to 15 years 7 3 11Apparel for children, under 2 years 21 13 18
Footwear 47 53 75(1)
Other apparel products and services 103 80(2) 118
Table 7. Expenditures on apparel products and services, by participation and eligibility status and presence of children, 2010

U.S. BUREAU OF LABOR STATISTICS
21
MONTHLY LABOR REVIEW
Components of transportation expenditures. In 2010, participants spent $510 more on transportation than did eligible nonparticipants and $2,040 less than did higher income nonparticipants. (See table 8.) The difference in spending between participants and eligible nonparticipants was due primarily to spending on used cars and trucks as well as on gasoline and motor oil. Participants spent almost twice as much on local public transportation (excluding on trips) as did eligible nonparticipants. Separately examining consumer units with children and consumer units without children shows that overall spending on transportation was similar for participants and eligible nonparticipants, although participants in each group spent more on local transportation than did eligible nonparticipants in each group.
CategoryAll consumer units
SNAP participants Eligible nonparticipants Higher income nonparticipants
Transportation $3,898 $3,388(3) $5,938(1)
Cars and trucks, new 143 308 769(1)
Cars and trucks, used 1,087 606(1) 1,160Other vehicles 43 3(3) 17Gasoline and motor oil 1,385 1,278(3) 1,917(1)
Vehicle finance charges 81 77 192(1)
Maintenance and repairs 382 350 571(1)
Vehicle insurance 457 454 797(1)
Vehicle rental, licenses, and other charges 134 156 264(1)
Public transportation 187 156 252(3)
Public transportation on trips 81 99 194(1)
Local public transportation, excluding on trips 106 57(1) 58(1)
CategoryConsumer units with children
SNAP participants Eligible nonparticipants Higher income nonparticipantsTransportation 4,992 5,505 7,808(1)
Cars and trucks, new 244 753 930(1)
Cars and trucks, used 1,389 1,137 1,573Other vehicles 74 0(3) 30Gasoline and motor oil 1,735 2,012(1) 2,684(1)
Vehicle finance charges 105 129 314(1)
Maintenance and repairs 480 477 687(1)
Vehicle insurance 571 667(3) 998(1)
Vehicle rental, licenses, and other charges 170 179 345(1)
Public transportation 223 152 246Public transportation on trips 104 77 194(2)
Local public transportation, excluding on trips 118 75(2) 53(1)
CategoryConsumer units without children
SNAP participants Eligible nonparticipants Higher income nonparticipants
Table 8. Expenditures on transportation, by participation and eligibility status and presence of children, 2010
See footnotes at end of table.

U.S. BUREAU OF LABOR STATISTICS
22
MONTHLY LABOR REVIEW
Notes:
(1) Statistically different from zero at the 0.01 level, two-tailed test.
(2) Statistically different from zero at the 0.05 level, two-tailed test.
(3) Statistically different from zero at the 0.10 level, two-tailed test.
Note: Higher income nonparticipants are identified as consumer units with income greater than 130 percent of poverty but under 300 percent of poverty. Component expenditures may not add to totals because of rounding.
Source: U.S. Bureau of Labor Statistics, Consumer Expenditure Interview Survey, 2010.
Components of healthcare expenditures. Healthcare expenditures by SNAP participants ($919) were much lower than those by eligible nonparticipants ($1,604) and higher income nonparticipants ($2,914). (See table 9.) Relative to eligible nonparticipants, SNAP participants spent $685 less on health insurance, $465 less on medical services, and $141 less on prescription drugs and medical supplies. These spending differences remained statistically significant when accounting for the presence of children or elderly in the consumer unit, except for expenditures on prescription drugs and medical supplies. Group differences in the latter category were not statistically significant for units without children and units without elderly. (See table 10.)
CategoryAll consumer units
SNAP participants Eligible nonparticipants Higher income nonparticipants
Transportation 2,350 2,659 5,019(1)
Cars and trucks, new 0 154(1) 689(1)
Cars and trucks, used 659 423 957Other vehicles 0 4 10Gasoline and motor oil 890 1,025(3) 1,540(1)
Vehicle finance charges 46 59 131(1)
Maintenance and repairs 242 307(3) 514(1)
Vehicle insurance 294 380(2) 699(1)
Vehicle rental, licenses, and other charges 82 149(1) 224(1)
Public transportation 136 157 255(1)
Public transportation on trips 48 107(1) 194(1)
Local public transportation, excluding on trips 88 50(2) 61
Table 8. Expenditures on transportation, by participation and eligibility status and presence of children, 2010
Category SNAP participants Eligible nonparticipants Higher income nonparticipants
Healthcare $919 $1,604(1) $2,914(1)
Health insurance 535 999(1) 1,851(1)
Medical services 183 325(1) 624(1)
Prescription drugs and medical supplies 172 250(2) 366(1)
Medical supplies 29 30 73(1)
Table 9. Expenditures on healthcare, by participation and eligibility status, 2010
See footnotes at end of table.

U.S. BUREAU OF LABOR STATISTICS
23
MONTHLY LABOR REVIEW
Notes:
(1) Statistically different from zero at the 0.01 level, two-tailed test.
(2) Statistically different from zero at the 0.05 level, two-tailed test.
Note: Higher income nonparticipants are identified as consumer units with income greater than 130 percent of poverty but under 300 percent of poverty. Component expenditures may not add to totals because of rounding.
Source: U.S. Bureau of Labor Statistics, Consumer Expenditure Interview Survey, 2010.
Components of other expenditures. SNAP participants and eligible nonparticipants spent statistically similar amounts on entertainment in 2010, but participants spent $559 less on education, $322 more on tobacco and smoking supplies, and $545 more on personal insurance and pensions. (See table 11.) Much of the difference in
Category
Consumer units with children Consumer units without children
SNAP
participants
Eligible
nonparticipants
Higher income
nonparticipants
SNAP
participants
Eligible
nonparticipants
Higher income
nonparticipants
Healthcare $825 $1,357(1) $2,532(1) $1,051 $1,689(1) $3,102(1)
Health insurance 448 719(1) 1,571(1) 657 1,096(1) 1,989(1)
Medical services 201 419(1) 680(1) 158 292(1) 596(1)
Prescription drugs and medical supplies
144 193(2) 215(1) 212 269 440(1)
Medical supplies 32 26 66(1) 24 32 77(1)
CategoryConsumer units with elderly Consumer units without elderly
SNAP participants
Eligible nonparticipants
Higher income nonparticipants
SNAP participants
Eligible nonparticipants
Higher income nonparticipants
Healthcare 1,645 2,882(1) 4,413(1) 799 1,024(1) 2,160(1)
Health insurance 1,243 1,980(1) 3,046(1) 417 554(1) 1,250(1)
Medical services 142 390(1) 638(1) 190 295(2) 617(1)
Prescription drugs and medical supplies
220 459(2) 613(1) 164 155 242(1)
Medical supplies 41 52 116(1) 27 20 52(1)
Table 10. Expenditures on healthcare, by participation and eligibility status and presence of children and elderly, 2010

U.S. BUREAU OF LABOR STATISTICS
24
MONTHLY LABOR REVIEW
personal insurance and pension expenditures comes from spending on retirement, pensions, and social security. The differences in expenditures on entertainment, tobacco, and personal insurance and pensions between the two groups remained when accounting for the presence of children. However, relative to eligible nonparticipants, participants spent similar amounts on education among consumer units with children and relatively less on education among units without children.
CategoryAll consumer units
SNAP participants Eligible nonparticipants Higher income nonparticipants
Entertainment $1,072 $1,002 $1,524(1)
Fees and admission 107 149(2) 280(1)
Television, radios, and sound equipment 625 553(1) 788(1)
Other equipment and services 339 299 455(1)
Pets, toys, and playground equipment 263 205(2) 309(3)
Other entertainment equipment and services 76 94 146(2)
Personal care 120 123 206(1)
Reading 27 44(1) 71(1)
Education 239 798(1) 433(1)
Tobacco and smoking supplies 610 288(1) 369(1)
Miscellaneous 388 358 546(1)
Cash contributions 483 606 1,169(1)
Personal insurance and pensions 1,305 759(1) 2,515(1)
Life and other personal insurance 80 101 205(1)
Retirement, pensions, and social security 1,225 658(1) 2,311(1)
CategoryConsumer units with children
SNAP participants Eligible nonparticipants Higher income nonparticipantsEntertainment 1,266 1,276 2,035(1)
Fees and admission 141 190 403(1)
Television, radios, and sound equipment 709 688 959(1)
Other equipment and services 416 398 673(1)
Pets, toys, and playground equipment 307 292 409(1)
Other entertainment equipment and services 109 106 264(3)
Personal care 147 132 23(1)
Reading 25 28 48(1)
Education 281 383 527(1)
Tobacco and smoking supplies 597 341(1) 408(1)
Miscellaneous 408 277(3) 600(2)
Cash contributions 468 516 1,132(1)
Personal insurance and pensions 1,686 1,500(2) 4,306(1)
Life and other personal insurance 66 77 239(1)
Table 11. Expenditures on other goods and services, by participation and eligibility status and presence of children, 2010
See footnotes at end of table.

U.S. BUREAU OF LABOR STATISTICS
25
MONTHLY LABOR REVIEW
Notes:
(1) Statistically different from zero at the 0.01 level, two-tailed test.
(2) Statistically different from zero at the 0.05 level, two-tailed test.
(3) Statistically different from zero at the 0.10 level, two-tailed test.
Note: Higher income nonparticipants are identified as consumer units with income greater than 130 percent of poverty but under 300 percent of poverty. Component expenditures may not add to totals because of rounding.
Source: U.S. Bureau of Labor Statistics, Consumer Expenditure Interview Survey, 2010.
THIS ARTICLE EXAMINED RECENT SPENDING PATTERNS for SNAP participants, eligible nonparticipants, and higher income nonparticipants. The aim was to determine how much SNAP participants spent on food, whether this spending amount changed over time, whether participants spent more on food than did nonparticipants, and whether spending on nonfood goods and services differed between program participants and nonparticipants. The differences in 2010 in absolute spending amounts and types of goods and services purchased, along with the changes in these measures over the 2004–2010 period, suggest that SNAP participants, eligible nonparticipants, and higher income nonparticipants make different spending decisions.
The article found that total expenditures, adjusted for inflation, increased over the study period by about $2,000 for SNAP participants and eligible nonparticipants and by about $1,500 for higher income nonparticipants. Examining spending on major budget categories, the analysis found that spending on food at home increased since 2006 by a
CategoryAll consumer units
SNAP participants Eligible nonparticipants Higher income nonparticipants
Retirement, pensions, and social security 1,621 1,424(2) 4,066(1)
CategoryConsumer units without children
SNAP participants Eligible nonparticipants Higher income nonparticipantsEntertainment 797 908 1,273(1)
Fees and admission 60 136(1) 220(1)
Television, radios, and sound equipment 507 507 704(1)
Other equipment and services 231 265 348(1)
Pets, toys, and playground equipment 201 175 260Other entertainment equipment and services 30 90(3) 88(1)
Personal care 81 120(1) 191(1)
Reading 29 49(1) 83(1)
Education 179 941(1) 387(2)
Tobacco and smoking supplies 629 270(1) 350(1)
Miscellaneous 359 385 519(3)
Cash contributions 506 637 1,187(1)
Personal insurance and pensions 764 504(1) 1,635(1)
Life and other personal insurance 100 110 188(1)
Retirement, pensions, and social security 664 395(1) 1,447(1)
Table 11. Expenditures on other goods and services, by participation and eligibility status and presence of children, 2010

U.S. BUREAU OF LABOR STATISTICS
26
MONTHLY LABOR REVIEW
greater amount for SNAP participants than it did for eligible nonparticipants, with participants’ spending eventually surpassing nonparticipants’ spending by 2010. In addition, housing expenditures have increased steadily for each participation and eligibility group, with SNAP participants spending amounts similar to those spent by nonparticipants. Finally, transportation expenditures have remained fairly stable over the study period for both SNAP participants and eligible nonparticipants.
Focusing on 2010, the analysis statistically compared expenditures on specific (minor) budget categories of goods and services across the participation and eligibility groups. Relative to eligible nonparticipants, SNAP participants spent over $1,000 more on food at home and over $300 less on food away from home. Participants with children and eligible nonparticipants with children spent similar amounts on food at home, whereas participants without children spent more on food at home than did eligible nonparticipants without children. Participants spent less on food away from home than did eligible nonparticipants, regardless of whether these two groups had children.
There were notable differences in housing spending as well. Relative to eligible nonparticipants, SNAP participants spent $829 less on owned dwellings, $766 more on rented dwellings, and $462 more on utilities, fuels, and public services. For consumer units with children, participants and eligible nonparticipants spent statistically similar amounts on (1) rent and (2) utilities, fuels, and public services; for units without children, however, participants spent more on both sets of goods and services than did eligible nonparticipants.
Spending on transportation was similar for participants and eligible nonparticipants when examining consumer units with children and consumer units without children separately, although participants spent more on local transportation than did eligible nonparticipants. Finally, healthcare spending was over $900 lower for SNAP participants than it was for eligible nonparticipants.
SUGGESTED CITATION
James Mabli and Rosalie Malsberger, "Recent trends in spending patterns of Supplemental Nutrition Assistance Program participants and other low-income Americans," Monthly Labor Review, U.S. Bureau of Labor Statistics, September 2013, https://doi.org/10.21916/mlr.2013.30.
NOTES
1 Data on participation rates and benefit costs were obtained at https://www.fns.usda.gov.
2 Laura Castner and James Mabli, Low-income household spending patterns and measures of poverty (U.S. Department of Agriculture, Food and Nutrition Service, 2010); Jennifer Ward-Batts, “Out of the wallet and into the purse: using micro data to test income pooling,” Journal of Human Resources 43, no. 2, 2008, pp. 325–351; Geoffrey D. Paulin and Yoon G. Lee, “Expenditures of single parents: how does gender figure in?” Monthly Labor Review, July 2002, pp. 16–37; Deanna L. Sharpe and Abdel-Ghany Mohamed, “Identifying the poor and their consumption patterns,” Family Economics and Nutrition Review 12, no. 2, 1999, pp. 15–25; Mark Lino, “Income and spending of poor households with children,” Family Economics and Nutrition Review 9, no. 1, 1996, pp. 2–13.
3 Besides containing up to four records for each of the 7,500 to 8,000 households added to the survey each year, the CE Interview contains records from the previous year for households whose survey periods extended into the beginning of the calendar year.
4 Annual measures indicate the number of consumer units who participated in SNAP at some point during the year. Average monthly measures indicate the number of units participating in a month, averaged over the year. The annual measures are larger than the average monthly measures because some individuals who participated during the year (and who were thus reflected in the annual count) did not participate in every month. Administrative counts of annual participation are not available.

U.S. BUREAU OF LABOR STATISTICS
27
MONTHLY LABOR REVIEW
5 In this article, higher income nonparticipants are defined as consumer units with 12-month incomes greater than 130 percent of poverty. Some participating consumer units also have incomes greater than this threshold. These consumer units may be eligible through a categorical eligibility rule, or the actual income of the SNAP unit may differ from the consumer-unit income.
6 Castner and Mabli, Low-income household spending patterns.
7 For the 2005 CE data, see 2005 Consumer Expenditure Interview Survey public use microdata documentation (Bureau of Labor Statistics, February 2007). See related documentation for other survey years.
8 The average sizes of consumer units with children for SNAP participants, eligible nonparticipants, and higher income nonparticipants are 4.3, 4.3, and 4.2, respectively; for consumer units without children, the sizes are 1.7, 1.4, and 1.7, respectively.
RELATED CONTENT
Related Articles
Household expenditures on children, 2007-08, Monthly Labor Review, September 2010.
Expenditure patterns of young single adults: two recent generations compared, Monthly Labor Review, December 2008.
Consumer expenditures for selected items, 1999 and 2000, Monthly Labor Review, May 2003.
Expenditures of single parents: how does gender figure in? Monthly Labor Review, July 2002.
Income and spending patterns of single-mother families, Monthly Labor Review, May 1994.
Related Subjects
Consumer expenditures Supplemental benefits