reconstructing depositional processes and history from reservoir
TRANSCRIPT
Reconstructing depositional processes and history from reservoir
stratigraphy: Englebright Lake, Yuba River, northern California
Noah P. Snyder,1 Scott A. Wright,2 Charles N. Alpers,3 Lorraine E. Flint,3
Charles W. Holmes,4 and David M. Rubin5
Received 13 December 2005; revised 8 May 2006; accepted 11 July 2006; published 20 October 2006.
[1] Reservoirs provide the opportunity to link watershed history with its stratigraphicrecord. We analyze sediment cores from a northern California reservoir in the context ofhydrologic history, watershed management, and depositional processes. Observations ofrecent depositional patterns, sediment-transport calculations, and 137Cs geochronologysupport a conceptual model in which the reservoir delta progrades during floods of shortduration (days) and is modified during prolonged (weeks to months) drawdowns thatrework topset beds and transport sand from topsets to foresets. Sediment coarser than0.25–0.5 mm deposits in foresets and topsets, and finer material falls out of suspension asbottomset beds. Simple hydraulic calculations indicate that fine sand (0.063–0.5 mm) istransported into the distal bottomset area only during floods. The overall stratigraphysuggests that two phases of delta building occurred in the reservoir. The first, from damconstruction in 1940 to 1970, was heavily influenced by annual, prolonged >20 mdrawdowns of the water level. The second, built on top of the first, reflects sedimentationfrom 1970 to 2002 when the influence of drawdowns was less. Sedimentation rates in thecentral part of the reservoir have declined �25% since 1970, likely reflecting acombination of fewer large floods, changes in watershed management, and winnowing ofstored hydraulic mining sediment.
Citation: Snyder, N. P., S. A. Wright, C. N. Alpers, L. E. Flint, C. W. Holmes, and D. M. Rubin (2006), Reconstructing depositional
processes and history from reservoir stratigraphy: Englebright Lake, Yuba River, northern California, J. Geophys. Res., 111, F04003,
doi:10.1029/2005JF000451.
1. Introduction
[2] The proliferation and impact of dams on the world’srivers has been well documented by recent studies [e.g.,Graf, 1999; Nilsson et al., 2005; Syvitski et al., 2005]. Atthe same time, a growing number of scientists are using thesediment trapped behind dams as ‘‘natural’’ laboratories tounderstand sediment transport and depositional processes ina controlled setting [e.g., Ambers, 2001; Kostic et al., 2002;Twichell et al., 2005]. Reservoirs have the inherent advan-tage of known boundary conditions: maps of the predamriver are often available, and inflows and outflows aregenerally well monitored. Moreover, improvements inbathymetric mapping techniques makes obtaining high-resolution snapshots of lacustrine sedimentary surfaceseasier [e.g., Gardner et al., 2000]. However, these relativelycontrolled depositional systems are not without complica-tions. Wide fluctuations in water level over daily to annual
timescales are common in reservoirs managed for floodcontrol, water supply or hydroelectric power generation,and these changes in base level can complicate the stratig-raphy and hamper interpretations of reservoir sediments interms of flood history [Ambers, 2001]. High sedimentationrates and decomposition of trapped organic material canlimit the effectiveness of geophysical subbottom imagingtechniques in reservoirs [Childs et al., 2003; Snyder et al.,2004c; Twichell et al., 2005]. In spite of these complica-tions, reservoirs provide excellent opportunities to improveour ability to model sediment transport and deposition,quantify watershed sediment budgets and biogeochemicalcycling, and use science to inform river restoration projects.[3] In this study, we build on previous work on Engle-
bright Lake, a medium-sized (original volume 8.6� 107 m3)impoundment on the Yuba River in the Sierra Nevada foot-hills of northern California, to connect reservoir stratigraphymeasured through coring with watershed flood and manage-ment history. The Yuba watershed has been studied exten-sively. First, because it was the site of intensive hydraulic goldmining in the late 19th century [Gilbert, 1917].More recently,it has been the focus of the California Bay-Delta Authority(CBDA) Upper Yuba River Studies Program (UYRSP), aninvestigation of the feasibility of introducing anadromous fishspecies to the Yuba River system upstream of EnglebrightDam [Snyder et al., 2004c; James, 2005]. Decommissioningof the dam is one management solution under consider-
JOURNAL OF GEOPHYSICAL RESEARCH, VOL. 111, F04003, doi:10.1029/2005JF000451, 2006ClickHere
for
FullArticle
1Department of Geology and Geophysics, Boston College, ChestnutHill, Massachusetts, USA.
2U.S. Geological Survey, Flagstaff, Arizona, USA.3U.S. Geological Survey, Sacramento, California, USA.4U.S. Geological Survey, St. Petersburg, Florida, USA.5U.S. Geological Survey, Santa Cruz, California, USA.
Copyright 2006 by the American Geophysical Union.0148-0227/06/2005JF000451$09.00
F04003 1 of 16
ation to accomplish this objective. The goals of this studyare to (1) use a reservoir deposit as a large-scaleopportunity to understand and quantify depositional pro-cesses and rates in the context of gauged hydrologichistory and (2) investigate the long-term sedimentaryresponse of a river system to changes in mining-derivedsediment load and watershed management. Through thiswork, we hope to aid future studies concerned withsediment management both into reservoirs and afterdam removal.
2. Yuba River Watershed
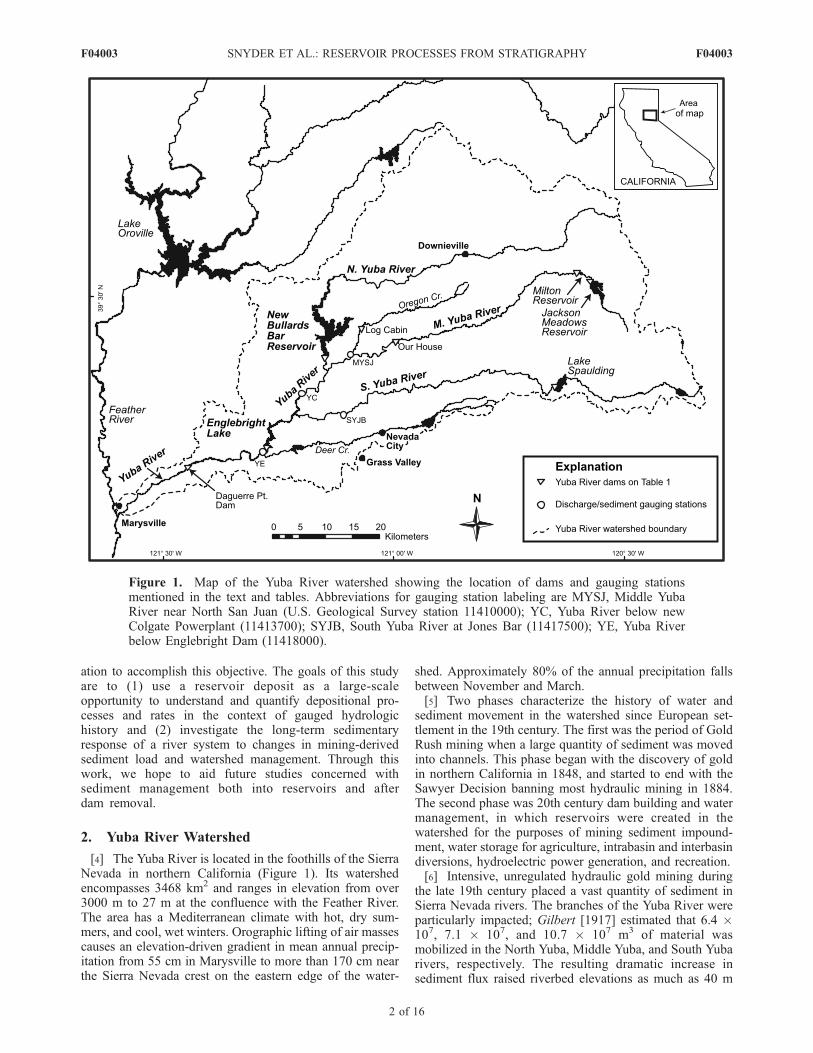
[4] The Yuba River is located in the foothills of the SierraNevada in northern California (Figure 1). Its watershedencompasses 3468 km2 and ranges in elevation from over3000 m to 27 m at the confluence with the Feather River.The area has a Mediterranean climate with hot, dry sum-mers, and cool, wet winters. Orographic lifting of air massescauses an elevation-driven gradient in mean annual precip-itation from 55 cm in Marysville to more than 170 cm nearthe Sierra Nevada crest on the eastern edge of the water-
shed. Approximately 80% of the annual precipitation fallsbetween November and March.[5] Two phases characterize the history of water and
sediment movement in the watershed since European set-tlement in the 19th century. The first was the period of GoldRush mining when a large quantity of sediment was movedinto channels. This phase began with the discovery of goldin northern California in 1848, and started to end with theSawyer Decision banning most hydraulic mining in 1884.The second phase was 20th century dam building and watermanagement, in which reservoirs were created in thewatershed for the purposes of mining sediment impound-ment, water storage for agriculture, intrabasin and interbasindiversions, hydroelectric power generation, and recreation.[6] Intensive, unregulated hydraulic gold mining during
the late 19th century placed a vast quantity of sediment inSierra Nevada rivers. The branches of the Yuba River wereparticularly impacted; Gilbert [1917] estimated that 6.4 �107, 7.1 � 107, and 10.7 � 107 m3 of material wasmobilized in the North Yuba, Middle Yuba, and South Yubarivers, respectively. The resulting dramatic increase insediment flux raised riverbed elevations as much as 40 m
Figure 1. Map of the Yuba River watershed showing the location of dams and gauging stationsmentioned in the text and tables. Abbreviations for gauging station labeling are MYSJ, Middle YubaRiver near North San Juan (U.S. Geological Survey station 11410000); YC, Yuba River below newColgate Powerplant (11413700); SYJB, South Yuba River at Jones Bar (11417500); YE, Yuba Riverbelow Englebright Dam (11418000).
F04003 SNYDER ET AL.: RESERVOIR PROCESSES FROM STRATIGRAPHY
2 of 16
F04003
in parts of the Yuba watershed. Licensed hydraulic miningcontinued until 1950 [James, 2005]. Curtis et al. [2005]estimated that less than 10% of the sediment deposited inEnglebright Lake could be attributed to this small-scalehydraulic mining. Gilbert [1917] hypothesized that theremaining mining-derived bed sediment would migratedownstream as a wave over a timescale of approximately50 years. Working three quarters of a century after Gilbert,James [1993, 2005] and Curtis et al. [2005] found thatelevated sediment loads persisted in Sierra Nevada riversbecause large quantities of mining-derived sedimentremained stored in channels and tributaries, and behindsmall dams. James [1993, 2005] predicted an asymptoticdecline in bedload sediment transport rate in hydraulic-mining-impacted rivers over the 20th century and beyond.[7] In the first half of the 20th century, two dams were
built on the main stem Yuba River to trap sediment derivedfrom hydraulic mining operations (reviewed by James[2005]), so deposition would not increase flood risk down-stream. The first, Daguerre Point Dam, was completed in1906 and quickly filled with sediment [Hunerlach et al.,2004]. The second, Englebright Dam, was completed inDecember 1940 and is the focus of this study. EnglebrightDam was initially built in anticipation of a rejuvenatedhydraulic mining industry in the Yuba watershed, althoughlicensed hydraulic mining only occurred until about 1950[James, 2005]. It impounds a reservoir, Englebright Lake,which presently provides modest hydroelectric power gen-eration (two power plants totaling 30 MW) and recreation.[8] Small- to medium-size dams on the North Yuba,
Middle Yuba, and South Yuba rivers, Bullards Bar (nowNew Bullards Bar), Milton, and Lake Spaulding, respec-tively, probably trap most sediment delivered to them,reducing the effective drainage area for sediment deliveryto Englebright Lake to 1192 km2 (Table 1 and Figure 1)[Snyder et al., 2004c]. The hydrology of the upper YubaRiver system changed substantially with the completion ofNew Bullards Bar Dam (NBB) in 1970. This dam is thesecond tallest in California, and it inundated Bullards BarDam. This project impounded a reservoir managed tomaintain 2.1 � 108 m3 of flood storage from Novemberto March, resulting in significant changes to the Yuba Riverannual hydrograph (discussed below). Several other dams(Our House, Log Cabin; Table 1) and associated tunnelswere also built at this time to divert water from the MiddleYuba River to NBB. The 315-MW New Colgate PowerPlant (NCPP), located on themain stemYuba River (Figure 1),uses the hydraulic head created by NBB. Englebright Lake
presently acts as a reregulation facility (afterbay) for theYuba River, allowing the NCPP to generate power to meetpeak demand periods. As a result, the water level in thereservoir often fluctuates 1–2 m within a day and has aweekly fluctuation cycle in summer because of reduceddemand during weekends.
2.1. Englebright Lake Hydrologic History
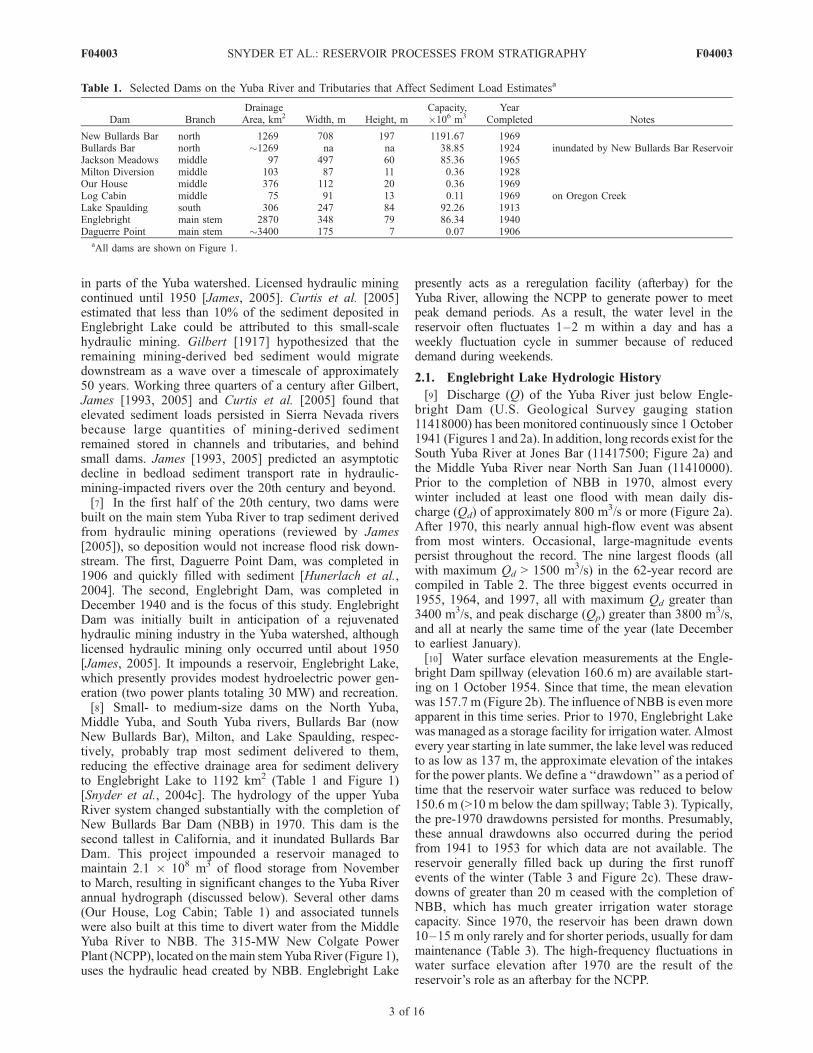
[9] Discharge (Q) of the Yuba River just below Engle-bright Dam (U.S. Geological Survey gauging station11418000) has been monitored continuously since 1 October1941 (Figures 1 and 2a). In addition, long records exist for theSouth Yuba River at Jones Bar (11417500; Figure 2a) andthe Middle Yuba River near North San Juan (11410000).Prior to the completion of NBB in 1970, almost everywinter included at least one flood with mean daily dis-charge (Qd) of approximately 800 m3/s or more (Figure 2a).After 1970, this nearly annual high-flow event was absentfrom most winters. Occasional, large-magnitude eventspersist throughout the record. The nine largest floods (allwith maximum Qd > 1500 m3/s) in the 62-year record arecompiled in Table 2. The three biggest events occurred in1955, 1964, and 1997, all with maximum Qd greater than3400 m3/s, and peak discharge (Qp) greater than 3800 m3/s,and all at nearly the same time of the year (late Decemberto earliest January).[10] Water surface elevation measurements at the Engle-
bright Dam spillway (elevation 160.6 m) are available start-ing on 1 October 1954. Since that time, the mean elevationwas 157.7 m (Figure 2b). The influence of NBB is even moreapparent in this time series. Prior to 1970, Englebright Lakewas managed as a storage facility for irrigation water. Almostevery year starting in late summer, the lake level was reducedto as low as 137 m, the approximate elevation of the intakesfor the power plants. We define a ‘‘drawdown’’ as a period oftime that the reservoir water surface was reduced to below150.6 m (>10 m below the dam spillway; Table 3). Typically,the pre-1970 drawdowns persisted for months. Presumably,these annual drawdowns also occurred during the periodfrom 1941 to 1953 for which data are not available. Thereservoir generally filled back up during the first runoffevents of the winter (Table 3 and Figure 2c). These draw-downs of greater than 20 m ceased with the completion ofNBB, which has much greater irrigation water storagecapacity. Since 1970, the reservoir has been drawn down10–15 m only rarely and for shorter periods, usually for dammaintenance (Table 3). The high-frequency fluctuations inwater surface elevation after 1970 are the result of thereservoir’s role as an afterbay for the NCPP.
Table 1. Selected Dams on the Yuba River and Tributaries that Affect Sediment Load Estimatesa
Dam BranchDrainageArea, km2 Width, m Height, m
Capacity,�106 m3
YearCompleted Notes
New Bullards Bar north 1269 708 197 1191.67 1969Bullards Bar north �1269 na na 38.85 1924 inundated by New Bullards Bar ReservoirJackson Meadows middle 97 497 60 85.36 1965Milton Diversion middle 103 87 11 0.36 1928Our House middle 376 112 20 0.36 1969Log Cabin middle 75 91 13 0.11 1969 on Oregon CreekLake Spaulding south 306 247 84 92.26 1913Englebright main stem 2870 348 79 86.34 1940Daguerre Point main stem �3400 175 7 0.07 1906
aAll dams are shown on Figure 1.
F04003 SNYDER ET AL.: RESERVOIR PROCESSES FROM STRATIGRAPHY
3 of 16
F04003
[11] During high flows, Englebright Lake discharges waterover its spillway. This occurred for much of each winter priorto 1970, but with much less frequency afterward due tostorage in New Bullards Bar Reservoir. Water surface eleva-tion can be more than 5 m above the top of the spillwayduring large floods (Figure 2b and Table 2). The maximumnonspilling Q (through the intakes of the two power plants at
the dam) is approximately 150 m3/s. Therefore this record ofreservoir outflow is a reasonable representation of totalreservoir inflow, particularly during high flows when thereservoir is managed as a run-of-the-river facility (sustainedQ > 150 m3/s must be discharged over the dam). However,differences between inflow and outflow might exist as thereservoir fills at the end of drawdowns. In summary, large
Figure 2. Englebright Lake discharge and water-surface elevation history. (a) Daily mean discharge(Qd) at the Yuba River below Englebright Dam gauge (USGS station 11418000), 1 October 1941 to30 September 2002. Also included are data from the South Yuba River at Jones Bar gauge (no dataavailable for water years 1949–1959). (b) Daily observations of water surface elevation at EnglebrightDam, water years 1955–2002. Prior to the completion of New Bullards Bar Dam in 1970, EnglebrightLake was lowered every fall for irrigation water supply. The minimum elevation (137 m) of thesedrawdowns was set by the elevation of the dam power plant intake pipes. Drawdowns since 1970 havebeen primarily for dam maintenance. Dashed lines are the dam spillway elevation (top) and mean watersurface elevation (bottom). (c) Detail version of Figure 2b showing water surface elevation data from theperiod of deep drawdowns for which data are available (1955–1970).
F04003 SNYDER ET AL.: RESERVOIR PROCESSES FROM STRATIGRAPHY
4 of 16
F04003
fluctuations in water surface elevation, from 8 m above themean to >20 m below the mean, have important implicationsto the emplacement of reservoir sediments in EnglebrightLake.
2.2. Previous Work in Englebright Lake
[12] A series of previous studies quantified the volumeand mass of sediment deposited behind Englebright Dam.Below, we give a brief summary of these results. Childs etal. [2003] compared a predam topographic map of the YubaRiver in the present location of Englebright Lake (from theU.S. Army Corps of Engineers) with an acoustic survey inMay 2001, to find that the reservoir accumulated 2.2 �107 m3 of material during the interval, or 26% of the originalcapacity. A deep coring campaign in 2002 collected 335 m ofsediment from 30 boreholes at 7 sites on the reservoir [Snyderet al., 2004b]. Cores frommultiple boreholes allowed Snyder
et al. [2004b] to obtain composite series of nearly continuoussubsamples at 6 of the 7 sites. Another report [Snyder et al.,2004a] presents grain size and organic content analyses ofthese subsamples. Snyder et al. [2004c] synthesized thesedata to estimate the mass (2.6 � 107 metric tons, t) and grainsize distribution (�65% sand and gravel) of the materialdeposited in the reservoir using two different methods forextrapolating from one-dimensional boreholes to the entire,three-dimensional reservoir deposit. One method assumedthat the layers in the composite borehole sections haveconstant thickness and lie parallel to the reservoir floor, whichis essentially an assumption that the reservoir fills from thebottom up. The other method varied the thickness of each unitwithin the cores in proportion to the total thickness of thereservoir deposit at each point along a transverse crosssection. In this study, we interpret these stratigraphic data to
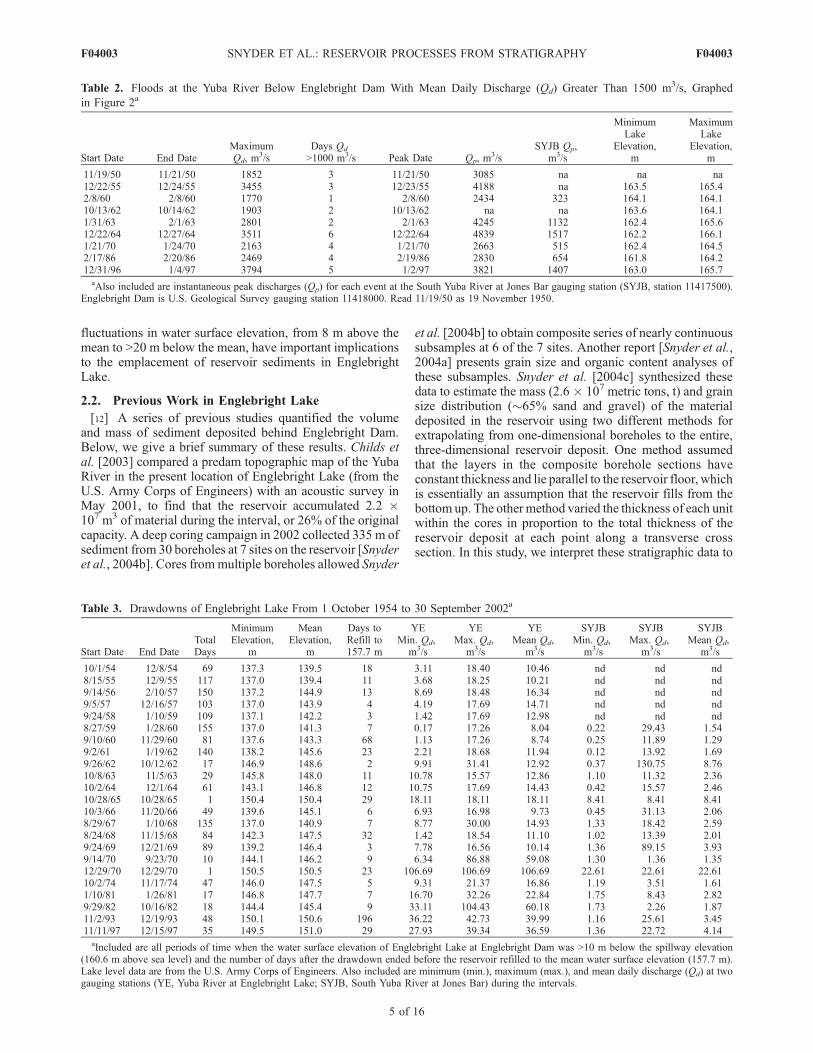
Table 2. Floods at the Yuba River Below Englebright Dam With Mean Daily Discharge (Qd) Greater Than 1500 m3/s, Graphed
in Figure 2a
Start Date End DateMaximumQd, m
3/sDays Qd
>1000 m3/s Peak Date Qp, m3/s
SYJB Qp,m3/s
MinimumLake
Elevation,m
MaximumLake
Elevation,m
11/19/50 11/21/50 1852 3 11/21/50 3085 na na na12/22/55 12/24/55 3455 3 12/23/55 4188 na 163.5 165.42/8/60 2/8/60 1770 1 2/8/60 2434 323 164.1 164.110/13/62 10/14/62 1903 2 10/13/62 na na 163.6 164.11/31/63 2/1/63 2801 2 2/1/63 4245 1132 162.4 165.612/22/64 12/27/64 3511 6 12/22/64 4839 1517 162.2 166.11/21/70 1/24/70 2163 4 1/21/70 2663 515 162.4 164.52/17/86 2/20/86 2469 4 2/19/86 2830 654 161.8 164.212/31/96 1/4/97 3794 5 1/2/97 3821 1407 163.0 165.7aAlso included are instantaneous peak discharges (Qp) for each event at the South Yuba River at Jones Bar gauging station (SYJB, station 11417500).
Englebright Dam is U.S. Geological Survey gauging station 11418000. Read 11/19/50 as 19 November 1950.
Table 3. Drawdowns of Englebright Lake From 1 October 1954 to 30 September 2002a
Start Date End DateTotalDays
MinimumElevation,
m
MeanElevation,
m
Days toRefill to157.7 m
YEMin. Qd,
m3/s
YEMax. Qd,
m3/s
YEMean Qd,
m3/s
SYJBMin. Qd,
m3/s
SYJBMax. Qd,
m3/s
SYJBMean Qd,
m3/s
10/1/54 12/8/54 69 137.3 139.5 18 3.11 18.40 10.46 nd nd nd8/15/55 12/9/55 117 137.0 139.4 11 3.68 18.25 10.21 nd nd nd9/14/56 2/10/57 150 137.2 144.9 13 8.69 18.48 16.34 nd nd nd9/5/57 12/16/57 103 137.0 143.9 4 4.19 17.69 14.71 nd nd nd9/24/58 1/10/59 109 137.1 142.2 3 1.42 17.69 12.98 nd nd nd8/27/59 1/28/60 155 137.0 141.3 7 0.17 17.26 8.04 0.22 29.43 1.549/10/60 11/29/60 81 137.6 143.3 68 1.13 17.26 8.74 0.25 11.89 1.299/2/61 1/19/62 140 138.2 145.6 23 2.21 18.68 11.94 0.12 13.92 1.699/26/62 10/12/62 17 146.9 148.6 2 9.91 31.41 12.92 0.37 130.75 8.7610/8/63 11/5/63 29 145.8 148.0 11 10.78 15.57 12.86 1.10 11.32 2.3610/2/64 12/1/64 61 143.1 146.8 12 10.75 17.69 14.43 0.42 15.57 2.4610/28/65 10/28/65 1 150.4 150.4 29 18.11 18.11 18.11 8.41 8.41 8.4110/3/66 11/20/66 49 139.6 145.1 6 6.93 16.98 9.73 0.45 31.13 2.068/29/67 1/10/68 135 137.0 140.9 7 8.77 30.00 14.93 1.33 18.42 2.598/24/68 11/15/68 84 142.3 147.5 32 1.42 18.54 11.10 1.02 13.39 2.019/24/69 12/21/69 89 139.2 146.4 3 7.78 16.56 10.14 1.36 89.15 3.939/14/70 9/23/70 10 144.1 146.2 9 6.34 86.88 59.08 1.30 1.36 1.3512/29/70 12/29/70 1 150.5 150.5 23 106.69 106.69 106.69 22.61 22.61 22.6110/2/74 11/17/74 47 146.0 147.5 5 9.31 21.37 16.86 1.19 3.51 1.611/10/81 1/26/81 17 146.8 147.7 7 16.70 32.26 22.84 1.75 8.43 2.829/29/82 10/16/82 18 144.4 145.4 9 33.11 104.43 60.18 1.73 2.26 1.8711/2/93 12/19/93 48 150.1 150.6 196 36.22 42.73 39.99 1.16 25.61 3.4511/11/97 12/15/97 35 149.5 151.0 29 27.93 39.34 36.59 1.36 22.72 4.14aIncluded are all periods of time when the water surface elevation of Englebright Lake at Englebright Dam was >10 m below the spillway elevation
(160.6 m above sea level) and the number of days after the drawdown ended before the reservoir refilled to the mean water surface elevation (157.7 m).Lake level data are from the U.S. Army Corps of Engineers. Also included are minimum (min.), maximum (max.), and mean daily discharge (Qd) at twogauging stations (YE, Yuba River at Englebright Lake; SYJB, South Yuba River at Jones Bar) during the intervals.
F04003 SNYDER ET AL.: RESERVOIR PROCESSES FROM STRATIGRAPHY
5 of 16
F04003
investigate the processes and history of sedimentation inEnglebright Lake.
3. Conceptual Model of Reservoir SedimentaryProcesses
[13] The overall morphology of the Englebright Lakedeposit is that of a classic lacustrine delta (Figure 3a) thatarises when sediment-laden river water enters a lake orreservoir. The dam can be viewed as a step in the river andthe reservoir as the backwater. In this section, we first
review the construction of a deltaic deposit, and thenconsider the importance of discharge and water level eventsrelevant to the specific case of Englebright Lake.[14] Deltas are common in the geologic record, with a
vast body of literature devoted to understanding the pro-cesses responsible for their emplacement. The classic pro-cess-oriented portrait of lacustrine deltas comes from thework of Gilbert [1890], who studied sediments deposited onthe margins of pluvial Lake Bonneville. According toGilbert’s model, river sediment that cannot remain insuspension in the lake (typically sand and gravel) is depos-
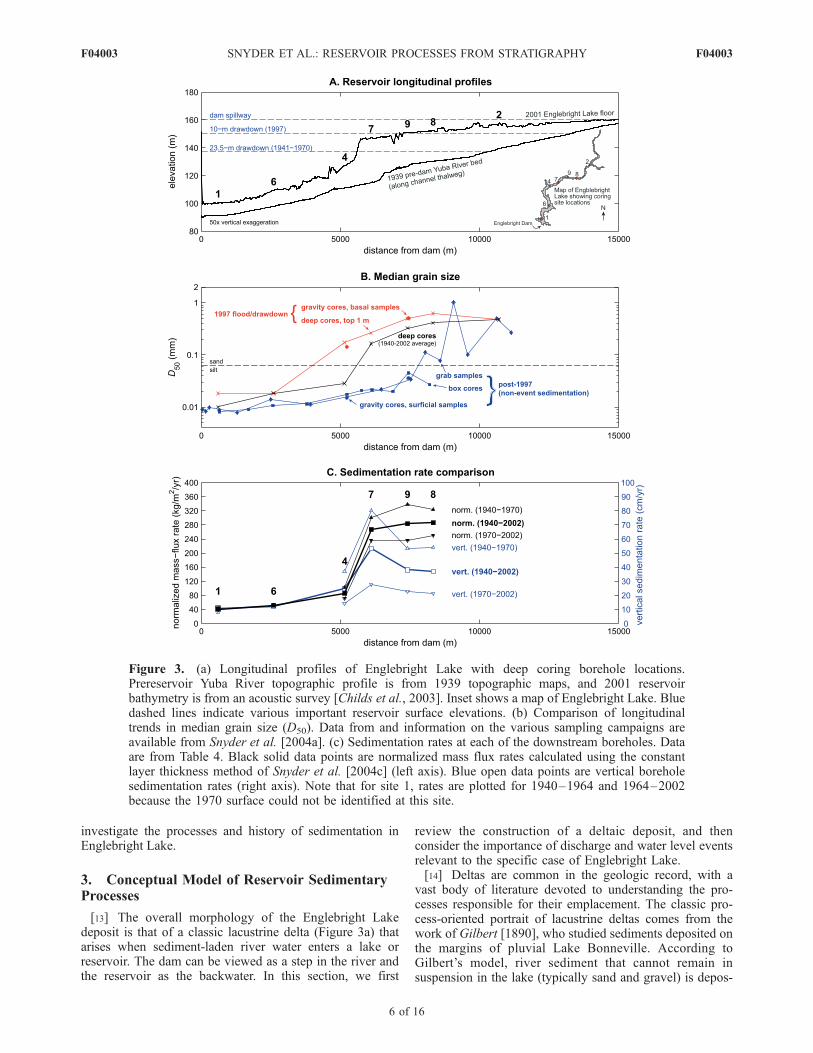
Figure 3. (a) Longitudinal profiles of Englebright Lake with deep coring borehole locations.Prereservoir Yuba River topographic profile is from 1939 topographic maps, and 2001 reservoirbathymetry is from an acoustic survey [Childs et al., 2003]. Inset shows a map of Englebright Lake. Bluedashed lines indicate various important reservoir surface elevations. (b) Comparison of longitudinaltrends in median grain size (D50). Data from and information on the various sampling campaigns areavailable from Snyder et al. [2004a]. (c) Sedimentation rates at each of the downstream boreholes. Dataare from Table 4. Black solid data points are normalized mass flux rates calculated using the constantlayer thickness method of Snyder et al. [2004c] (left axis). Blue open data points are vertical boreholesedimentation rates (right axis). Note that for site 1, rates are plotted for 1940–1964 and 1964–2002because the 1970 surface could not be identified at this site.
F04003 SNYDER ET AL.: RESERVOIR PROCESSES FROM STRATIGRAPHY
6 of 16
F04003
ited as a prograding foreset wedge. The model predicts aforeset slope at or near the angle of repose, because theclinoform advances by oversteepening and avalanching. Inpractice this situation is rare, with modification of theforeset slope, position and morphology by water levelchanges, plunging turbidity currents, slumping, and wave-induced erosion [Smith et al., 1960; Davis, 1983; Kostic etal., 2002].[15] The branches of the Yuba just above Englebright
Lake are single-channel, gravel bedded rivers. The mediangrain size (D50) of bed material on the main stem YubaRiver is 90.5 mm (99% gravel, 1% sand) and on the SouthYuba River it is 22.6 mm (72% gravel, 28% sand) [Snyderet al., 2004c; Curtis et al., 2006]. Therefore bed materialload in this system is gravel and sand, and washload is siltand clay. The bed material load divides roughly into bed-load (gravel and some coarse sand) and suspended load(sand).[16] We hypothesize the following simple portrait of
deposition in Englebright Lake: gravel deposits in the topsetregion; the prograding foreset wedge receives the bulk ofthe sand; and clay, silt, and fine sand settle out of suspen-sion in the bottomset region. The fine-grained material maytravel as either surface plumes or hyperpycnal turbiditycurrents [Gould, 1953; Weirich, 1984; Mulder and Syvitski,1995]. This conceptual model for downstream deposition isthen controlled by floods and drawdowns, which are likelythe events responsible for the emplacement of the stratigra-phy that we observe. During floods, water discharge (Q),total sediment transport rate (Qs), and the water level are allhigh. To some extent, these factors act in opposing ways.The high, turbid flow transports more and coarser sedimentfarther into the reservoir, both in suspension and along thebed, but the high water level shifts the upstream limit of thebackwater farther upstream, which might inhibit down-stream transport. During drawdowns, Q and the water levelare low, but the low water level exposes previously depos-ited material in the topset region making it susceptible toerosion by the river flow, thereby making Qs high fromscavenged topset sediment. In section 4 we evaluate theobserved stratigraphy of Englebright Lake in the context ofthe history of floods and drawdowns (Figure 2). In section 5we use simple process-based calculations to explore therelative sediment transport capacities of floods and draw-downs.
4. Reservoir Stratigraphy and Geochronology
4.1. Recent Depositional Patterns in Englebright Lake
[17] The top �1 m of the reservoir deposit in 2002,sampled with grab samplers, deep cores, box cores, andgravity cores [Snyder et al., 2004a, 2004b, 2004c] providesa means to analyze longitudinal changes in sedimentationpatterns in the context of the well-constrained recent hy-drologic history of the reservoir. The uppermost sediments(5–15 cm thick) were sampled best by gravity and boxcores collected in October 2002, and grab samples collectedin April 2002 (blue data points on Figure 3b). Thesesamples are most likely representative of sedimentationpatterns during the years from 1998 to 2002, which includedno significant floods or drawdowns (Figure 2). Duringquiescent periods, the upstream end of the reservoir back-
water is around the confluence of the main stem Yuba andSouth Yuba rivers, 10.8 km upstream from the dam (deepcoring site 2; Figure 3a). The surficial deposits include clay,silt and fine sand particles throughout. Particles coarser than�0.25 mm deposit only in the upstream part of thereservoir. The downstream-fining trend is steep and variablein the upstream section: in the interval from �11 km to�7.5 km from the dam, median grain size (D50) declinesfrom >1 mm to �0.03 mm (Figure 3b). In contrast, D50
varies relatively little in the downstream section (0.008–0.05 mm), with no obvious scaling break at the delta front(Figure 3b). We interpret this pattern to be representative ofnonevent sedimentation, with two dominant modes oftransport active on two different sediment size populations:particles coarser than approximately 0.25–0.5 mm roll orsaltate along the bed and once delivered by the river aredeposited rapidly in the topset backwater area, and fines(<0.25 mm) settle out from suspension throughout thereservoir.[18] The most recent major depositional event sampled in
the reservoir was the major flood in January 1997 andsubsequent drawdown to 149.5 m elevation that exposed thetopset part of the reservoir deposit (Tables 2 and 3 andFigures 2 and 3a). Gravity cores collected near boreholesites 4 and 9 sampled a sandy layer underlying the surficialmud, and we interpret these along with samples from the top1 m of the deep cores to represent deposition during the1997 events (red data points on Figure 3b). In thesesamples, the transition from sand (D50 > 0.14 mm) to silt(D50 < 0.018 mm) occurs downstream of the present deltafront (<5000 m from the dam). Medium sand particles(>0.25 mm) are found only upstream of this transition.[19] Floods are clearly capable of transporting sand in
suspension throughout the delta topset and foreset region.This is indicated by fine- to medium-sand beaches depositedabove the dam spillway elevation in the topset part of thereservoir (>7000 m from the dam). This sand could only getto this elevation during floods, because waves generated inthe narrow reservoir are too small to transport sand metersabove the normal water surface. The elevation of thereservoir floor at the present-day delta front (�146 m)suggests that the drawdown to 149.5 m in 1997 may alsohave modified the deposit topset considerably (Figure 3aand Table 3). The prominent scour holes in the reservoirlongitudinal profile at a left bend just downstream fromdeep coring site 9 (�7 km upstream from the dam; Figure 3a)suggest that active fluvial processes modified the reservoirfloor through this area, most likely during the drawdownwhen this area would have been essentially at the upstreamend of the reservoir backwater.[20] Figure 3b also shows the long-term average grain
size pattern (1940–2002, from a weighted average of thedeep cores; black data points) and it is intermediate betweenthe post-1997 low-energy and 1997 event patterns. Thesegrain size distributions indicate that no material coarser than�0.25–0.5 mm deposits in the bottomset region, suggestingthat no flows are capable moving these grain sizes insuspension. We used the constant layer thickness methodof Snyder et al. [2004c] to extrapolate from the deep coresto the entire reservoir and assumed that the poorly charac-terized upstream part of the reservoir (above site 8, Figure 3)has the same grain size distribution within the sand fraction
F04003 SNYDER ET AL.: RESERVOIR PROCESSES FROM STRATIGRAPHY
7 of 16
F04003
as the downstream part (sites 1, 6, 4, 7, 9 and 8). On thebasis of these methods we estimate that roughly 30% of thetotal deposit (by mass) is coarser than 0.5 mm andtherefore only found in the topset and foreset deposits.The three temporal patterns of sedimentation indicated byFigure 3b suggest that the delta builds by (1) delivery ofmedium sand and coarser sediment to the foreset and topsetarea during floods, (2) modification of topset depositsduring drawdowns, and (3) retransport by flood and draw-down events of sediment temporarily stored in the topsetarea between events.
4.2. Overall Reservoir Sedimentology
[21] Snyder et al. [2004c] provide a brief, qualitativedescription of the overall reservoir stratigraphy. Here wereview and extend this presentation by placing the overallstratigraphy in the context of the history of floods anddrawdowns (Figure 2).[22] Near the dam, the most distal part of the deposit is up
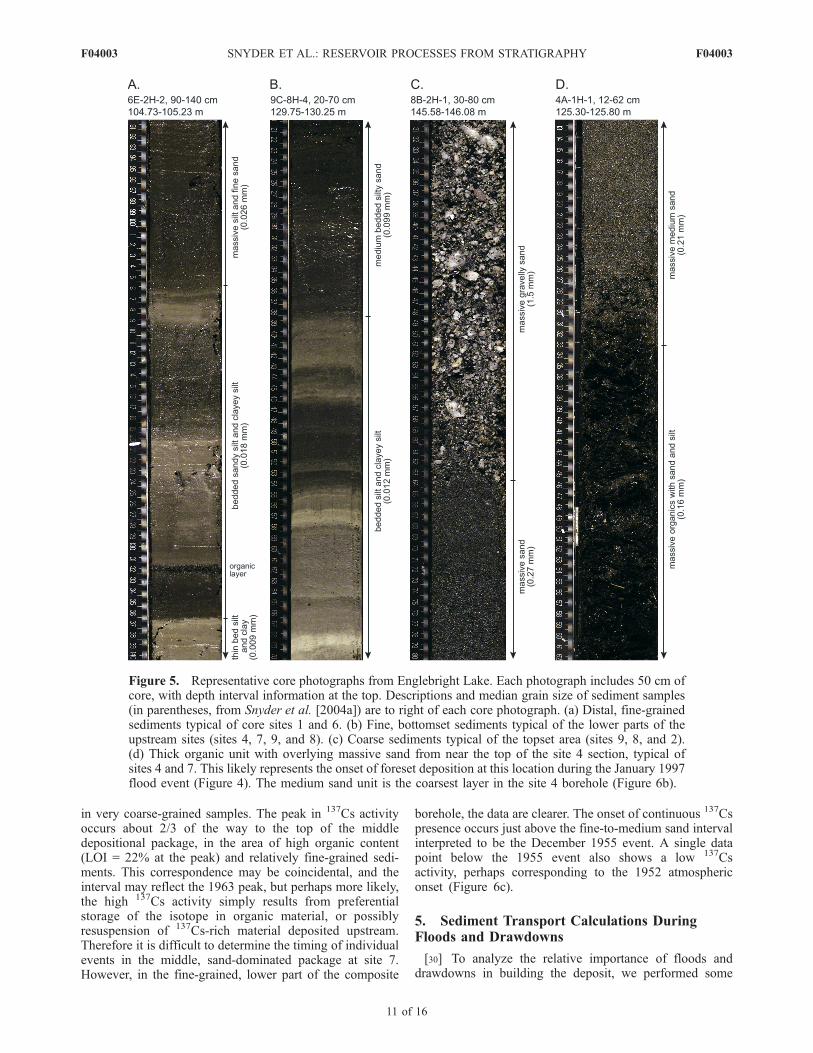
to 10 m thick (coring sites 1 and 6; Table 4 and Figures 4,5a, and 6a). The bottomset region is dominated by silt, andis relatively homogeneous overall, although individual bedsvary widely from thin (�1 mm) laminae to thick (�1 m)massive units. The thinner units are fine (silt and clay). Thethicker units are coarser (silt and fine sand), and usuallyshow some degree of normal grading, with more clay-richsediment near the top. Organic-rich layers (<1 cm thick) arecommon, particularly near the base of the thicker units. Weinterpret the thicker units containing fine sand as suspendedsediments deposited during large flood events by eithersurficial plumes or hyperpycnal flows. The thin, finer beds
are probably associated with settling of suspended sedi-ments during high flows and drawdowns.[23] In the more proximal part of the deposit (coring sites
9, 8 and 2; Figure 4), the deposit is up to 25 m thick andcoarsens upward. We were able to recover full boreholesections at sites 9 and 8, but not at site 2 [Snyder et al.,2004c]. The lower package of sediments is similar to that inthe distal part of the reservoir (Figure 5b and Table 4):dominated by silt, with thinner clayey beds, and thickerflood-related silt to fine sand beds (D50 = 0.01–0.1 mm),and comparatively high organic content (4–6% loss onignition (LOI) [Snyder et al., 2004a]). Where sampled, thispackage is about 7 m thick. We interpret this package asbottomset beds deposited early in the reservoir history whenthe delta front was upstream. The basal (<1 m) samples inboreholes 7, 9 and 8 are well-sorted medium sand [Snyder etal., 2004a], which we interpret to be one or more of thefollowing: sediment mobile within the borehole duringcoring, sediment deposited during the initial filling of thereservoir, or a prereservoir fluvial deposit. Because ofuncertainty in the true stratigraphic position of these sedi-ments, we excluded these samples from this analysis(Figure 4 and Table 4). The lower package coarsens up tothe middle package (Figure 5c), which is dominated by sandand gravel (D50 generally >0.2 mm, some units >2 mm),with minor silt. The middle package is �9 m thick, and hasgenerally low organic content (<4% LOI, with one excep-tion in site 8). We interpret the middle package as topsetsediments overlying foreset sediments emplaced by floodsand reworked by drawdowns. The coarse nature and topelevation (143–145 m) of the upper sediments of this
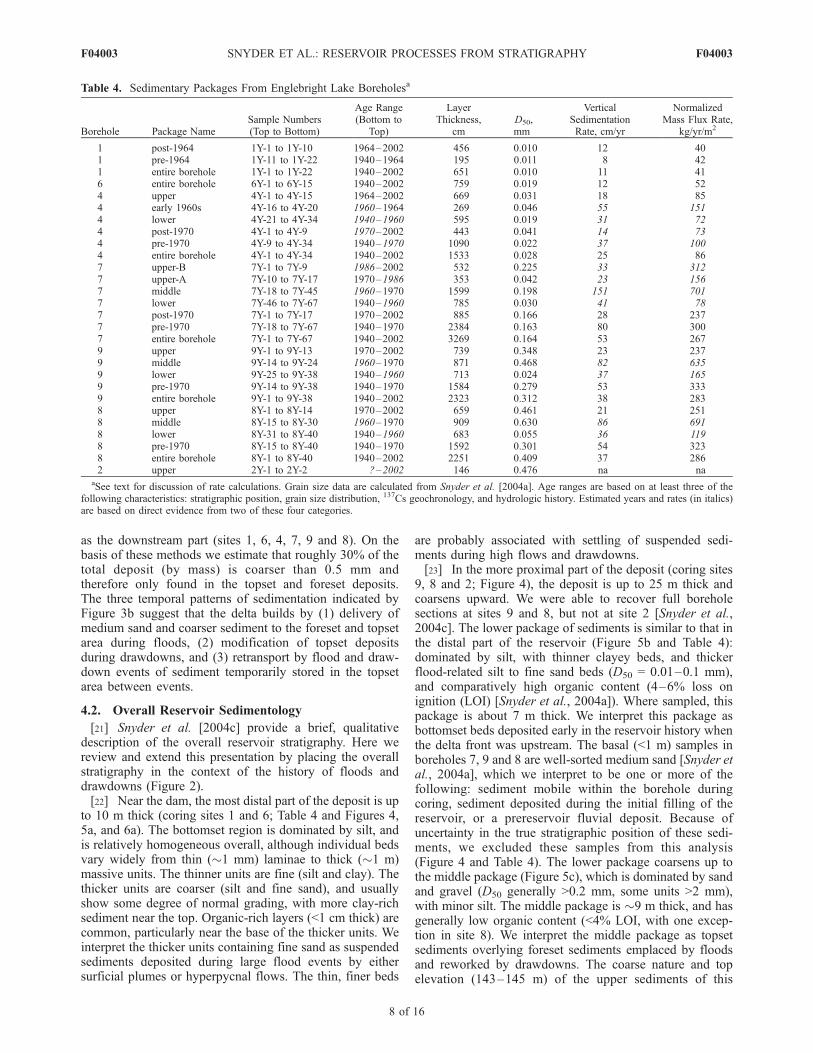
Table 4. Sedimentary Packages From Englebright Lake Boreholesa
Borehole Package NameSample Numbers(Top to Bottom)
Age Range(Bottom to
Top)
LayerThickness,
cmD50,mm
VerticalSedimentationRate, cm/yr
NormalizedMass Flux Rate,
kg/yr/m2
1 post-1964 1Y-1 to 1Y-10 1964–2002 456 0.010 12 401 pre-1964 1Y-11 to 1Y-22 1940–1964 195 0.011 8 421 entire borehole 1Y-1 to 1Y-22 1940–2002 651 0.010 11 416 entire borehole 6Y-1 to 6Y-15 1940–2002 759 0.019 12 524 upper 4Y-1 to 4Y-15 1964–2002 669 0.031 18 854 early 1960s 4Y-16 to 4Y-20 1960–1964 269 0.046 55 1514 lower 4Y-21 to 4Y-34 1940–1960 595 0.019 31 724 post-1970 4Y-1 to 4Y-9 1970–2002 443 0.041 14 734 pre-1970 4Y-9 to 4Y-34 1940–1970 1090 0.022 37 1004 entire borehole 4Y-1 to 4Y-34 1940–2002 1533 0.028 25 867 upper-B 7Y-1 to 7Y-9 1986–2002 532 0.225 33 3127 upper-A 7Y-10 to 7Y-17 1970–1986 353 0.042 23 1567 middle 7Y-18 to 7Y-45 1960–1970 1599 0.198 151 7017 lower 7Y-46 to 7Y-67 1940–1960 785 0.030 41 787 post-1970 7Y-1 to 7Y-17 1970–2002 885 0.166 28 2377 pre-1970 7Y-18 to 7Y-67 1940–1970 2384 0.163 80 3007 entire borehole 7Y-1 to 7Y-67 1940–2002 3269 0.164 53 2679 upper 9Y-1 to 9Y-13 1970–2002 739 0.348 23 2379 middle 9Y-14 to 9Y-24 1960–1970 871 0.468 82 6359 lower 9Y-25 to 9Y-38 1940–1960 713 0.024 37 1659 pre-1970 9Y-14 to 9Y-38 1940–1970 1584 0.279 53 3339 entire borehole 9Y-1 to 9Y-38 1940–2002 2323 0.312 38 2838 upper 8Y-1 to 8Y-14 1970–2002 659 0.461 21 2518 middle 8Y-15 to 8Y-30 1960–1970 909 0.630 86 6918 lower 8Y-31 to 8Y-40 1940–1960 683 0.055 36 1198 pre-1970 8Y-15 to 8Y-40 1940–1970 1592 0.301 54 3238 entire borehole 8Y-1 to 8Y-40 1940–2002 2251 0.409 37 2862 upper 2Y-1 to 2Y-2 ?–2002 146 0.476 na na
aSee text for discussion of rate calculations. Grain size data are calculated from Snyder et al. [2004a]. Age ranges are based on at least three of thefollowing characteristics: stratigraphic position, grain size distribution, 137Cs geochronology, and hydrologic history. Estimated years and rates (in italics)are based on direct evidence from two of these four categories.
F04003 SNYDER ET AL.: RESERVOIR PROCESSES FROM STRATIGRAPHY
8 of 16
F04003
Figure
4
F04003 SNYDER ET AL.: RESERVOIR PROCESSES FROM STRATIGRAPHY
9 of 16
F04003
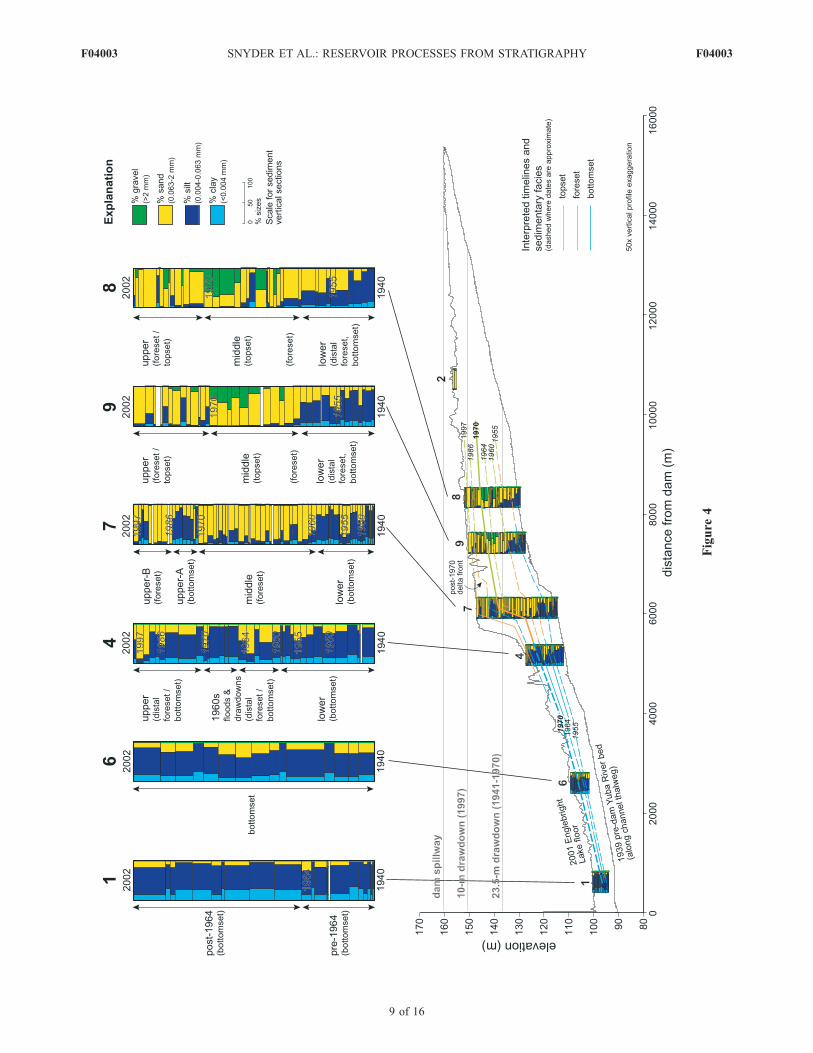
package suggests that it is a lag deposit from low-dischargedrawdowns to elevation >137 m that exposed and reworkedthe topset region. The uppermost sediments in the proximalregion are about 7 m thick and more variable, ranging fromsilt and fine sand to coarse sand and gravel (D50 �0.02 to>2 mm; <1–6% LOI). These sediments correspond toreorganization of depositional system in the post-1970regime without annual drawdowns.[24] The present location of the delta front, in the middle
part of the reservoir (sites 4 and 7; Figures 4, 6b, and 6c),marks the transition between sedimentation styles. Thethickest part of the deposit (33 m) was sampled at site 7.This location has a similar lower package of sediments tothat in the upstream part of the reservoir (Table 4; 8 m thick,D50 = 0.01–0.4 mm, 1–5% LOI). The middle package isquite thick (16 m) and is dominated by sand (D50 = 0.06–0.5 mm). LOI values are generally 1% to 4%, except for aseries of thick organic-rich units near the top of the package(9–27% LOI). At site 7, the upper package is clearly in twoparts: a fine-grained lower unit (3.5 m thick) and a moresand-rich upper unit (5 m thick). We interpret the lower unitto be bottomset sediments deposited by a post-1970 deltafront upstream, and the upper unit to be foreset and topsetdeposits from progradation of the current delta front. At thetoe of the present-day delta front, site 4 more closelyresembles the downstream, bottomset sections, with D50
from 0.01 mm to 0.06 mm, and relatively high organiccontent (3–8% LOI). This silt dominance is interrupted by afew massive, sand-rich, beds (D50 = 0.07–0.2 mm). Theseunits often overlie thick (<0.5 m) beds composed nearlyentirely of organic material such as branches and leaves(18–20% LOI; Figure 6b). We interpret the foreset strati-graphic relationship exemplified by Figure 5d as an eventsequence. During the rising limb of the flood hydrograph oras the reservoir water level drops during a drawdown, low-density plant material that has accumulated in the topsetregion during the quiescent period since the last event ismobilized and transported to the toe of the delta, where itconcentrates and deposits. During the peak of the hydro-graph (or later in the drawdown), medium sand (<0.5 mm)is transported and deposited at the delta front.
4.3. The 137Cs Geochronology
[25] Cesium 137 is a radioactive isotope whose presencein the atmosphere is the result of nuclear weapons testingand leakage from nuclear power plants. Cesium 137 has ahalf-life of 30.1 years, and sorbs easily onto the surfaces offine-grained sediment particles. Its atmospheric inventoryhas varied widely over the past 50 years, so 137Cs can beused as a dating technique in rivers and other depositionalsettings [e.g., Holmes, 2001; Chillrud et al., 2003]. Inparticular, the initial onset of detectable 137Cs in sediments(1952–1954) and the peak concentration (1963, just beforeatmospheric testing of nuclear weapons was prohibited) canbe identified if a given depth profile matches a known time
series of 137Cs concentration [Holmes, 2001]. Such analysesassume that the residence time of 137Cs in the watershedprior to deposition in the reservoir is short [Bonniwell et al.,1999]. We analyzed three of the composite borehole sec-tions (sites 1, 4 and 7) from Englebright Lake [Snyder et al.,2004b] for 137Cs concentration.[26] Subsampling of the deep cores for 137Cs analysis was
done over the same intervals of the composite boreholes asthe grain size and loss-on-ignition subsampling [Snyder etal., 2004a], but with greater frequency for sites 1 and 4. Wechose the sampling interval for each borehole to result inabout 60 analyses, corresponding to the number of yearssampled. Activity level of 137Cs was determined by gammaspectroscopy. The analyses were made with a Canberra low-energy germanium detector coupled to a multichannelanalyzer. Detector efficiency was calibrated using a NISTtraceable standard. All activities were decay corrected to thedate of sample collection. The samples were counted until<10% counting error was obtained.[27] Figure 6 shows the results of the 137Cs analyses.
Because the pre-1970 flood events in the Englebright record(Table 2 and Figure 2a) were followed by drawdownswithin the next year (Table 3 and Figures 2b and 2c), inthe interpretations below, layers associated with floodevents could also correspond to next drawdown. In otherwords, we assume short temporary storage of sediments inthe topset region prior to reworking by drawdowns. The137Cs activity is closely associated with fine sediments (siltand clay), so the curves are much easier to interpret in thebottomset part of the reservoir. Figure 6 also includes 137Csactivity normalized by percent silt and clay (<0.063 mm,blue data points).[28] Sites 1 and 4 show a clear peak in 137Cs activity,
which we interpret to correspond to the 1963 atmosphericpeak. In both cases, immediately overlying this peak is arelatively coarse-grained, massive unit (also with high137Cs) that we interpret to be the December 1964 floodevent (and/or the drawdown during the following fall). Theperiod between the onset of 137Cs in the atmosphere and thepeak (1952–1963) includes four large Yuba River floods(Figure 2 and Table 2). We can match thick silt and fine-sand deposits to each event below the 137Cs peak in the site4 composite section because of the greater sedimentationrate and coarser grain size in the more proximal setting. The348-cm interval includes 9 grain size and 16 137Cs samples(Figure 6b). Here, we are able to identify the early 1960sfloods and the December 1955 event. Unfortunately, at site1, this 106-cm interval corresponds to only 4 grain size and6 137Cs samples, with a 6-cm sampling gap (Figure 6a),hampering correlation of stratigraphy with events.[29] The 137Cs data in the thickest part of the reservoir
deposit (site 7) is more difficult to interpret because of thecorrelation of 137Cs activity with proportion of fine-grainedsediment and percent loss on ignition (Figure 6c). Thenormalization by percent fines likely overcorrects the data
Figure 4. Longitudinal cross section of Englebright Lake modified from Snyder and Hampton [2003] and Snyder et al.[2004c], with interpreted stratigraphy and depositional history. See Figure 6 and Table 4 for details of age interpretations.Tentative ages are italicized. Grain size sections are labeled with deep coring site numbers and are plotted on the profilerelative to the lake floor, consistent with the constant layer thickness extrapolation method used by Snyder et al. [2004c].Note that the vertical scale varies on the exploded sections. Details of the grain size distribution analysis and results areavailable from Snyder et al. [2004a].
F04003 SNYDER ET AL.: RESERVOIR PROCESSES FROM STRATIGRAPHY
10 of 16
F04003
in very coarse-grained samples. The peak in 137Cs activityoccurs about 2/3 of the way to the top of the middledepositional package, in the area of high organic content(LOI = 22% at the peak) and relatively fine-grained sedi-ments. This correspondence may be coincidental, and theinterval may reflect the 1963 peak, but perhaps more likely,the high 137Cs activity simply results from preferentialstorage of the isotope in organic material, or possiblyresuspension of 137Cs-rich material deposited upstream.Therefore it is difficult to determine the timing of individualevents in the middle, sand-dominated package at site 7.However, in the fine-grained, lower part of the composite
borehole, the data are clearer. The onset of continuous 137Cspresence occurs just above the fine-to-medium sand intervalinterpreted to be the December 1955 event. A single datapoint below the 1955 event also shows a low 137Csactivity, perhaps corresponding to the 1952 atmosphericonset (Figure 6c).
5. Sediment Transport Calculations DuringFloods and Drawdowns
[30] To analyze the relative importance of floods anddrawdowns in building the deposit, we performed some
Figure 5. Representative core photographs from Englebright Lake. Each photograph includes 50 cm ofcore, with depth interval information at the top. Descriptions and median grain size of sediment samples(in parentheses, from Snyder et al. [2004a]) are to right of each core photograph. (a) Distal, fine-grainedsediments typical of core sites 1 and 6. (b) Fine, bottomset sediments typical of the lower parts of theupstream sites (sites 4, 7, 9, and 8). (c) Coarse sediments typical of the topset area (sites 9, 8, and 2).(d) Thick organic unit with overlying massive sand from near the top of the site 4 section, typical ofsites 4 and 7. This likely represents the onset of foreset deposition at this location during the January 1997flood event (Figure 4). The medium sand unit is the coarsest layer in the site 4 borehole (Figure 6b).
F04003 SNYDER ET AL.: RESERVOIR PROCESSES FROM STRATIGRAPHY
11 of 16
F04003
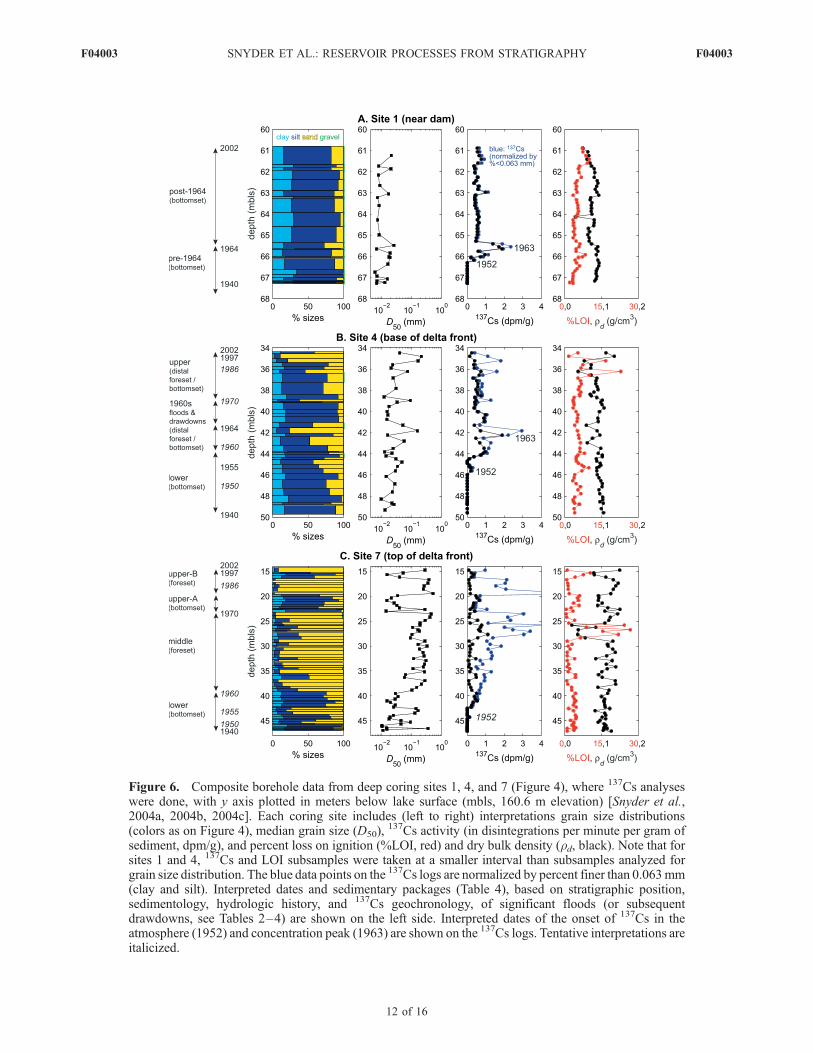
Figure 6. Composite borehole data from deep coring sites 1, 4, and 7 (Figure 4), where 137Cs analyseswere done, with y axis plotted in meters below lake surface (mbls, 160.6 m elevation) [Snyder et al.,2004a, 2004b, 2004c]. Each coring site includes (left to right) interpretations grain size distributions(colors as on Figure 4), median grain size (D50),
137Cs activity (in disintegrations per minute per gram ofsediment, dpm/g), and percent loss on ignition (%LOI, red) and dry bulk density (rd, black). Note that forsites 1 and 4, 137Cs and LOI subsamples were taken at a smaller interval than subsamples analyzed forgrain size distribution. The blue data points on the 137Cs logs are normalized by percent finer than 0.063mm(clay and silt). Interpreted dates and sedimentary packages (Table 4), based on stratigraphic position,sedimentology, hydrologic history, and 137Cs geochronology, of significant floods (or subsequentdrawdowns, see Tables 2–4) are shown on the left side. Interpreted dates of the onset of 137Cs in theatmosphere (1952) and concentration peak (1963) are shown on the 137Cs logs. Tentative interpretations areitalicized.
F04003 SNYDER ET AL.: RESERVOIR PROCESSES FROM STRATIGRAPHY
12 of 16
F04003
simple calculations of reservoir hydraulics and sedimenttransport. The procedure consists of first solving the mo-mentum equation for steady, nonuniform, gradually variedflow (i.e., the backwater equation [Henderson, 1966]):
dy
dx¼ So � Sf
1� Fr2; ð1Þ
where y is flow depth, x is longitudinal distance, So is bedslope, Sf is friction slope (from a uniform flow resistancerelation such as Manning or Chezy), and Fr is the Froudenumber (Fr = U2/gy, where U is average flow velocity andg is gravitational acceleration). Second, we compute theshear velocity for two conditions, one representative of floodconditions and one representative of drawdown conditions.The shear velocities in the reservoir are then compared withthe settling velocities for a range of grain sizes in order todetermine the approximate extent of suspended transport ofa given grain size, for each condition. A more detailedpicture of the depositional history and the role of floodsversus drawdowns could be obtained through rigorousnumerical modeling of the 60-year history of the reservoir.However, this type of analysis has some substantialobstacles, such as specifying the entire time series ofincoming sediment load by grain size, accurate prediction oftransport over mixed gravel-sand-silt beds, and dynamictransitions from washload to bed material load. Certainly,this would be a worthwhile future effort, particularly fortesting and improvement of process-based sedimentation
models, but it is not required here to address the basicquestion of the approximate relative importance of floodsand drawdowns.[31] We developed cross sections for the backwater
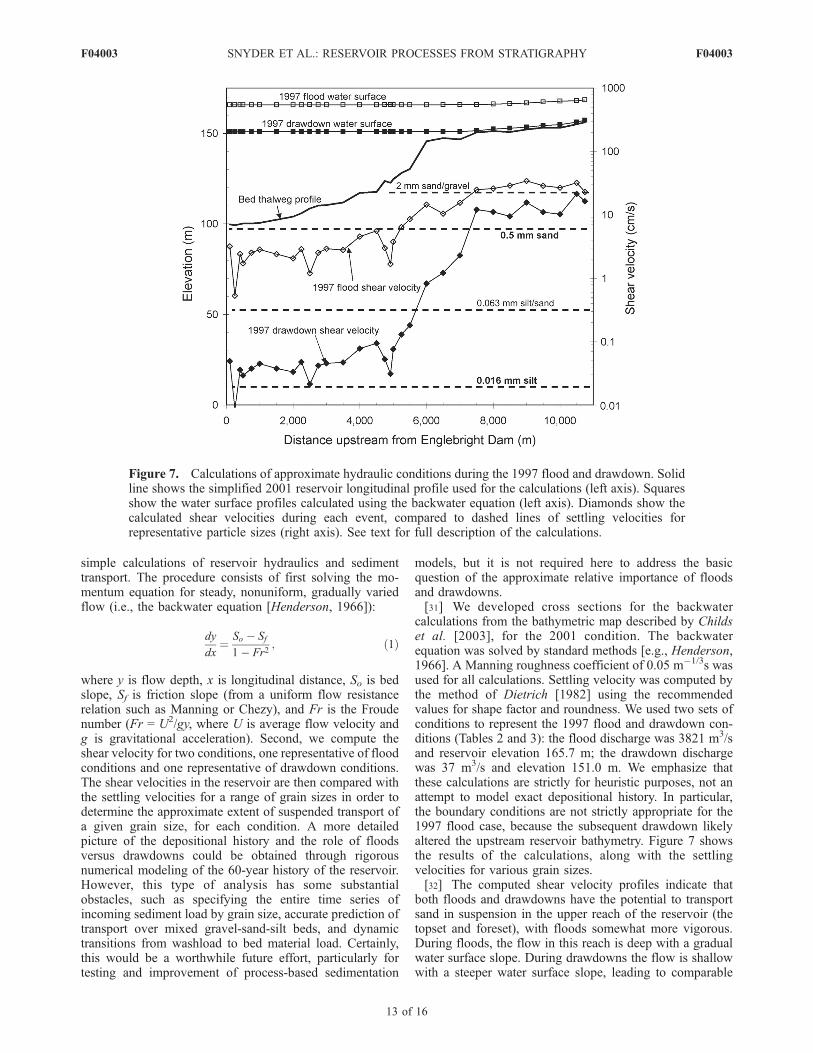
calculations from the bathymetric map described by Childset al. [2003], for the 2001 condition. The backwaterequation was solved by standard methods [e.g., Henderson,1966]. A Manning roughness coefficient of 0.05 m�1/3s wasused for all calculations. Settling velocity was computed bythe method of Dietrich [1982] using the recommendedvalues for shape factor and roundness. We used two sets ofconditions to represent the 1997 flood and drawdown con-ditions (Tables 2 and 3): the flood discharge was 3821 m3/sand reservoir elevation 165.7 m; the drawdown dischargewas 37 m3/s and elevation 151.0 m. We emphasize thatthese calculations are strictly for heuristic purposes, not anattempt to model exact depositional history. In particular,the boundary conditions are not strictly appropriate for the1997 flood case, because the subsequent drawdown likelyaltered the upstream reservoir bathymetry. Figure 7 showsthe results of the calculations, along with the settlingvelocities for various grain sizes.[32] The computed shear velocity profiles indicate that
both floods and drawdowns have the potential to transportsand in suspension in the upper reach of the reservoir (thetopset and foreset), with floods somewhat more vigorous.During floods, the flow in this reach is deep with a gradualwater surface slope. During drawdowns the flow is shallowwith a steeper water surface slope, leading to comparable
Figure 7. Calculations of approximate hydraulic conditions during the 1997 flood and drawdown. Solidline shows the simplified 2001 reservoir longitudinal profile used for the calculations (left axis). Squaresshow the water surface profiles calculated using the backwater equation (left axis). Diamonds show thecalculated shear velocities during each event, compared to dashed lines of settling velocities forrepresentative particle sizes (right axis). See text for full description of the calculations.
F04003 SNYDER ET AL.: RESERVOIR PROCESSES FROM STRATIGRAPHY
13 of 16
F04003
shear velocities. In this upper topset reach, shear velocitieseasily exceed the settling velocity for fine sands and indeedapproach the settling velocity for coarse sands; thus bothtypes of events have the potential to transport and reworksand in topset and foreset sections of the delta. The shortduration of floods (hours to days; Table 2) compared todrawdowns (weeks to months; Table 3) suggests thatalthough floods may initially transport much of the coarsesediment to the topset and foreset region, significantreworking and winnowing occurs during drawdowns. Thecombination of relatively low discharge (Q, Table 3) andlarge quantity of exposed sediment available for transportmeans that drawdowns sort topset sediments, with gravelpreferentially left behind, and sand deposited at the up-stream end of the backwater. Such reworking may havebeen particularly pronounced during higher discharges asthe reservoir filled at the end of deep drawdowns (Figure 2).[33] The calculations indicate that the effects of floods
and drawdowns differ downstream from the delta front.During drawdowns, the low discharge results in a gentlewater surface slope over the bottomset region, such thatshear velocities exceed the settling velocity for clay and finesilt, but not sand. These calculations suggest that reworkedtopset sand deposits directly at the delta front (i.e., the river-lake transition) and is not transported into the bottomsetarea during drawdowns. Therefore most of the fine sand inthe bottomset deposited during floods (Figure 4). Highdischarge during flood events leads to a steeper watersurface profile over the bottomset, and thus higher shearvelocities. Shear velocities exceed the settling velocity forfine sand throughout the reservoir under the modeled high-magnitude flood condition. Therefore the medium-sandforeset deposit shown in Figure 5d was probably emplacedduring the January 1997 flood, not the drawdown during thefollowing fall. This result is also consistent with theobservation that sand coarser than �0.5 mm is not depositeddownstream of the delta front (Figure 3b). Furthermore, thisresult suggests that transport of fine sediment through thereservoir and over Englebright Dam may be importantduring floods [Snyder et al., 2004c].
6. Discussion
6.1. Deltaic Deposition Patterns Before and After 1970
[34] Figure 4 shows our interpretation of the evolution ofthe reservoir deposit, using correlations of borehole chro-nologies based on hydrologic history, stratigraphic relation-ships, sedimentology and 137Cs analyses. We now discussthis history in the context of our understanding of reservoirdepositional processes derived by the sediment transportcalculations presented in the previous section. As mentionedin section 4.2, we interpret the overall reservoir deposit toreflect two phases of delta progradation and aggradation.We focus on these two phases because they are separated bya well-correlated layer in the stratigraphy in the foreset-topset coring sites that corresponds to important changes inwater management in the Yuba River system. The ages ofother surfaces or events are more tentative because of lackof 137Cs data or lower confidence in the interpretation of137Cs in coarse sediments.[35] During the period from 1940 to 1970, drawdowns of
the reservoir water surface to >137 m elevation during most
autumns imposed a lower base level on the reservoir system(Table 3; Figure 2). Initially, during deposition of the lowerpackage at deep coring sites 7, 9 and 8, the delta front wasupstream of site 8, so distal foreset fine sand only reachedthis area during floods (Figure 4), and bottomset-facies siltdominated this part of the reservoir. During the series offloods starting in 1955, and then in the early 1960s, the deltafront prograded to site 8, then sites 9 and 7, as indicated bythe onset of sand-dominated deposition (D50 > 0.1 mm;Figures 4 and 6c [see also Snyder et al., 2004a]). The steeppredam knickpoint on the Yuba River upstream of site 7meant that this part of the reservoir had more low-elevationvolume to fill with sediment. Therefore, once the delta frontprograded to this location the mode of deposition switchedto aggradation with the emplacement thick middle packageof foreset sand. During this time the topset part of theaggrading delta began to be exposed subaerially duringdrawdowns, causing winnowing of fine sand, silt and clayand emplacement of the gravel and coarse sand lag depositof the middle package. This coarsening upward sequence ofdeposits ended with the last deep drawdown (to 144.1 m) inSeptember 1970, or perhaps the deeper drawdown (to139.2 m) in 1969 (Table 3).[36] After 1970, the reservoir effectively had a higher
base level, dictated by less frequent, shorter duration draw-downs (Table 3). As mentioned in section 4.1, the 2001topset surface morphology likely reflects its exposure dur-ing the November–December 1997 drawdown, evidencedby the scour holes in the longitudinal profile downstream ofsite 9 (Figures 3a and 4). Between 1970 and coring in 2002,a second delta front prograded over the earlier deposits. Thisprocess is best seen in the upper package of the site 7stratigraphy, where foreset sand-dominated layers overliebottomset fine-grained sediments. The bottomset fines inthe upper package reflect a period when construction of asecond delta front confined coarse sand and gravel deposi-tion to a reach upstream of site 7. By perhaps the February1986 flood, foreset deposition resumed at this site. The1997 flood and drawdown probably caused foreset sand toprograde to and reoccupy the relict pre-1970 delta front.Presumably, subsequent floods will continue this deposi-tional pattern, unless the post-1970 regime of drawdowns toelevation 145–150 m every �5 years changes significantly.[37] We now consider a central question of dam sedimen-
tation studies: is the stratigraphic record provided by reser-voir boreholes a faithful recorder of watershed hydrologichistory? If the answer to this question is ‘‘yes’’ for a givenstudy area, then one has the opportunity to use the stratig-raphy to connect sediment transport and deposition withflood magnitude and frequency relationships, a central goalin geomorphology [Wolman and Miller, 1960]. In the idealcase, individual reservoir flood deposits would recordhydrographs, either with a direct functional relationshipbetween grain size and discharge (fine-coarse-fine sequen-ces corresponding to rising-peak-falling limbs of floodhydrographs), or perhaps with sediment supply limitationleading to inverse grading [e.g., Rubin et al., 1998].However, if we cannot be certain that the reservoir stratig-raphy reflects the hydrology, then these correlations are lesslikely to be useful. Unfortunately, the history of drawdownsin many reservoirs (including Englebright Lake) adds com-plexity to the stratigraphic record, as deposits are reworked
F04003 SNYDER ET AL.: RESERVOIR PROCESSES FROM STRATIGRAPHY
14 of 16
F04003
after initial deposition (Figure 7). In the case of EnglebrightLake, eight of the nine largest floods were followed by adrawdown within the next year (assuming a 1951 draw-down, 1986 is the exception; Tables 2 and 3). This justifiesour gross correlations of coarse grain size with flood events,(e.g., December 1964, above the 1963 137Cs peak; Figure 6)because new coarse material available in the reservoir fromfloods would be quickly redeposited during drawdowns.Correlations based on sedimentology are likely most robustin the bottomset area, because calculations indicate that finesand reaches this region only during floods (Figure 7). Wecannot, however, make the longitudinal correlations be-tween borehole locations necessary to ask questions of thedeposit related to the mass and grain size of sedimentdeposited during a given flood event, or of the details ofthe sedimentary response to water level fluctuations before,during, and after a drawdown. Such correlations would beaided with images of the stratigraphy provided by seismicreflection or ground-penetrating radar, but applications ofthese techniques in Englebright Lake have been unsuccess-ful [Childs et al., 2003; Snyder et al., 2004c]. In spite of thelimitations mentioned above, the stratigraphic history pre-sented herein can be used in several important ways: (1) toinvestigate longer-term trends in watershed sediment trans-port rates (next section) and (2) to test process-basednumerical models of sedimentation in a complex deposi-tional environment (future work).
6.2. Reservoir Sedimentation Rates
[38] The history of reservoir infilling detailed aboveallows us to calculate sedimentation rates during specifictime intervals. The end of annual drawdowns in 1970 can beidentified with confidence in many of the coring sitesstudied. In other cases, a combination of stratigraphy,hydrology, and 137Cs geochronology allows us to date otherlayers (Table 4 and Figures 4 and 6). 1970 is the focus ofour investigation of sedimentation rates for two relatedreasons (Figure 3c). First, this time is associated withchanges in the pattern of sediment deposition within thereservoir, because of changes in drawdown frequency andduration. Second, completion of New Bullards Bar (NBB)Dam and associated water diversions probably resulted inchanges in sediment flux into the reservoir. For each datedsedimentary package, we calculate vertical sedimentationrates (Table 4). These estimates do not account for reservoirgeometry or changes in density in the reservoir, but providea rough basis for comparison, corresponding to the variablelayer thickness extrapolation method used by Snyder et al.[2004c].[39] To estimate normalized mass flux rates, we use the
constant layer thickness method Snyder et al. [2004c]because they argued this was more reasonable in theupstream part of the reservoir. We calculated mass fluxrates by first finding the average dry bulk density of thematerial sampled within a given time interval, weighted byvertical cross-sectional area of the interval. We then dividedthis by the total cross-sectional area, and multiplied theresult by the volume of material in the surrounding region toobtain a mass of sediment deposited within a given timeinterval in a region of the reservoir. Finally, we divided eachregional value by the surface area and the number of yearsto obtain a normalized mass flux rate (in kg/m2/yr; Table 4).
[40] Sedimentation rates have been approximately con-stant in the downstream part of the reservoir (site 1), butmore variable upstream of this site (Figure 3c and Table 4).In all of the sites affected by deltaic foreset and topsetprocesses (4, 7, 9, and 8), sedimentation rates declined since1970. The change is most pronounced in the vertical rates(average 61% decline); however, because these do notaccount for the increasing cross-sectional area availablefor deposition as the predam river valley infilled, theyshould overestimate the effect. The normalized mass fluxrates show less variation, but in every case sedimentationrate declined (average 25%).[41] This decline in sediment delivery to the coarser,
foreset and topset part of the reservoir deposit may reflecta variety of factors. First, mass flux to Englebright Lakefrom the Middle Yuba River watershed may have decreasedaround 1970 due to the construction of the Log Cabin andOur House diversion dams. These structures trap a modestamount of sediment (Table 1), and they have been dredgedperiodically since their construction. More importantly, theyalter the hydrology of the Middle Yuba River by divertingsignificant flow to NBB Reservoir for power generation.However, during floods, the dams clearly have significantsuspended sediment bypass [Curtis et al., 2006]. Second,NBB likely has greater trap efficiency than the smallerstructure it inundated, thereby decreasing the amount ofsediment delivered from the North Yuba River to Engle-bright Lake. Third, seven of the nine largest floods in thehistory of the reservoir occurred before the 1970 drawdown(Tables 2 and 3), so the period before 1970 may simplyhave had greater mass flux due to greater frequency oflarge-magnitude floods. Indeed, the period between 1955and 1970 (when six floods occurred) appears to haveparticularly elevated mass flux, although these estimatesare approximate (Table 4). Preliminary modeling by Flint etal. [2005] of upper Yuba River watershed flow and sedi-ment transport indicates elevated sediment loads during the1940–1970 period because of high peak flows during theperiod. This result is independent of changes in sedimentsources (which are not considered in the model), and is inspite of nearly equal annual precipitation and discharge forthe two periods. Finally, sediment flux in the Yuba Riversystem may be declining due to the length of time sincelarge-scale unregulated and small-scale regulated hydraulicmining activities stopped, as debris stored in channels iswinnowed [Gilbert, 1917; James, 1993; Curtis et al., 2005;James, 2005]. The observations support James’s model ofan asymptotic decline. Wright and Schoellhamer [2004]also observed a decline in sediment transport rates on theSacramento River (to which the Yuba is a tributary) overthe past 50 years. Most likely, some combination of thesefour factors is the cause of the observed decline in YubaRiver sediment load, but further study (e.g., sedimenttransport and trapping modeling, geochemical tracers ofmining debris) would be required to identify which aremost important.
7. Conclusions
[42] The record provided by cored sediments from Engle-bright Lake gives the opportunity to link observations ofreservoir stratigraphy with hydrologic history. We find that
F04003 SNYDER ET AL.: RESERVOIR PROCESSES FROM STRATIGRAPHY
15 of 16
F04003
the reservoir delta progrades by a combination of short-duration flood deposition and reworking during prolongedlow-flow drawdowns. Grain size analyses indicate that sandand gravel coarser than 0.25–0.5 mm is deposited in deltaforeset and topset beds, and finer sediment is deposited inbottomset beds, a result consistent with simple transportcalculations. Analysis of normalized mass flux rates indicatethat sediment deposition in the middle part of the reservoirdeclined approximately 25% between the first and second�30-year periods after the dam was built. We hypothesizethat this decline reflects a combination of flood history,changes in water management, and ongoing winnowing of19th century hydraulic mining debris. This apparent declinein sediment load has important implications for futurewatershed and dam management plans, as well as sedimentdelivery to the Sacramento River delta system in general.
[43] Acknowledgments. The authors wish to thank the followingpeople for assistance in the field and laboratory: Margaret Hampton (USGS,Santa Cruz); Connie Clapton, Jennifer Curtis, Michael Hunerlach,Benjamin Wilkins (USGS, Sacramento); Brian Haskell (University ofMinnesota); Kevin Knutson (USGS, Portland); James Allen, Carlin Dare,Heather Harms, Andrew Matthew, Mark Marvin-DiPasquale, GarySchneider, Helen Tai, Michael Torresan, Ryan Wooley (USGS, MenloPark); and the staffs of DOSECC Incorporated and Skipper’s Cove Marina.We also thank Ralph Johonnot of the U.S. Army Corps of Engineers inSacramento for providing reservoir water level data. This work was fundedby the California Bay-Delta Authority (CALFED) Ecosystem RestorationProgram and a CALFED Science Fellows Program award to N.P.S. Thismanuscript benefited from thoughtful comments by Rebecca Ambers, ananonymous reviewer, an anonymous JGR associate editor, and USGSinternal reviewers Amy Draut and David Twichell (on an earlier draft).
ReferencesAmbers, R. K. R. (2001), Using the sediment record in a western Oregonflood-control reservoir to assess the influence of storm history and log-ging on sediment yield, J. Hydrol., 244, 181–200.
Bonniwell, E. C., G. Matisoff, and P. J. Whiting (1999), Determining thetimes and distances of particle transport in a mountain stream using fall-out radionuclides, Geomorphology, 27, 75–92.
Childs, J. R., N. P. Snyder, and M. A. Hampton (2003), Bathymetricand geophysical surveys of Englebright Lake, Yuba-Nevada Counties,California, U.S. Geol. Surv. Open File Rep., 03–383, 20 pp. (Availableat http://geopubs.wr.usgs.gov/open-file/of03-383/)
Chillrud, S. N., S. Hemming, E. L. Shuster, H. J. Simpson, R. F. Bopp, J. M.Ross, D. C. Pederson, D. A. Chaky, L.-R. Tolley, and F. Estabrooks(2003), Stable lead isotopes, contaminant metals and radionuclides inupper Hudson River sediment cores: Implications for improved timestratigraphy and transport processes, Chem. Geol., 199, 53–70.
Curtis, J. A., L. E. Flint, C. N. Alpers, and S. M. Yarnell (2005), Conceptualmodel of sediment processes in the upper Yuba River watershed, SierraNevada, CA, Geomorphology, 68, 149–166.
Curtis, J. A., L. E. Flint, C. N. Alpers, S. A. Wright, and N. P. Snyder(2006), Use of sediment rating curves and optical backscatter data tocharacterize sediment transport in the upper Yuba River watershed,California, 2001–03, U.S. Geol. Surv. Sci. Invest. Rep., 2005-5246,74 pp. (Available at http://pubs.usgs.gov/sir/2005/5246/)
Davis, R. A., Jr. (1983), Depositional Systems, Prentice-Hall, Upper SaddleRiver, N. J.
Dietrich, W. E. (1982), Settling velocity of natural particles, Water Resour.Res., 18(6), 1615–1626.
Flint, L. E., J. R. Guay, A. L. Flint, and M. Dettinger (2005), Influence ofclimate on flow and sediment transport in the Upper Yuba River Basin,paper presented at Lower American River Watershed Conference, Calif.State Univ., Sacramento.
Gardner, J. V., L. A. Mayer, and J. E. Hughs Clarke (2000), Morphologyand processes in Lake Tahoe (California-Nevada), Geol. Soc. Am. Bull.,112(5), 736–746.
Gilbert, G. K. (1890), Lake Bonneville, Monogr. 1, 438 pp., U.S. Geol.Surv., Reston, Va.
Gilbert, G. K. (1917), Hydraulic-mining debris in the Sierra Nevada, U.S.Geol. Surv. Prof. Pap., 105, 154 pp.
Gould, H. R. (1953), Lake Mead sedimentation, doctoral thesis, Univ. ofSouth. Calif., Los Angeles.
Graf, W. L. (1999), Dam nation: A geographic census of American damsand their large-scale hydrologic impacts, Water Resour. Res., 35(4),1305–1311.
Henderson, F. M. (1966), Open Channel Flow, 522 pp., Macmillan, NewYork.
Holmes, C. W. (2001), Short-lived isotopic chronometers: A means of mea-suring decadal sedimentary dynamics, Rep. FS73-98, U.S. Geol. Surv.,Reston, Va. (Available at http://sofia.usgs.gov/publications/fs/73-98/print.html)
Hunerlach, M. P., C. N. Alpers, M. C. Marvin-DiPasquale, H. E. Taylor,and J. F. De Wild (2004), Geochemistry of fluvial sediment impoundedbehind Daguerre Point Dam, Yuba River, California, U.S. Geol. Surv. Sci.Invest. Rep., 2004-5165, 66 pp. (Available at http://water.usgs.gov/pubs/sir/2004/5165/)
James, L. A. (1993), Sustained reworking of hydraulic mining sediment inCalifornia: G. K. Gilbert’s sediment wave model reconsidered, Z. Geo-morphol. Suppl., 88, 49–66.
James, L. A. (2005), Sediment from hydraulic mining detained by Engleb-right and small dams in the Yuba Basin, Geomorphology, 71, 202–226.
Kostic, S., G. Parker, and J. G. Marr (2002), Role of turbidity currents insetting the foreset slope of clinoforms prograding into standing freshwater, J. Sediment. Res., 72(3), 353–362.
Mulder, T., and J. P. M. Syvitski (1995), Turbidity currents generated atrivers mouths during exceptional discharges to the world oceans, J. Geol.,103, 285–299.
Nilsson, C., C. A. Reidy, M. Dynesius, and C. Revenga (2005), Fragmenta-tion and flow regulation of the world’s large river systems, Science, 308,405–408.
Rubin, D. M., J. M. Nelson, and D. J. Topping (1998), Relation of inverselygraded deposits to suspended-sediment grain-size evolution during the1996 flood experiment in Grand Canyon, Geology, 26(2), 99–102.
Smith, W. O., et al. (1960), Comprehensive survey of sedimentation in LakeMead, 1948–49, U.S. Geol. Surv. Prof. Pap., 295, 254 pp.
Snyder, N. P., and M. A. Hampton (2003), Preliminary cross section ofEnglebright Lake sediments, U.S. Geol. Surv. Open File Rep., 03-397.(Available at http://geopubs.wr.usgs.gov/open-file/of03-397/)
Snyder, N. P., J. R. Allen, C. Dare, M. A. Hampton, G. Schneider, R. J.Wooley, C. N. Alpers, and M. C. Marvin-DiPasquale (2004a), Sedimentgrain-size and loss-on-ignition analyses from 2002 Englebright Lakecoring and sampling campaigns, U.S. Geol. Surv. Open File Rep.,2004-1080, 46 pp. (Available at http://pubs.usgs.gov/of/2004/1080/)
Snyder, N. P., C. N. Alpers, J. A. Curtis, L. E. Flint, M. A. Hampton, B. J.Haskell, and D. Nielson (2004b), Report on the May-June 2002 Engleb-right Lake deep coring campaign, U.S. Geol. Surv. Open File Rep., 2004-1061, 32 pp. (Available at http://pubs.usgs.gov/of/2004/1061/)
Snyder, N. P., D. M. Rubin, C. N. Alpers, J. R. Childs, J. A. Curtis, L. E.Flint, and S. A. Wright (2004c), Estimating accumulation rates and phy-sical properties of sediment behind a dam: Englebright Lake, Yuba River,northern California, Water Resour. Res., 40, W11301, doi:10.1029/2004WR003279.
Syvitski, J. P. M., C. J. Vorosmarty, A. J. Kettner, and P. Green (2005),Impact of humans on the flux of terrestrial sediment to the global coastalocean, Science, 308, 376–380.
Twichell, D. C., V. A. Cross, A. D. Hanson, B. J. Buck, J. G. Zybala, andM. J. Rudin (2005), Seismic architecture and lithofacies of turbidites inLake Mead (Arizona and Nevada, USA): An analogue for topographi-cally complex basins, J. Sediment. Res., 75(1), 134–148.
Weirich, F. H. (1984), Turbidity currents: Monitoring their occurrence andmovement with a three-dimensional sensor network, Science, 224,384–387.
Wolman, M. G., and J. P. Miller (1960), Magnitude and frequency of forcesin geomorphic processes, J. Geol., 68, 54–74.
Wright, S. A., and D. H. Schoellhamer (2004), Trends in the sediment yieldof the Sacramento River, California, 1957–2001, San Francisco EstuaryWatershed Sci., 2(2), Article 2.
�����������������������C. N. Alpers and L. E. Flint, USGS, Placer Hall, 6000 J Street,
Sacramento, CA 95819, USA.C. W. Holmes, USGS, 600 4th Street South, St. Petersburg, FL 33701,
USA.D. M. Rubin, USGS, 400 Natural Bridges Drive, Santa Cruz, CA 95060,
USA.N. P. Snyder, Department of Geology and Geophysics, Boston
College, 140 Commonwealth Avenue, Chestnut Hill, MA 02467, USA.([email protected])S. A. Wright, USGS, 2255 North Gemini Drive, Flagstaff, AZ 86001,
USA.
F04003 SNYDER ET AL.: RESERVOIR PROCESSES FROM STRATIGRAPHY
16 of 16
F04003