record quarterly earnings - singapore exchange
TRANSCRIPT
Disclaimer: The information contained in this document is intended only for use during the presentation and should not be disseminated or distributed to parties outside the presentation.
DBS Bank accepts no liability whatsoever with respect to the use of this document or its contents.
Record first-half earnings
DBS Group Holdings
2Q 2017 financial results
August 4, 2017
Highlights
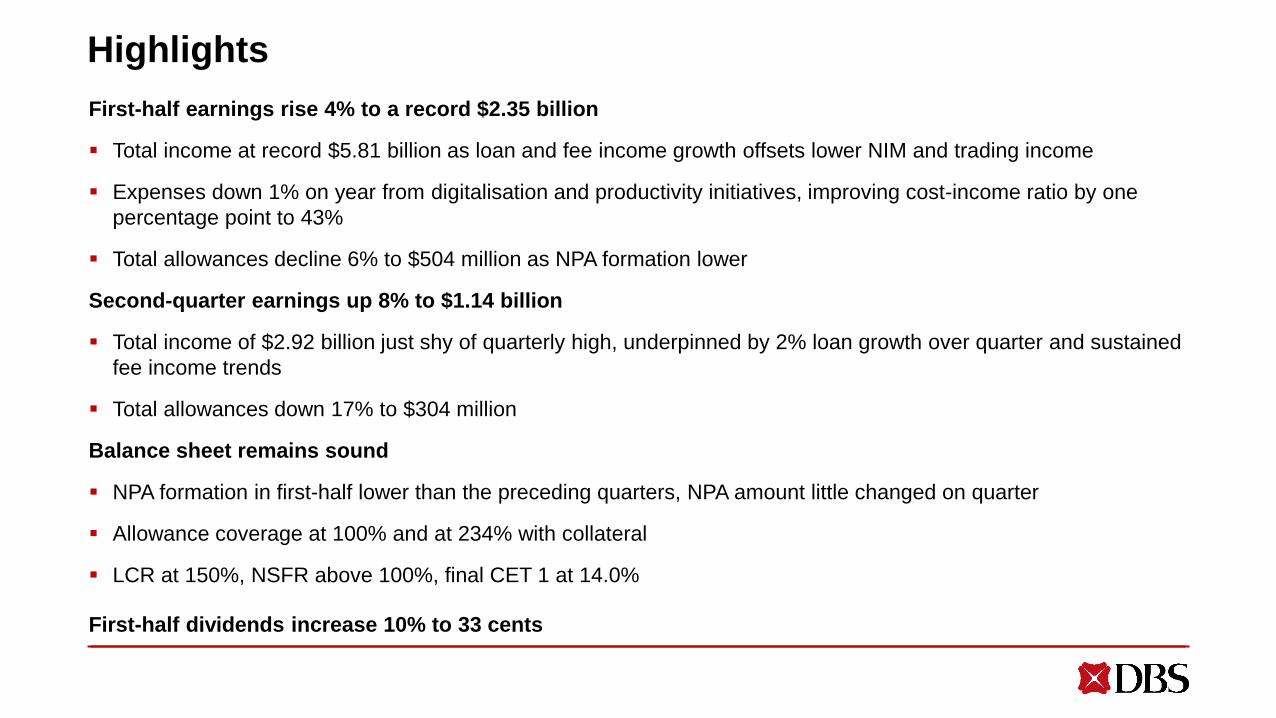
First-half earnings rise 4% to a record $2.35 billion
Total income at record $5.81 billion as loan and fee income growth offsets lower NIM and trading income
Expenses down 1% on year from digitalisation and productivity initiatives, improving cost-income ratio by one
percentage point to 43%
Total allowances decline 6% to $504 million as NPA formation lower
Second-quarter earnings up 8% to $1.14 billion
Total income of $2.92 billion just shy of quarterly high, underpinned by 2% loan growth over quarter and sustained
fee income trends
Total allowances down 17% to $304 million
Balance sheet remains sound
NPA formation in first-half lower than the preceding quarters, NPA amount little changed on quarter
Allowance coverage at 100% and at 234% with collateral
LCR at 150%, NSFR above 100%, final CET 1 at 14.0%
First-half dividends increase 10% to 33 cents
3
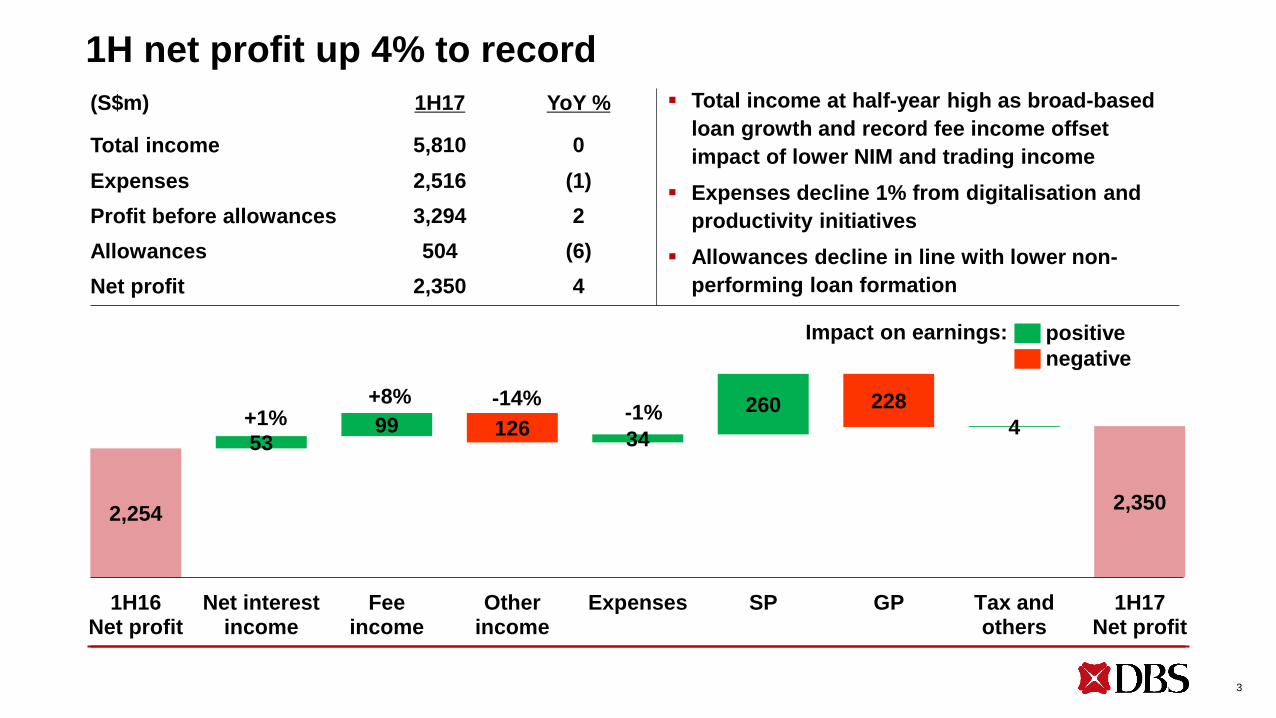
1H net profit up 4% to record
Total income at half-year high as broad-based
loan growth and record fee income offset
impact of lower NIM and trading income
Expenses decline 1% from digitalisation and
productivity initiatives
Allowances decline in line with lower non-
performing loan formation
(S$m) 1H17 YoY %
Total income 5,810 0
Expenses 2,516 (1)
Profit before allowances 3,294 2
Allowances 504 (6)
Net profit 2,350 4
2,254 2,350
53 99
34
260 4 126
228
1H16Net profit
Net interestincome
Feeincome
Otherincome
Expenses SP GP Tax andothers
1H17Net profit
negative
positiveImpact on earnings:
+1%+8%
-1%-14%
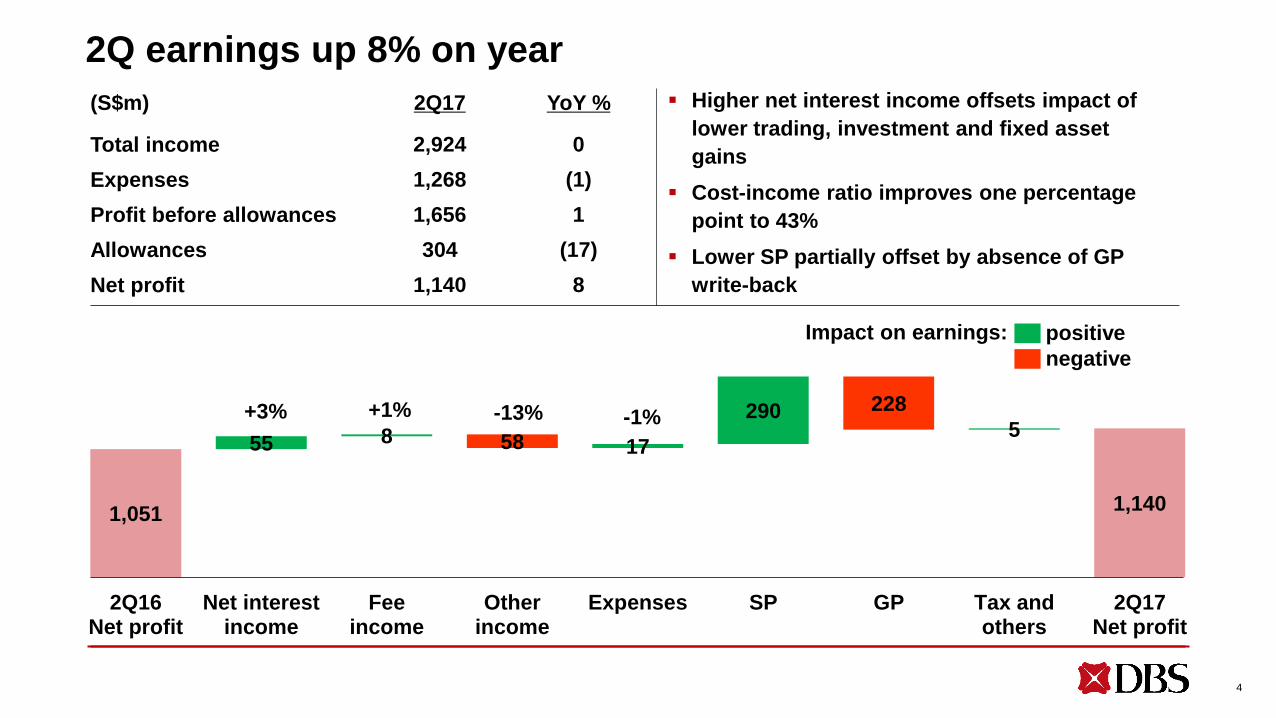
1,051 1,140
55 8 17
290 5
58
228
2Q16Net profit
Net interestincome
Feeincome
Otherincome
Expenses SP GP Tax andothers
2Q17Net profit
4
2Q earnings up 8% on year
Higher net interest income offsets impact of
lower trading, investment and fixed asset
gains
Cost-income ratio improves one percentage
point to 43%
Lower SP partially offset by absence of GP
write-back
(S$m) 2Q17 YoY %
Total income 2,924 0
Expenses 1,268 (1)
Profit before allowances 1,656 1
Allowances 304 (17)
Net profit 1,140 8
+3% +1% -1%-13%
negative
positiveImpact on earnings:

5
2Q income up 1% on quarter to near quarterly high
(S$m) 2Q17 QoQ %
Total income 2,924 1
Expenses 1,268 2
Profit before allowances 1,656 1
Allowances 304 52
Net profit 1,140 (6)
Total income up 1% to near quarterly high
Net interest income rises 3% as loans grow
2% over quarter
Fee income 4% below previous quarter’s
record, momentum sustained
1,210 1,140
57 10
16
29 20104
0
1Q17Net profit
Net interestincome
Feeincome
Otherincome
Expenses SP GP Tax andothers
2Q17Net profit
+3% -4% +2%+3%negative
positiveImpact on earnings:

3,666 3,719
1.861.74
1H2016
1H2017
1,833 1,833 1,815 1,824 1,831 1,888
1.85 1.871.77
1.71 1.74 1.74
1Q 2Q 3Q 4Q 1Q 2Q
2Q NIM stable on quarter as higher SGD interest rates
offset lower HKD rates
Net
interest
income
(S$m)
Net interest
margin (%)
2016
6
2017
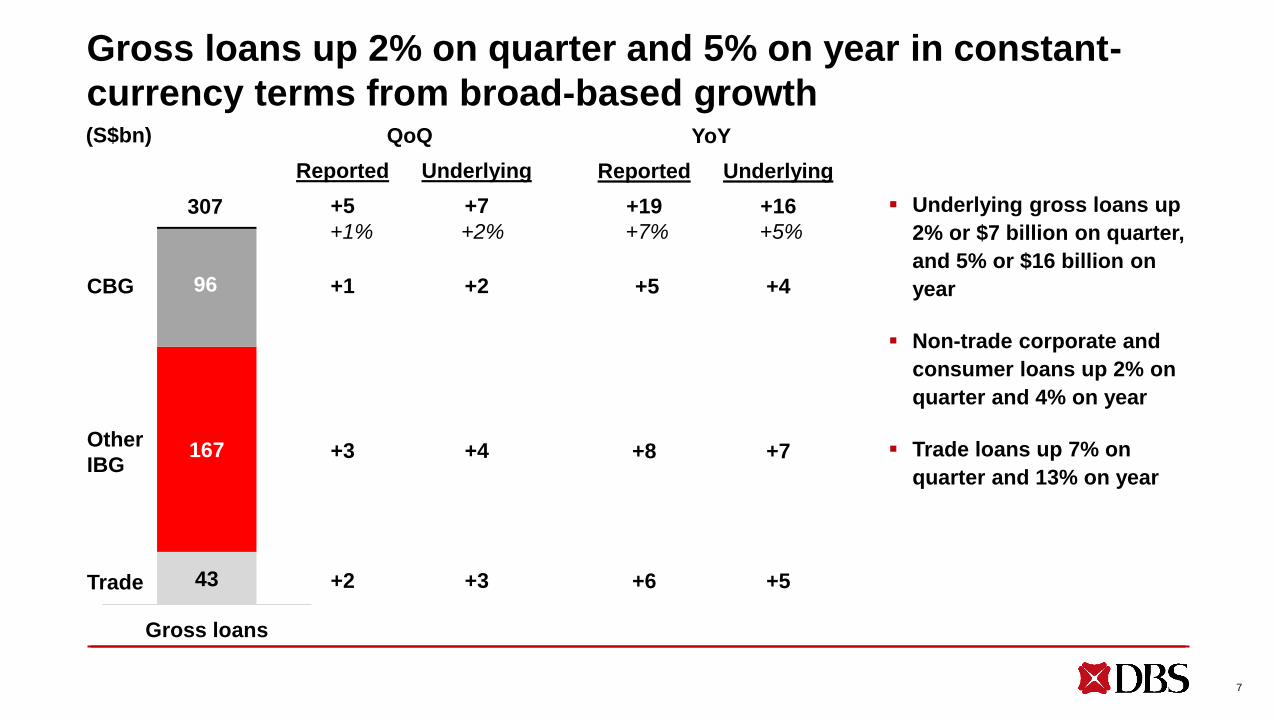
QoQ
Reported Underlying
+5 +7
+1 +2
+3 +4
+2 +3
YoY
Reported Underlying
+19 +16
+5 +4
+8 +7
+6 +5
Gross loans up 2% on quarter and 5% on year in constant-
currency terms from broad-based growth
43
167
96
Gross loans
Trade
Other
IBG
CBG
307 Underlying gross loans up
2% or $7 billion on quarter,
and 5% or $16 billion on
year
Non-trade corporate and
consumer loans up 2% on
quarter and 4% on year
Trade loans up 7% on
quarter and 13% on year
(S$bn)
7
+1% +2% +7% +5%
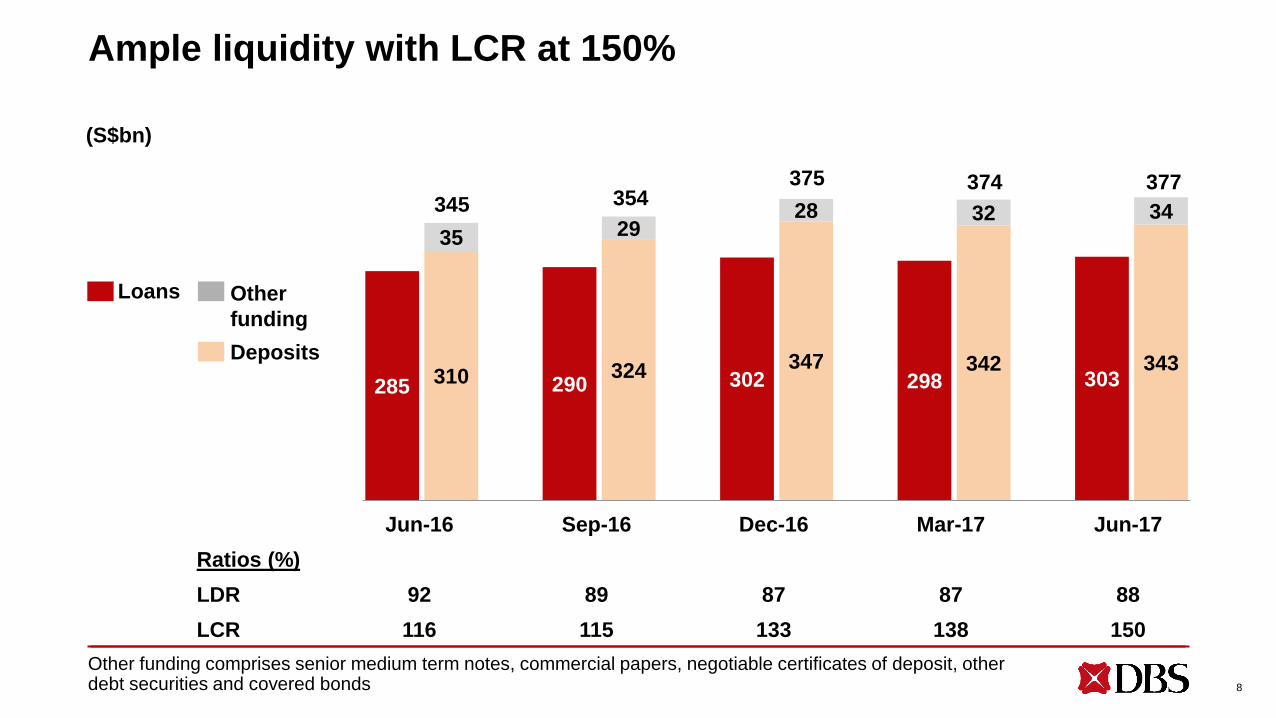
Loans
Jun-16 Sep-16 Dec-16 Mar-17 Jun-17
Ratios (%)
LDR 92 89 87 87 88
LCR 116 115 133 138 150
Ample liquidity with LCR at 150%
285 290 302 298 303310 324 347 342 343
35 2928 32 34
Other funding comprises senior medium term notes, commercial papers, negotiable certificates of deposit, other debt securities and covered bonds
Other
funding
Deposits
345 354375 374
8
377
(S$bn)
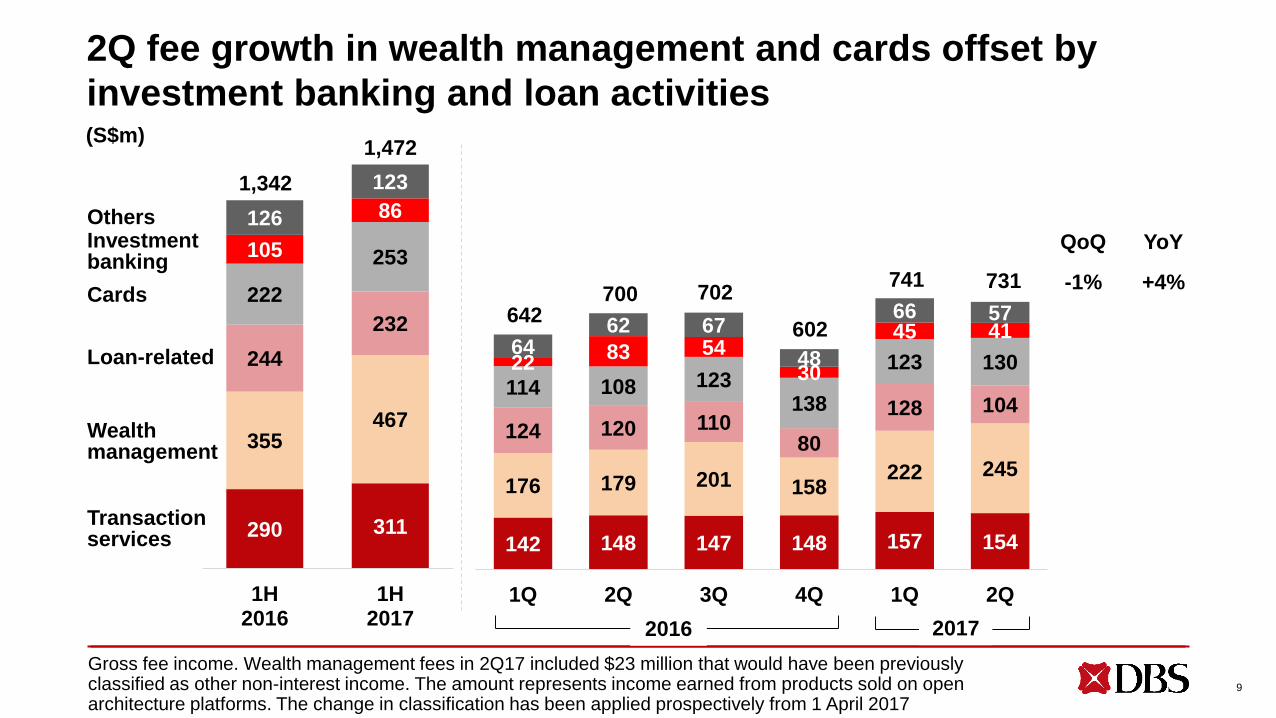
290 311
355467
244
232
222
253105
86126
123
1H2016
1H2017
2Q fee growth in wealth management and cards offset by
investment banking and loan activities
142 148 147 148 157 154
176 179 201 158222 245
124 120 11080
128 104114 108 123
138
123 1302283 54
30
45 4164
62 67
48
66 57
1Q 2Q 3Q 4Q 1Q 2Q
2016
741
602
702700642
1,472
1,342
Transaction services
Wealth management
Loan-related
Cards
Investment banking
Others
QoQ YoY
-1% +4%
9
(S$m)
2017
731
Gross fee income. Wealth management fees in 2Q17 included $23 million that would have been previously classified as other non-interest income. The amount represents income earned from products sold on open architecture platforms. The change in classification has been applied prospectively from 1 April 2017

1H IBG earnings up 23%
1H17 1H16 YoY %
Total income 2,617 2,651 (1)
Corporate 1,779 1,881 (5)
SME 838 770 9
Loans 1,373 1,436 (4)
Trade 367 368 -
Cash / SFS 506 396 28
Treasury 346 404 (14)
Investment banking 25 47 (47)
Expenses 860 848 1
Profit before allowances 1,757 1,803 (3)
Allowances 480 762 (37)
Profit before tax 1,277 1,041 23
Assets (S$bn) 236 221 7
GTS deposits (S$bn) 130 122 7
Total income falls 1% as
growth in cash management
offset by lower contributions
from other activities
Expenses up 1%; profit
before allowances down 3%
SP declines as new NPL
formation lower
Assets rise 7% or $15 billion
from loan growth
Cash management deposits
up 7% or $8 billion
SFS is Security and Fiduciary Services
10
(S$m)

1H CBG / Wealth income and earnings rise to new highs
1H17 1H16 YoY %
Total income 2,299 2,092 10
Retail 1,272 1,286 (1)
Wealth Management 1,027 806 27
Loans and deposits 1,293 1,223 6
Investment products 684 566 21
Cards 293 276 6
Others 30 27 11
Expenses 1,230 1,144 8
Profit before allowances 1,069 948 13
Allowances 66 55 20
Profit before tax 1,003 893 12
AUM (S$bn) 175 151 16
SGD savings (S$bn) 113 103 9
Total income up 10% from
broad-based growth in
investment products, loans
and deposits, and cards
Expenses up 8%; positive
jaw contributes to 12%
increase in profit before tax
Singapore housing loan
market share higher; more
than 50% of SGD savings
account market share
11
(S$m)
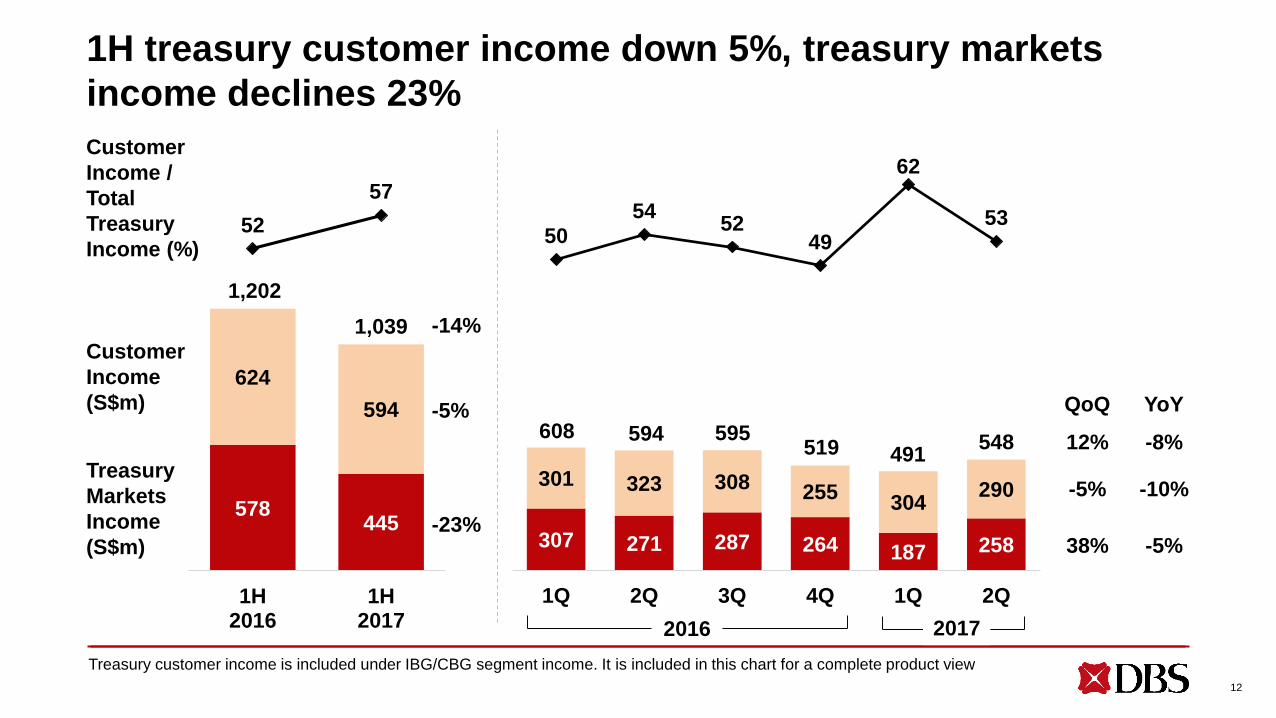
1H treasury customer income down 5%, treasury markets
income declines 23%
2016
578445
624
594
52
57
1H2016
1H2017
1,202
1,039
307 271 287 264 187 258
301 323 308255
304290
5054
5249
62
53
1Q 2Q 3Q 4Q 1Q 2Q
608 594 595519 491
Treasury
Markets
Income
(S$m)
Customer
Income
(S$m)
Customer
Income /
Total
Treasury
Income (%)
QoQ YoY
12% -8%
-5% -10%
38% -5%
12
2017
548
Treasury customer income is included under IBG/CBG segment income. It is included in this chart for a complete product view
-14%
-5%
-23%

7 6
(5) (2) (1) (1)
1H expenses decline 1%, cost-income ratio improves to 43%
from ongoing digitalisation and productivity initiatives
2016
1,161 1,087
1,389 1,429
4443
1H2016
1H2017
2,550 2,516
13
1,265 1,2851,199 1,223 1,248
Underlying
headcount22,037 21,814 21,880 21,689 21,673 21,518
Cost / income (%)
Other expenses
(S$m)
Staff expenses
(S$m)
YoY growth (%)
1,268
2017
559 602 527 559 537 550
706 683672 664 711 718
44 4441
44 43 43
1Q 2Q 3Q 4Q 1Q 2Q
14
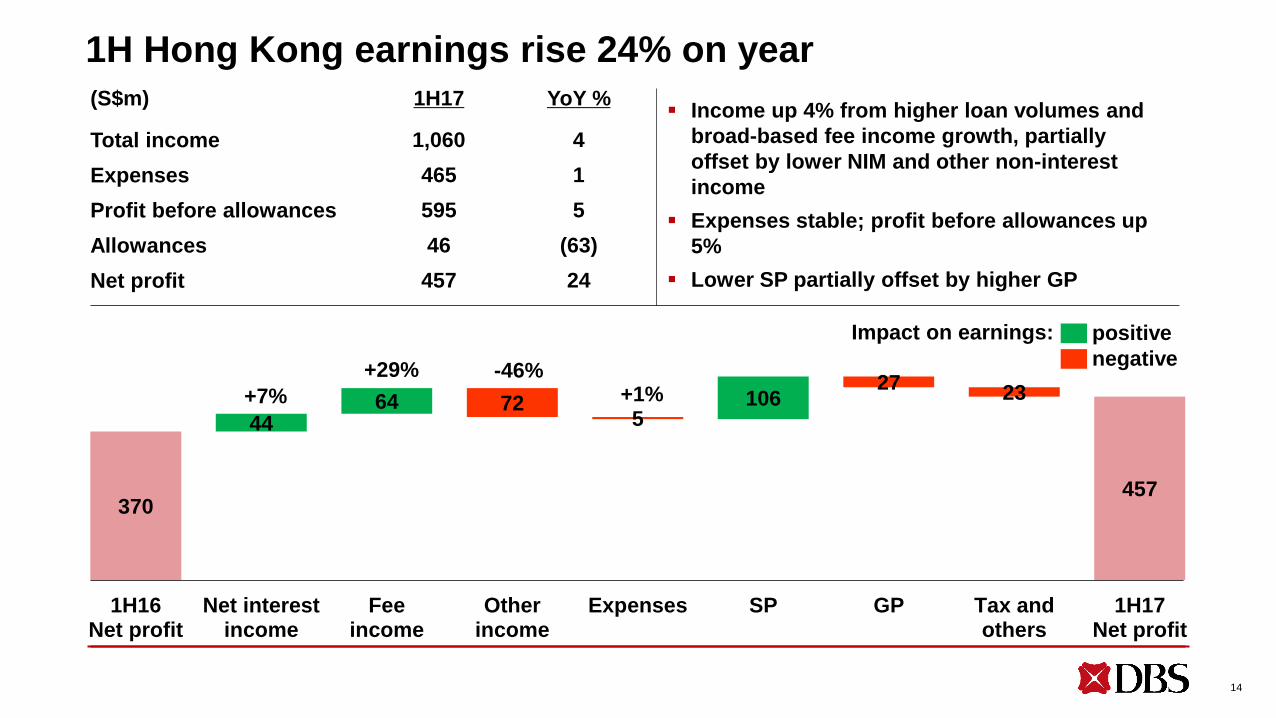
1H Hong Kong earnings rise 24% on year(S$m) 1H17 YoY %
Total income 1,060 4
Expenses 465 1
Profit before allowances 595 5
Allowances 46 (63)
Net profit 457 24
370 457
44 64 106 72
5
2723
1H16Net profit
Net interestincome
Feeincome
Otherincome
Expenses SP GP Tax andothers
1H17Net profit
+7%
+29%+1%
-46%negative
positiveImpact on earnings:
Income up 4% from higher loan volumes and
broad-based fee income growth, partially
offset by lower NIM and other non-interest
income
Expenses stable; profit before allowances up
5%
Lower SP partially offset by higher GP
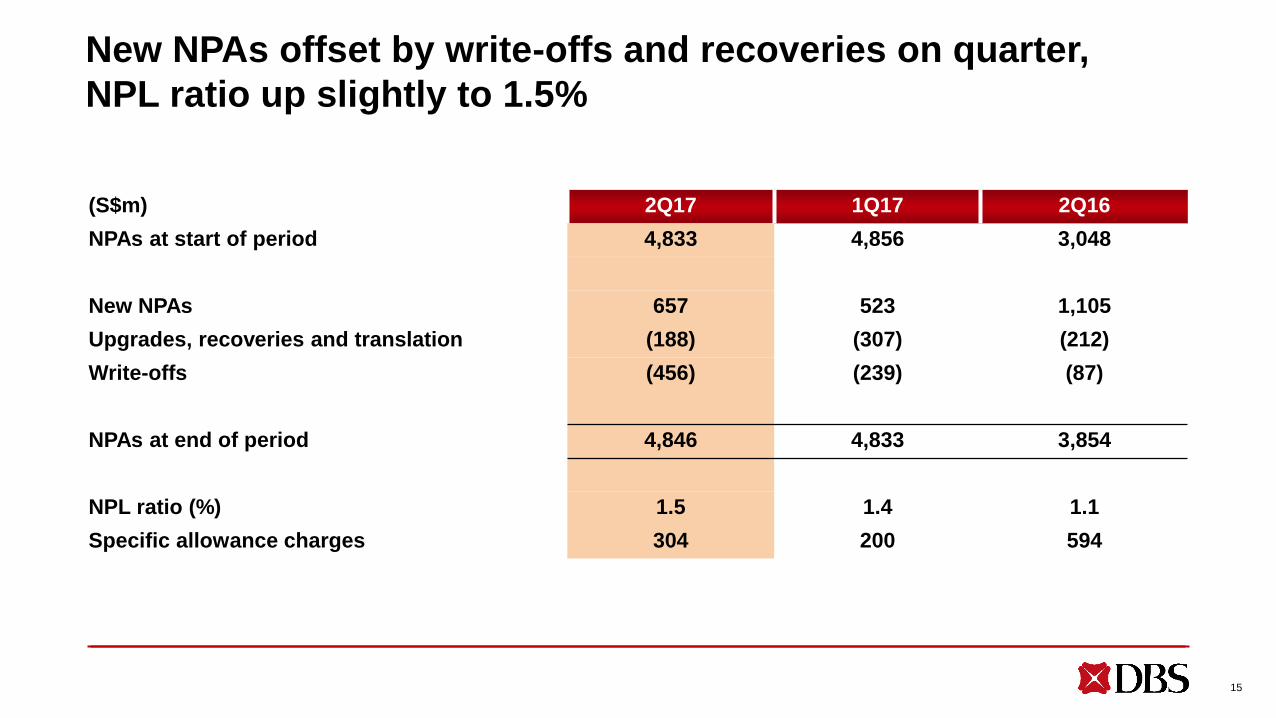
New NPAs offset by write-offs and recoveries on quarter,
NPL ratio up slightly to 1.5%
15
(S$m) 2Q17 1Q17 2Q16
NPAs at start of period 4,833 4,856 3,048
New NPAs 657 523 1,105
Upgrades, recoveries and translation (188) (307) (212)
Write-offs (456) (239) (87)
NPAs at end of period 4,846 4,833 3,854
NPL ratio (%) 1.5 1.4 1.1
Specific allowance charges 304 200 594
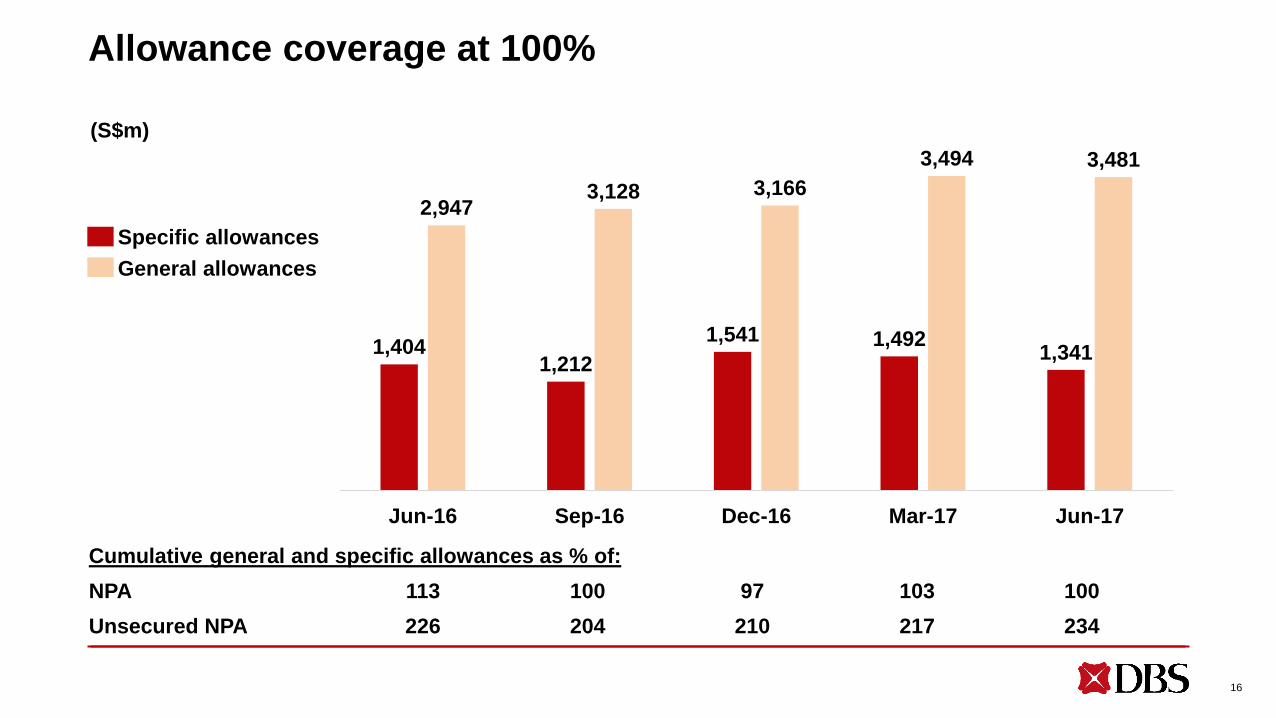
Allowance coverage at 100%
Cumulative general and specific allowances as % of:
NPA 113 100 97 103 100
Unsecured NPA 226 204 210 217 234
16
1,4041,212
1,541 1,4921,341
2,9473,128 3,166
3,494 3,481
Jun-16 Sep-16 Dec-16 Mar-17 Jun-17
Specific allowances
General allowances
(S$m)

Strong CET-1 and leverage ratios
14.4 14.9 14.7 15.4 15.2
1.9 1.6 1.5 1.2 1.3
Jun-16 Sep-16 Dec-16 Mar-17 Jun-17
Common Equity Tier-1 (%)
Transitional 14.2 14.4 14.1 14.6 14.4
Fully phased-in 13.4 13.5 13.3 14.2 14.0
RWA (S$bn) 268 271 279 272 280
Leverage ratio (%) 7.7 7.8 7.7 7.9 7.9
Tier 1
Tier 2
Total 16.516.3 16.5 16.2 16.6
17

First-half dividends up 10% to 33 cents
18
28 30 30 33
3030 30
2014
58
Interim
Final
2016
60
2015
60
2017
(S¢ per share)
In summary – Record first-half earnings
Strong first-half performance underpinned by broad-based loan
growth and record fee income muted by lower Singapore dollar
interest rates and weaker trading performance
Business pipeline healthy
Asset quality will remain under pressure and heightened credit
costs to persist with low oil prices
Consistent financial performance and strong capital position
underpin 10% dividend increase
19

Disclaimer: The information contained in this document is intended only for use during the presentation and should not be disseminated or distributed to parties outside the presentation.
DBS Bank accepts no liability whatsoever with respect to the use of this document or its contents.
Supplementary slides
DBS Group Holdings
2Q 2017 financial results
August 4, 2017

Record 1H earnings(S$m) 1H17 1H16 YoY % 2H16 HoH %
Net interest income 3,719 3,666 1 3,639 2
Fee income 1,301 1,202 8 1,129 15
Trading income 565 622 (9) 735 (23)
Other income 225 294 (23) 202 11
Non-interest income 2,091 2,118 (1) 2,066 1
Total income 5,810 5,784 - 5,705 2
Staff expenses 1,429 1,389 3 1,336 7
Other expenses 1,087 1,161 (6) 1,086 -
Expenses 2,516 2,550 (1) 2,422 4
Profit before allowances 3,294 3,234 2 3,283 -
General allowances - (228) NM 169 NM
Specific allowances 504 764 (34) 729 (31)
Allowances 504 536 (6) 898 (44)
Net profit 2,350 2,254 4 1,984 18
One-time items 25 - NM - NM
Net profit incl. one-time items 2,375 2,254 5 1,984 20
21

2Q earnings up 8% on year(S$m) 2Q17 2Q16 YoY % 1Q17 QoQ %
Net interest income 1,888 1,833 3 1,831 3
Fee income 636 628 1 665 (4)
Trading income 295 307 (4) 270 9
Other income 105 151 (30) 120 (13)
Non-interest income 1,036 1,086 (5) 1,055 (2)
Total income 2,924 2,919 - 2,886 1
Staff expenses 718 683 5 711 1
Other expenses 550 602 (9) 537 2
Expenses 1,268 1,285 (1) 1,248 2
Profit before allowances 1,656 1,634 1 1,638 1
General allowances - (228) NM - -
Specific allowances 304 594 (49) 200 52
Allowances 304 366 (17) 200 52
Net profit 1,140 1,051 8 1,210 (6)
One-time items (10) - NM 35 NM
Net profit incl. one-time items 1,130 1,051 8 1,245 (9)
22
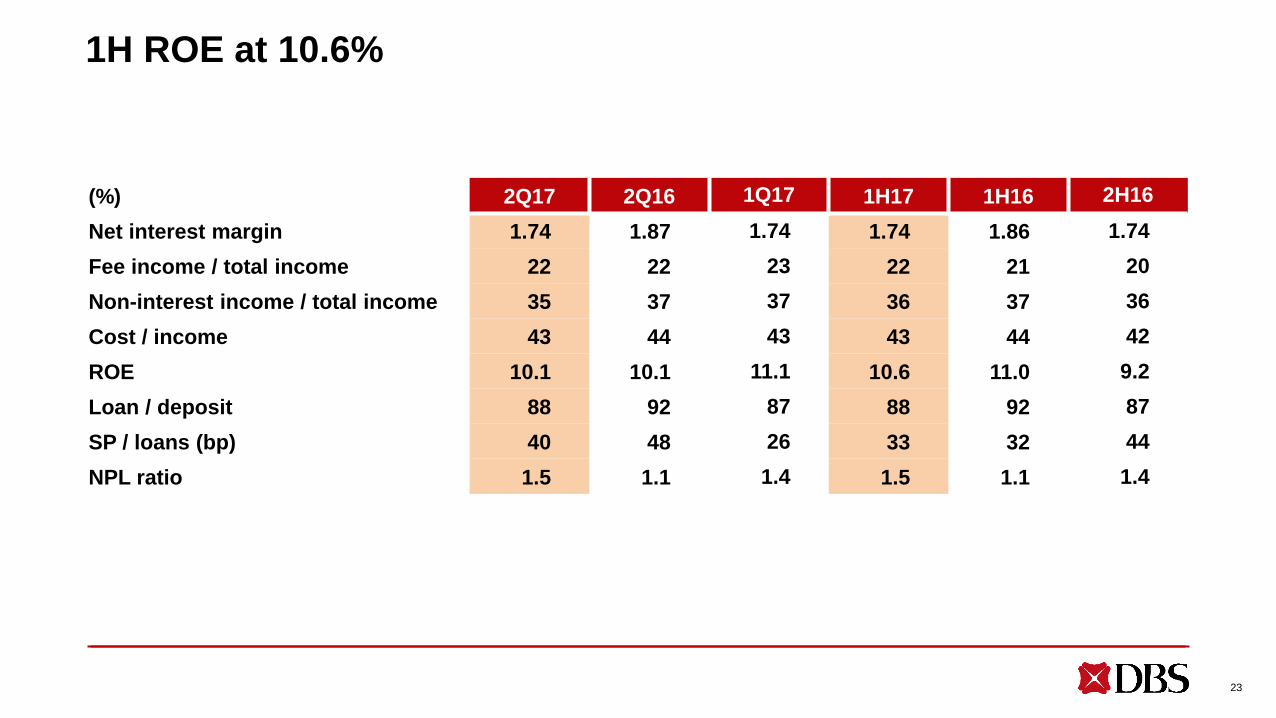
1H ROE at 10.6%
(%) 2Q17 2Q16 1Q17 1H17 1H16 2H16
Net interest margin 1.74 1.87 1.74 1.74 1.86 1.74
Fee income / total income 22 22 23 22 21 20
Non-interest income / total income 35 37 37 36 37 36
Cost / income 43 44 43 43 44 42
ROE 10.1 10.1 11.1 10.6 11.0 9.2
Loan / deposit 88 92 87 88 92 87
SP / loans (bp) 40 48 26 33 32 44
NPL ratio 1.5 1.1 1.4 1.5 1.1 1.4
23

1H Hong Kong earnings up 24% on year
(S$m) 1H17 1H16 YoY % YoY % 2H16 HoH % HoH %
Net interest income 694 650 7 5 667 4 4
Non-interest income 366 374 (2) (3) 411 (11) (11)
Total income 1,060 1,024 4 2 1,078 (2) (2)
Expenses 465 460 1 0 501 (7) (7)
Profit before allowances 595 564 5 4 577 3 3
General allowances 28 1 >100 >100 (2) NM NM
Specific allowances 18 124 (85) (86) 179 (90) (90)
Allowances 46 125 (63) (64) 177 (74) (74)
Net profit 457 370 24 22 343 33 32
Net interest margin (%) 1.74 1.80 1.68
Loan growth (%) 3 4
Non-trade growth (%) 4 4
Trade growth (%) (3) 4
Deposit growth (%) 6 (1)
Constant-currency terms
24

2Q Hong Kong earnings up 42% on year
25
(S$m) 2Q17 2Q16 YoY % YoY % 1Q17 QoQ % QoQ %
Net interest income 343 320 7 5 351 (2) (1)
Non-interest income 193 200 (4) (4) 173 12 14
Total income 536 520 3 1 524 2 4
Expenses 235 232 1 0 230 2 4
Profit before allowances 301 288 5 3 294 2 4
General allowances 16 24 (33) (29) 12 33 48
Specific allowances 10 72 (86) (87) 8 25 8
Allowances 26 96 (73) (73) 20 30 31
Net profit 229 161 42 40 228 0 2
Net interest margin (%) 1.70 1.80 1.79
Loan growth (%) 3 3
Non-trade growth (%) 4 5
Trade growth (%) (3) (4)
Deposit growth (%) 6 1
Constant-currency terms

1H regional earnings double on year
(S$m) 1H17 1H16 YoY % 2H16 HoH %
Net interest income 603 528 14 572 5
Non-interest income 354 365 (3) 382 (7)
Total income 957 893 7 954 -
Expenses 571 550 4 590 (3)
Profit before allowances 386 343 13 364 6
Allowances 101 191 (47) 283 (64)
Net profit 223 100 >100 29 >100
Operations outside of Singapore and Hong Kong
26

S/P loans (bp) 48 30 57 26 40
Cumulative general and specific allowances as % of:
NPA 113 100 97 103 100
Unsecured NPA 226 204 210 217 234
58% 55%71% 68% 68%
13% 25%14% 20% 14%
29% 20% 15% 12% 18%
1.11.3 1.4 1.4
1.5
Jun-16 Sep-16 Dec-16 Mar-17 Jun-17
NPL ratio (%)
NPA (S$m)
Not overdue
<90 days overdue
>90 days overdue
3,854 4,330 4,856 4,833
27
NPA little changed on quarter, allowance coverage at 100%
4,846

2Q specific allowances for loans at 40 bp
2Q17 1Q17 2Q16
Add charges for
New NPLs 178 53 286
Existing NPLs 180 190 81
358 243 367
Subtract charges for
Upgrading - - 1
Settlements 46 27 14
Recoveries 11 23 16
57 50 31
Total SP charges for loans 301 193 336
SP/loans (bp) 40 26 48
28
(S$m)

AFS duration remains short
Jun-17 Mar-17
Government securities 25,619 24,893
Less than 3 years 16,166 16,452
3 to 5 years 3,917 3,449
5 to 10 years 5,264 4,723
More than 10 years 272 269
Supranational, bank and corporate bonds 14,090 14,879
Equities 1,431 1,530
Total 41,140 41,302
AFS reserves 272 228
29
Time-banding is based on maturity date from reporting date
(S$m)

European AFS exposure mostly in AAA and AA entities
Government /
Govt-owned
Bank /
CorporatesTotal
Supranational 185* 0 185
Germany 491* 0 491
Netherlands 0 3 3
United Kingdom 257* 186 443
Total 932 189 1,122
30
* Supranational and German entities rated AAA/Aaa by S&P, Moody’s and Fitch. UK entities rated AA by S&P, AA1 by
Moody’s and AA by Fitch
(S$m)
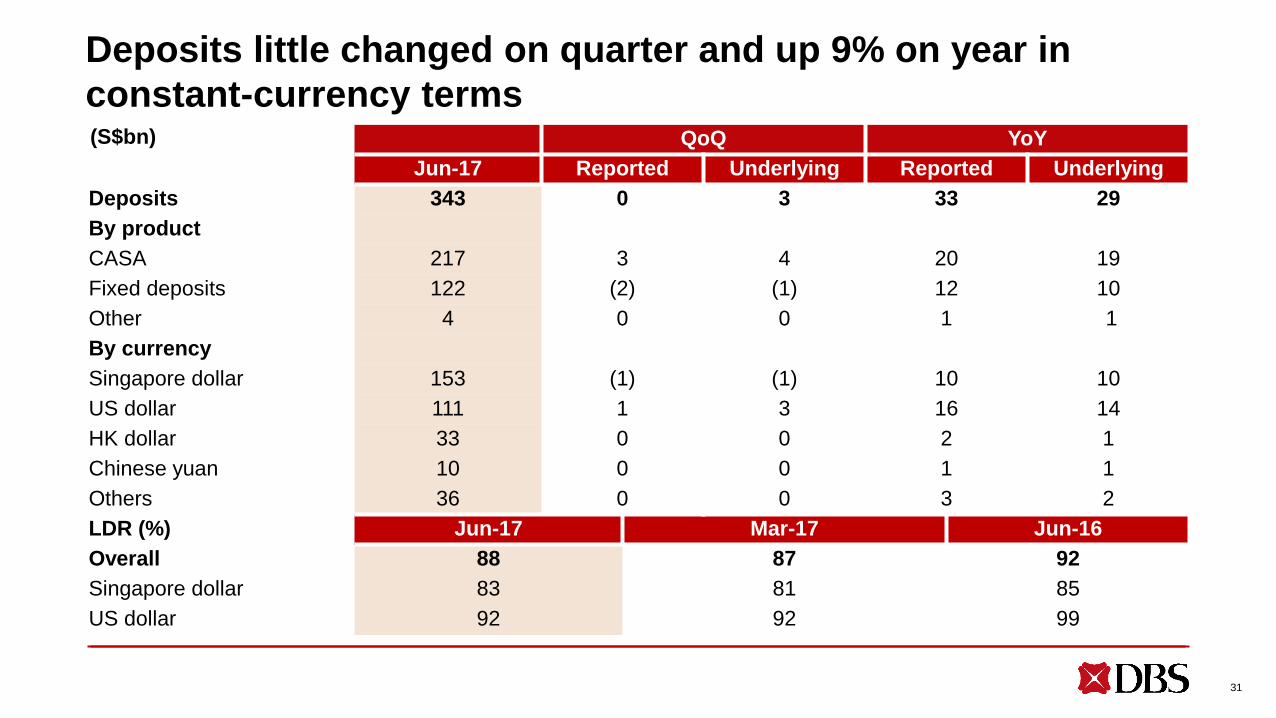
Deposits little changed on quarter and up 9% on year in
constant-currency termsQoQ YoY
Jun-17 Reported Underlying Reported Underlying
Deposits 343 0 3 33 29
By product
CASA 217 3 4 20 19
Fixed deposits 122 (2) (1) 12 10
Other 4 0 0 1 1
By currency
Singapore dollar 153 (1) (1) 10 10
US dollar 111 1 3 16 14
HK dollar 33 0 0 2 1
Chinese yuan 10 0 0 1 1
Others 36 0 0 3 2
LDR (%) Jun-17 Mar-17 Jun-16
Overall 88 87 92
Singapore dollar 83 81 85
US dollar 92 92 99
31
(S$bn)
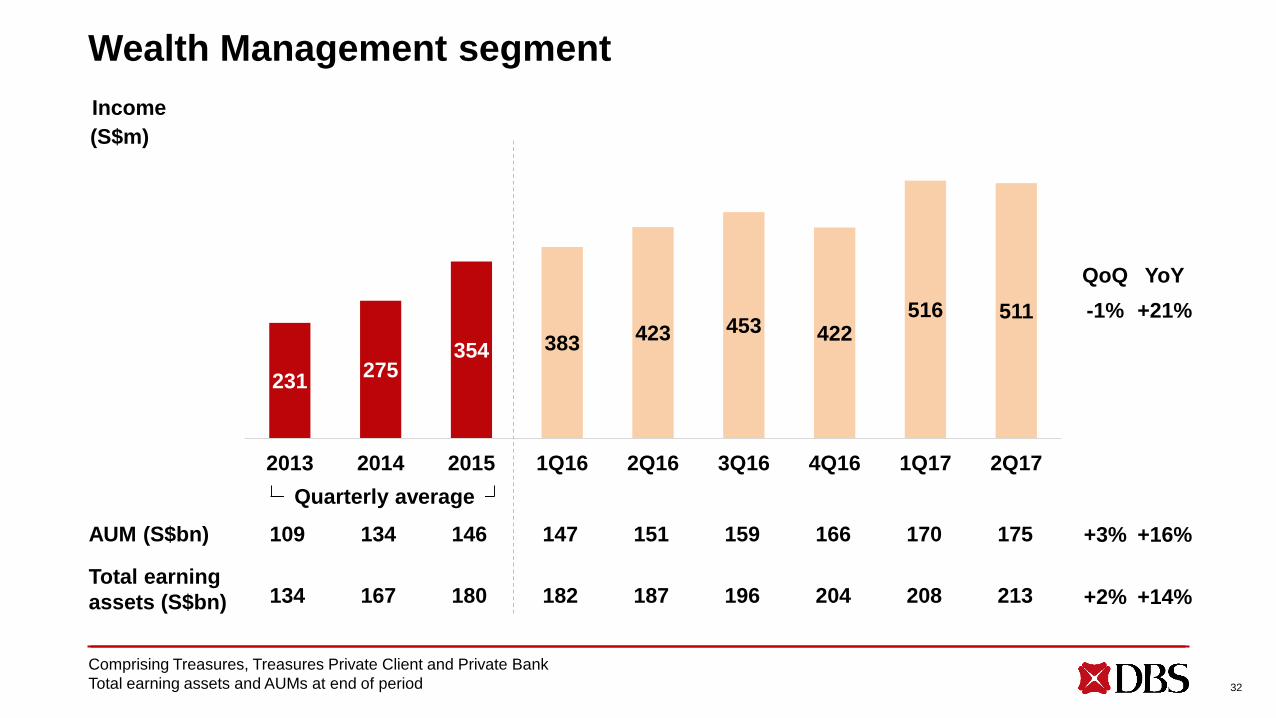
Wealth Management segment
Income
AUM (S$bn) 109 134 146 147 151 159 166 170 175
Total earning
assets (S$bn) 134 167 180 182 187 196 204 208 213
32
231275
354 383423 453 422
516 511
2013 2014 2015 1Q16 2Q16 3Q16 4Q16 1Q17 2Q17
QoQ
-1%
+3%
+2%
Comprising Treasures, Treasures Private Client and Private Bank
Total earning assets and AUMs at end of period
Quarterly average
YoY
+21%
+16%
+14%
(S$m)
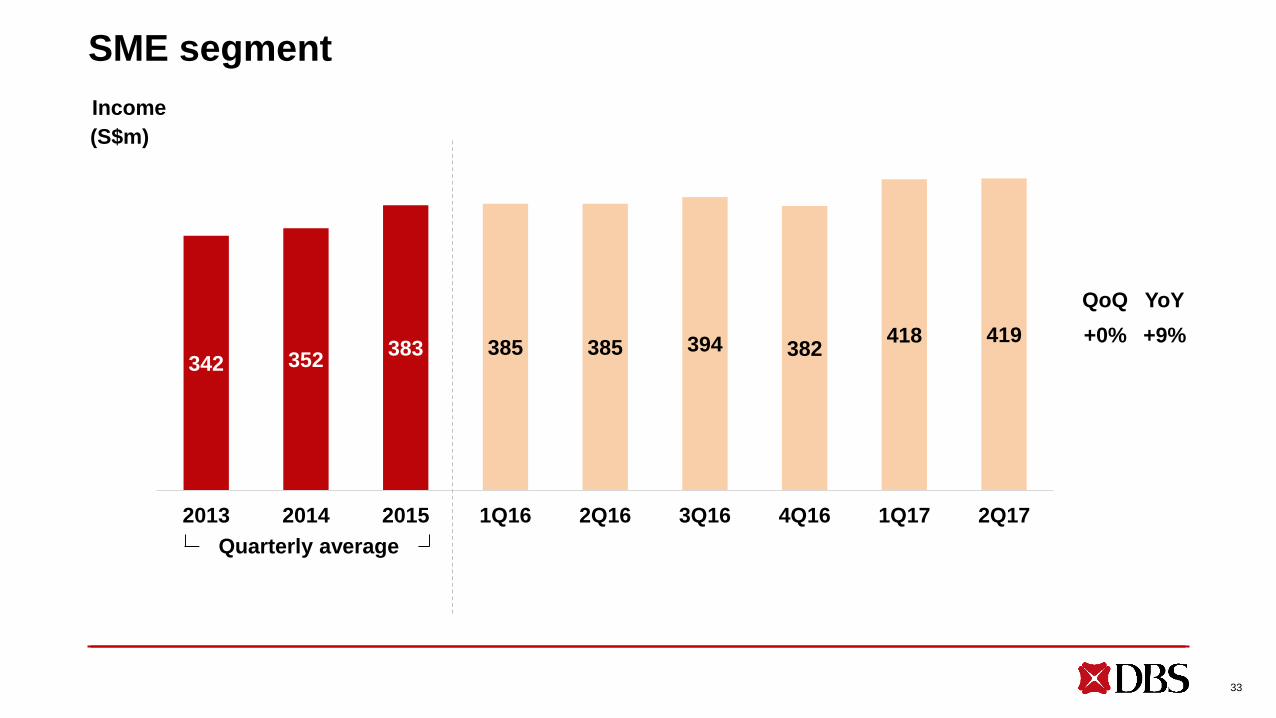
SME segment
33
342 352383 385 385 394 382
418 419
2013 2014 2015 1Q16 2Q16 3Q16 4Q16 1Q17 2Q17
QoQ
+0%
YoY
+9%
Quarterly average
Income
(S$m)
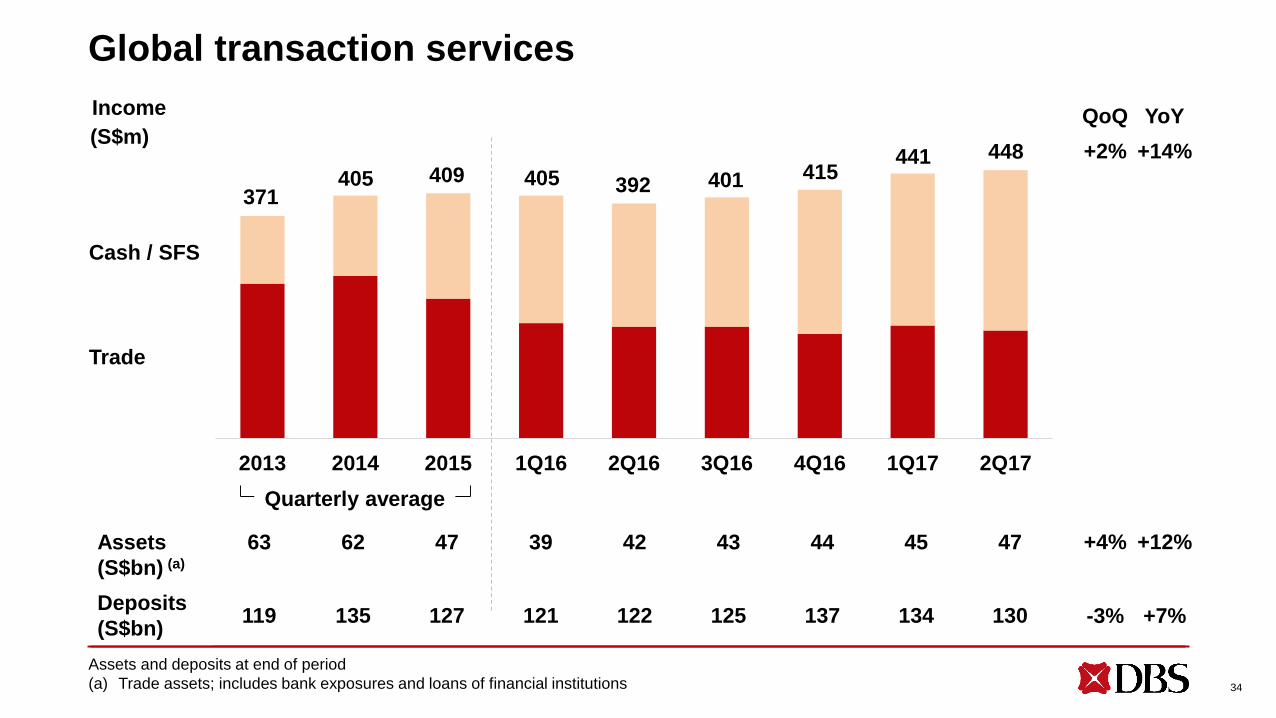
Global transaction services
Assets
(S$bn) (a)
63 62 47 39 42 43 44 45 47
Deposits
(S$bn)119 135 127 121 122 125 137 134 130
34
2013 2014 2015 1Q16 2Q16 3Q16 4Q16 1Q17 2Q17
Assets and deposits at end of period
(a) Trade assets; includes bank exposures and loans of financial institutions
Quarterly average
Cash / SFS
Trade
371405 409 405 392 401 415
441
QoQ
+2%
+4%
-3%
YoY
+14%
+12%
+7%
448
Income
(S$m)

Disclaimer: The information contained in this document is intended only for use during the presentation and should not be disseminated or distributed to parties outside the presentation.
DBS Bank accepts no liability whatsoever with respect to the use of this document or its contents.
Record first-half earnings
DBS Group Holdings
2Q 2017 financial results
August 4, 2017