“red tape study” - public sector economists forum treasury red tape... · additional/ sector...
TRANSCRIPT

“RED TAPE STUDY”
ENVIRONMENT OF SMALL BUSINESS IN KWAZULU-NATAL

Regulations affecting businesses in KZNEach sphere of government have wide-ranging powers to administer certain provisions of national government legislations. ◦ Provinces and Municipalities have a direct impact on businesses
through their policies on development and planning, zoning and business licensing
◦ provincial and municipal regulations are limited in number and predominantly impose once off administrative costs
Tax compliance burden and costs are high on the list of regulations constraining growth and development of businessLabour laws are also problematic especially for large businesses The tourism, manufacturing, mining, power and water sectors experience the most administrative burden owing to long list of regulations imposed on them

Regulations with high information obligation and administrative burdens
0 5 10 15 20
Nothing /don't know
O ther (g eneral fees)
Customs and excise
M ini mum wag e reg ul ati ons
R egi str ati on procedur e
BEE and empowerm ent
H ealth and sfety
M uni c ipal reg ul ati ons and charg es
S ET A /T rai ning
PAYE
U IF
SA R S tax adm in
Labour laws, C CM A, Barg aini ng counci ls
VAT
%

Recurring compliance cost by category
Tax compliance27%
Additional/ sector regulations
21%
Employment equity12%
Annual registration 9%
Information to government
8%
Labour and employment
17%
Local government regulations
6%

PRELIMINARY COMMENTSONE OF MANY STUDIES COMPLETED IN THE PERIOD 2005-2011
A “SNAPSHOT” TAKEN IN THE PERIOD JULY –NOVEMBER 2013
INCOMPLETE STUDY THAT REQUIRES FURTHER VALIDATION IN SOME AREAS
“RED TAPE” DEFINED TO EMBRACE THE PUBLIC POLICY FRAMEWORKS OF GOVERNMENT AND THE ADMINISTRATION OF THOSE FRAMEWORKS
STATISTICAL SIGNIFICANCE?

SMALL BUSINESS IN “MACRO” CONTEXT
CHALLENGED TO BE MAJOR CREATOR OF EMPLOYMENT.“RED TAPE” IS ONE PART OF THE TOTAL ENABLING/DISABLING ENVIRONMENT.THE SMALL BUSINESS “EXPERIENCE” OF GOVERNMENT.DIFFERENT SECTORS HAVE DIFFERING DYNAMICS AND RISK PROFILES.HOLISTIC/ SYSTEM WIDE APPROACH A REASONABLE THOUGHT.SMALL BUSINESS A DISTINCTIVE BUSINESS FORM.

WHAT IS OUR PURPOSE?

A “SYSTEM”
ELEMENT
BOUNDARY
INPUTOUTPUT
RELATIONSHIP

SURVEYDETAILSQUESTIONNAIRE DRIVEN : 1934 RETURNS RECEIVED.
INTERVIEWS CONDUCTED WITH LOCAL GOVERNMENT (3), BUSINESS INTERESTS (2) AND A BUSINESS SUPPORT AGENCY (1).
RANDOM SAMPLING USED, GIVEN NATURE OF SURVEY TEAM.
DESIRABLE TO CONDUCT FURTHER VALIDATING WORK, E.G. FOCUS GROUPS, SME INTERVIEWS.
WHAT DOES THE SAMPLE LOOK LIKE?
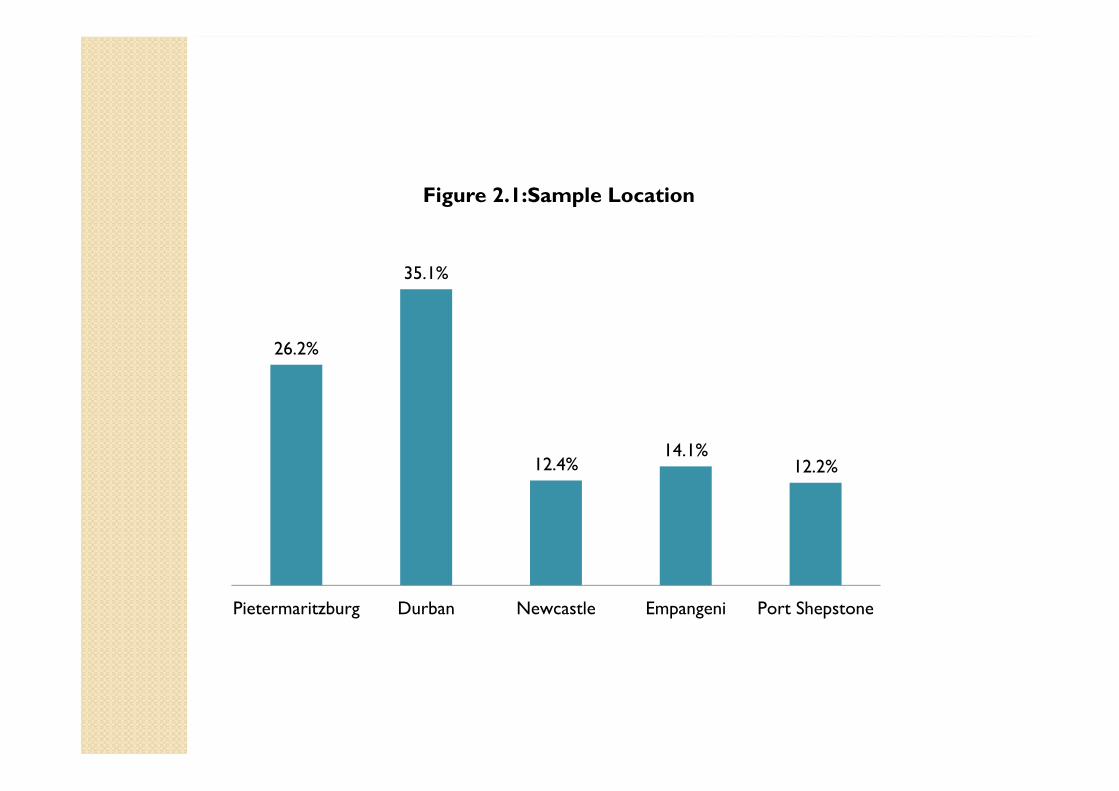
26.2%
35.1%
12.4%14.1%
12.2%
Pietermaritzburg Durban Newcastle Empangeni Port Shepstone
Figure 2.1:Sample Location

SECTOR
(NUMBER OF
RESPONSES)
EXTRACTIVE
(33)
TRANSFORM
ATIVE
(518)
CONSUMER
SERVICES
(900)
BUSINESS
SERVICES
(319)
Sector
Constituents
Agriculture
Forestry
Fishing
Mining
Construction
Manufacturing
Transport
Communicatio
ns
Utilities
Wholesale
Retail
Motor Vehicle
Hospitality
Personal
Education
Recreation
Finance
Insurance
Real Estate

0%
10%
20%
30%
40%
50%
60%
70%
Figure 2.2: Sector Locations
Extractive
Transformative
Consumer Services
Business Services
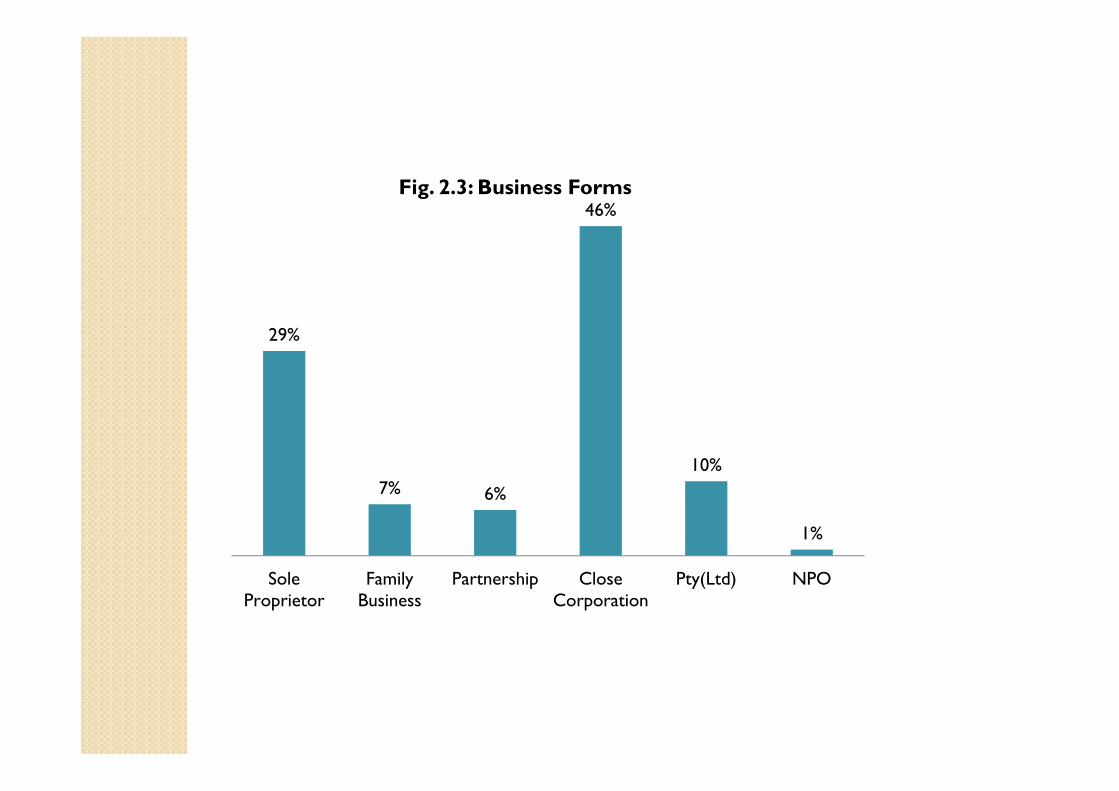
29%
7% 6%
46%
10%
1%
SoleProprietor
FamilyBusiness
Partnership CloseCorporation
Pty(Ltd) NPO
Fig. 2.3: Business Forms

15%
11% 12%
8%
15% 14%
18%19%
18%
21%
18%
22%
18%
14%17%
20%
35%
40%
37%
32%
Extractive Transformative Consumer Services Business Services
Fig 2.5: Age Profile by Sector (Years)
0-1 0-3 0-5 0-10 >10

69%
62%
80%
72%
28%34%
19%24%
3% 4% 2% 4%
Extractive Transformative Consumer Services Business Services
Fig 3.1: Employees By Sector0-9 Employees 10-49 Employees 50-100 Employees

EMPLOYMENT SITUATIONAVERAGE NUMBER OF EMPLOYEES: 2.4STATIC EMPLOYMENT SITUATION –SEEMINGLY STABLEUNSKILLED EMPLOYEES LEAST LIKELY TO BE ENGAGEDINFLEXIBLE LABOUR MARKETLABOUR COSTS HIGH, SKILLS SHORTAGES, POOR PRODUCTIVITYFAMILY FUNDED AND OPERATED ENTERPRISES.

22% 23%19%
33%
11%14% 14% 12%
67%63%
67%
55%
Extractive Transformative Consumer Services Business Services
Fig 3.2: HistoricEmployment Changes by Sector
Increase Decrease No Change

13%
31%
22%
36%
4% 5% 4% 4%
83%
64%
74%
59%
Extractive Transformative Consumer Services Business Services
Fig 3.3: Future Employment Plans
Increase Decrease No Change

44%
19%
28% 27%
40%
32%
9%
22%
Fig 3.5: Factors Affecting Employment Decisions
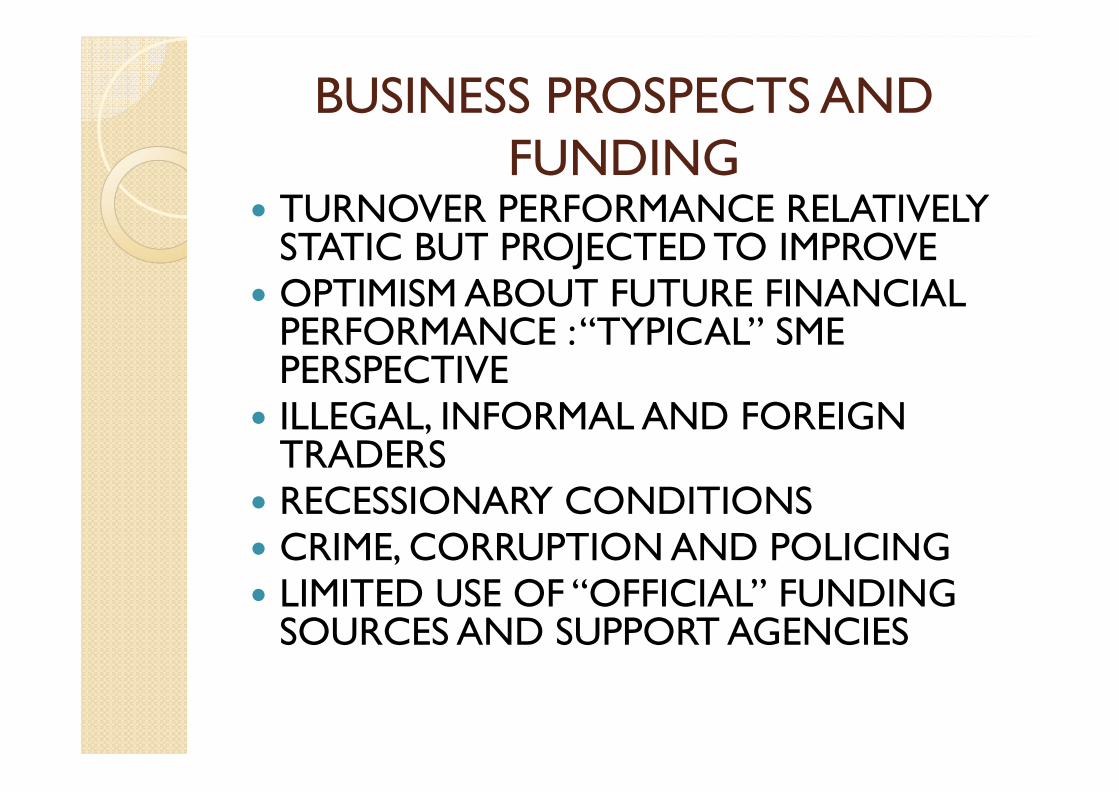
BUSINESS PROSPECTS AND FUNDING
TURNOVER PERFORMANCE RELATIVELY STATIC BUT PROJECTED TO IMPROVEOPTIMISM ABOUT FUTURE FINANCIAL PERFORMANCE : “TYPICAL” SME PERSPECTIVEILLEGAL, INFORMAL AND FOREIGN TRADERSRECESSIONARY CONDITIONSCRIME, CORRUPTION AND POLICINGLIMITED USE OF “OFFICIAL” FUNDING SOURCES AND SUPPORT AGENCIES

32%35%
29%
36%
24%
35%
40%
31%
44%
30% 31%34%
Extractive Transformative Consumer Services Business Services
Fig 4.1: Turnover Change by Sector
Increase Decrease No Change

0%
10%
20%
30%
40%
50%
60%
70%
80%
Extr
activ
e
Tra
nsfo
rmat
ive
Con
sum
er S
ervi
ces
Busi
ness
Ser
vice
s
Extr
activ
e
Tra
nsfo
rmat
ive
Con
sum
er S
ervi
ces
Busi
ness
Ser
vice
s
Extr
activ
e
Tra
nsfo
rmat
ive
Con
sum
er S
ervi
ces
Busi
ness
Ser
vice
s
Extr
activ
e
Tra
nsfo
rmat
ive
Con
sum
er S
ervi
ces
Busi
ness
Ser
vice
s
Extr
activ
e
Tra
nsfo
rmat
ive
Con
sum
er S
ervi
ces
Busi
ness
Ser
vice
s
Pietermaritzburg Durban Newcastle Empangeni Port Shepstone
Fig 4.4: Future Financial Prospects by Location and Sector
Confident Not Confident Do Not Know

19%
6% 7%
27%
21%
5% 4%
10%
Fig 4.6: Perceived Problems Affecting Small Business

Intended Strategy Percentage of Respondents
Improve share of existing markets 40
Access to new local markets 33
Access to export opportunities 9
Opening additional business site(s) 21
Forming alliances or joint ventures 12
New product development 29
New process development 13
Increased number of employees 20
Employee skills upgrading 26
Expansion of existing facilities 20
Relocation to new site 15

33%
19%
16%
26%
7%
More Government Support Strict Lending Criteria Insufficient Support High Bank Charges More Awareness Needed
Fig 4.7: Financial Support for Small Business

PUBLIC SUPPORT SERVICES
SERVICE DELIVERY IN GENERAL, RATES AND SERVICE CHARGES, ROADSCIVIL SERVICE CULTUREINVOLVEMENT IN LOCAL AUTHORITY AND OTHER GOVERNMENT PROCESSESBRAZIL AND INDIA ARE WORSE!! BUT ENTERPROSE DEVELOPMENT IS TWICE AS FAST!!!

58%
3%
9%
16%13%
Service Delivery Policing Corruption SMME support Political Factors
Fig 4.8: Factors for Improvement in Local Government Practices

RegulationPoorly
Understood/Confusing
Time ConsumingCostly
Compliance Requirements
Health and Safety 15% 18% 14%
Labour 13% 21% 20%
Employment Equity 11% 18% 13%
Planning & Development 11% 14% 12%
Environmental 10% 13% 10%
Taxation 15% 17% 35%

7%10%
16%
22%
6%
36% 35%33%
41%38%
47%44%
36%
23%
44%
10% 11%
15% 14% 12%
Pietermaritzburg Durban Newcastle Empangeni Port Shepstone
Fig 5.1: Quality of Government Information
Good Adequate Poor Not Needed

7%9% 10%
17%
5%
57%53%
38%33%
52%
27% 28%
38%
43%
30%
9% 9%
14%
7%
13%
Pietermaritzburg Durban Newcastle Empangeni Port Shepstone
Fig 5.2: Quality of Government Services
Good Adequate Poor Never Needed
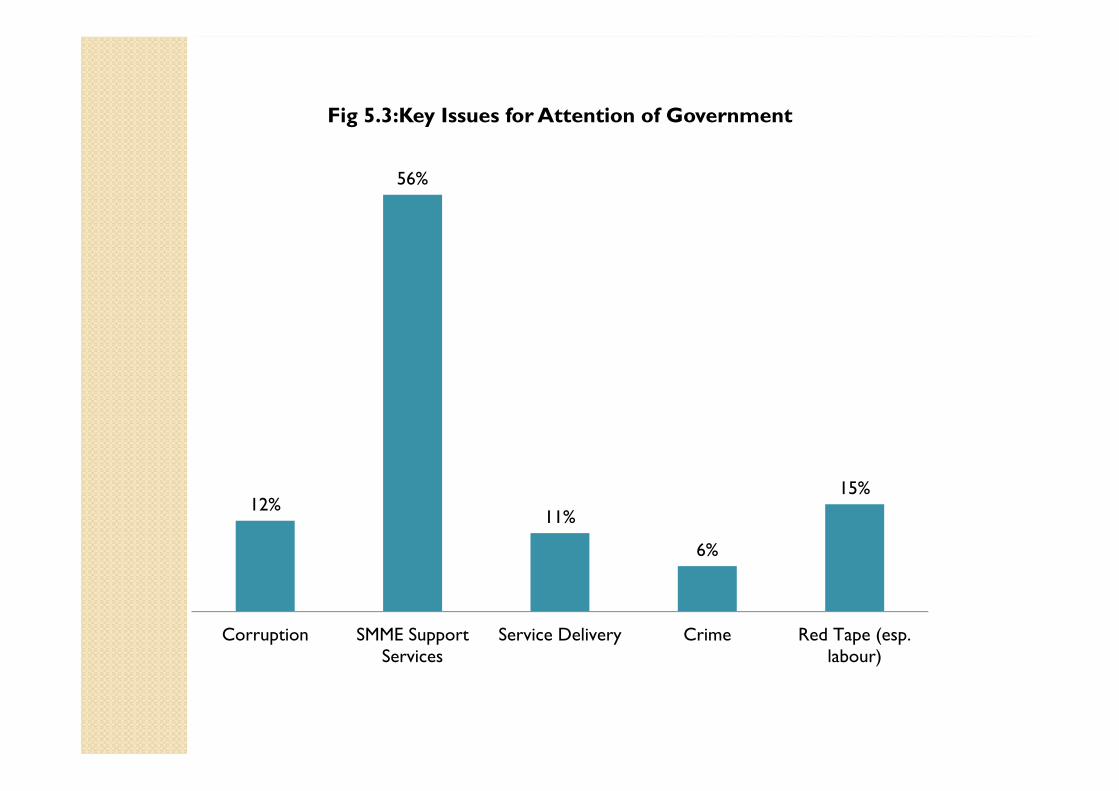
12%
56%
11%
6%
15%
Corruption SMME SupportServices
Service Delivery Crime Red Tape (esp.labour)
Fig 5.3:Key Issues for Attention of Government

7%
17%
42%
23%
12%
Training MunicipalStaff
Municipal Attitudes Enterprise Training ManagementTraining
Improve Availability
Fig 5.4: Required Training Programmes

Average Score Rank
Health 2.94 1Community Safety and Liaison 2.94 2Arts and Culture 2.94 3Office of the Premier 2.88 4Economic Development and Tourism 2.88 5Tourism KZN 2.88 6Social Development 2.81 7Sport and Recreation 2.81 8The Royal Household 2.76 9Education 2.75 10Trade and Investment KZN 2.75 11KZN Growth Fund 2.75 12Human Settlements 2.69 13Provincial Legislature 2.63 14Provincial Treasury 2.63 15Transport 2.63 16Ithala Development Finance 2.56 17Local Government and Traditional Affairs 2.53 18Public Works 2.50 19Agriculture, Environmental Affairs and Rural Development
2.00 20
Rank of Impact

Measures in reducing the regulatory compliance burden
Options (Indicate TOP 3) Top 1 Top 2 Top 3
Reduce the duplication of regulation across government departments and spheres of governments 66.67 11.11 22.22
Establishment of reliable electronic and web-based reporting system 87.50 0.00 12.50
Agencies sharing information and making sure there are no duplicate information requirements 62.50 12.50 25.00
Better communication and consultations with businesses when developing new regulations 62.50 25.00 12.50
Single location for all regulatory information and announcements 71.43 14.29 14.29
One agency which collects all the required information 80.00 20.00 0.00
Reduce the frequency of reporting requirements 75.00 0.00 25.00
Implement pre-populated forms and reports 66.67 33.33 0.00
Scheduled releases of new and amended regulation/s 50.00 50.00 0.00

RECOMMENDATIONSCOHERENCE OF POLICY OBJECTIVES REQUIREDENTREPRENEURSHIP SUPPORT IN EDUCATION SYSTEM (ED AS HIGHER PRIORITY IN BEE AGENDA)INVESTIGATION INTO LOW NUMBERS OF START-UPS AND PUBLIC FUNDING MECHANISMS FOR ADOPTION OF A SYSTEMS APPROACH IN FRAMING REGULATIONS AND THEIR IMPACTSLOCAL STRUCTURES ESTABLISHED TO ENACT REGULATIONS AND RESOLVE DISPUTESMONITORING OF ILLEGAL TRADING, CRIME AND CORRUPT PRACTICESSERVICE DELIVERY IMPROVEMENTSCULTURE OF CUSTOMER SERVICE AND UNDERSTANDING OF SMALL BUSINESSESUNDERSTAND UNINTENDED SYSTEMIC CONSEQUENCES OF LABOUR AND INSITUTIONAL LEGISLATIONESTABLISH MECHANISMS TO RECORD TRENDS IN THE SMALL BUSINESS ENVIRONMENTRECOGNISE THE NEED TO DEAL WITH SMALL BUSINESSES AS A DISTINCTIVE BUSINESS FORM
