redevelopment study area report - phoenix, arizona · 2014-05-20 · joel mccabe randall mclaughlin...
TRANSCRIPT

Redevelopment Study Area Report
February 2013

1 NMRSA Report
February 14, 2013
CITY COUNCIL
Mayor Greg Stanton Councilwoman Thelda Williams, D1
Councilman Jim Waring, D2 Vice- Mayor Bill Gates, D3
Councilman Tom Simplot, D4 Councilman Daniel Valenzuela, D5
Councilman Sal DiCiccio, D6 Councilman Michael Nowakowski, D7
Councilman Michael Johnson, D8
PLANNING COMMISSION
Dwight Amery Thomas Awai Robert Beletz Nicole Davis Karen Heck Derek Horn
Andrea Katsenes Terry Madeksza John Montalvo
William Whitaker
CITY MANAGEMENT
David Cavazos, City Manager Jerome Miller, Deputy City Manager Rick Naimark, Deputy City Manager Lisa Takata, Deputy City Manager
PLANNING AND DEVELOPMENT
DEPARTMENT
Derek Horn, Acting Planning and Development Director
Alan Stephenson, Acting Deputy Director
PROJECT TEAM
Joshua Bednarek, Planner III Christopher DePerro, Principal Planner
Max Enterline, Planner II Vania Fletcher, Planner I Kelly Kvetko, Planner III
Marvin Martinez, Information Technology Analyst /Programmer III Craig Mavis, Planner II
David Miller, GIS Technician Marc Thornton, Planner II
Margaret Wilson, Assistant City Attorney
SPECIAL THANKS
Kevin Weight, Planner III, Historic Preservation Office
John Chan, Community and Economic Development Department Director
Donna Kennedy, Economic Development Program Manager
Chris Hallet, Neighborhood Services Department Director
Lisa Huggins-Hubbard, Neighborhood Specialist
Patrick Ravenstein, Code Compliance Supervisor
NORTH MOUNTAIN VILLAGE
PLANNING COMMITTEE
Chair, Robin Schneider Vice Chair, Robert Beletz
Stephanie Brewer Pamala Doan
Ted Donley Fred Hepperle
Jim Larson Shelley MacDonald
Joel McCabe Randall McLaughlin
Eric Mears Doug Mings Sissie Shank
Marcia Veidmark Donna Wiedoff
Patricia Wilkinson Glennis Zeeb
2 NMRSA Report
February 14, 2013
Executive Summary The Mayor and City Council initiated this report to analyze the current
building, land use and area conditions for the North Mountain
Redevelopment Area (NMRSA). The area is bounded by 19th Avenue
and 15th Avenue on the east; Cholla Street, Sahuaro and Peoria
Avenues on the north; 35th Avenue on the west; and Butler, Alice and
the Arizona Canal on the south.
The primary purpose for the study is to evaluate conditions of the area
and determine if the area is blighted and arresting sound municipal
growth within the area.
The study is divided into six sections which describe the history and
boundaries of the area, past planning and revitalization efforts in the
city and throughout the city, demographic, land use and zoning
background in addition to a physical survey of the existing conditions
and statistical information.
The study identifies the following blight conditions that warrant
designating the area as a redevelopment area:
1) Dominance of defective or inadequate street layout in some areas;
2) Faulty lot layout in relation to size, adequacy, accessibility or
usefulness;
3) Unsanitary or unsafe conditions;
4) Deterioration of site or other improvements;
5) Improper or obsolete subdivision platting.
6) There are conditions that endanger life or property by fire, criminal
activity and other causes.
This study recommends that the Mayor and Council make a finding that a predominance of the
properties are impacted by one or more of the above blight conditions and that it should be
declared a redevelopment area.
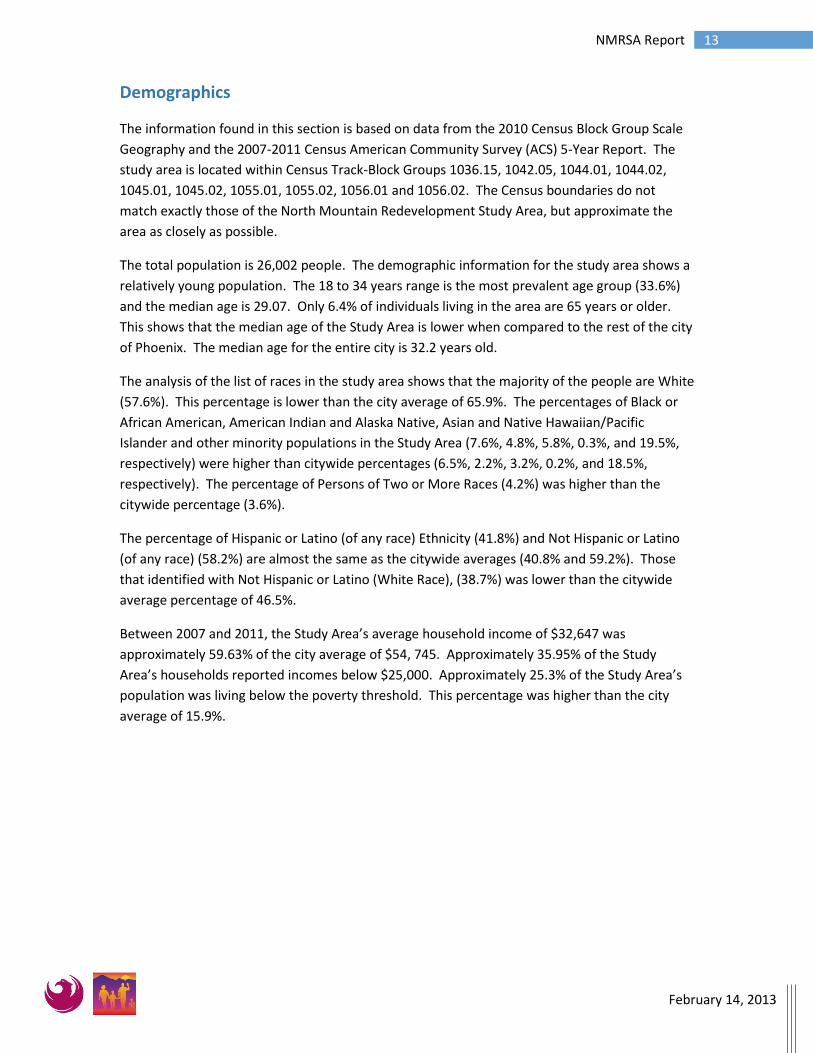
Vacant property in NMRSA
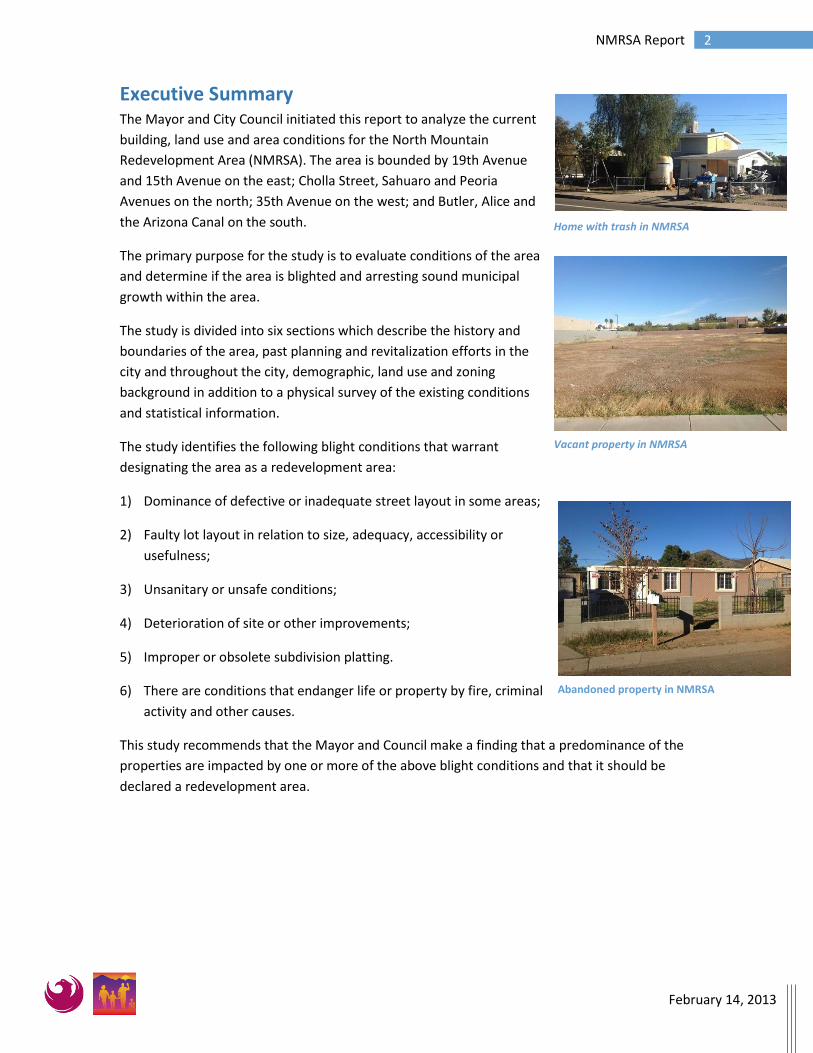
Home with trash in NMRSA
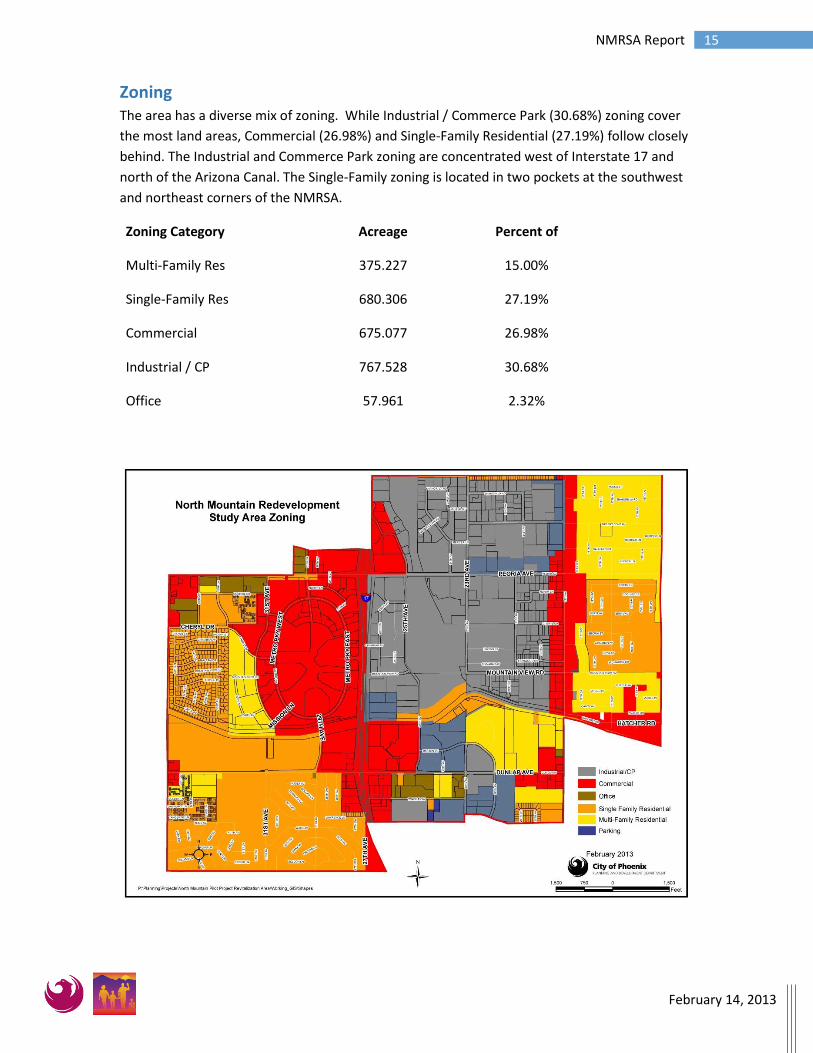
Abandoned property in NMRSA

3 NMRSA Report
February 14, 2013
Report Outline
Redevelopment Area
- Redevelopment Area Overview …………………………………………….………pg. 4
- Redevelopment Area Requirements……………………………………...………pg. 5
North Mountain Redevelopment Study Area (NMRSA)
- Boundaries & Context…………………………………………………………………..pg. 6
- History………………………………………………………………………………………….pg. 7
NMRSA Past Planning / Revitalization Efforts
- Fightbacks…………………………………………………………………………….………pg. 10
- North Mountain Industrial and Commercial Area Study……….………pg. 11
- Urban Land Institute Arizona Technical Panel…………………….………..pg. 12
NMRSA Overview
- Demographics………………………………………………………….………………….pg. 13
- Land Use………………………………………………………………….………………….pg. 14
- Zoning……………………………………………………………………….………………..pg. 15
Area Conditions
- Property Conditions Survey………………………………………..……………….pg. 16
- A.R.S. Conditions Survey……………………………………………..………………pg. 17
- Vacant Property……………………………………………….………….……………..pg. 26
- Environmental Data………………………………………….………….…………….pg. 28
Analysis and Conclusion
- Findings………………………………………………………………..……………………pg. 29

4 NMRSA Report
February 14, 2013
Redevelopment Area Overview Deteriorated and blighted conditions - from abandoned or vacant properties to buildings with
debris and graffiti - create a multitude of negative impacts on a neighborhood’s quality of life.
These conditions diminish property values within the entire area and compromise the health,
safety and welfare of residents and businesses. Over the long-term, deterioration and blight
contribute to the neighborhood’s instability and results in a decrease in private investment and
a loss in tax revenue that supports community services. The end result is a cycle of decline with
long lasting impacts.
Stabilizing declining neighborhoods by reversing the spread of blight has been a long-standing
goal for the city of Phoenix and its residents. As a means of accomplishing this goal the city of
Phoenix has established and administered 18 Redevelopment Areas. Designation of
neighborhoods as Redevelopment Areas provides the legal basis to enable the city of Phoenix to
work with community stakeholders to help apply for various funding sources that are aimed at
revitalizing the area. The map to the right illustrates the locations of the city’s 18
Redevelopment Areas along with the
NMRSA. A majority of the 18
Redevelopment Areas are located in the
central and southern portions of the city.
While the city’s Redevelopment Area
program has been successful, several of
the past redevelopment areas were
designated to combat not only blight, but
slum conditions as well. The existence of
slum conditions, in addition to blight,
requires a significant amount of resources
to address and can take several years
before any measureable progress is seen.
The city of Phoenix is adopting the
approach of establishing this
Redevelopment Areas when blight is
present and before slum conditions
result. This new approach allows for a
more lean and efficient revitalization
effort to occur.

5 NMRSA Report
February 14, 2013
Redevelopment Area Requirements Arizona Revised Statutes (A.R.S. 36-1471 et. seq.) outlines several criteria that must be met for a
municipality to make a finding that an area is blighted. This study provides a summary of key
demographic data and documents blight within the NMRSA to substantiate designation of it as a
redevelopment area. A.R.S. 36-1471 defines a blighted area as: “An area other than a slum area
where sound municipal growth and the provision of housing accommodations is substantially
retarded or arrested in a predominance of the properties by any of the following:
a) A dominance of defective or inadequate street layout;
b) Faulty lot layout in relation to size, adequacy, accessibility or usefulness;
c) Unsanitary or unsafe conditions;
d) Deterioration of site or other improvements;
e) Diversity of Ownership;
f) Tax or special assessment delinquency exceeding the fair value of the land;
g) Defective or unusual conditions of title;
h) Improper or obsolete subdivision platting
i) The existence of conditions that endanger life or property by fire and other causes. “
The purpose of this report is to evaluate if the NMRSA meets the statutory requirements to
declare this area blighted and establish a redevelopment area pursuant A.R.S. 36-1471 et. seq.
Once these findings are made by the Phoenix City Council, the City may assist residents,
property owners and business groups to apply for grants and other funding mechanisms to help
eliminate blight. The City will also prepare a Redevelopment Plan for the area. The plan will
outline local objectives as to appropriate land uses, improved infrastructure, public
transportation, and other items of concern based upon public input during the planning process.
Fence in disrepair in NMRSA Substandard home addition in NMRSA

6 NMRSA Report
February 14, 2013
Boundaries and Context
The southern portion of the
NMRSA captures the Northwest
Extension of the METRO light rail
line which includes a light rail
station at 19th and Dunlap
avenues. At the time of this report
construction of the line is ongoing
and scheduled to be completed
and operational in early 2016.
The NMRSA is located approximately 10 miles
northwest of Downtown Phoenix and is
approximately 2,500 acres in size.
The boundaries for the study area are illustrated
in the maps below and to the right. Major
landmarks within the NMRSA include: the Rose
Mofford Sports Complex; Metro Center Mall;
and the Arizona Canal

7 NMRSA Report
February 14, 2013
History
The NMRSA was part of the vast agricultural west
valley – fertile land that benefited from the
Arizona Canal. With the exception of canal right-
of-way and the Cave Creek Wash flood zone, the
bulk of its 4 square acres remained mostly
agricultural until the late 1950's. There was one
noticeable exception - between 1941 and 1942
the Army Air Force (AAF) built the Auxiliary
Airport A-3 on a full quarter section (160 acres) as a
support to Thunderbird Airfield and as a training facility for cadets. The earliest aerial photo of
the site is an AAF image from June 17, 1943 and there wasn’t much in the area.
In 1948 the airfield was established as a civil airport and became the Paradise Airport. In fact, it
could be seen from the air since the name of the airport was painted on top of the building.
Although the airport had been in operation since 1942, it did not spur a lot of development in
the NMRSA. The aerial photographs from 1949 show a few scattered homes between 19th and
15th avenues, from Peoria Avenue to the Arizona Canal.
In 1954, the first subdivision in the study area was platted at the corner of Butler Drive and 31st
Avenue, as part of a large development called Alta Vista. However, most of the early industrial
and commercial development settled east of the airport and south towards the canal. In fact, the
homes built by the canal were quickly being replaced by commercial buildings. The aerial image
from 1959 below shows the airport had grown to three unpaved runways and several hangars.
Although quite a few aircraft can be seen on the airport’s ground, that was the end of the road
because just one year later the Paradise Airport closed.
Source: www.airfieldsdatabase.com
Above: Paradise Airport, 1949. You can make out the name
of the airport painted in white on the rooftop.
Left: Paradise Airport, 1959 just before it closed.

8 NMRSA Report
February 14, 2013
History
By 1962 the airport’s 160 acres
were empty, but two major
employers settled in the area:
Arizona Public Service on part of
the airport site and the City of
Phoenix at 29th Avenue for a
waste water treatment plant.
Otherwise, agricultural uses
continued to exist to the west
along the Interstate 17/Black
Canyon Freeway and the Cave
Creek Wash area until around
1969.
In November 1970, Westcor
announced the concept for the
Metrocenter Mall at I-17, and the
first site plans and artist
renderings were introduced in the
spring of 1972. The mall opened for business in October 1973, as the first two-level, five-anchor
mall in the U.S. It was the largest shopping center in Arizona.
Significant Structures
Most of the study area’s commercial development occurred during the late part of the Postwar
Period, as defined in the report Phoenix Commercial Architecture: 1945-1975, prepared for the
City of Phoenix by Ryden Architects, Inc. The document identified three properties as eligible for
historic designation by the City of Phoenix, and all three are showcased as outstanding
architectural examples in the book MidCentury Marvels, Commercial Architecture of Phoenix
1945-1975, produced by the City of Phoenix Historic Preservation Office.
APS Administration Building at 21 W. Cheryl
Drive
Formalism emphasizes the massing of
building and the visual relationships between
the building’s parts and the entire work. Local
architects Guirey, Srnka and Arnold’s
approach incorporated the proportions,
orientation and shading strategies of the
building to take into consideration solar
angles and the heat factor of Phoenix climate.
1949 aerial photograph of the study area. Source: Flood Control
District, Maricopa County

9 NMRSA Report
February 14, 2013
The architects created highly detailed pierced concrete screen panels that are suspended two
feet away from the building’s glass curtain walls (City of Phoenix Historic Preservation Office,
2011).
Valley National Bank, 2950 W. Peoria Avenue
Tom Zimmerman created his own regional
interpretation of Modern Architecture by
incorporating the characteristics of the indigenous
Hopi Pueblo and the rounded corners and massive
solid walls reminiscent of Frank Lloyd Wright’s
Johnson Wax Building. This building demonstrates
how primitive forms and Modernism often share
the ability to s trip away the superficial
ornamentation to reveal the important essentials (City
of Phoenix Historic Preservation Office, 2011).
Western Savings Branch Bank, 10005 N. Metro
Parkway E.
Designed by W. A. Sarmiento, this unique sculptural
shape and organic form is a fine example of
Expressionism, which was seldom built in Phoenix.
The few that exist, however, are very dramatic. The
design was probably inspired by the work of
architect Oscar Niemeyer’s famous round Cathedral
of Brasilia. Not surprising since Sarmiento briefly
worked as a junior drafter for the world-renowned
architect (City of Phoenix Historic Preservation
Office, 2011)
Metro Medical Plaza, 3201 W. Peoria
Designed by the Associate Design Group, the four
buildings wings originate from a central and four
secondary courtyards which are covered by a floating
frame that unifies the complex and responds to the
desert climate (City of Phoenix Historic Preservation
Office 2011).

10 NMRSA Report
February 14, 2013
Past Planning and Revitalization Efforts
The neighborhoods and businesses within the NMRSA have been the target of many past
revitalization and planning efforts. These efforts, which include a series of “Fightbacks”, the
North Mountain Commercial and Industrial Study, and the Urban Land Institute’s Arizona
Technical Panel, demonstrate a long standing commitment by the community to attempt to
improve the area.
Fightbacks
From 1993 to 2008 the city of Phoenix administered the Neighborhood Fightback Program. The
program designated neighborhoods for specialized city support for a limited time to assist with
resident-driven neighborhood improvement efforts. During this time frame, eleven Fightback
programs were established in and adjacent to the NMRSA. The table and map below provide a
summary of the subject Fightbacks.
Fightback Year Map #
Fightback District 1 1993 - 1994 10
Shaw Butte 1996-1997 2
Cholla 1997-1998 1
Save Our Sunnyslope 1998-99 3
Save Our Sunnyslope II 2000-2001 4
Alta Vista 2001-2002 11
Mountain View 2002-2003 5
Manzanita 2003-2004 9
Dunlap Peoria Neighborhood Revitalization 2004-2005 8
Metro Center 2006-2007 6
Metro Center Neighborhood II 2007-2008 7

11 NMRSA Report
February 14, 2013
North Mountain Industrial and Commercial Area Study
In 2011, the North Mountain Industrial and Commercial Area (NMICA) Study was conducted to
identify both assets and constraints that could assist the area’s businesses as they investigated
the possibility of forming a business alliance. The catalyst for the study was two-fold: a group of
businesses had organized to oppose a Zoning Adjustment Use Permit request; and the 50-acre
Karsten PING facility’s plans to re-investment in its existing campus.
The study concluded with a set of recommendations, the primary one being that a business
alliance for the area’s many businesses be formed. Participating members would benefit
through on-going interaction, improved communication, pooling of advertising and marketing
dollars, negotiating better prices for services and products, crime reduction, and improved
visibility within the local community. Shortly thereafter, the North Mountain Business Alliance
was formed.
The map below illustrates the NMICA study’s boundaries in context with the NMRSA’s
boundaries.

12 NMRSA Report
February 14, 2013
Urban Land Institute (ULI) Arizona Technical Panel (AzTAP)
In the fall of 2009, the city of Phoenix, in coordination
with the Urban Land Institute (ULI), hosted an AzTAP
(Arizona Technical Assistance Panel) event to analyze the
growth potential of the area around the Metrocenter
Mall and the North Mountain Village Core. The AzTAP
gathered prominent business owners, developers, design
consultants and real estate for this endeavor. Although
the panel focused on the Village Core, information
regarding the larger area was studied and the panel
toured the area as well, a small portion of which included
this study area. (See map of area as Exhibit A). The
panel looked at existing land uses, connectivity, light rail,
Interstate 17 and existing strengths and weaknesses.
Seven priorities were identified by the panel:
1. Locate a light rail station at or near the Metrocenter.
2. Enhance canal banks and improve connectivity.
3. Double the density of residential in multiple product types.
4. Fix Metrocenter Mall through visioning and master planning efforts.
5. Encourage the City of Phoenix to take a lead and coordinate with other entities.
6. Facilitate the creation of a trail system with a connection under Interstate 17 and over to
the Phoenix Mountains Preserve.
7. Promote the area as a higher education destination.
Participants in the AzTAP believed that addressing these issues would strengthen existing
businesses in the surrounding area and spur redevelopment of distressed properties.
13 NMRSA Report
February 14, 2013
Demographics
The information found in this section is based on data from the 2010 Census Block Group Scale
Geography and the 2007-2011 Census American Community Survey (ACS) 5-Year Report. The
study area is located within Census Track-Block Groups 1036.15, 1042.05, 1044.01, 1044.02,
1045.01, 1045.02, 1055.01, 1055.02, 1056.01 and 1056.02. The Census boundaries do not
match exactly those of the North Mountain Redevelopment Study Area, but approximate the
area as closely as possible.
The total population is 26,002 people. The demographic information for the study area shows a
relatively young population. The 18 to 34 years range is the most prevalent age group (33.6%)
and the median age is 29.07. Only 6.4% of individuals living in the area are 65 years or older.
This shows that the median age of the Study Area is lower when compared to the rest of the city
of Phoenix. The median age for the entire city is 32.2 years old.
The analysis of the list of races in the study area shows that the majority of the people are White
(57.6%). This percentage is lower than the city average of 65.9%. The percentages of Black or
African American, American Indian and Alaska Native, Asian and Native Hawaiian/Pacific
Islander and other minority populations in the Study Area (7.6%, 4.8%, 5.8%, 0.3%, and 19.5%,
respectively) were higher than citywide percentages (6.5%, 2.2%, 3.2%, 0.2%, and 18.5%,
respectively). The percentage of Persons of Two or More Races (4.2%) was higher than the
citywide percentage (3.6%).
The percentage of Hispanic or Latino (of any race) Ethnicity (41.8%) and Not Hispanic or Latino
(of any race) (58.2%) are almost the same as the citywide averages (40.8% and 59.2%). Those
that identified with Not Hispanic or Latino (White Race), (38.7%) was lower than the citywide
average percentage of 46.5%.
Between 2007 and 2011, the Study Area’s average household income of $32,647 was
approximately 59.63% of the city average of $54, 745. Approximately 35.95% of the Study
Area’s households reported incomes below $25,000. Approximately 25.3% of the Study Area’s
population was living below the poverty threshold. This percentage was higher than the city
average of 15.9%.

14 NMRSA Report
February 14, 2013
Land Use Varying degrees of each of the three major land use categories (Residential, Industrial,
Commercial) are found within the NMRSA as illustrated in the map below. There are
subdivisions of single-family residences in the eastern, western and southwestern portions of
the NMRSA. Multi-family residential uses are commonly found adjacent to the single-family
residences. These multi-family uses act as a buffer between the single family homes and more
intense uses, such as industrial and commercial.
The scale of the commercial uses greatly ranges from small corner store convenience markets to
Metrocenter Mall. With the exception of the aforementioned residential land uses, commercial
land uses are prevalent throughout the NMRSA.
Industrial uses also a strong presence in the NMRSA. Along the west side of 19th Avenue,
starting north of the Arizona Canal and spreading north and west from that point to the
northern boundary of the NMRSA, are a mix of both indoor and outdoor industrial uses.
The Rose Mofford Sports Complex and Cave Creek Wash are located within the NMRSA. Both
provide excellent recreational opportunities for individuals who work, live, or play in the
NMRSA. Bisecting the NMRSA from west to east is the Arizona Canal. Along both sides of the
canal is the Arizona Canal Trail. The trail is paved and is used by bicyclists and joggers.
15 NMRSA Report
February 14, 2013
Zoning The area has a diverse mix of zoning. While Industrial / Commerce Park (30.68%) zoning cover
the most land areas, Commercial (26.98%) and Single-Family Residential (27.19%) follow closely
behind. The Industrial and Commerce Park zoning are concentrated west of Interstate 17 and
north of the Arizona Canal. The Single-Family zoning is located in two pockets at the southwest
and northeast corners of the NMRSA.
Zoning Category Acreage Percent of
Multi-Family Res 375.227 15.00%
Single-Family Res 680.306 27.19%
Commercial 675.077 26.98%
Industrial / CP 767.528 30.68%
Office 57.961 2.32%
NMRSA: Commercial and Retail

16 NMRSA Report
February 14, 2013
Area Conditions This section is comprise of three parts – a property condition survey conducted by the
Neighborhood Services Department; a “windshield survey” and research done by the Planning
and Development Department to evaluate other conditions to ascertain if the Arizona Revised
Statutes (A.R.S) conditions for a Redevelopment Area exist; and a report of two other elements
of the NMRSA – Vacant Property and Environmental Data.
Property Conditions Survey
A property condition survey was conducted on February 1, 2013, in the NMRSA by the city of
Phoenix Neighborhood Services Department. Properties were visually inspected for the
following code violations:
Over height / dead vegetation: Property owners are responsible for keeping their
properties, and the adjacent rights of way, free of dead or dried vegetation (weeds, tall
grass, tumbleweeds, shrubs, trees, palm fronds, etc.). All dead or dried vegetation must
be removed and disposed of properly. Property owners are also responsible for
assuring that grass and weeds on their property and in the adjacent rights of way do not
exceed six inches in height.
Inoperable vehicles: Inoperable vehicles must not be visible from beyond the bounds of
the property. An inoperable vehicle is one that is not equipped with all parts that are
required to legally and safely operate on public streets and/or cannot be driven under
its own power. Car covers, tarps, bamboo, shades and other similar types of materials
are not acceptable screening.
Trash / litter: Property owners are responsible for keeping their property free of junk,
litter and debris. This includes tires, junk, furniture, building and landscaping material;
litter such as discarded paper, cardboard, plastics, etc.; debris such as tree trimmings
and fallen tree limbs; or any other discarded items.
Outside storage: Outside storage of personal property at residentially zoned properties
is limited to the rear yard behind the primary structure only. Any building or landscape
materials for use on the property, machinery, appliances or parts/auto parts may not be
visible from beyond the boundaries of a residentially zoned property. Outdoor storage
of items for commercial or business use at a residential property is not allowed. There
are specific regulations that apply to outdoor storage and use on properties zoned for
other than residential use that vary by zoning district.
Fences in disrepair: Fences and screening walls must be structurally sound and made
from the same materials. They also must be maintained so that they are free from
deterioration and blight. Some examples include fences or walls that are leaning,
missing slats or blocks, rotted or damaged.
Non-Dustproof Parking: All parking and maneuvering areas must be dust proofed
according to city specifications. Specific standards vary by zoning district.
Over 45% Parking: Residents are permitted only to utilize a maximum of 45% of their
front yards for vehicular parking.
17 NMRSA Report
February 14, 2013
Graffiti: The property owner is responsible for removing graffiti from all sidewalks,
walls, fences, signs and other structures or surfaces visible from beyond the bounds of
the property. The city can provide free paint and graffiti removal supplies, as well as
assistance for those unable to physically remove graffiti themselves.
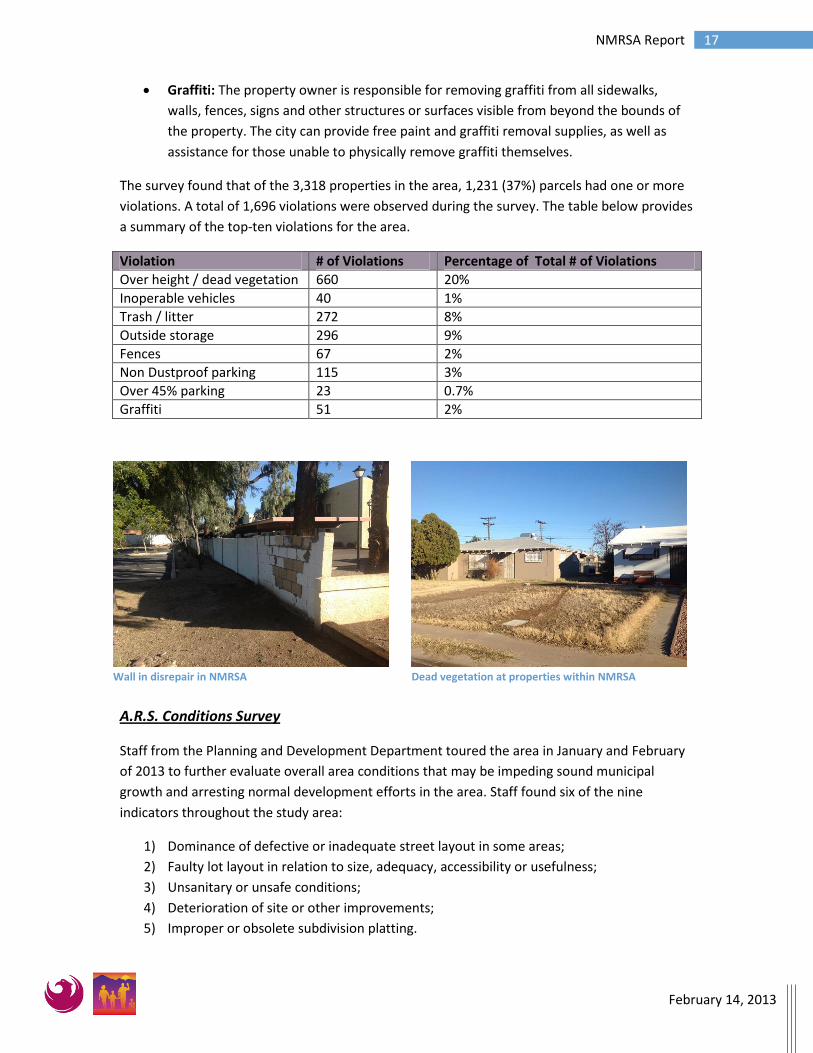
The survey found that of the 3,318 properties in the area, 1,231 (37%) parcels had one or more
violations. A total of 1,696 violations were observed during the survey. The table below provides
a summary of the top-ten violations for the area.
Violation # of Violations Percentage of Total # of Violations
Over height / dead vegetation 660 20%
Inoperable vehicles 40 1%
Trash / litter 272 8%
Outside storage 296 9%
Fences 67 2%
Non Dustproof parking 115 3%
Over 45% parking 23 0.7%
Graffiti 51 2%
A.R.S. Conditions Survey
Staff from the Planning and Development Department toured the area in January and February
of 2013 to further evaluate overall area conditions that may be impeding sound municipal
growth and arresting normal development efforts in the area. Staff found six of the nine
indicators throughout the study area:
1) Dominance of defective or inadequate street layout in some areas;
2) Faulty lot layout in relation to size, adequacy, accessibility or usefulness;
3) Unsanitary or unsafe conditions;
4) Deterioration of site or other improvements;
5) Improper or obsolete subdivision platting.
Wall in disrepair in NMRSA Dead vegetation at properties within NMRSA

18 NMRSA Report
February 14, 2013
6) There are conditions that endanger life or property by fire, criminal activity and other
causes.
1) Dominance of defective or inadequate street layout in some areas
A defective or inadequate street layout impedes normal development efforts because of the
significant costs to replace infrastructure. There are streets within the NMRSA that dead end
into alleys and non-existing or inadequate cul-de-sacs for proper passenger or emergency
vehicle ingress / egress. These factors, combined with the smaller lot sizes, make it economically
inefficient for someone to redevelop a small parcel and face the financial burden of replacing
inadequate street infrastructure.
The Metrocenter Mall ring road is a defective street layout for a regional shopping center. The
concept of a central shopping district encircled by a drive aisle is a product of an automobile
oriented era of design and development that makes it nearly impossible to redevelop in a
manner consistent with market trends. Newer regional shopping center street layouts, like
those found in Kierland Commons or the Scottsdale Quarter, utilize small block patterns and are
focused around the pedestrian. Automobile traffic in these centers is largely contained in one
area. The end result is a pedestrian friendly environment with the flexibility to incorporate a
myriad of activities and stores.
The dominance of these defective and inadequate street layouts combined with the other blight
factors are impeding sound municipal growth of this area as a continued employment hub and
village core. It is also substantially arresting the provision of housing within the village core and
existing residential areas.
2) Faulty lot layout in relation to size, adequacy, accessibility or usefulness
As highlighted in the Land Use and Zoning sections of this report, a large portion of the NMRSA
east of the Interstate 17 freeway is defined by a variety of uses and A-1 Light Industrial zoning.
The A-1 Light Industrial District is a district of industrial uses designed to serve the needs of the
Undedicated street Right-of-Way in NMRSA Dead end street in NMRSA

19 NMRSA Report
February 14, 2013
A-1 Zoned Properties
community for industrial activity not offensive to nearby commercial and industrial uses.
Manufacturing and storage are two of the most common uses found on properties zoned A-1.
In order to ensure that uses such as storage
or manufacturing do not negatively impact
any nearby commercial or residential
properties, the A-1 District contains
standards that require significant setbacks
for open storage and uses. These setbacks
are meant to encourage properties with A-1
zoning to be of a sufficient size so that they
may be developed in accordance with the
district’s requirements. A-1 zoned properties
smaller in size have challenges meeting the
district’s setback standards for industrial type
uses, and as a result are not able to utilize
the full breadth of their A-1 zoning
entitlement. The map to the right highlights
the existence of a cluster of these smaller A-1
properties within the NMRSA. Sixty-five
percent (65%) of the parcels in this area are
less than 0.5 acres in size.
This concentration of smaller industrially
zoned properties could prove to be a significant hurdle for revitalization and redevelopment.
Due to the small lot sizes and distance from residential uses or zoning, there are several less
desirable uses permitted by right within the A-1 Zoning District. The uses include an adult
bookstore, adult novelty store, adult theater, adult live entertainment, erotic dance or
performance studio. In fact there are already three of these uses located within the NMRSA.
Without some type of mitigation the area’s A-1
Industrial Zoning and distance from residential
zoning makes it a potential destination for a set of
uses that conflict with the community’s short and
long term goals for the area The typical lot size in
this cluster is inadequate to meet the required
setbacks for outdoor storage uses as primarily
intended by the A-1 Light Industrial zoning district.
A-1 Zoned property with narrow lot distribution

20 NMRSA Report
February 14, 2013
3) Unsanitary or unsafe conditions
Unsanitary or unsafe conditions arise when a property is not maintained and falls into disrepair.
This type of blighting experience can take many forms: from dilapidated structures, such as
fences or buildings; to boarded up vacant buildings that are easily broken into and make people
feel unsafe while in the area. It can also take the form of a lack of infrastructure such as
sidewalks. There are numerous parcels within the NMRSA that demonstrate unsanitary
conditions such as outdoor storage in the front yard of a residentially zoned parcel, dilapidated
structures, and unsafe outdoor storage conditions within A-1 Industrial zoned properties. The
photos below illustrate some of these conditions within the study area.
4) Deterioration of site or other improvements
Numerous parcels within NMRSA demonstrate characteristics of site deterioration. As stated in
the historical write-up for the NMRSA, it first started to develop in the 1950’s. The City of
Phoenix did not annex this area until the 1960’s and 1970’s. Maricopa County did not have a
building code until the 1970’s, therefore a number of the structures that were built in prior
years did not meet the city’s existing building code. In addition to older residential and
industrial structures there are a number of commercial sites that exhibit site deterioration
factors such as little or no landscape, deteriorated parking lot pavement and dilapidated
infrastructure. The photos below illustrate some of these conditions within the study area.
Boarded-up single-family home in NMRSA Vacant property with electric fence and barbed wire
Vacant commercial site with no landscaping
Residential property with apparent non-permitted construction

21 NMRSA Report
February 14, 2013
Non-conforming or
unapproved lot
divisions
5) Improper or obsolete subdivision platting
The area between 19th Avenue, Cholla Street, the Phoenix Mountain Preserve boundary, 15th
Avenue and the Arizona Canal has more unapproved lot divisions than the citywide average.
Unapproved lot divisions are ones that have been recorded with Maricopa County but are not
recognized by the City of Phoenix because they have not completed the review process to
determine if they meet City lot division requirements or because they have not submitted a
subdivision plat for review by the City of Phoenix. This data indicates that at least some of these
parcels will have trouble meeting city development requirements and likely lead to
development that does not meet city requirements because of the lack of subdivision platting or
improper/obsolete subdivision platting in the area.
6) There are conditions that endanger life or property by fire, criminal activity and other
causes.
The NMRSA has experienced a significantly higher rate of Fire Department investigation and
violent crime when compared to the city as a whole. The information below provides a summary
of this data.
Fire Statistics
The NMRSA is served by Fire Station #60 located at 2405 W. Townley Road and Fire Station
#33 located at 2409 W. Cactus Road.
The following statistics represent the top ten types of fires within NMRSA from 2007 to 2012.
Single-family parcel with three dwelling units

22 NMRSA Report
February 14, 2013
Type of Fire Number of Fires
Alley Fire 32
Apartment Fire 58
Check Fire reported out 83
Check Smoke 56
Debris Fire 60
Dumpster Fire 173
Illegal Burning 44
Structure Fire 48
Unknown Fire 100
Vehicle Fire 155
The following matrix represents the number of fires and investigations per square mile from
2007 to 2012 located in the City of Phoenix and within the NMRSA. The numbers show that per
square mile the NMRSA is consistently higher, in some cases double, in the percentage of fires
and investigations than the city as a whole.
Investigations Fires Square Miles
Investigations per square mile
Fires per square miles
2007
City of Phoenix 850 19483 566.80 1.49 34.37
NMRSA 13 219 3.9 3.33 56.15
2008
City of Phoenix 844 17656 567.27 1.48 31.13
North Mountain 19 201 3.9 4.87 51.53
2009
City of Phoenix 730 16860 568.46 1.28 29.65
North Mountain 13 147 3.9 3.33 37.69
2010
City of Phoenix 741 15847 568.49 1.30 27.87
North Mountain 12 149 3.9 3.07 38.20
2011
City of Phoenix 815 16703 568.52 1.43 29.37
North Mountain 15 164 3.9 3.84 42.05
2012
City of Phoenix 803 16510 568.5 1.41 29.04
North Mountain 13 154 3.9 3.33 39.48
2007-2012
City of Phoenix 4783 103059 568.5 8.38 181.28
North Mountain 85 1034 3.9 21.79 265.12

23 NMRSA Report
February 14, 2013
The map below provides a geographic summary where the fire and fire investigations occurred
within the study area.
Fire damaged apartment complex in NMRSA
2007-2012

24 NMRSA Report
February 14, 2013
Crime Statistics
Crime statistics in the NMRSA were gathered for the years of 2010 and 2011. Complete data for all of 2012 was not yet available to be broken down into an analysis by crime grid. The data indicates that there are more crimes per 1,000 persons within the NMRSA in several major categories such as aggravated assault, robbery, burglary, and theft. The below tables provide a breakdown in key categories and clearly indicate that criminal activity, that is in some cases double the citywide average, is endangering life and property.
2010 CRIME STATISTICS
Number Reported Per 1000 population
City-wide NMRSA City-wide NMRSA
Aggravated Assault 4,113 114 2.85 4.65
Homicide 116 5 0.08 0.20
Rape 522 16 0.36 0.65
Robbery 3,250 132 2.25 5.38
All Violent Crimes 8,001 267 5.53 10.88
Arson 320 4 0.22 0.16
Burglary 15,626 345 10.81 14.06
Theft (Automobile) 7,777 353 5.38 14.39
Theft (Larceny) 38,012 1236 26.29 50.38
All Property Crimes 61,735 1938 42.70 78.99
City Population (2010 Census) 1,445,632
NMRSA Population* (2010 Census) 24,535
**Population is different than reported elsewhere in this study because of slight variation in land area analyzed for crime statistics.
Source: City of Phoenix Police Department

25 NMRSA Report
February 14, 2013
2011 CRIME STATISTICS
Number Reported Per 1000 population
City-wide NMRSA City-wide NMRSA
Aggravated Assault 4,090 112 2.83 4.56
Homicide 120 1 0.08 0.04
Rape 559 14 0.39 0.57
Robbery 3,324 121 2.30 4.93
All Violent Crimes 8,093 248 5.60 10.11
Arson 273 7 0.19 0.29
Burglary 18,666 453 12.91 18.46
Theft (Automobile) 7,555 327 5.23 13.33
Theft (Larceny) 38,258 1208 26.46 49.24
All Property Crimes 64,752 1995 44.79 81.31
City Population (2010 Census) 1,445,632
NMRSA Population* (2010 Census) 24,535
**Population is different than reported elsewhere in this study because of slight variation in land area analyzed for crime statistics.
Source: City of Phoenix Police Department
26 NMRSA Report
February 14, 2013
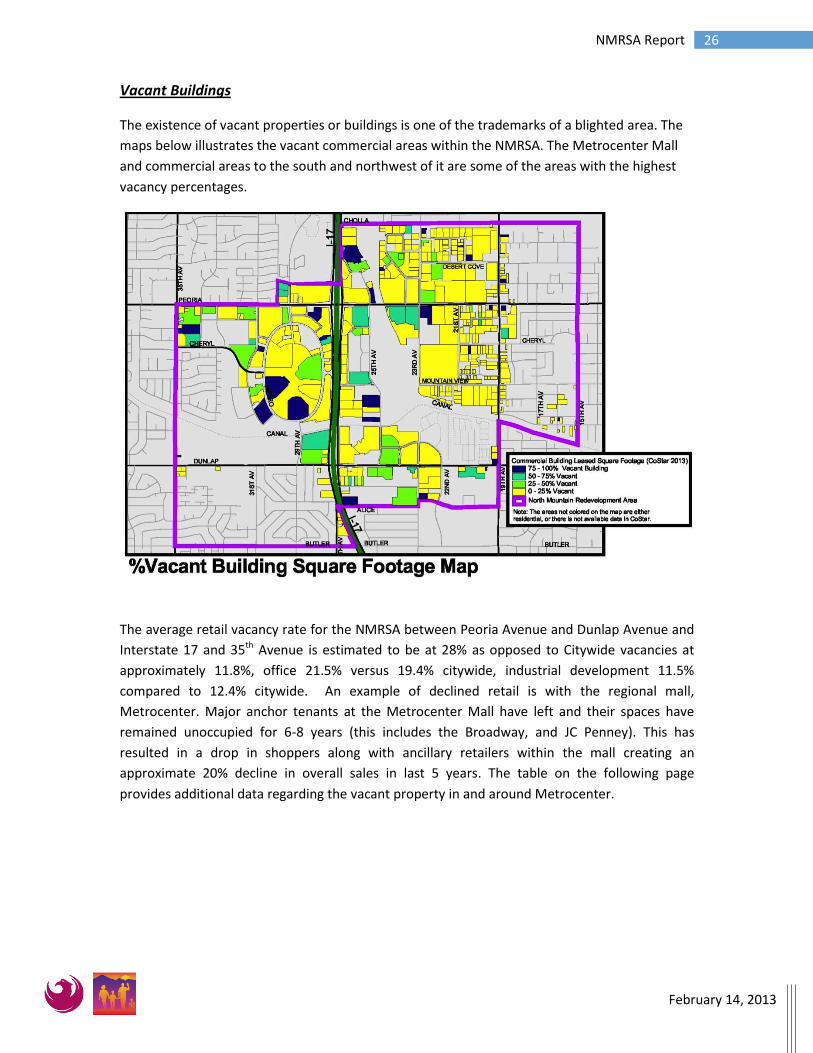
Vacant Buildings
The existence of vacant properties or buildings is one of the trademarks of a blighted area. The
maps below illustrates the vacant commercial areas within the NMRSA. The Metrocenter Mall
and commercial areas to the south and northwest of it are some of the areas with the highest
vacancy percentages.
The average retail vacancy rate for the NMRSA between Peoria Avenue and Dunlap Avenue and
Interstate 17 and 35th Avenue is estimated to be at 28% as opposed to Citywide vacancies at
approximately 11.8%, office 21.5% versus 19.4% citywide, industrial development 11.5%
compared to 12.4% citywide. An example of declined retail is with the regional mall,
Metrocenter. Major anchor tenants at the Metrocenter Mall have left and their spaces have
remained unoccupied for 6-8 years (this includes the Broadway, and JC Penney). This has
resulted in a drop in shoppers along with ancillary retailers within the mall creating an
approximate 20% decline in overall sales in last 5 years. The table on the following page
provides additional data regarding the vacant property in and around Metrocenter.
27 NMRSA Report
February 14, 2013
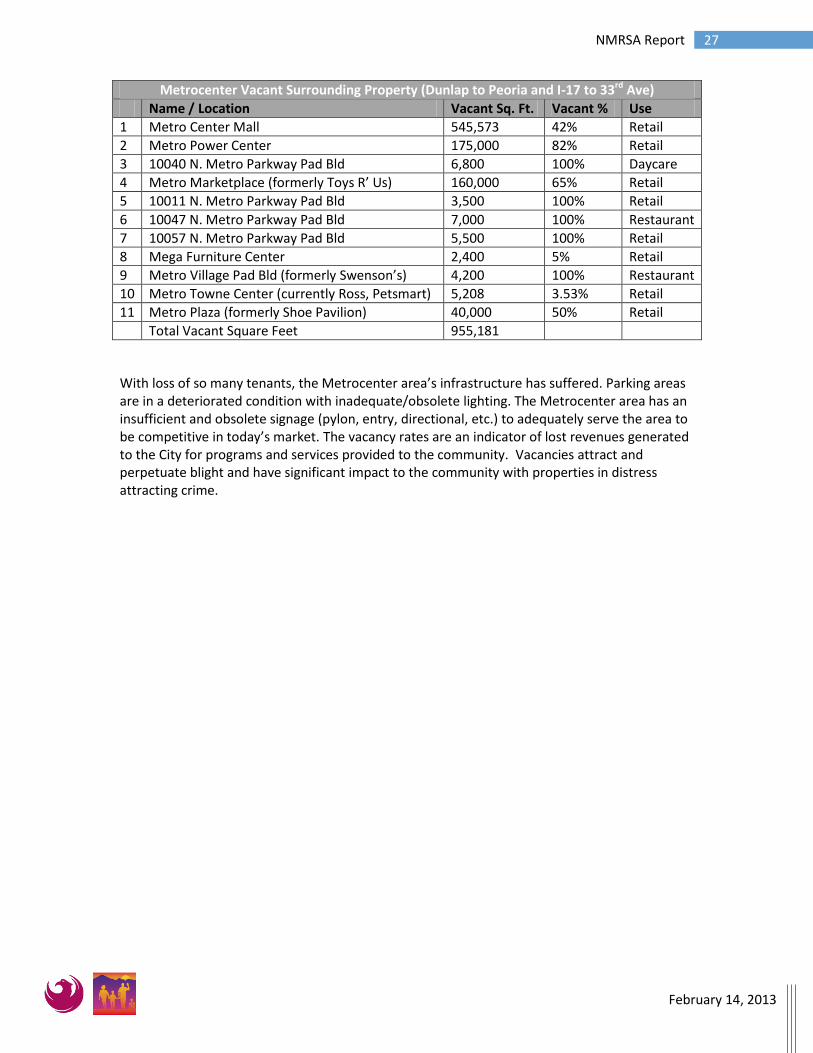
Metrocenter Vacant Surrounding Property (Dunlap to Peoria and I-17 to 33rd Ave)
Name / Location Vacant Sq. Ft. Vacant % Use
1 Metro Center Mall 545,573 42% Retail
2 Metro Power Center 175,000 82% Retail
3 10040 N. Metro Parkway Pad Bld 6,800 100% Daycare
4 Metro Marketplace (formerly Toys R’ Us) 160,000 65% Retail
5 10011 N. Metro Parkway Pad Bld 3,500 100% Retail
6 10047 N. Metro Parkway Pad Bld 7,000 100% Restaurant
7 10057 N. Metro Parkway Pad Bld 5,500 100% Retail
8 Mega Furniture Center 2,400 5% Retail
9 Metro Village Pad Bld (formerly Swenson’s) 4,200 100% Restaurant
10 Metro Towne Center (currently Ross, Petsmart) 5,208 3.53% Retail
11 Metro Plaza (formerly Shoe Pavilion) 40,000 50% Retail
Total Vacant Square Feet 955,181
With loss of so many tenants, the Metrocenter area’s infrastructure has suffered. Parking areas are in a deteriorated condition with inadequate/obsolete lighting. The Metrocenter area has an insufficient and obsolete signage (pylon, entry, directional, etc.) to adequately serve the area to be competitive in today’s market. The vacancy rates are an indicator of lost revenues generated to the City for programs and services provided to the community. Vacancies attract and perpetuate blight and have significant impact to the community with properties in distress attracting crime.

28 NMRSA Report
February 14, 2013
Environmental Data
There are some sites within the NMRSA that have identified environmental issues by the Arizona
Department of Environmental Quality (ADEQ). The map below illustrates that there are 70
Leaking Underground Storage Tank Sites (LUST) inside the study area. None of the LUST sites are
considered priority 1 leaking sites, which are the groundwater contamination sites. A vast
majority of the LUSTs are all considered Status 5, the lowest priority LUST sites - except for the 3
LUSTs colored yellow-orange on the NWC of Peoria & 19th Avenue - these three are all on one
property and are considered Status 3. ADEQ considers the other 67 sites (Status 5) closed.
The map also indicates that there are three RCRA Large Quantity Generator (LQG) Sites. These
sites were included only to note that the processing or storage of hazardous materials occurs on
the property. The LGQ sites inclusion in this map is by no means any indication that there are
any environmental violations associated with them.
At a minimum the existence of the LUST sites adds to the mix of challenges facing the
redevelopment of property within the NMRSA. They are a contributing factor that is arresting
redevelopment in some cases.

29 NMRSA Report
February 14, 2013
Analysis and Conclusion
The NMRSA exceeds the statutory requirements to designate it as a redevelopment area
pursuant to A.R.S. 36-1471. Existing vacant land uses/buildings, inadequate or decaying
infrastructure, substandard buildings, defective or inadequate street layouts, faulty lot layouts,
unsanitary or unsafe conditions, and deterioration of site or other improvements are evident on
the predominance of the properties within the area. An analysis of crime and fire statistics
indicate the existence of conditions that endanger life or property because of the significantly
increased crime and fire incident rates compared to the citywide averages. All or a combination
of these factors afflict a predominance of the parcels and are substantially arresting sound
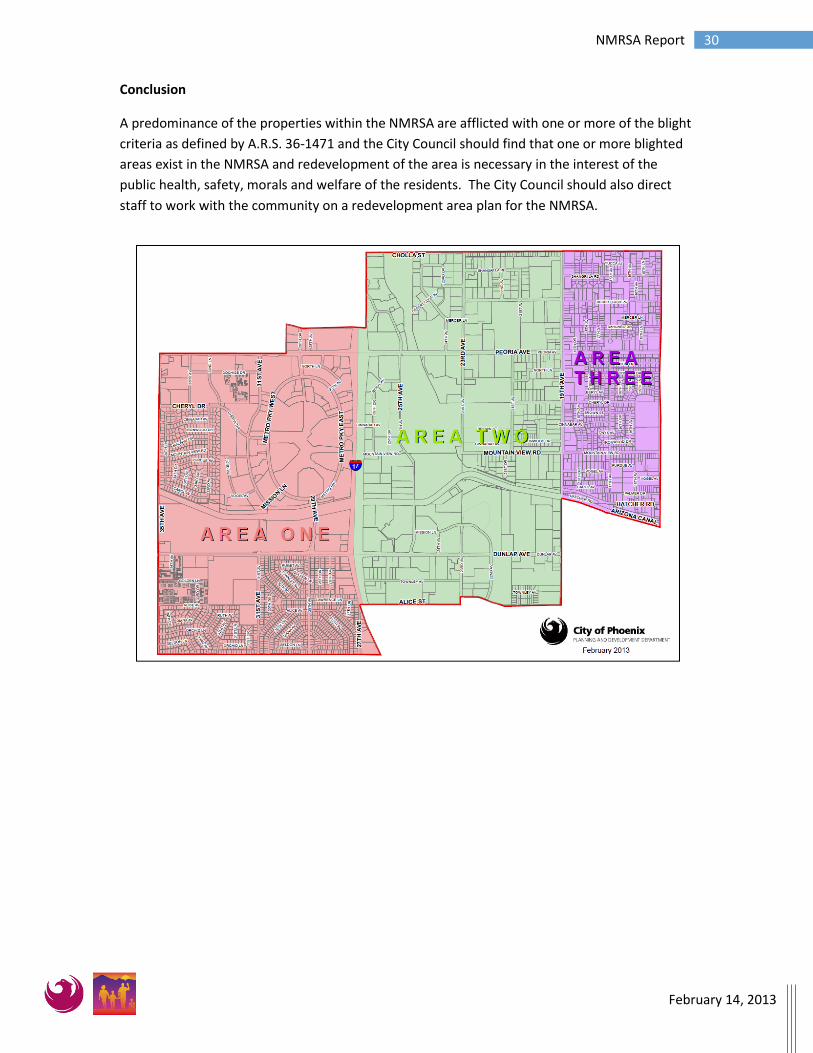
municipal growth within the area. Please see map on the next page for image of areas.
Area 1 (35th Avenue to Interstate 17 and from Butler to Peoria/Sahuaro)
This area demonstrates a predominance of vacant office/retail buildings, defective or
inadequate street layout, unsanitary or unsafe conditions, deterioration of site or other
improvements, Neighborhood Services Department blight statistics and the existence of
conditions that endanger life or property based upon calls for service from the Police and Fire
Departments. A combination of these factors is arresting sound municipal growth and
redevelopment within this sub-area.
Area 2 (Interstate 17 to 19th Avenue and from Cholla to Alice streets)
This area shows signs of stress with a predominance of the properties having vacant industrial
buildings/land area, faulty lot layout, unsanitary or unsafe conditions, deterioration of site or
other improvements, improper or obsolete subdivision platting and conditions that endanger
life or property based upon calls for service from the Police and Fire Departments. A
combination of these factors is arresting sound municipal growth and redevelopment within this
sub-area.
Area 3 (19th to 15th Avenue from Arizona Canal to Cholla Street)
Properties in this area demonstrate a predominance of defective or inadequate street layouts,
faulty lot layouts, unsanitary or unsafe conditions, deterioration of site or other improvements,
improper or obsolete subdivision platting, Neighborhood Services Department blight statistics
and conditions that endanger life or property based upon calls for service from the Police and
Fire Departments. A combination of these factors is arresting sound municipal growth and
redevelopment within this sub-area.
30 NMRSA Report
February 14, 2013
Conclusion
A predominance of the properties within the NMRSA are afflicted with one or more of the blight
criteria as defined by A.R.S. 36-1471 and the City Council should find that one or more blighted
areas exist in the NMRSA and redevelopment of the area is necessary in the interest of the
public health, safety, morals and welfare of the residents. The City Council should also direct
staff to work with the community on a redevelopment area plan for the NMRSA.