reduced graphene oxide as the support for lipid bilayer membrane
TRANSCRIPT

Journal of Physics Conference Series
OPEN ACCESS
Reduced Graphene Oxide as the Support for LipidBilayer MembraneTo cite this article K Tsuzuki et al 2012 J Phys Conf Ser 352 012016
View the article online for updates and enhancements
You may also likeAttaching titania clusters of various size toreduced graphene oxide and its impact onthe conceivable photocatalytic behavior ofthe junctionsmdasha DFTD + U and TD DFTBmodelingWitold Piskorz Filip Zasada GabrielaWoacutejtowicz et al
-
Effect of osmotic pressure on ganglioside-cholesterol-DOPC lipid mixtureTeruaki Onai and Mitsuhiro Hirai
-
Preferential binding and re-organization ofnanoscale domains on model lipidmembranes by pore-forming toxins insightfrom STED-FCSNirod Kumar Sarangi and Jaydeep KumarBasu
-
Recent citationsUnderstanding the CarbonndashBio InterfaceInfluence of Surface Chemistry and BufferComposition on the Adsorption ofPhospholipid Liposomes at CarbonSurfacesJoana M Vasconcelos et al
-
Orienting lipid-coated graphitic micro-particles in solution using AC electricfields A new theoretical dual-ellipsoidLaplace model for electro-orientationJ Nguyen et al
-
Graphene oxide supported liposomes forefficient label free electrochemical DNAbiosensingHabibulla Imran et al
-
This content was downloaded from IP address 11612041190 on 24122021 at 1433
Reduced Graphene Oxide as the Support for Lipid Bilayer Membrane
K Tsuzuki1 Y Okamoto1 S Iwasa 1 R Ishikawa2 A Sandhu23 and R Tero3
1 Department of Environmental and Life Sciences Toyohashi University of Technology 1-1 Hibarigaoka Tempaku-cho Toyohashi Aichi 441-8580 JAPAN 2 Department of Electrical and Electronic Engineering Tokyo Institute of Technology 2-12-1 O-okayama Meguro Tokyo 152-8552 JAPAN 3 Electronics-Inspired Interdisciplinary Research Institute Toyohashi University of Technology 1-1 Hibarigaoka Tempaku-cho Toyohashi Aichi 441-8580 JAPAN
E-mail k061503edututacjp (KT) and teroeiiristutacjp (RT)
Abstract Supported lipid membranes of dioleoylphosphatidylcholine (DOPC) were formed on reduced graphene oxide (r-GO) by the vesicle fusion method Graphene oxide prepared by chemical exfoliation was deposited on a thermally oxidized SiO2Si substrate and was reduced by hydrazine vapour Flat lipid membranes were formed on the r-GO surface after the r-GOSiO2Si substrate was incubated in the DOPC vesicle suspension We propose a structural model in which a lipid bilayer and monolayer stacked on r-GO based on the results of fluorescence microscope and atomic force microscope observation
1 Introduction Graphene is single atomic-layered carbon material and the applications in various fields are anticipated because of its intriguing optical [12] magnetical [3] and mechanical properties [4] as well as the application for electronic materials with high electron mobility [5] Recently several applications of graphene and its derivatives including graphene oxide (GO) to biosensing were reported the detection of DNA hybridization and protein-peptide binding using fluorescence quenching effect of graphene [67] detection of biomolecules by using graphene-based field emission transistor [8] and the application of GO as a fluorescence probe in cells [9] Plasma membranes are the reaction fields of the variety of biological reactions involved in diseases and the transportation of information and materials in and out of cells Lipid bilayers are the fundamental structure of cell membranes and examining the molecular behavior of lipids and proteins and their ensemble using artificial lipid bilayers is important to ascertain physical and chemical processes involved in cell membrane reactions Molecular orientation and two dimensional assembly of biomolecules such as lipids peptides and proteins in and on lipid bilayers were investigated with various imaging and spectroscopic methods [10ndash21] Our research interest is in the development of a new method to obtain molecular information in lipid bilayers using graphene In this paper we describe the formation of lipid membranes on reduced GO (r-GO) prepared by chemical exfoliation and chemical reduction Graphene oxide prepared by the chemical exfoliation of graphite has amphipathic property because of the co-existence of hydrophilic areas containing hydroxyl carboxyl and epoxide groups and hydrophobic areas similar to perfect
Asia-Pacific Interdisciplinary Research Conference 2011 (AP-IRC 2011) IOP PublishingJournal of Physics Conference Series 352 (2012) 012016 doi1010881742-65963521012016
Published under licence by IOP Publishing Ltd 1
graphene [2] The elimination of these hydrophilic functional groups by the chemical (eg using hydrazine) and thermal reduction increases the hydrophobicity of the GO surface A supported lipid bilayer (SLB) is one of artificial lipid bilayer systems [22ndash24] formed at solid-liquid interfaces Hydrophilicity of the substrate surface is one of critical factors for the SLB formation [25ndash27] because the lipid bilayer is a self-assembled structure constructed by hydrophilichydrophobic interaction Therefore the efficiency of the SLB formation will be influenced by the reduction of GO We examined the formation structure and properties of the lipid membranes on r-GO which we prepared by exposing GO to hydrazine vapor in detail with atomic force microscope (AFM) and fluorescence microscope
2 Experiment The GO flakes was prepared from graphite powder (Z+80 Ito Kokuen Co Ltd Japan) by chemical exfoliation according to the modified Hummerrsquos method [2829] The graphite powder was stirred in the mixture of sulfonic acid peroxydisulfuric acid and phosphorus pentoxide at 80degC for 45 h then filtrated and washed with water The residue was dried overnight and added to the mixture of sulfonic acid and potassium permanganate below 10degC After stirring the mixture at 35degC for 2 h we added water to the mixture and the reaction was quenched by hydrogen peroxide After the overnight sedimentation the sediment was washed with 3 HCl aq and water and exfoliated by using a centrifuge and an ultrasonic bath sonicator to obtain a GO solution The GO solution was dropcast on a SiO2Si (100) substrate and dried As-delivered Si wafer was thermally oxidized under oxygen atmosphere at 1000degC for 135 min and the SiO2Si substrate was cleaned by boiling in piranha solution for 10 min and sonication in 002 M KOH aq for 10 min The thickness of the SiO2 layer was 92 nm which is suitable to the observation of graphene flakes with high contrast using a bright field microscope [30] The GOSiO2Si substrate was exposed to hydrazine vapor in a glass dish with a cover on a hot plate at 100degC [31] to reduce GO The solutions of dioleoylphosphatidylcholine (DOPC) (Avanti Polar Lipid) in chloroform and a fluorescence-labelled lipid (BOPIPY-H-PC ExEm=534552 nm) (Invitrogen Corp) in ethanol were mixed at 1001 molar ratio The solution of the lipid mixture in a glass vial was dried by N2 flow and overnight evacuation We put a buffer solution (100 mM KCl 25 mM HEPES pH 74 NaOH chemicals were purchased from Wako Pure Chemical Industries Ltd) into the glass vial with the vacuum-dried lipid film and agitated the vial to prepare the suspension of multilamellar vesicles (MLV) [14] The MLV suspension was frozen and thawed in liquid nitrogen and a 45degC water bath repeatedly extruded through a 100 nm polycarbonate filter and sonicated to obtain unilamellar vesicles The r-GOSiO2Si substrate was incubated in the sonicated DOPC+BODIPY-H-PC vesicle suspension with CaCl2 (10 mM) at 45degC for 60 min The excess vesicles in the liquid phase were washed out by exchanging the suspension with the buffer solution without vesicles The GO flakes were observed by scanning electron microscope (SEM) (S-3000N Hitachi High-Tech Corp) under high vacuum (lt10-3 Pa) at 25 kV and in the secondary electron mode The r-GOSiO2 surface after the incubation in vesicle suspension was observed in the buffer solution using an AFM and a fluorescence microscope An epifluorescence microscope (Olympus IX51) was used for the bright-field and fluorescence observation The GOSiO2Si and r-GOSiO2Si surfaces were observed in air The r-GOSiO2 surface after the incubation in the vesicle suspension was observed in the buffer solution with a 60times water-immersion objective lens Fluorescence recovery after photobleaching (FRAP) was performed by the irradiation of excitation light which intensity was 280 times stronger than that at the observation The AFM observation (Agilent PicoScan2500) of the GO and r-GO flakes on SiO2 surfaces were performed in acoustic AC mode in air by using a cantilever with spring constant (C) of 28 Nm (SI-DF40 Seiko Instruments Inc) The r-GOSiO2 surface after the incubation in the vesicle suspension was observed in magnetic AC mode in the buffer solution by using a magnetically coated cantilever (TYPE I MAC Lever Agilent C = 06 Nm)
Asia-Pacific Interdisciplinary Research Conference 2011 (AP-IRC 2011) IOP PublishingJournal of Physics Conference Series 352 (2012) 012016 doi1010881742-65963521012016
2
3 Results and discussion The SEM image of the GO flakes prepared by modified Hummerrsquos method is shown in figure 1A The maximum size of the GO flakes was 32338 microm The size of the original graphite particle was 2582 microm on average (data not shown) and some GO flakes exfoliated remaining the original sheet size in the graphite particle In the previous reports in general the size of GO flakes is in the order of microm to 10 microm [28293132] and the reports about the GO flakes over 100 microm is still very few [3334] The size of the GO flake was decreased with the time of sonication for rapid exfoliation The size of the GO flakes was partly controlled by the sonication time to obtain appropriate flake size for the AFM observation on a scale of 10-15 microm We found that the fragments of the GO flakes had characteristic stable size (figure 1B) As-prepared GO flakes without sonication distributed at the areas around 25000 microm2 (corresponds to ~160 microm times 160 microm) and 2500 microm2 (corresponds to ~50 microm times 50 microm) (figure 1B red histogram) The flake size mainly distributed at 2500 microm2 and 375 microm2 (corresponds to ~19 microm times 19 microm) after the sonication for 05-1 h (figure 1B yellow and green histograms) After the sonication for 2 h the flake size had monodisperse distribution around 250 microm2 (corresponds to ~16 microm times 16 microm) (figure 1B blue histogram)
Figure 1 (A) SEM image of the GO flakes on SiO2Si (B) Histogram of the area of the GO flakes evaluated from SEM images and its dependence on the time of ultrasonic fragmentation (red) without sonication (yellow) 05 h (green) 1 h and (blue) 2 h
The chemical exfoliation by the modified Hummerrsquos method has an advantage that a quantity of GO can be obtained as an aqueous solution at low cost The size of the graphene flakes can be roughly controlled once a large GO flake is prepared (figure 1) The GO flakes contain sp3-carbon regions and holes which interfere electron mobility thus the chemical exfoliation is regarded to be inferior to other methods [3536] such as chemical vapor deposition(CVD) mechanical exfoliation of graphite and epitaxial growth for the application to electronic devices For the uses in biological applications however the defects in GO and r-GO may not be a serious matter [679] Thus we prepared GO using the modified Hummerrsquo method to construct graphene-supported lipid bilayer system Figure 2A shows the AFM topography of GO observed in air Thickness of the adsorbed GO on the SiO2 surface was 145plusmn023 nm (n=121) (figure 2C) Thickness of the second GO layer on first the GO flakes was 134plusmn026 nm (n=30) at the region two GO flakes overlapped Previous reports showed that the thickness of single GO layer on solid substrates is 1-15 nm although the inter-layer distance in graphite is 03 nm Graphene oxide measures thicker than perfect graphene because the functional groups such as hydroxyl epoxy and carboxyl groups protrude from its two-dimensional carbon framework and also because linearly aligned sp3 carbons makes a crinkle [37] Thickness of GO on solid substrates is also sensitive to the roughness and adsorbed water layer on the substrate surface [3839] The sonication for 2 h which fragmented GO flakes from 25000 microm2 to 500 microm2 by breaking interlayer C-C covalent bonds (figure 1B) would be sufficient to exfoliate the intra-layer π-π stacking almost completely Therefore we conclude that the flakes observed in figure 2A were single-layered GO Figure 2B shows the AFM topography of r-GO after it was exposed to hydrazine vapor for 30 min Thickness of the r-GO flakes adsorbed on the SiO2Si surface was 286plusmn036 nm (n=89) (figure 2D) and the thickness of the second r-GO layers on the first r-GO flakes was 118plusmn018 nm (n=15) The
Asia-Pacific Interdisciplinary Research Conference 2011 (AP-IRC 2011) IOP PublishingJournal of Physics Conference Series 352 (2012) 012016 doi1010881742-65963521012016
3
first layer of r-GO (figure 2D) was 14 nm thicker than GO before reduction (figure 2C) On the other hand second r-GO layer was 03 nm thinner than the second GO layer before reduction We think at present that the first layer of r-GO was thickly observed because of the effect of substrate surface andor the adsorbed water between SiO2 and r-GO on the reduction process [3839] We dropcast GO solution on the SiO2 surface pre-treated with hydrazine the thickness of the first and second GO layers was 205plusmn027 nm (n=125) and 156plusmn018 nm (n=17) respectively Thus the apparent height of the first GO layer strongly depended on the surface condition of the substrate surface We suppose that the second layer of r-GO was thinner than the GO without reduction because the recovered double bonds made increase the π-π interaction between the r-GO layers
Figure 2 AFM topographies of (A) the GO flakes before reduction and (B) the r-GO flakes after exposure to hydrazine vapor at 100degC for 30 min (C D) The cross section profiles at the white lines in (A) and (B) respectively
Figure 3A and 3B show the bright-field and fluorescence images of as-prepared GO on SiO2Si respectively Fluorescence signal (figure 3B) was observed at the corresponding position of the GO flakes which was observed in the bright-field image (figure 3A) Figure 3C-F show the bright-field and fluorescence images of GO after the reduction with hydrazine vapor The fluorescence intensity from the r-GO flakes after exposure to hydrazine vapor for 10 min (figure 3D) and 30 min (figure 3F) was less than 1 of that from the GO flakes before reduction (figure 3B)
Figure 3 Bright-field images and fluorescence images of GO and r-GO obtained at the same position of each surface (A) Bright-field image and (B) fluorescence image of GO before reduction (C) Bright-field image and (D) fluorescence image of r-GO after exposure to hydrazine vapor for 10 min (E) Bright-field image and (F) fluorescence image of r-GO after exposure to hydrazine vapor for 30 min Fluorescence observation was performed with the irradiation of excitation light 69 times brighter and the exposure time was 10 times longer than those for the SLB observation in figure 4A
A
B
C E
D F
A B
C
D
Asia-Pacific Interdisciplinary Research Conference 2011 (AP-IRC 2011) IOP PublishingJournal of Physics Conference Series 352 (2012) 012016 doi1010881742-65963521012016
4
Figure 4 shows the fluorescence image of the r-GOSiO2Si surface incubated in the sonicated vesicle suspension of DOPC containing 10 mM of Ca2+ The bare SiO2 regions were bright while the regions of the r-GO flakes were dark The homogeneous fluorescence intensity from the SiO2 regions indicates the formation of SLB on SiO2 in accordance with previous studies [25ndash27] The fluorescence from the r-GO regions was considerably weaker than that from the SiO2 region probably because of the fluorescence quenching effect of r-GO [124041] We could not distinguish the state of the DOPC bilayer on r-GO whether planar membrane or adhesive vesicular layer [14] only from the static fluorescence image in figure 4Aa Therefore we performed FRAP at the SiO2 region surrounded by r-GO (dotted circle in figure 4Aa) The FRAP process shown in figure 4b-d indicates that lipid molecules diffused freely between the SiO2 regions and the surrounding r-GO regions and that fluid and continuous SLB were formed on both r-GO and SiO2 Figure 4B shows the AFM topography of the r-GOSiO2 surface after the incubation in the DOPC vesicle suspension observed under the same condition as figure 4A The surfaces on the r-GO and SiO2 regions had flat morphology and adsorbed vesicles were rarely observed The region on the first r-GO layer was 370plusmn048 nm (n=60) higher than the SiO2 region and the region on the second r-GO layer was 151plusmn042 nm (n=40) higher than that on the first r-GO layer
Figure 4 (A) Fluorescence images of r-GO and SLB and the FRAP process (a) Before fluorescence bleaching (b) 0 s (c) 1 min and (d) 5 min after photobleaching (B) AFM topography of the same sample as (A) and the cross section profiles at the white lines
We propose that stacking layers of lipid bilayermonolayer were formed on r-GO as shown in figure 5 according to the results of FRAP and AFM image in figure 4 It is well known that single SLB forms on SiO2 surfaces by the vesicle fusion method [42ndash45] The thickness of the PC-SLB in liquid crystal phase observed by AFM is 4-5 nm [1427] The thickness of the first r-GO layer on SiO2 was 29 nm in this study (figure 3) and the height difference between the r-GO and SiO2 regions was 37 nm Therefore the lipid membrane formed on r-GO was 08 nm thicker than the single SLB on SiO2 We attributed this additional 08 nm thickness to a lipid monolayer on r-GO and suggest that a lipid bilayer stacked on the lipid monolayerr-GO Previous reports showed that a lipid monolayer forms from vesicles on hydrophobic surfaces covered with alkyl chains (eg octadecyltrichlorosilane (OTS)-SAMSiO2 and alkanethiolAu) A lipid monolayer will be formed on r-GO in a similar way because the hydrophilic GO turns to hydrophobic by chemical or thermal reduction due to the removal of hydrophilic functional groups (epoxy hydroxyl and carboxyl groups) [4647] The model in which lipid molecules with their hydrophobic tails on r-GO is also consistent with the experimental result of lipid-coated carbon nanotube [48] and the molecular dynamics simulation of graphene incorporated in a lipid bilayer [49] The thickness of the lipid monolayer on r-GO (08 nm) was smaller than the half of the bilayer thickness (2 nm) This was because the lipid molecules in the monolayer were not closely-arranged Tilted molecular orientation is also suggested in the lipid monolayer on alkyl-SAM [2650] Lipid molecules in the monolayer on r-GO will be inclined because of unevenness and heterogeneity of the r-GO surface The result of FRAP in figure 4A suggests that the lipid bilayer on the lipid monolayerr-GO had fluidity and was continuous to the SLB on SiO2 The structural model of
A
a b
c d
B
Asia-Pacific Interdisciplinary Research Conference 2011 (AP-IRC 2011) IOP PublishingJournal of Physics Conference Series 352 (2012) 012016 doi1010881742-65963521012016
5
the planar lipid membranes on the r-GOSiO2 surface and height difference among each region was summarized in figure 5
Figure 5 Schematic of the structure of lipid membranes on r-GOSiO2
4 Summary Graphene oxide with maximum size of 323 microm was prepared by modified Hummerrsquos method and the size of the GO flakes was controlled at the range of 16 microm to 160 microm by ultrasonic fragmentation We observed the change of the morphology and fluorescence property of GO by hydrazine reduction by using AFM and fluorescence microscope We formed planar DOPC membranes on r-GO by vesicle fusion method From the AFM observation and FRAP results we revealed that continuous and fluid planar lipid membranes were formed on r-GO as well as on SiO2 We proposed a structural model of lipid bilayerlipid monolayerr-GO based on the AFM topography
Acknowledgment Graphite was kindly provided by Ito Kokuen Co LTD We appreciate the kind support on SiO2Si preparation from Mr H Nakazawa and Prof K Sawada in TUT This work was partly supported by the Grant-in-Aid for Scientific Research (KAKENHI) (23685003) from MEXT Japan References [1] Kim J Kim F and Huang J 2010 Mater Today 13 28ndash38 [2] Loh K P Bao Q Eda G and Chhowalla M 2010 Nat Chem 2 1015ndash24 [3] Lu J Zhang H Shi W Wang Z Zheng Y Zhang T Wang N Tang Z and Sheng P 2011 Nano
Lett 11 2973ndash7 [4] Lee C Wei X Kysar J W and Hone J 2008 Science 321 385ndash8 [5] Geim A K and Novoselov K S 2007 Nat Mater 6 183ndash91 [6] Lu C-H Yang H-H Zhu C-L Chen X and Chen G-N 2009 Angew Chem Int Ed 48 4785ndash7 [7] He S Song B Li D Zhu C Qi W Wen Y Wang L Song S Fang H and Fan C 2010 Adv
Funct Mater 20 453ndash9 [8] Ang P K Jaiswal M Lim C H Y X Wang Y Sankaran J Li A Lim C T Wohland T Barbaros
O and Loh K P 2010 ACS Nano 4 7387ndash94 [9] Sun X Liu Z Welsher K Robinson J T Goodwin A Zaric S and Dai H 2008 Nano Res 1
203ndash12 [10] Tero R Sazaki G Ujihara T and Urisu T 2011 Langmuir 27 9662ndash5 [11] Sumino A et al 2011 Biomacromolecules 12 2850ndash8 [12] Mao Y Shang Z Imai Y Hoshino T Tero R Tanaka M Yamamoto N Yanagisawa K and
Urisu T 2010 Biochim Biophys Acta 1798 1090ndash9 [13] Shang Z Mao Y Tero R Liu X Hoshino T Tanaka M and Urisu T 2010 Chem Phys Lett
497 108ndash14 [14] Tero R Ujihara T and Urisu T 2008 Langmuir 24 11567ndash76 [15] Ujihara T Suzuki S Yamauchi Y Tero R and Takeda Y 2008 Langmuir 24 10974ndash80 [16] Lei S Tero R Misawa N Yamamura S Wan L and Urisu T 2006 Chem Phys Lett 429 244ndash9
Asia-Pacific Interdisciplinary Research Conference 2011 (AP-IRC 2011) IOP PublishingJournal of Physics Conference Series 352 (2012) 012016 doi1010881742-65963521012016
6
[17] Shinozaki Y Sumitomo K Furukawa K Miyashita H Tamba Y Kasai N Nakashima H and Torimitsu K 2010 Appl Phys Express 3 027002
[18] Kunze A Sjoumlvall P Kasemo B and Svedhem S 2009 J Am Chem Soc 131 2450ndash1 [19] Yoshii N and Okamura E 2009 Chem Phys Lett 474 357ndash61 [20] Meier R J Csiszaacuter A and Klumpp E 2006 J Phys Chem B 110 20727ndash8 [21] Hull M C Cambrea L R and Hovis J S 2005 Anal Chem 77 6096ndash9 [22] Hirano-Iwata A Niwano M and Sugawara M 2008 Trends Anal Chem 27 512ndash20 [23] Richter R P Beacuterat R and Brisson A R 2006 Langmuir 22 3497ndash505 [24] Castellana E T and Cremer P S 2006 Surface Science Reports 61 429ndash44 [25] Isono T Tanaka H and Ogino T 2007 e-J Surf Sci Nanotech 5 99ndash102 [26] Tero R Takizawa M Li Y-J Yamazaki M and Urisu T 2004 Langmuir 20 7526ndash31 [27] Tero R Watanabe H and Urisu T 2006 Phys Chem Chem Phys 8 3885ndash94 [28] Ishikawa R Bando M Morimoto Y Park S Y and Sandhu A 2010 Jpn J Appl Phys 49
06GC02 [29] Tung V C Allen M J Yang Y and Kaner R B 2009 Nat Nanotechnol 4 25ndash9 [30] Suganuma K Watanabe S Gotou T and Ueno K 2011 Appl Phys Express 4 021603 [31] Zhu Y Murali S Cai W Li X Suk J W Potts J R and Ruoff R S 2010 Adv Mater 22 3906ndash24 [32] Chen T Zeng B Liu J L Dong J H Liu X Q Wu Z Yang X Z and Li Z M 2009 J Phys Conf
Ser 188 012051 [33] Su C-Y Xu Y Zhang W Zhao J Tang X Tsai C-H and Li L-J 2009 Chem Mater 21 5674ndash
80 [34] Zhou X and Liu Z 2010 Chem Commun 46 2611ndash3 [35] Subrahmanyam K S Panchakarla L S Govindaraj A and Rao C N R 2009 J Phys Chem C
113 4257ndash9 [36] Kim K S Zhao Y Jang H Lee S Y Kim J M Kim K S Ahn J-H Kim P Choi J-Y and Hong
B H 2009 Nature 457 706ndash10 [37] Schniepp H C Li J-L McAllister M J Sai H Herrera-Alonso M Adamson D H Prudrsquohomme
R K Car R Saville D a and Aksay I a 2006 J Phys Chem B 110 8535ndash9 [38] Tsukamoto T and Ogino T 2009 Appl Phys Express 2 075502 [39] Xu K Cao P and Heath J R 2010 Science 329 1188ndash91 [40] Swathi R S and Sebastian K L 2009 J Chem Phys 130 086101 [41] Swathi R S and Sebastian K L 2008 J Chem Phys 129 054703 [42] Keller C A and Kasemo B 1998 Biophys J 75 1397ndash402 [43] Jenkins A T A Bushby R J Evans S D Knoll W Offenhaumlusser A and Ogier S D 2002
Langmuir 18 3176ndash80 [44] Lingler S Rubinstein I Knoll W and Offenhaumlusser A 1997 Langmuir 13 7085ndash91 [45] Tero R Takizawa M Li Y-J Yamazaki M and Urisu T 2004 Applied Surface Science 238
218ndash22 [46] Gao W Alemany L B Ci L and Ajayan P M 2009 Nat Chem 1 403ndash8 [47] Gao X Jang J and Nagase S 2010 J Phys Chem C 114 832ndash42 [48] Wu Y Hudson J A S Lu Q Moore J M Mount A S Rao A M Alexov E and Ke P C 2006 J
Phys Chem B 110 2475ndash8 [49] Titov A V Kraacutel P and Pearson R 2010 ACS Nano 4 229ndash34 [50] Parikh A N Beers J D Shreve A P and Swanson B I 1999 Langmuir 15 5369ndash81
Asia-Pacific Interdisciplinary Research Conference 2011 (AP-IRC 2011) IOP PublishingJournal of Physics Conference Series 352 (2012) 012016 doi1010881742-65963521012016
7
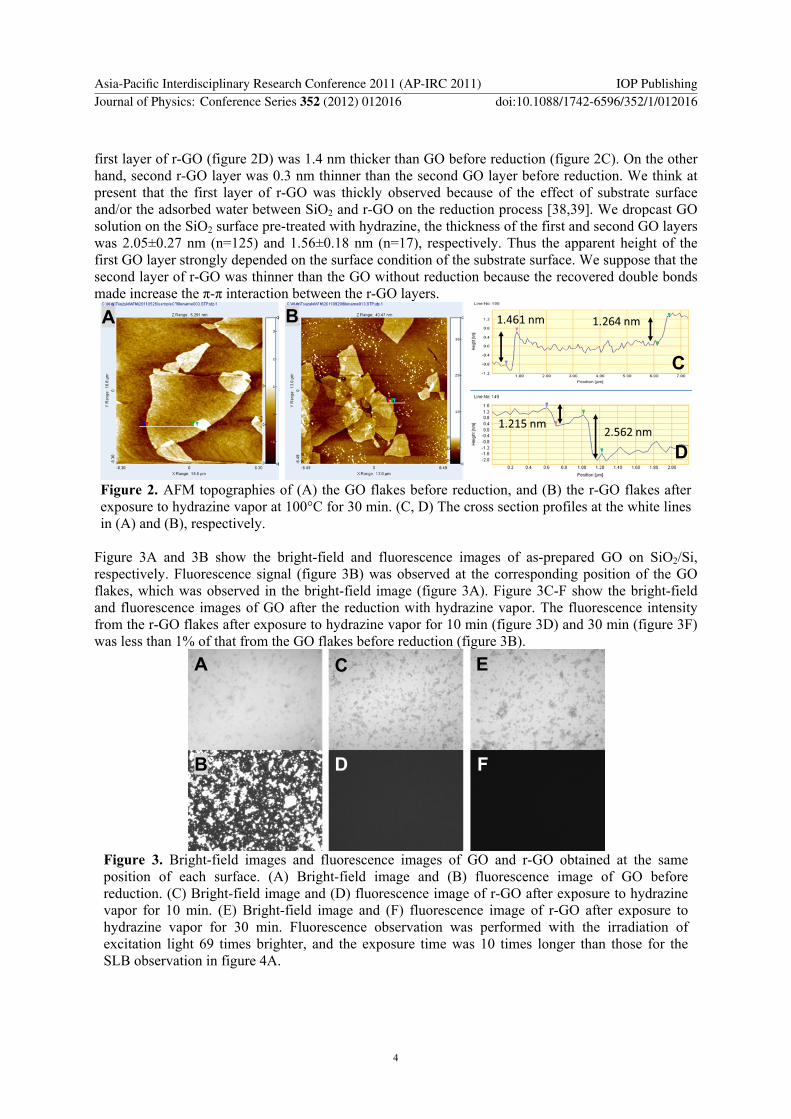
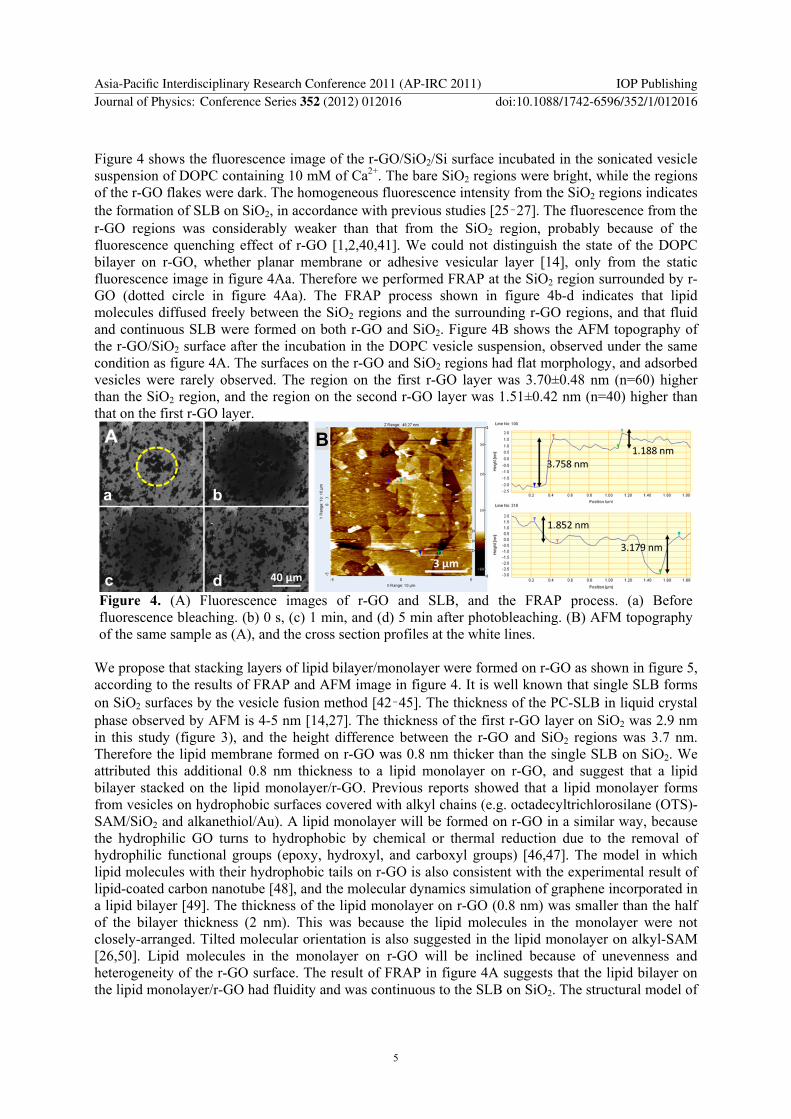