reduction of butyrate- and methane-producing ... · with irritable bowel syndrome authors: marta...
TRANSCRIPT

Reduction of butyrate- and methane-producing microorganisms in patients
with Irritable Bowel Syndrome
Authors: Marta Pozuelo#,1 Suchita Panda#,1 Alba Santiago, 1 Sara Mendez, 2 Anna
Accarino, 2,3 Javier Santos, 1,2,3 Francisco Guarner, 1,2,3 Fernando Azpiroz, 1,2,3 and
Chaysavanh Manichanh*1,3
#Authors share co-first authorship
1Digestive System Research Unit, Vall d’Hebron Research Institute, Passeig Vall
d’Hebron 119-129, Barcelona 08035, Spain
2Digestive Unit, University Hospital Vall d’Hebron, Passeig Vall d’Hebron 119-129,
Barcelona 08035, Spain
3Centro de Investigacion Biomedica en Red en el Área tematica de Enfermedades
Heptaticas y Digestivas, CIBERehd, Instituto de Salud Carlos III, Madrid, Spain

Supplementary Table S1. Summary of studies on gut microbiota and IBS using 16S rRNA gene survey.
Year IBS subtypes N and
Healthy controls N
Gender in IBS
Type of study Treatment during the
study
Sample type
Technique used Sequence depth for
sequencing techniques
Results References
2005 IBS-D 12; IBS-C 9; IBS-A 6; HC 22
ND Longitudinal 3 months interval
Regular IBS symptoms
Feces qPCR 16S rRNA ND Lower amount of Lactobacillus in IBS-D; higher amount of Veillonella in IBS-C; higher Ruminococcus productus - Clostridium coccoides in IBS; lower Bifidobacterium catenulatum in IBS
1
2005 IBS-D 12; IBS-C 9; IBS-A 5; HC 25
19 females; 7 males
Longitudinal 0, 3 and 6 months
IBS symptoms, antibiotics
Feces PCR-DGGE ND Increase of coliforms; increase of aerobe/anaerobe ratio, temporal instability in IBS but explained by antibiotics intake
2
2006 IBS-D 7; IBS-C 6; IBS-A 3; HC 16
11 females; 5 males
Longitudinal 0, 6 months
ND Feces PCR-DGGE; quantitative
hybridization-based technique, transcript analysis
ND Clostridium coccoides - Eubacterium rectale group lower in IBS-C; higher instability in IBS
3
2007 IBS-D 10; IBS-C 8; IBS-M 6; HC 23
19 females; 5 males
Cross-sectional ND Feces Cloning-sequencing and
qPCR
3,753 for all samples
Different bacterial structure in IBS compared to HC; differences in genera Coprococcus, Collinsella, and Coprobacillus between IBS and HC
4
2009 IBS-D 14; IBS-C 11; IBS-A 16;
HC 26
29 females; 12 males
Cross-sectional No medication that could influence microbial
composition
Feces; duodenal mucosa
FISH; qPCR ND Decrease of bifidobacteria in faeces and Bifidobacterium catenulatum in feces and
duodenal samples of IBS
5
2009 IBS-D 10; HC 23
6 females; 4 males
Cross-sectional ND Feces %G+C-based profiling and fractioning
combined with 16S rRNA
cloning/sequencing; qPCR
3,267 sequencing
for all samples
IBS-D is enriched in Proteobacteria and Firmicutes Lachnospiraceae but reduced in
Actinobacteria and Bacteroidetes
6
2009 IBS-D 8; IBS-C 8; IBS-M 4; HC 15
14 females; 6 males
Longitudinal 0, 3, 6 months
IBS medication
mainly commercial
fiber analogs, laxatives, or
antidiarrhoeals
Feces qPCR ND Microbiota of the IBS-D patients differed from other sample groups Clostridium
thermosuccinogenes-like, Ruminococcus torques-like; a Ruminococcus bromii -like
phylotype was associated with IBS-C patients in comparison to controls
7
2010 IBS-D 10; HC 10
7 females; 3 males
Cross-sectional No probiotic Feces; mucosal biopsy
qPCR; culture ND Decreased concentration of aerobic bacteria in IBS-D; increase in Lactobacillus in IBS-D
8
2010 IBS 47; HC 33
47 female Cross-sectional No medication Feces; colonic
biopsies
DGGE ND Different microbial community in feces and colonic biopsies;
difference in the gut microbiota between feces from IBS and HC
9

2010 IBS 44 33 females; 11 males
Cross-sectional No medication Feces qPCR ND Ruminococcus torques-like was associated with severity of bowel symptoms
10
2010 IBS-D 8; IBS-C 11; IBS-M 7; HC 26
13 females; 13 males
Cross-sectional ND Feces qPCR; culture; organic acids
analysis HPLC; quantification of bowel gas X-ray
film
ND Quantity of gas similar in IBS and HC; high acetic and propionic acid correlate with
worse GI symptoms; high count of Veillonella and Lactobacillus in IBS
11
2011 IBS-D 16; HC 21
12 females; 4 males
Cross-sectional Luminal and mucosal samples
T-RFLP ND Lower microbial diversity in IBS-D 12
2011 IBS-D 13; IBS-C 11; IBS-A 13;
HC 12
ND Cross-sectional No medication Feces; mucosa-
associated small
intestinal
16S DGGE; qPCR; cloning sequencing
ND Pseudomonas aeruginosa more abundant in feces and small intestine in IBS
13
2011 IBS-D 25; IBS-C 18; IBS-A 19;
HC 46
57 females; 5 males
Cross-sectional ND Feces qPCR; 16S phylogenetic
microarray 129 genus-like groups
ND Increased Firmicutes / Bacteroidetes ratio in IBS; increased Dorea, Ruminococcus and Clostridium, but decreased Bifidobacterium
and methanogens in IBS; decreased Faecalibacterium in IBS-A and IBS-C; more
Archaea in HC
14
2011 IBS-D 1; IBS-C 13; IBS-U 7; HC 22
8 females; 14 males
pediatrics 7-12y
Longitudinal 6 months
ND Feces 16S pyrosequencing;
phylogenetic microarray 8000
species
54,200 reads per sample
Higher abundance of Gammaproteobacteria Haemophilus parainfluenzae and
Ruminococcus in IBS; pain correlates with Alistipes genus
15
2012 IBS-D 23; HC 23
17 females; 6 males
Cross-sectional No probiotics 2 months prior
to study; no anti-
inflammatories.
Feces 16S pyrosequencing
8,232 reads V1-3 and
6,591 reads V6 per sample
Higher proportion of Enterobacteriaceae, lower Faecalibacterium and lower diversity
in IBS-D
16
2012 IBS-C 14; HC 12
14 females Cross-sectional No laxatives, antidiarrhoeal, antispasmodi,
analgesic
Feces Culture of anaerobes; FISH
ND Lower numbers of lactate-producing, lactate-utilising bacteria, H2-consuming
populations, methanogens and reductive acetogens, but higher number of lactate-
and H2-utilising sulphate-reducing bacteria in IBS-C
17
2012 IBS-D 14; HC 18
3 females; 11 males
Cross-sectional No medication Feces Fecal BA profiles; q-PCR
ND Bile acids higher in IBS-D and correlated with stool consistency and frequency;
increase of Escherichia coli and a significant decrease of leptum and Bifidobacterium in
IBS-D
18
2012 IBS-D 13; IBS-C 3;
HC 9
ND Cross-sectional ND Feces; Mucosal biopsies
16S pyrosequencing
268,000 non-chimeric reads
Less diversity in IBS; larger differences in the microbiota composition between
biopsies and feces than between patients and controls
19
2012 IBS-D 15; IBS-C 10; IBS-A 12;
26 females; 11 males
Cross-sectional No medication Feces 16S pyrosequencing
30,000 reads per sample
Associations detected between microbiota composition and clinical or physiological
phenotypes; two subgroups of IBS: normal-
20

HC 20 like and abnormal-like. The latter showed increased Firmicutes / Bacteroidetes ratio.
2012 IBS-D 27; IBS-C 20;
HC 26
ND Cross-sectional ND Rectal biopsies
FISH ND Greater numbers of total mucosa-associated bacteria in patients; greater
Bacteroides and Eubacterium rectale - Clostridium coccoides in IBS;
bifidobacteria were lower in the IBS-D group than in the IBS-C group and controls
21
2012 IBS-D 22; HC 22
12 females; 10 males Pediatrics
12.6 y
Cross-sectional No medication Feces 16S Phylogenetic microarray 775 phylotypes; 16S pyrosequencing;
FISH; qPCR
A total of 13,882
sequence reads from the
four chosen samples
Increased levels of Veillonella, Prevotella, Lactobacillus, and Parasporobacterium in
IBS-D; No difference in alpha-diversity between IBS and HC; larger phylotype core
set in HC than in IBS-D; Bifidobacterium and Verrucomicrobium less abundant in
IBS-D; positive correlations between Veillonella and both Haemophilus and
Streptococcus, between Anaerovorax and Verrucomicrobium and between Tannerella
and Anaerophaga
22
2013 IBS-D 2; HC 1
2 females Longitudinal: less diarrhoea days 1, 3, and 7 in Patient 1; day 35 in Patient 2; severe diarrhoea
days 14, 28, 37, and 42 in Patient 1; days 3 and 28 in Patient 2.
Hypertension, arthrosis,
osteoporosis for patient 1;
bowel spasms and
contraceptives for patient 2
Feces Metagenomics and metatranscriptomic
s by pyrosequencing
2,013,366 reads for
metagenomics 7 samples; 1,729,416 reads for
metatranscriptomic 32 samples
Higher temporal instability in the fraction of active microbiota related to the IBS condition and fluctuating symptoms
23
2013 PI-IBS 11; PI-nonBD 12;
PI-BD 11; IBS-D 12
HC 11
29 females; 17 males
Cross-sectional ND Biopsy; feces
Host gene expression by
microarray; phylogenetic
microarray 130 genus-like groups
ND 27 genus-like groups IMD separating HC and patients; more uncultured Clostridia in
HC; more Bacteroidetes members in patients; correlation between IMD and host genes involved in epithelial barrier functions
in IBS
24
N = Number of participants ND = No data HC = Healthy controls IBS-D = Diarrhea-predominant IBS IBS-C = Constipation-predominant IBS IBS-M = Mixed IBS IBS-A = Alternating IBS IBS-U = unsubtyped IBS PI-IBS = Post-infectious IBS PI-BD = Persistent bowel dysfunction PI-non-BD = no bowel dysfunction FISH = Fluorescent in situ hybridization IMD = Index of Microbial Dysbiosis 16S = 16S rRNA gene DGGE = Denaturing Gradient Gel Electrophoresis
REFERENCES 1. Malinen E, Rinttila T, Kajander K et al. Analysis of the fecal microbiota of irritable bowel syndrome patients and healthy controls with real-time PCR. Am J Gastroenterol 2005;100:373-82. 2. Matto J, Maunuksela L, Kajander K et al. Composition and temporal stability of gastrointestinal microbiota in irritable bowel syndrome--a longitudinal study in IBS and control subjects. FEMS Immunol Med Microbiol 2005;43:213-22. 3. Maukonen J, Satokari R, Matto J et al. Prevalence and temporal stability of selected clostridial groups in irritable bowel syndrome in relation to predominant faecal bacteria. J Med Microbiol 2006;55:625-33. 4. Kassinen A, Krogius-Kurikka L, Makivuokko H et al. The fecal microbiota of irritable bowel syndrome patients differs significantly from that of healthy subjects. Gastroenterology 2007;133:24-33. 5. Kerckhoffs AP, Samsom M, van der Rest ME et al. Lower Bifidobacteria counts in both duodenal mucosa-associated and fecal microbiota in irritable bowel syndrome patients. World J Gastroenterol 2009;15:2887-92. 6. Krogius-Kurikka L, Lyra A, Malinen E et al. Microbial community analysis reveals high level phylogenetic alterations in the overall gastrointestinal microbiota of diarrhoea-predominant irritable bowel syndrome sufferers. BMC Gastroenterol 2009;9:95,230X-9-95. 7. Lyra A, Rinttila T, Nikkila J et al. Diarrhoea-predominant irritable bowel syndrome distinguishable by 16S rRNA gene phylotype quantification. World J Gastroenterol 2009;15:5936-45. 8. Carroll IM, Chang YH, Park J et al. Luminal and mucosal-associated intestinal microbiota in patients with diarrhea-predominant irritable bowel syndrome. Gut Pathog 2010;2:19,4749-2-19. 9. Codling C, O'Mahony L, Shanahan F et al. A molecular analysis of fecal and mucosal bacterial communities in irritable bowel syndrome. Dig Dis Sci 2010;55:392-7. 10. Malinen E, Krogius-Kurikka L, Lyra A et al. Association of symptoms with gastrointestinal microbiota in irritable bowel syndrome. World J Gastroenterol 2010;16:4532-40. 11. Tana C, Umesaki Y, Imaoka A et al. Altered profiles of intestinal microbiota and organic acids may be the origin of symptoms in irritable bowel syndrome. Neurogastroenterol Motil 2010;22:512,9, e114-5. 12. Carroll IM, Ringel-Kulka T, Keku TO et al. Molecular analysis of the luminal- and mucosal-associated intestinal microbiota in diarrhea-predominant irritable bowel syndrome. Am J Physiol Gastrointest Liver Physiol 2011;301:G799-807. 13. Kerckhoffs AP, Ben-Amor K, Samsom M et al. Molecular analysis of faecal and duodenal samples reveals significantly higher prevalence and numbers of Pseudomonas aeruginosa in irritable bowel syndrome. J Med Microbiol 2011;60:236-45. 14. Rajilic-Stojanovic M, Biagi E, Heilig HG et al. Global and deep molecular analysis of microbiota signatures in fecal samples from patients with irritable bowel syndrome. Gastroenterology 2011;141:1792-801. 15. Saulnier DM, Riehle K, Mistretta TA et al. Gastrointestinal microbiome signatures of pediatric patients with irritable bowel syndrome. Gastroenterology 2011;141:1782-91.

16. Carroll IM, Ringel-Kulka T, Siddle JP et al. Alterations in composition and diversity of the intestinal microbiota in patients with diarrhea-predominant irritable bowel syndrome. Neurogastroenterol Motil 2012;24:521,30, e248. 17. Chassard C, Dapoigny M, Scott KP et al. Functional dysbiosis within the gut microbiota of patients with constipated-irritable bowel syndrome. Aliment Pharmacol Ther 2012;35:828-38. 18. Duboc H, Rainteau D, Rajca S et al. Increase in fecal primary bile acids and dysbiosis in patients with diarrhea-predominant irritable bowel syndrome. Neurogastroenterol Motil 2012;24:513,20, e246-7. 19. Durban A, Abellan JJ, Jimenez-Hernandez N et al. Structural alterations of faecal and mucosa-associated bacterial communities in irritable bowel syndrome. Environ Microbiol Rep 2012;4:242-7. 20. Jeffery IB, O'Toole PW, Ohman L et al. An irritable bowel syndrome subtype defined by species-specific alterations in faecal microbiota. Gut 2012;61:997-1006. 21. Parkes GC, Rayment NB, Hudspith BN et al. Distinct microbial populations exist in the mucosa-associated microbiota of sub-groups of irritable bowel syndrome. Neurogastroenterol Motil 2012;24:31-9. 22. Rigsbee L, Agans R, Shankar V et al. Quantitative profiling of gut microbiota of children with diarrhea-predominant irritable bowel syndrome. Am J Gastroenterol 2012;107:1740-51. 23. Durban A, Abellan JJ, Jimenez-Hernandez N et al. Instability of the faecal microbiota in diarrhoea-predominant irritable bowel syndrome. FEMS Microbiol Ecol 2013;86:581-9. 24. Jalanka-Tuovinen J, Salojarvi J, Salonen A et al. Faecal microbiota composition and host-microbe cross-talk following gastroenteritis and in postinfectious irritable bowel syndrome. Gut 2014;63:1737-45.

Supplementary Table S2. Medications that could have a direct impact on gut microbiota and food avoided by patients #SampleID Description Proton pump
inhibitors Laxatives Anti-diarrhoeics Pre/probiotics Food avoided by patients
MO.01 IBS_Diarrhoea Omeprazole Natural tomato paste MO.12 IBS_Diarrhoea Omeprazole MO.13 IBS_Diarrhoea Omeprazole Milk, yogurt, spicy food MO.15 IBS_Diarrhoea VSL3 MO.17 IBS_Diarrhoea Omeprazole Psyillium husk MO.20 IBS_Diarrhoea Psyillium husk MO.21 IBS_Diarrhoea Omeprazole Raw vegetables, coffee, fruits,
eggs, cheese, spicy food MO.25 IBS_Diarrhoea MO.27 IBS_Diarrhoea Omeprazole Legumes, soup, chocolate, coffee,
lactic products, greasy food, excessive water intake
MO.32 IBS_Diarrhoea Pantoprazole MO.35 IBS_Diarrhoea Greasy food MO.39 IBS_Diarrhoea Omeprazole Vegetables MO.42 IBS_Diarrhoea MO.45 IBS_Diarrhoea MO.47 IBS_Diarrhoea Milk, greasy food, capsicum MO.49 IBS_Diarrhoea Lactitol
Monohydrate
MO.53 IBS_Diarrhoea Rabeprazole MO.54 IBS_Diarrhoea MO.58 IBS_Diarrhoea MO.60 IBS_Diarrhoea Rabeprazole MO.62 IBS_Diarrhoea Omeprazole Blue fish, cucumber, melon MO.68 IBS_Diarrhoea MO.71 IBS_Diarrhoea Gluten MO.74 IBS_Diarrhoea Ferzym plus® MO.82 IBS_Diarrhoea Probiotic MO.87 IBS_Diarrhoea Lactic food, legumes, fizzy drinks,
fried food MO.88 IBS_Diarrhoea Psyillium husk Bread, pasta MO.97 IBS_Diarrhoea MO.98 IBS_Diarrhoea Omeprazole MO.106 IBS_Diarrhoea Loperamide MO.108 IBS_Diarrhoea Omeprazole Lactic food MO.111 IBS_Diarrhoea MO.115 IBS_Diarrhoea Greasy food MO.120 IBS_Diarrhoea Flour products, potato, legumes,
lactic food MO.06 IBS_Constipation MO.09 IBS_Constipation MO.55 IBS_Constipation MO.63 IBS_Constipation MO.64 IBS_Constipation MO.69 IBS_Constipation MO.75 IBS_Constipation Oil, greasy and fried food MO.77 IBS_Constipation Lactitol
Monohydrate
MO.79 IBS_Constipation Omeprazole MO.80 IBS_Constipation Omeprazole MO.89 IBS_Constipation MO.92 IBS_Constipation Omeprazole Psyillium husk MO.96 IBS_Constipation MO.101 IBS_Constipation Bifilax MO.104 IBS_Constipation MO.112 IBS_Constipation Esomeprazole MO.125 IBS_Constipation MO.127 IBS_Constipation Psyillium husk MO.04 Mixed_IBS Pantoprazole MO.05 Mixed_IBS Vegetables, tomato paste, salsa MO.08 Mixed_IBS Esomeprazole MO.10 Mixed_IBS Vegetables, skimmed milk MO.16 Mixed_IBS Omeprazole Psyillium husk MO.23 Mixed_IBS Omeprazole MO.24 Mixed_IBS Chicken and eggs MO.28 Mixed_IBS Probiotic Fried food, artichoke, capsicum,
salsa, lactic food MO.34 Mixed_IBS Omeprazole Psyillium husk MO.36 Mixed_IBS Psyillium husk Fried food, desserts, coffee,
alcohol, salsa, fizzy drinks, lactic

food MO.43 Mixed_IBS MO.48 Mixed_IBS Pantoprazole MO.59 Mixed_IBS Movicol® MO.65 Mixed_IBS Psyillium husk MO.66 Mixed_IBS Psyillium husk MO.76 Mixed_IBS Pantoprazole MO.81 Mixed_IBS Milk, lactic food MO.109 Mixed_IBS Ultra levura® MO.121 Mixed_IBS Omeprazole MO.122 Mixed_IBS MO.126 Mixed_IBS

Supplementary Figure S1. Diversity of the human microbiota at various
phylogenetic levels. Using the 16S rRNA sequence data of 66 healthy controls, the
average relative abundance of each microbial group is represented at phylum, family,
and genus level.
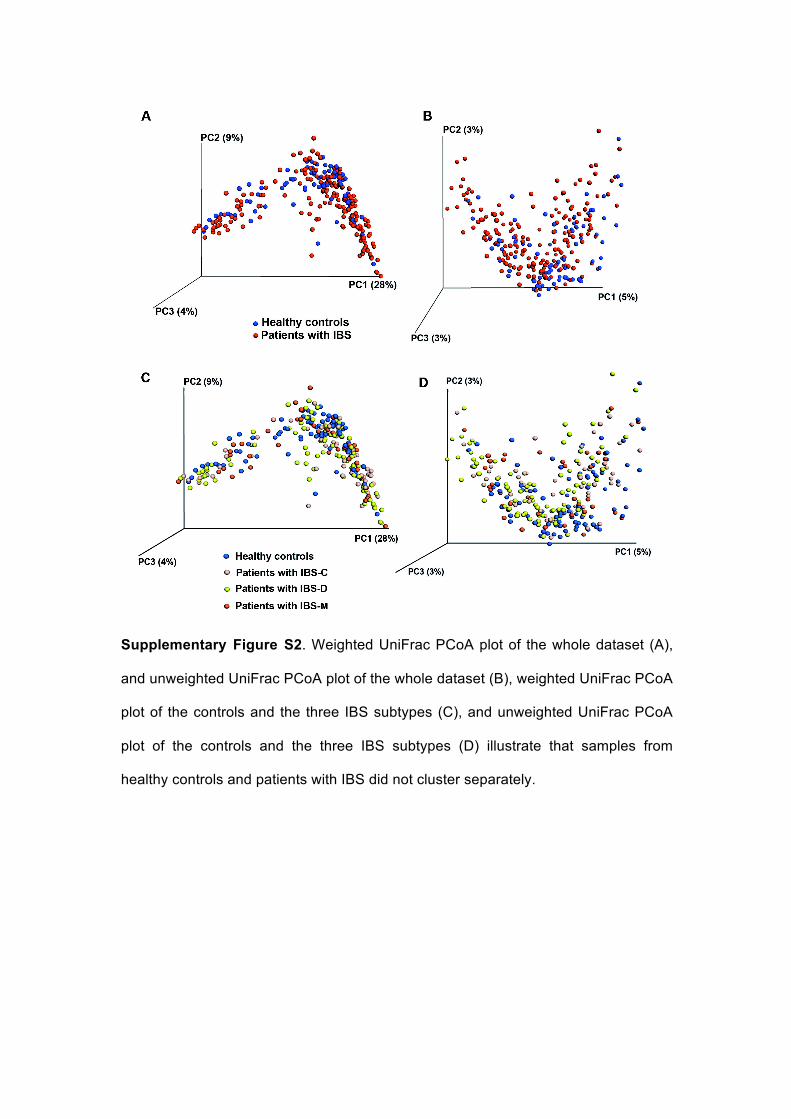
Supplementary Figure S2. Weighted UniFrac PCoA plot of the whole dataset (A),
and unweighted UniFrac PCoA plot of the whole dataset (B), weighted UniFrac PCoA
plot of the controls and the three IBS subtypes (C), and unweighted UniFrac PCoA
plot of the controls and the three IBS subtypes (D) illustrate that samples from
healthy controls and patients with IBS did not cluster separately.

Supplementary Figure S3. The Chao1 index based on species-level OTUs was
estimated for healthy controls, IBS, IBS-M, IBS-C and IBS-D patients, taking into
account only participants not receiving treatment. Significance (***P=0.002) was
determined by Monte Carlo permutations, a non-parametric test.