regional air quality monitoring and forecasting using remote
TRANSCRIPT

Centre for Remote Imaging, Sensing and Processing
Regional Air Quality Monitoring and Forecasting using Remote Sensing Satellites,
Ground-level Measurements and Numerical Modelling
PI: Santo V. Salinas[a]
Collaborators: Ellsworth J. Welton[b], Brent N. Holben[b] and Jun Wang[c]
Local team members: Tan Li[a] and Daniel Kalbermater[a]
[a]Centre for Remote Imaging, Sensing and Processing (CRISP), National University of Singapore (NUS)
[b]NASA Goddard Space Flight Center, Greenbelt MD, USA
[c]Dep. Atm. Sci., University of Nebraska, Lincoln, USA

Centre for Remote Imaging, Sensing and Processing
Started in 2007 with the set up of Singapore's first AERONET site at NUS.
Also in 2007, the 7SEAS partnership with NASA and NRF as well as with regional countries.
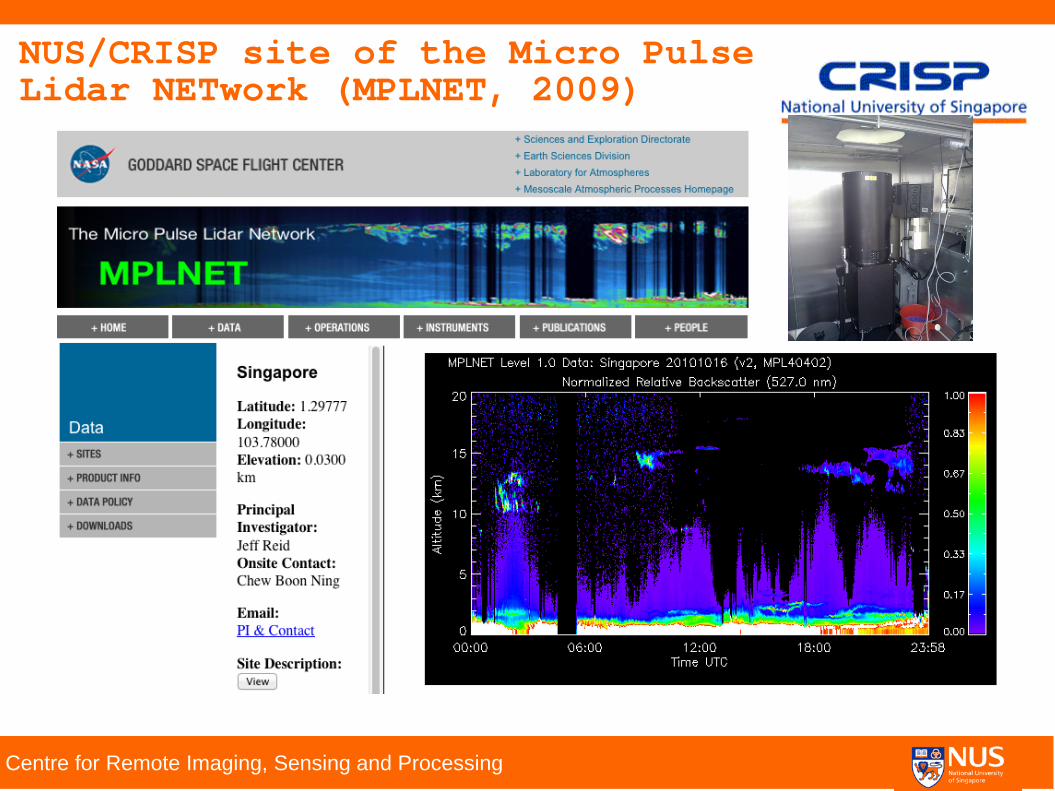
Year 2009 we started a partnership with MPLNET resulting on a semi-permanent LIDAR site at NUS.
Year 2012 Creation of the Singapore NUS atmospheric super-site due to our participation in SEAC4RS 2012.
In year 2012 we also entered on a partnership with Univ. Wisconsin, resulting on the deployment of a Hyper-spectral high resolution lidar (HSRL).
Year 2015, In cooperation with CEE and CENSAM, we deployed a Doppler LIDAR at NUS. This was part of a regional campaign in “Internal Waves and Mixing in the East Indian Coastal Current off Sri Lanka”.
CRISP atmospheric group

Centre for Remote Imaging, Sensing and Processing
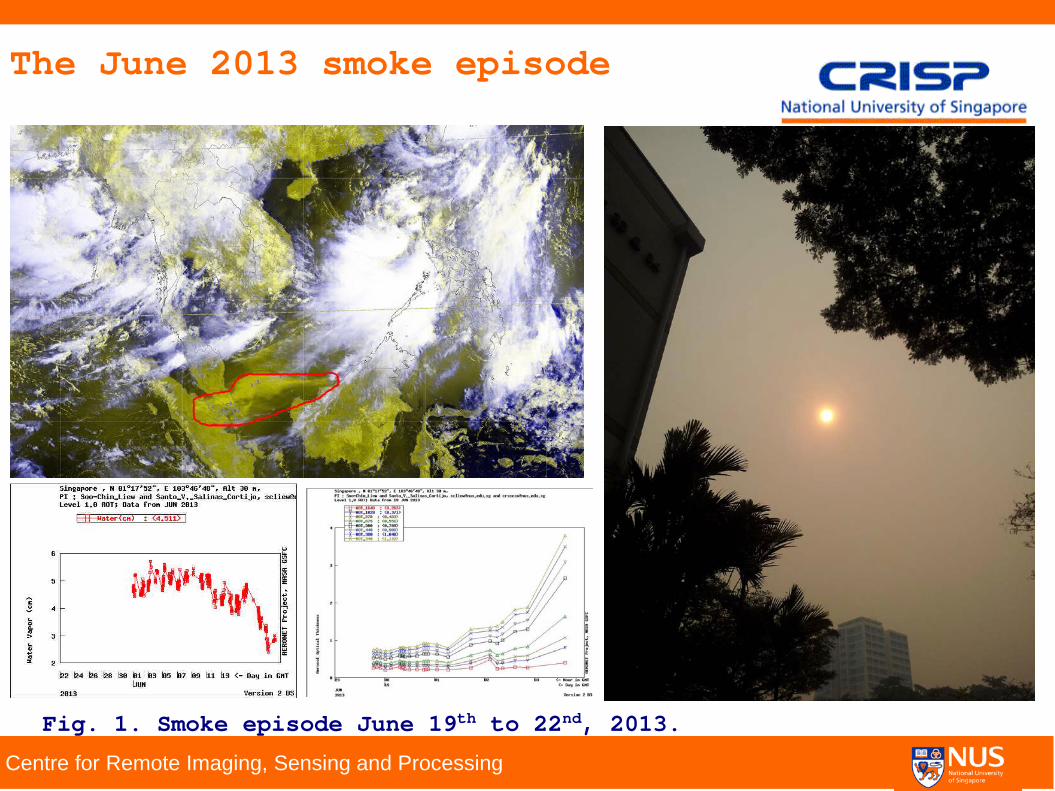
Over the past several decades SEA has seen a massive economic growth; land has changed, air pollution has increased and economic and population health has deteriorated.
Regionally, smoke emissions from biomass burning has become an ever increasing problem that affects the region and especially Singapore.
Trans-boundary smoke episodes are occurring more frequently and with increasing intensity e.g. 1997, 2006, 2010 and more recently in June 2013.
Why did we propose this project?
Centre for Remote Imaging, Sensing and Processing
The June 2013 smoke episode
Fig. 1. Smoke episode June 19th to 22nd, 2013.
Centre for Remote Imaging, Sensing and Processing
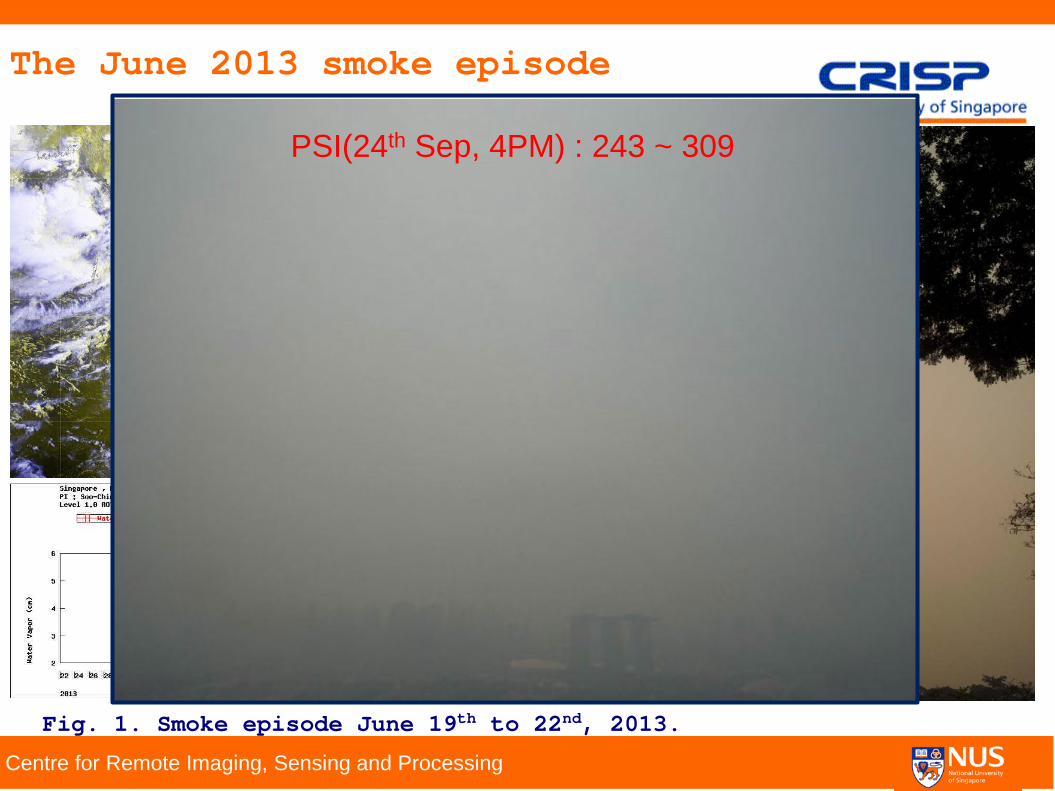
The June 2013 smoke episode
Fig. 1. Smoke episode June 19th to 22nd, 2013.
PSI(24th Sep, 4PM) : 243 ~ 309

Centre for Remote Imaging, Sensing and Processing
To develop, regional and country-wide monitoring and predictive capability of aerosol/particulate matter evolution and transport mechanisms especially during regional trans-boundary smoke events generated by biomass burning.
Reduce uncertainty between satellite, model and in-situ ground measurements of aerosol/particulate matter.
To develop a rapid and mobile platform for assessment of in-situ aerosol loadings, particulate matter concentration (PM2.5/10) and aerosol vertical distribution.
To develop state-of-the-science numerical modelling capability for aerosol particle transport and evolution over the SEA region.
To provide services in advanced air quality monitoring and prediction capabilities to local governments/agencies/private enterprises and regional stakeholders.
Operational objectives of the project

Centre for Remote Imaging, Sensing and Processing
How does monsoonal and inter-monsoonal transitions influences aerosol trans-boundary transport patterns?
How are aerosols in general, and biomass burning in particular, redistributed via deep convection throughout the troposphere?
To what degree do local meteorological conditions affect aerosol particulate hygroscopic growth?
Does surface pollutant inflows enhance upper tropospheric aerosol loadings? If so, what role does the planetary boundary layer plays on this?
What influences and feedbacks do biomass burning aerosols exert on the local meteorology and climate?
What are the basic physical and optical properties of smoke and pollution particles across the region?
Scientific objectives of the project

Centre for Remote Imaging, Sensing and Processing
Satellite remote sensing:
Source identification/Thermal hot spot allocation. Satellite derived aerosol physical and optical properties.
In-situ ground measurements.
Photometric measurements (AERONET). LIDAR vertical profiling(MPLNET). Ambient particle sampling (nephelometer, PM2.5/10 sampling).
Numerical modeling of aerosol/smoke transport.
WRF-CHEM. GEOS-CHEM. CMAQ.
Sub-projects within the proposal
Centre for Remote Imaging, Sensing and Processing
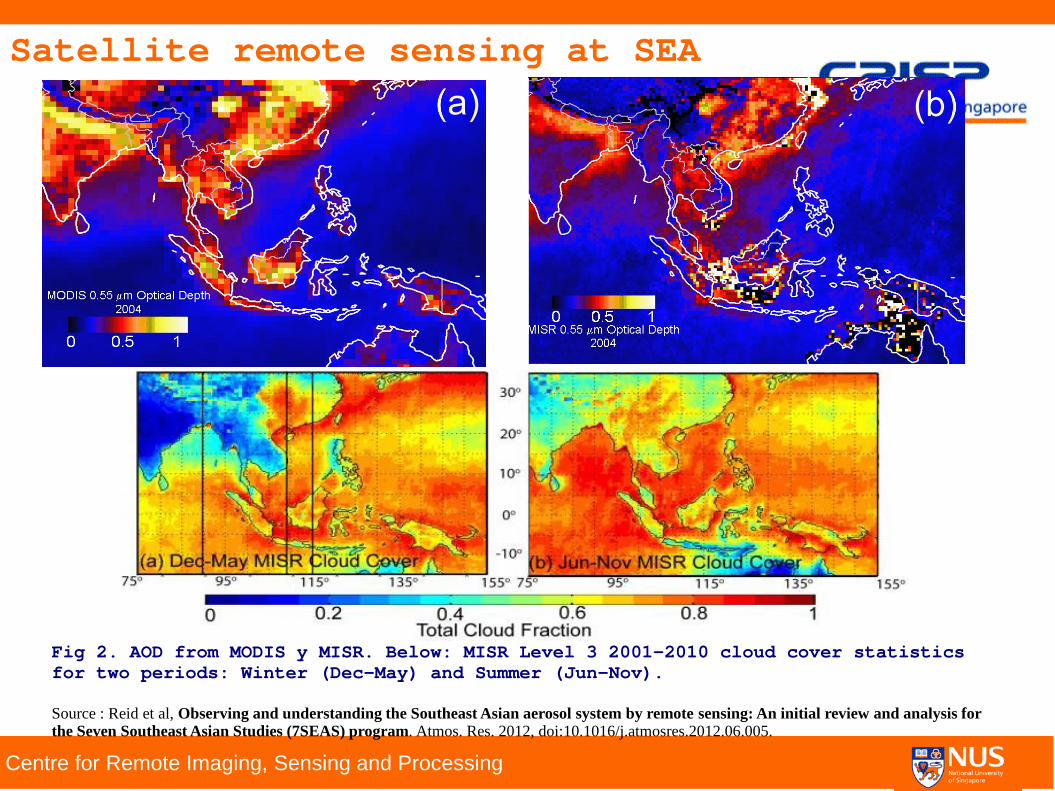
Fig 2. AOD from MODIS y MISR. Below: MISR Level 3 2001-2010 cloud cover statistics for two periods: Winter (Dec-May) and Summer (Jun-Nov). Source : Reid et al, Observing and understanding the Southeast Asian aerosol system by remote sensing: An initial review and analysis for the Seven Southeast Asian Studies (7SEAS) program. Atmos. Res. 2012, doi:10.1016/j.atmosres.2012.06.005.
Satellite remote sensing at SEA

Centre for Remote Imaging, Sensing and Processing
Monsoonal Flows
Fig 4: Monsoonal flows over Singapore (Chew et al., Atmos. Env., 2013)

Centre for Remote Imaging, Sensing and Processing
Monsoonal Flows
Fig 5: MODIS active fire hotspots (Reid et al., 2013)

Centre for Remote Imaging, Sensing and Processing
NUS/CRISP site of the Aerosol Robotic Network (AERONET, 2007)
Centre for Remote Imaging, Sensing and Processing
NUS/CRISP site of the Micro Pulse Lidar NETwork (MPLNET, 2009)

Centre for Remote Imaging, Sensing and Processing
Trans-boundary fires and PM2.5 measurements during October 2010
Fig. 6. Left: MODIS fire, AERONET, MPLNET and PM2.5 measurements at Singapore super-site. *Salinas et al., Physical and optical characteristics of the October 2010 haze event over Singapore: A photometric and lidar analysis. Atmos. Res. 2012, doi:10.1016/j.atmosres.2012.05.021.
Centre for Remote Imaging, Sensing and Processing
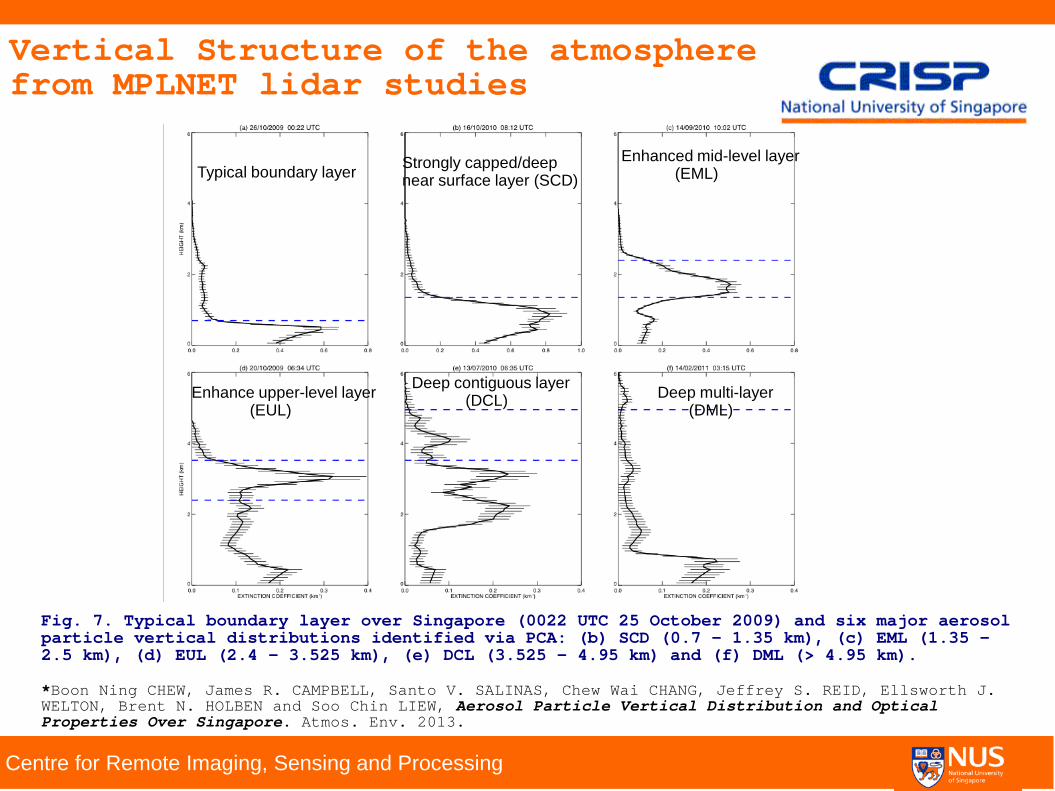
Vertical Structure of the atmosphere from MPLNET lidar studies
Fig. 7. Typical boundary layer over Singapore (0022 UTC 25 October 2009) and six major aerosol particle vertical distributions identified via PCA: (b) SCD (0.7 – 1.35 km), (c) EML (1.35 – 2.5 km), (d) EUL (2.4 – 3.525 km), (e) DCL (3.525 – 4.95 km) and (f) DML (> 4.95 km). *Boon Ning CHEW, James R. CAMPBELL, Santo V. SALINAS, Chew Wai CHANG, Jeffrey S. REID, Ellsworth J. WELTON, Brent N. HOLBEN and Soo Chin LIEW, Aerosol Particle Vertical Distribution and Optical Properties Over Singapore. Atmos. Env. 2013.
Strongly capped/deep near surface layer (SCD)
Enhanced mid-level layer (EML)
Enhance upper-level layer (EUL)
Deep contiguous layer (DCL) Deep multi-layer
(DML)
Typical boundary layer

Centre for Remote Imaging, Sensing and Processing
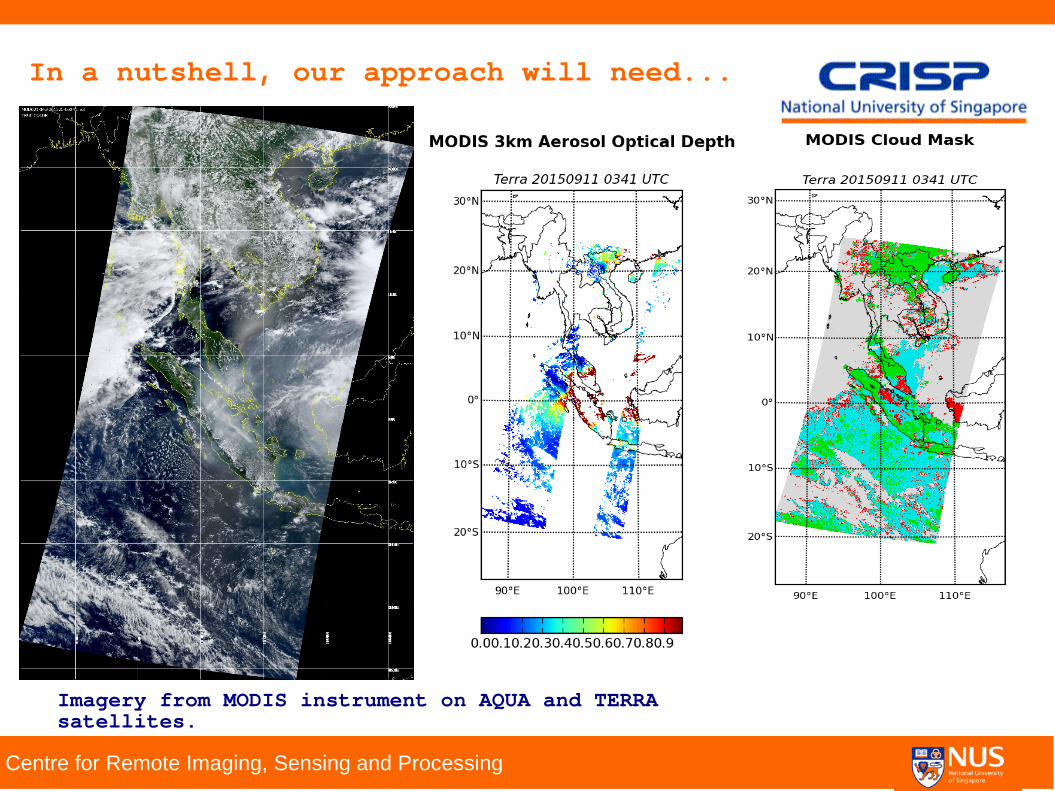
In a nutshell, our approach will need... MODIS on Aqua and Terra
Local and regional ground campaigns
MPLNET AERONET
Centre for Remote Imaging, Sensing and Processing
In a nutshell, our approach will need...
Imagery from MODIS instrument on AQUA and TERRA satellites.

Centre for Remote Imaging, Sensing and Processing
Potential of Himawari-8/9 geo-stationary Satellite.
Besides MODIS/NPP we could use geostationary satellites like the newly launched Himawari-8/9!!!

Centre for Remote Imaging, Sensing and Processing
Can we find a better correlation between AOD and PM2.5/10?
In general AOD is an integral form of aerosol extinction (scattering and absorption) with height from the surface to the top of the atmosphere.
Since the majority of aerosols reside in the boundary layer, then an approximate relationship for AOD and PM2.5/10 can be sought:

Centre for Remote Imaging, Sensing and Processing
Fig. 8. Monitoring capability of AOD and PM2.5/10 via satellites and in-situ instrumentation (E.g. Satellite derived PM2.5 concentration for June 19th to 22nd, 2013).
Monitoring via Satellite....

Centre for Remote Imaging, Sensing and Processing
Fig. 9. Prediction capabilities via a combination of satellite, in-situ and numerical modeling of aerosol transport. (E.g. modeled Satellite AOD for June 19th to 22nd, 2013).
Forecasting via numerical modelling....

Centre for Remote Imaging, Sensing and Processing
Summary
For severe pollution events, we propose a holistic approach that includes satellite, in-situ and numerical modelling.
The set up of a semi-mobile platform (photometer, lidar and PM2.5 samplers) deployed locally and regionally.
Our aim is to reduce model uncertainty for the evolution and transport of trans-boundary smoke.
To provide practical methods for in-situ, satellite and model based estimates of AOD and PM2.5.
Enhancing our existing monitoring capabilities of in-situ and satellite remote sensing to provide forecasting via modelling.
Scientific collaborations are welcome! We are looking for WRF/GEOS-Chem/CMAQ modellers, Anyone? Talk to us!