reliability of textural analysis of ancient plasters and mortars through automated image analysis
TRANSCRIPT
Materials Characterization
Reliability of textural analysis of ancient plasters and mortars
through automated image analysis
Federico Caro*, Andrea Di Giulio
Dipartimento di Scienze della Terra, Universita degli Studi di Pavia, Strada Ferrata, 1-27100 Pavia, Italia
Received 8 January 2004; accepted 24 June 2004
Abstract
For the study of ancient or recent plasters and mortars, it is necessary to determinate some morphological and textural
parameters to describe the aggregate fraction and its relationship with binder fraction. Textural analyses are commonly
performed with simple visual comparators or, at most, with a time-consuming manual point counting. The introduction of
automatic or semiautomatic image analysis techniques seems to have made this kind of determinations faster and less biased.
To compare data coming from different image-processing sequences or different analytical approaches, reliability and
calibration need to be tested by each operator. A critical principle setup is presented for comparison using laboratory mortars
with well-known textural features; classical analysis by sieving, point-counting technique and automated image analysis were
performed. This empirical strategy allowed (1) to develop a simple and easy-to-use software-based image analysis system for
plaster and mortar samples; (2) to pull out the relations between samples textural features and reliability of the different
approaches; (3) to provide linear relations that allow to convert apparent measured features to real features. Results also
underline the need to calibrate and standardize image analysis techniques before data handling.
D 2004 Published by Elsevier Inc.
Keywords: Mortars; Thin section; Textural analysis; Automated image analysis
1. Introduction
The characterization of building materials, such as
mortars and plasters, can give useful and unique
clues when different technological and historical
questions need to be answered. Determination of
1044-5803/$ - see front matter D 2004 Published by Elsevier Inc.
doi:10.1016/j.matchar.2004.06.014
* Corresponding author. Tel.: +39 382505846; fax: +39
382505890.
E-mail address: [email protected] (F. Caro).
chemical, physical, mineralogical and petrographical
parameters of the different components of plasters
and mortars permits:
– getting evidence of the different construction
periods;
– increasing the knowledge of regional historical
production and techniques;
– finding the correct formula of compatible restora-
tion materials and providing valuable information
for conservation purposes;
53 (2004) 243–257
F. Caro, A. Di Giulio / Materials Characterization 53 (2004) 243–257244
– weighting up the variations of statistical data
among each sampling campaign inherent to differ-
ent construction periods.
For these purposes, determination of some
morphological and textural parameters needs to
be carried out to describe the aggregate fraction
and its relationship to the binder fraction. Within
the various analytical methodologies for composi-
tional and physical identification, those related to
sample textural characterization play a very
important role as well. Variations in the quantity
and assortment of aggregate directly affect the
physical–mechanical properties of mortars and
plasters and therefore their behavior and durability.
When statistical data robustness is known, textural
information, together with mineralogical and chem-
ical details, represent a useful tool for the
discrimination and classification of sampled mate-
rials. Furthermore, such directions are of great
importance when compatible repair materials need
to be used.
It is widely recognized that the strict similarity
between mortars and sedimentary rocks requires the
adoption, for its characterization, of mineralogical–
petrographic techniques and principles belonging to
sedimentary petrography [1]. Particularly, sands and
sandstones are commonly described in terms of
grain-size distribution and composition. Grain-size
determination is normally achieved either through
sieving previously disaggregated material or by
microscopical observation of thin sections. Both
these techniques suffer from methodological limita-
tions; therefore, neither technique is always better
than the other; the choice between different
approaches depends upon each single case study.
The main limitations of the sieving technique
applied to ancient plasters and mortars are concerned
with:
– the limited amount of material available that
affects the accuracy and the statistical meaning
of the measurement;
– the presence of brittle and/or calcareous aggre-
gate that limit the use of grind and dissolution
techniques because of the big loss of informa-
tion [2].
Microscopical analysis of thin sections are faced
with:
– the problem that only two-dimensional (2D)
sections of different-shaped and randomly ori-
ented grains can be seen [2–5];
– the need to derive a weight distribution from the
frequency number distribution;
– the time-consuming and subjective analysis when
a manual point-counting technique is used;
– the poor accuracy and reproducibility when
comparative visual charts are used [6].
The introduction of automatic or semiautomatic
digital image analysis techniques contributed to over-
come some of these problems and partially solved
those related with tedious and biased investigations
[5,7–9]. Moreover, the use of statistical and unbiased
data plays an important role in stereological compu-
tations [10]. Nevertheless, problems due to sample
representative area, method accuracy and reliability
still remain. In the case of ancient plasters and
mortars, additional difficulties in automatic segmen-
tation arise when constituents of complex and various
nature are present [2,11–13].
A great number of studies have already pointed out
that a bias is introduced due to random sectioning of a
3D volume of spatial organized sample [2–5,14,15].
However, thin sections remain the most common,
cheapest and indispensable tool in petrographical
studies of building materials and can be used as a
source of additional quantitative textural information.
A fast, objective analysis permits examination of a
large number of grains so that a statistically mean-
ingful set of data is obtained to characterize the
sample. For these purposes, a critical principle setup
of an automated 2D image analysis system is
presented. Advantages and difficulties in applying
this technique to thin sections of plasters and mortars
are pointed out.
2. Materials and methods
2.1. Laboratory mortars
Before treating the data obtained from each ana-
lytical procedure, it is necessary to validate the method.
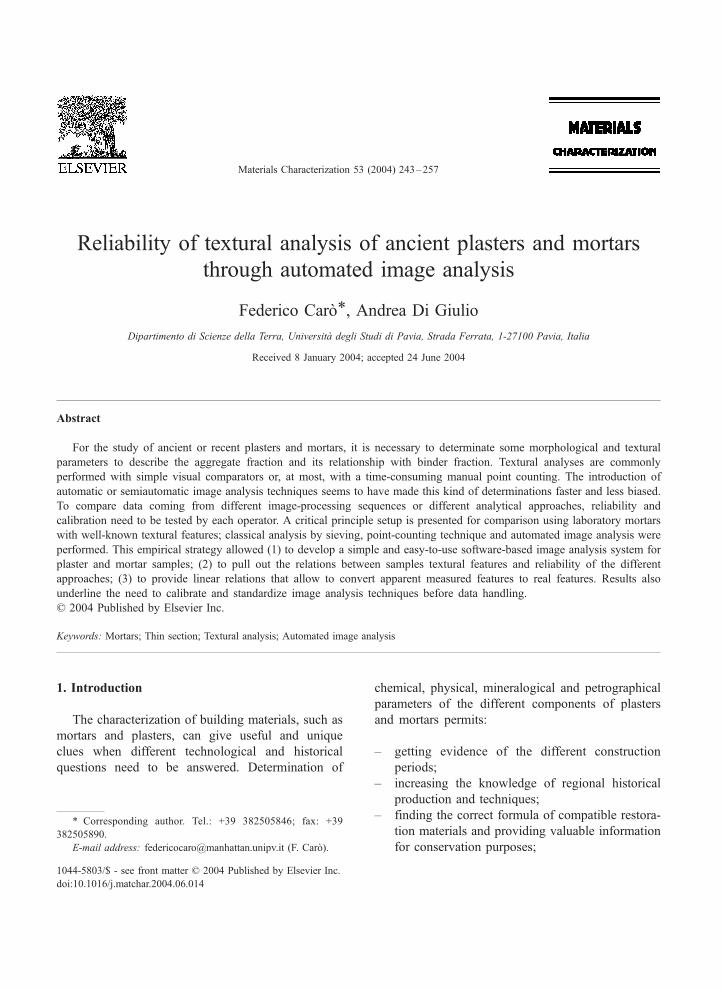
Fig. 1. Thin section of embedded loose quartz sand used as aggregate in experimental mortars; photos are taken in trasmitted light (left: crossed
nicols, right: parallel nicols).
F. Caro, A. Di Giulio / Materials Characterization 53 (2004) 243–257 245
The aim of this critical setup is to assure that measure-
ments effectively mirror the real features of the
samples. Hence, a validation procedure has been
adopted to point out possible relations between the
apparent features measured on the 2D surface of thin
sections and the textural properties of the sample.
Furthermore, when automatic textural analysis is
performed, bias introduced by the presence of hetero-
geneous aggregates must be taken into account.
Relations between quantitative results and conditions
of data acquisition will be also discussed.
For these purposes, laboratory mortars with prede-
termined textural features and composition were
prepared. A first set of mortars was made mixing a
pure quartz sand and a natural hydraulic lime; a second
set of mortars was made mixing the same hydraulic
lime and a blend of different aggregates of known
composition and ratio. In the following, results refer to
the analysis of mortars with the quartz aggregate.
This aggregate derives from the mechanical crush
of a generic Quartzite employed as a building row
Table 1
Aggregate wt.% fractions used in the laboratory mortars
�2U �1U 0U 1U 2U 3U 4U 5U
M2 5 90 5
M4 5 90 5
M5 5 90 5
M6 5 20 50 20 5
M7 5 20 50 20 5
M8 5 20 50 20 5
M9 5 20 50 20 5
material and sold in various grain-size classes. A
previous microscopical analysis showed a homoge-
nous collection of metamorphic quartz grains with
crushed shape and a very low content of impurity
(Fig. 1). These characteristics ensure constant and
compositional-free features under the light optical
microscope. Therefore, we can state that automatic
measurements are not affected by any compositional
(i.e., optical) variation of the objects.
Mechanical sieving is the most common method
adopted to measure the grain-size distribution of loose
sands and still remains a rapid, cheap and trouble-free
way to separate size fractions even for building
purposes [5,16,17].
A mechanical sieving was performed with an
automatic sieve shaker; the start sieve size and the
end sieve size were, respectively, �2U(4 mm) and
5U(0.032 mm). A sieve interval of 1U is chosen: no
pan fraction is considered. Sieving measures the width
of the minimum square aperture through which a grain
will pass. However, the following consideration
should be noted when interpreting the well-known
textural features of experimental mortars [5]: (1) not
all the particles retained by the sieve are really larger
then the sieve apertures; (2) grains can actually have
one dimension larger then the sieve aperture.
A number of aggregates different in grain size and
sorting was obtained by combining different amounts
of these eight grain classes; the used proportions are
reported in Table 1.
To produce an ordinary traditional mortar for
jointing or plastering, the aggregate is mixed with
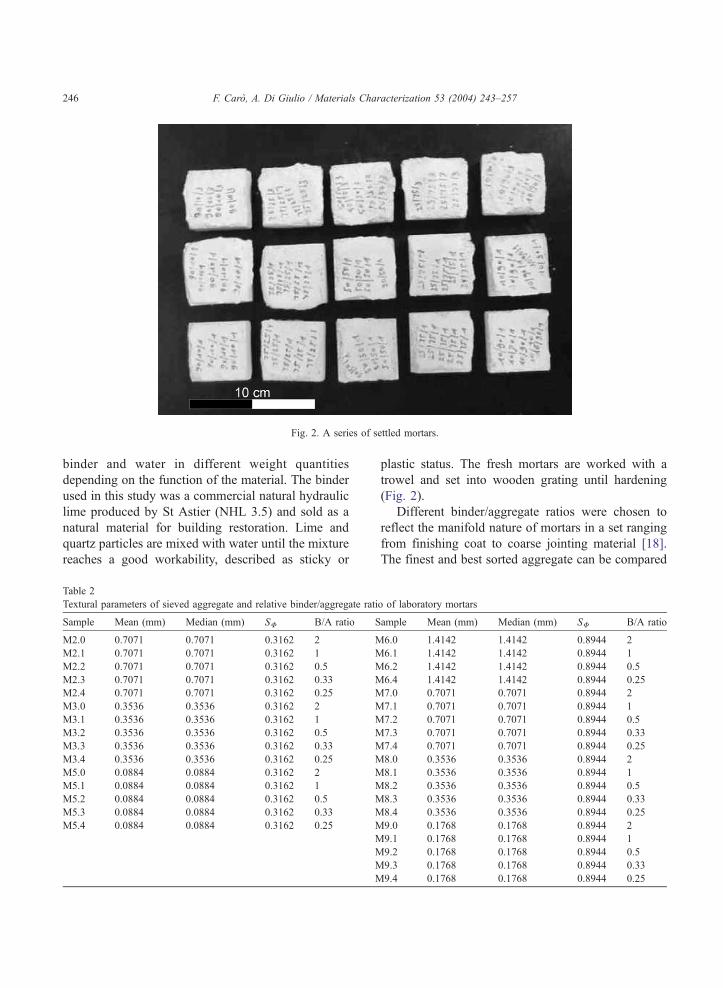
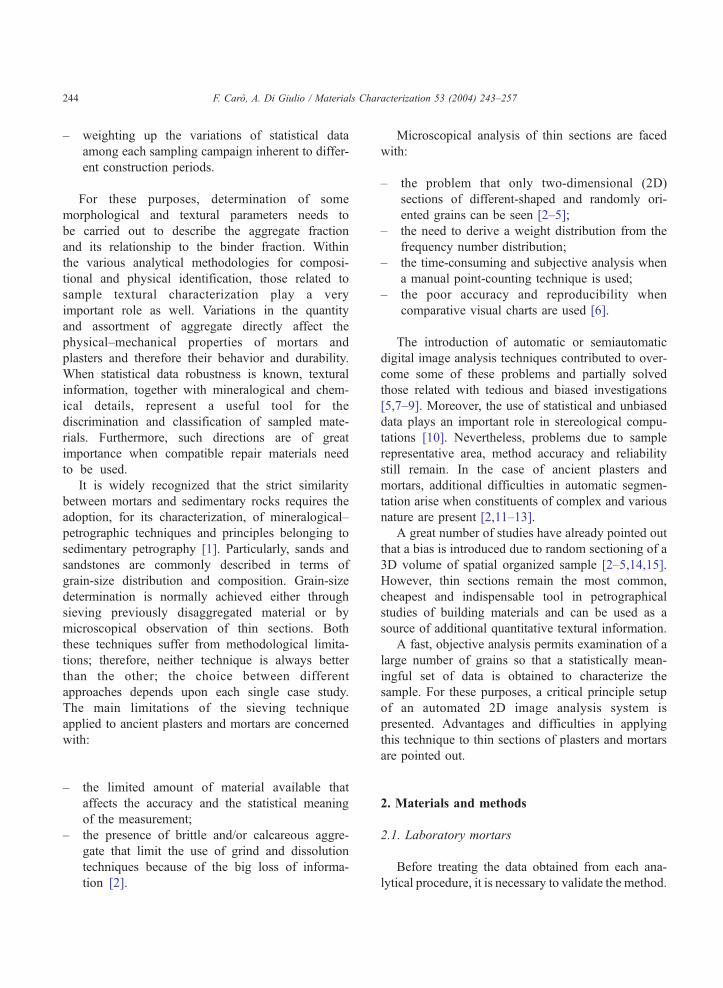
Fig. 2. A series of settled mortars.
F. Caro, A. Di Giulio / Materials Characterization 53 (2004) 243–257246
binder and water in different weight quantities
depending on the function of the material. The binder
used in this study was a commercial natural hydraulic
lime produced by St Astier (NHL 3.5) and sold as a
natural material for building restoration. Lime and
quartz particles are mixed with water until the mixture
reaches a good workability, described as sticky or
Table 2
Textural parameters of sieved aggregate and relative binder/aggregate rati
Sample Mean (mm) Median (mm) SU B/A ratio S
M2.0 0.7071 0.7071 0.3162 2 M
M2.1 0.7071 0.7071 0.3162 1 M
M2.2 0.7071 0.7071 0.3162 0.5 M
M2.3 0.7071 0.7071 0.3162 0.33 M
M2.4 0.7071 0.7071 0.3162 0.25 M
M3.0 0.3536 0.3536 0.3162 2 M
M3.1 0.3536 0.3536 0.3162 1 M
M3.2 0.3536 0.3536 0.3162 0.5 M
M3.3 0.3536 0.3536 0.3162 0.33 M
M3.4 0.3536 0.3536 0.3162 0.25 M
M5.0 0.0884 0.0884 0.3162 2 M
M5.1 0.0884 0.0884 0.3162 1 M
M5.2 0.0884 0.0884 0.3162 0.5 M
M5.3 0.0884 0.0884 0.3162 0.33 M
M5.4 0.0884 0.0884 0.3162 0.25 M
M
M
M
M
plastic status. The fresh mortars are worked with a
trowel and set into wooden grating until hardening
(Fig. 2).
Different binder/aggregate ratios were chosen to
reflect the manifold nature of mortars in a set ranging
from finishing coat to coarse jointing material [18].
The finest and best sorted aggregate can be compared
o of laboratory mortars
ample Mean (mm) Median (mm) SU B/A ratio
6.0 1.4142 1.4142 0.8944 2
6.1 1.4142 1.4142 0.8944 1
6.2 1.4142 1.4142 0.8944 0.5
6.4 1.4142 1.4142 0.8944 0.25
7.0 0.7071 0.7071 0.8944 2
7.1 0.7071 0.7071 0.8944 1
7.2 0.7071 0.7071 0.8944 0.5
7.3 0.7071 0.7071 0.8944 0.33
7.4 0.7071 0.7071 0.8944 0.25
8.0 0.3536 0.3536 0.8944 2
8.1 0.3536 0.3536 0.8944 1
8.2 0.3536 0.3536 0.8944 0.5
8.3 0.3536 0.3536 0.8944 0.33
8.4 0.3536 0.3536 0.8944 0.25
9.0 0.1768 0.1768 0.8944 2
9.1 0.1768 0.1768 0.8944 1
9.2 0.1768 0.1768 0.8944 0.5
9.3 0.1768 0.1768 0.8944 0.33
9.4 0.1768 0.1768 0.8944 0.25
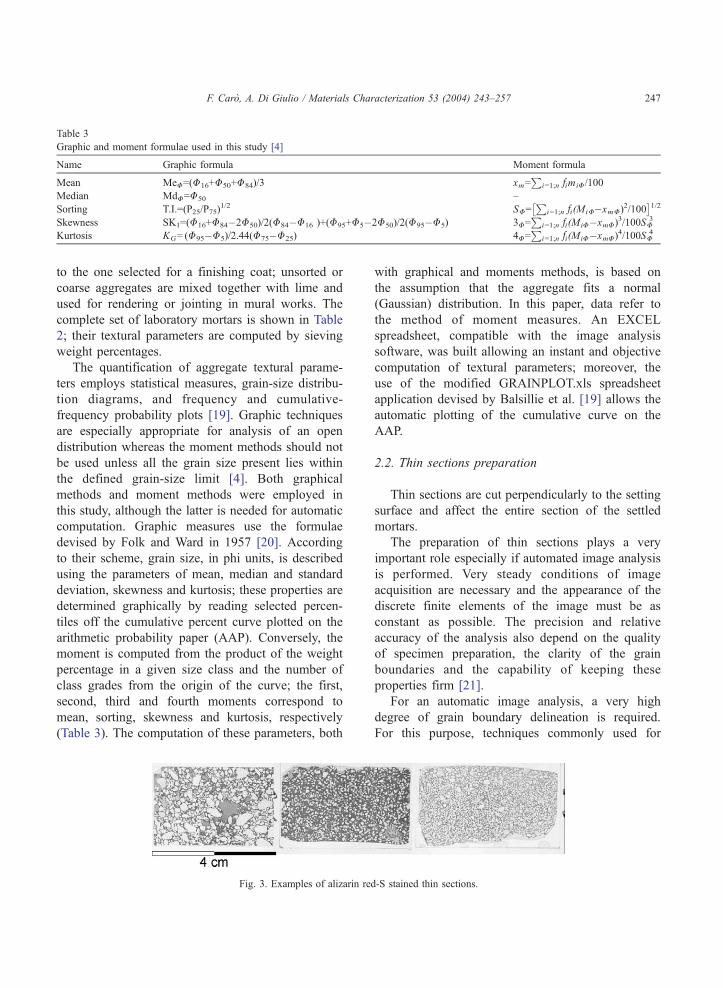
Table 3
Graphic and moment formulae used in this study [4]
Name Graphic formula Moment formula
Mean MeU=(U16+U50+U84)/3 xm=P
i=1;nCimiU/100
Median MdU=U50 –
Sorting T.I.=(P25/P75)1/2 SU=
�Pi=1;nCi(MiU�xmU)
2/100�1/2
Skewness SK1=(U16+U84�2U50)/2(U84�U16 )+(U95+U5�2U50)/2(U95�U5) 3U=P
i=1;nCi(MiU�xmU)3/100SU
3
Kurtosis KG=(U95�U5)/2.44(U75�U25) 4U=P
i=1;nCi(MiU�xmU)4/100SU
4
F. Caro, A. Di Giulio / Materials Characterization 53 (2004) 243–257 247
to the one selected for a finishing coat; unsorted or
coarse aggregates are mixed together with lime and
used for rendering or jointing in mural works. The
complete set of laboratory mortars is shown in Table
2; their textural parameters are computed by sieving
weight percentages.
The quantification of aggregate textural parame-
ters employs statistical measures, grain-size distribu-
tion diagrams, and frequency and cumulative-
frequency probability plots [19]. Graphic techniques
are especially appropriate for analysis of an open
distribution whereas the moment methods should not
be used unless all the grain size present lies within
the defined grain-size limit [4]. Both graphical
methods and moment methods were employed in
this study, although the latter is needed for automatic
computation. Graphic measures use the formulae
devised by Folk and Ward in 1957 [20]. According
to their scheme, grain size, in phi units, is described
using the parameters of mean, median and standard
deviation, skewness and kurtosis; these properties are
determined graphically by reading selected percen-
tiles off the cumulative percent curve plotted on the
arithmetic probability paper (AAP). Conversely, the
moment is computed from the product of the weight
percentage in a given size class and the number of
class grades from the origin of the curve; the first,
second, third and fourth moments correspond to
mean, sorting, skewness and kurtosis, respectively
(Table 3). The computation of these parameters, both
Fig. 3. Examples of alizarin red
with graphical and moments methods, is based on
the assumption that the aggregate fits a normal
(Gaussian) distribution. In this paper, data refer to
the method of moment measures. An EXCEL
spreadsheet, compatible with the image analysis
software, was built allowing an instant and objective
computation of textural parameters; moreover, the
use of the modified GRAINPLOT.xls spreadsheet
application devised by Balsillie et al. [19] allows the
automatic plotting of the cumulative curve on the
AAP.
2.2. Thin sections preparation
Thin sections are cut perpendicularly to the setting
surface and affect the entire section of the settled
mortars.
The preparation of thin sections plays a very
important role especially if automated image analysis
is performed. Very steady conditions of image
acquisition are necessary and the appearance of the
discrete finite elements of the image must be as
constant as possible. The precision and relative
accuracy of the analysis also depend on the quality
of specimen preparation, the clarity of the grain
boundaries and the capability of keeping these
properties firm [21].
For an automatic image analysis, a very high
degree of grain boundary delineation is required.
For this purpose, techniques commonly used for
-S stained thin sections.
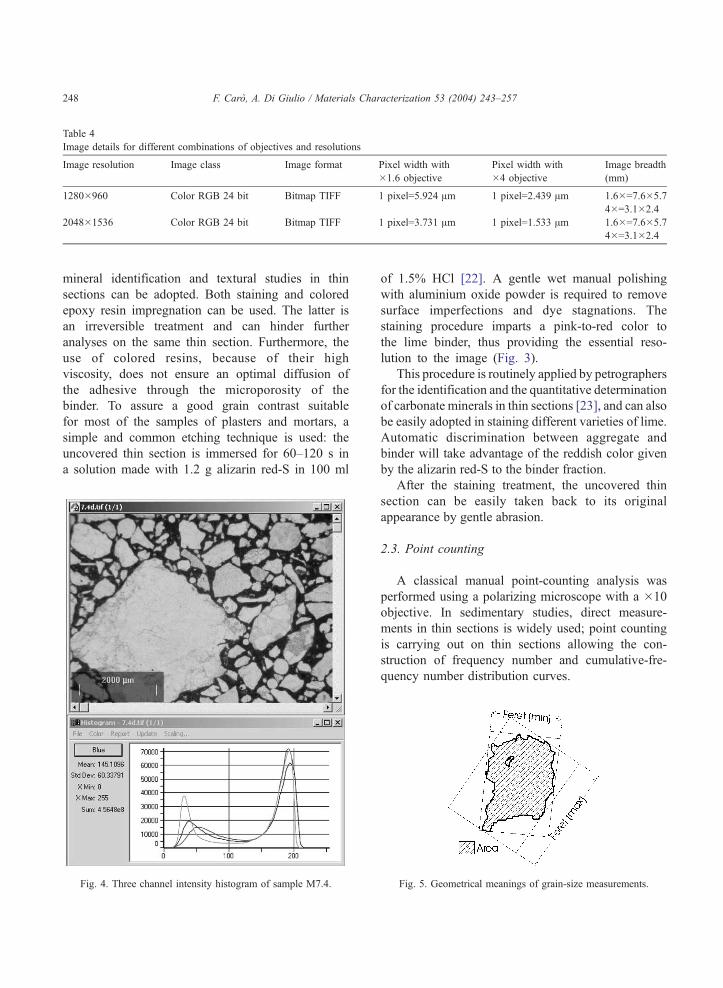
Table 4
Image details for different combinations of objectives and resolutions
Image resolution Image class Image format Pixel width with
�1.6 objective
Pixel width with
�4 objective
Image breadth
(mm)
1280�960 Color RGB 24 bit Bitmap TIFF 1 pixel=5.924 Am 1 pixel=2.439 Am 1.6�=7.6�5.7
4�=3.1�2.4
2048�1536 Color RGB 24 bit Bitmap TIFF 1 pixel=3.731 Am 1 pixel=1.533 Am 1.6�=7.6�5.7
4�=3.1�2.4
F. Caro, A. Di Giulio / Materials Characterization 53 (2004) 243–257248
mineral identification and textural studies in thin
sections can be adopted. Both staining and colored
epoxy resin impregnation can be used. The latter is
an irreversible treatment and can hinder further
analyses on the same thin section. Furthermore, the
use of colored resins, because of their high
viscosity, does not ensure an optimal diffusion of
the adhesive through the microporosity of the
binder. To assure a good grain contrast suitable
for most of the samples of plasters and mortars, a
simple and common etching technique is used: the
uncovered thin section is immersed for 60–120 s in
a solution made with 1.2 g alizarin red-S in 100 ml
Fig. 4. Three channel intensity histogram of sample M7.4.
of 1.5% HCl [22]. A gentle wet manual polishing
with aluminium oxide powder is required to remove
surface imperfections and dye stagnations. The
staining procedure imparts a pink-to-red color to
the lime binder, thus providing the essential reso-
lution to the image (Fig. 3).
This procedure is routinely applied by petrographers
for the identification and the quantitative determination
of carbonate minerals in thin sections [23], and can also
be easily adopted in staining different varieties of lime.
Automatic discrimination between aggregate and
binder will take advantage of the reddish color given
by the alizarin red-S to the binder fraction.
After the staining treatment, the uncovered thin
section can be easily taken back to its original
appearance by gentle abrasion.
2.3. Point counting
A classical manual point-counting analysis was
performed using a polarizing microscope with a �10
objective. In sedimentary studies, direct measure-
ments in thin sections is widely used; point counting
is carrying out on thin sections allowing the con-
struction of frequency number and cumulative-fre-
quency number distribution curves.
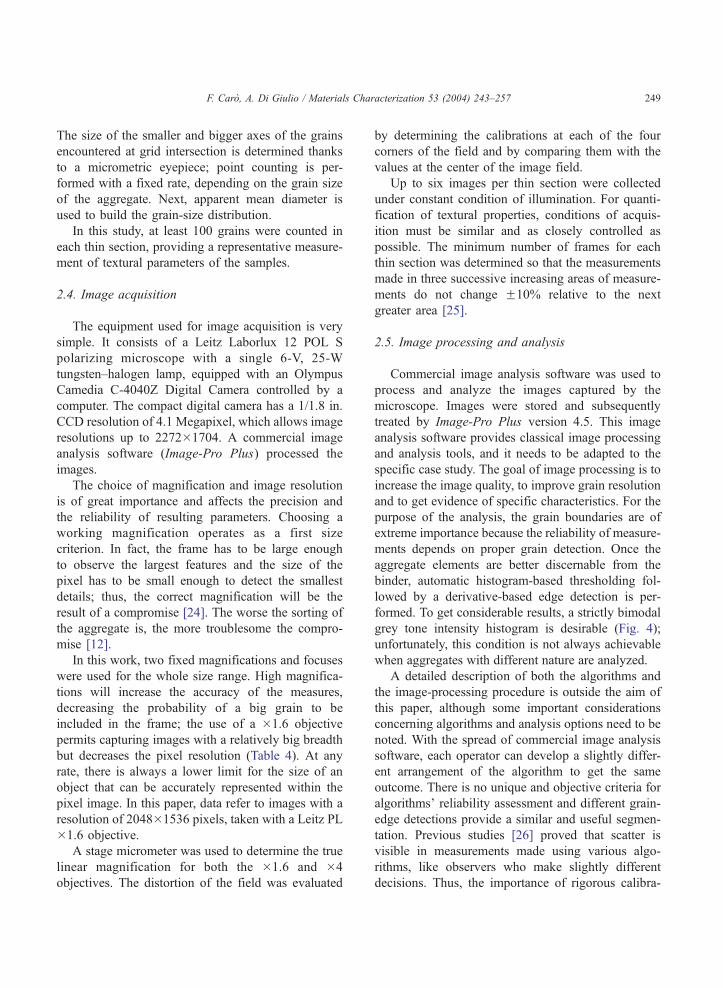
Fig. 5. Geometrical meanings of grain-size measurements.
F. Caro, A. Di Giulio / Materials Characterization 53 (2004) 243–257 249
The size of the smaller and bigger axes of the grains
encountered at grid intersection is determined thanks
to a micrometric eyepiece; point counting is per-
formed with a fixed rate, depending on the grain size
of the aggregate. Next, apparent mean diameter is
used to build the grain-size distribution.
In this study, at least 100 grains were counted in
each thin section, providing a representative measure-
ment of textural parameters of the samples.
2.4. Image acquisition
The equipment used for image acquisition is very
simple. It consists of a Leitz Laborlux 12 POL S
polarizing microscope with a single 6-V, 25-W
tungsten–halogen lamp, equipped with an Olympus
Camedia C-4040Z Digital Camera controlled by a
computer. The compact digital camera has a 1/1.8 in.
CCD resolution of 4.1 Megapixel, which allows image
resolutions up to 2272�1704. A commercial image
analysis software (Image-Pro Plus) processed the
images.
The choice of magnification and image resolution
is of great importance and affects the precision and
the reliability of resulting parameters. Choosing a
working magnification operates as a first size
criterion. In fact, the frame has to be large enough
to observe the largest features and the size of the
pixel has to be small enough to detect the smallest
details; thus, the correct magnification will be the
result of a compromise [24]. The worse the sorting of
the aggregate is, the more troublesome the compro-
mise [12].
In this work, two fixed magnifications and focuses
were used for the whole size range. High magnifica-
tions will increase the accuracy of the measures,
decreasing the probability of a big grain to be
included in the frame; the use of a �1.6 objective
permits capturing images with a relatively big breadth
but decreases the pixel resolution (Table 4). At any
rate, there is always a lower limit for the size of an
object that can be accurately represented within the
pixel image. In this paper, data refer to images with a
resolution of 2048�1536 pixels, taken with a Leitz PL�1.6 objective.
A stage micrometer was used to determine the true
linear magnification for both the �1.6 and �4
objectives. The distortion of the field was evaluated
by determining the calibrations at each of the four
corners of the field and by comparing them with the
values at the center of the image field.
Up to six images per thin section were collected
under constant condition of illumination. For quanti-
fication of textural properties, conditions of acquis-
ition must be similar and as closely controlled as
possible. The minimum number of frames for each
thin section was determined so that the measurements
made in three successive increasing areas of measure-
ments do not change F10% relative to the next
greater area [25].
2.5. Image processing and analysis
Commercial image analysis software was used to
process and analyze the images captured by the
microscope. Images were stored and subsequently
treated by Image-Pro Plus version 4.5. This image
analysis software provides classical image processing
and analysis tools, and it needs to be adapted to the
specific case study. The goal of image processing is to
increase the image quality, to improve grain resolution
and to get evidence of specific characteristics. For the
purpose of the analysis, the grain boundaries are of
extreme importance because the reliability of measure-
ments depends on proper grain detection. Once the
aggregate elements are better discernable from the
binder, automatic histogram-based thresholding fol-
lowed by a derivative-based edge detection is per-
formed. To get considerable results, a strictly bimodal
grey tone intensity histogram is desirable (Fig. 4);
unfortunately, this condition is not always achievable
when aggregates with different nature are analyzed.
A detailed description of both the algorithms and
the image-processing procedure is outside the aim of
this paper, although some important considerations
concerning algorithms and analysis options need to be
noted. With the spread of commercial image analysis
software, each operator can develop a slightly differ-
ent arrangement of the algorithm to get the same
outcome. There is no unique and objective criteria for
algorithms’ reliability assessment and different grain-
edge detections provide a similar and useful segmen-
tation. Previous studies [26] proved that scatter is
visible in measurements made using various algo-
rithms, like observers who make slightly different
decisions. Thus, the importance of rigorous calibra-
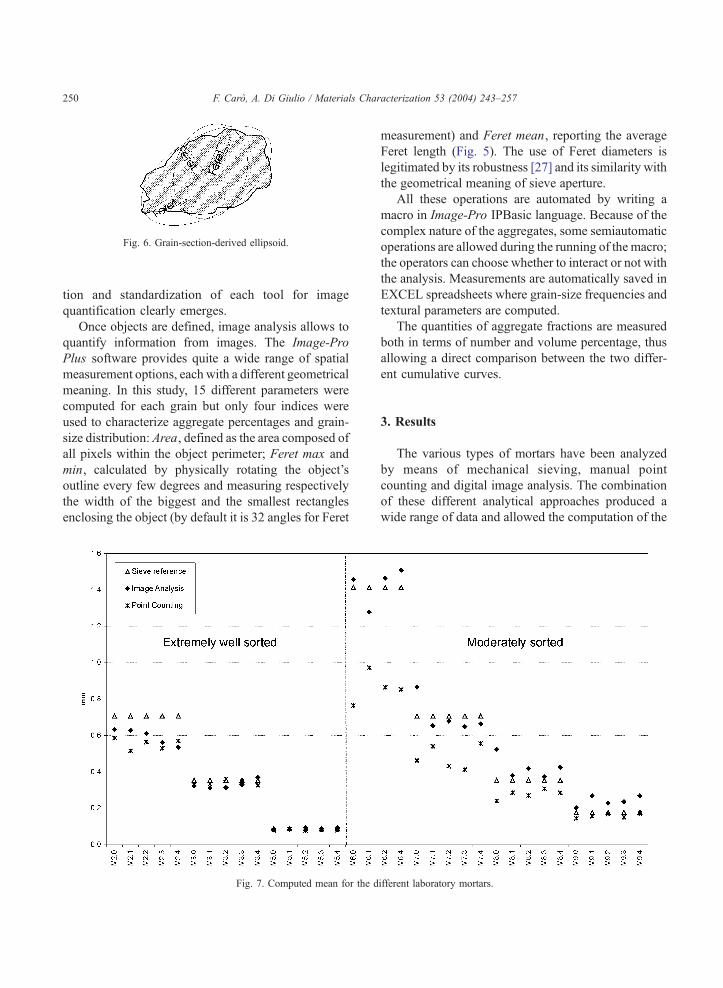
Fig. 6. Grain-section-derived ellipsoid.
F. Caro, A. Di Giulio / Materials Characterization 53 (2004) 243–257250
tion and standardization of each tool for image
quantification clearly emerges.
Once objects are defined, image analysis allows to
quantify information from images. The Image-Pro
Plus software provides quite a wide range of spatial
measurement options, each with a different geometrical
meaning. In this study, 15 different parameters were
computed for each grain but only four indices were
used to characterize aggregate percentages and grain-
size distribution: Area, defined as the area composed of
all pixels within the object perimeter; Feret max and
min, calculated by physically rotating the object’s
outline every few degrees and measuring respectively
the width of the biggest and the smallest rectangles
enclosing the object (by default it is 32 angles for Feret
Fig. 7. Computed mean for the d
measurement) and Feret mean, reporting the average
Feret length (Fig. 5). The use of Feret diameters is
legitimated by its robustness [27] and its similarity with
the geometrical meaning of sieve aperture.
All these operations are automated by writing a
macro in Image-Pro IPBasic language. Because of the
complex nature of the aggregates, some semiautomatic
operations are allowed during the running of the macro;
the operators can choose whether to interact or not with
the analysis. Measurements are automatically saved in
EXCEL spreadsheets where grain-size frequencies and
textural parameters are computed.
The quantities of aggregate fractions are measured
both in terms of number and volume percentage, thus
allowing a direct comparison between the two differ-
ent cumulative curves.
3. Results
The various types of mortars have been analyzed
by means of mechanical sieving, manual point
counting and digital image analysis. The combination
of these different analytical approaches produced a
wide range of data and allowed the computation of the
ifferent laboratory mortars.
F. Caro, A. Di Giulio / Materials Characterization 53 (2004) 243–257 251
following typical textural parameters: mean grain size,
median grain size, sorting of the aggregate and binder/
aggregate ratio. Grain-size parameters are computed
upon
– weight percentage of sieved particles;
– number percentage of manual point counted
particles;
– number percentage of automatic image analysis
measured particles from both 1280�960 and
2048�1536 images;
– volume percentage of automatic image analysis
measured particles from both 1280�960 and
2048�1536 images.
Direct comparison between different computations
allows to verify the reliability of the image analysis
and to calibrate the tool. To compare image analysis
data to sieve curves, some transformations are
needed. In the first place, number percentages need
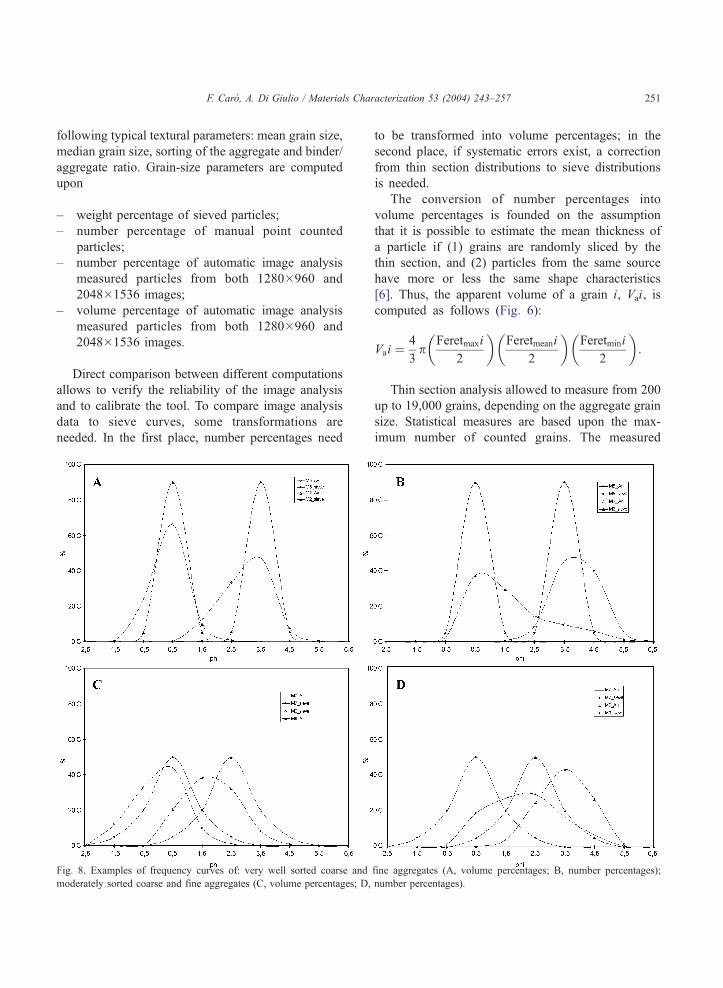
Fig. 8. Examples of frequency curves of: very well sorted coarse and
moderately sorted coarse and fine aggregates (C, volume percentages; D,
to be transformed into volume percentages; in the
second place, if systematic errors exist, a correction
from thin section distributions to sieve distributions
is needed.
The conversion of number percentages into
volume percentages is founded on the assumption
that it is possible to estimate the mean thickness of
a particle if (1) grains are randomly sliced by the
thin section, and (2) particles from the same source
have more or less the same shape characteristics
[6]. Thus, the apparent volume of a grain i, Vai, is
computed as follows (Fig. 6):
Vai ¼4
3p
Feretmaxi
2
�Feretmeani
2
�Feretmini
2
�:
���
Thin section analysis allowed to measure from 200
up to 19,000 grains, depending on the aggregate grain
size. Statistical measures are based upon the max-
imum number of counted grains. The measured
fine aggregates (A, volume percentages; B, number percentages);
number percentages).
F. Caro, A. Di Giulio / Materials Characterization 53 (2004) 243–257252
aggregate classes vary from very fine sand to very
coarse sand.
3.1. Mean grain size of the aggregate
Next, we will focus on the mean parameter
computed by the image analysis approach.
If we look at Fig. 7, it is clear that grain-size
parameters computed both with IA and point
counting mirror the original sieve data, although
with different trends, depending on the way the
cumulative percentages are computed. Data based
upon number percentages are obviously affected by
the sorting of the aggregate that amplifies the
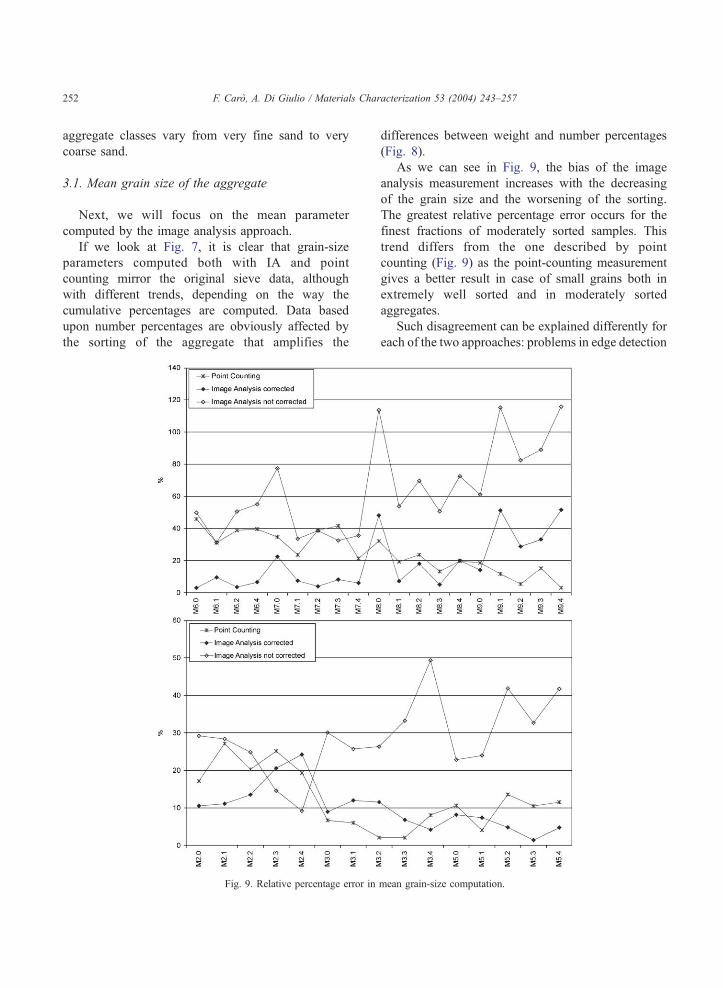
Fig. 9. Relative percentage error in
differences between weight and number percentages
(Fig. 8).
As we can see in Fig. 9, the bias of the image
analysis measurement increases with the decreasing
of the grain size and the worsening of the sorting.
The greatest relative percentage error occurs for the
finest fractions of moderately sorted samples. This
trend differs from the one described by point
counting (Fig. 9) as the point-counting measurement
gives a better result in case of small grains both in
extremely well sorted and in moderately sorted
aggregates.
Such disagreement can be explained differently for
each of the two approaches: problems in edge detection
mean grain-size computation.
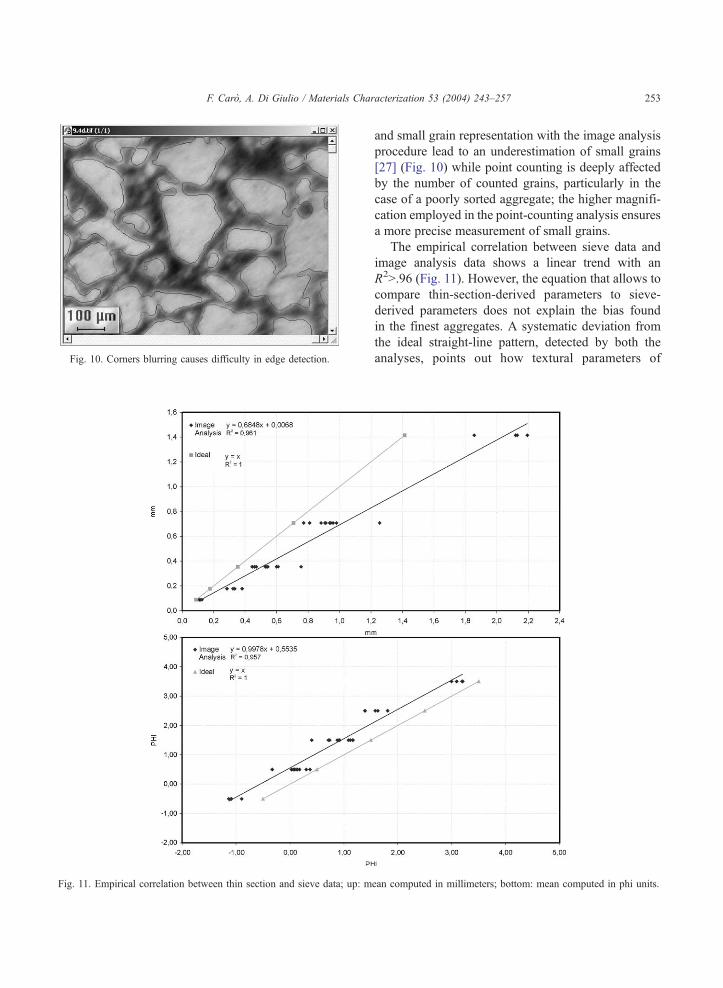
Fig. 10. Corners blurring causes difficulty in edge detection.
Fig. 11. Empirical correlation between thin section and sieve data; up: m
F. Caro, A. Di Giulio / Materials Characterization 53 (2004) 243–257 253
and small grain representation with the image analysis
procedure lead to an underestimation of small grains
[27] (Fig. 10) while point counting is deeply affected
by the number of counted grains, particularly in the
case of a poorly sorted aggregate; the higher magnifi-
cation employed in the point-counting analysis ensures
a more precise measurement of small grains.
The empirical correlation between sieve data and
image analysis data shows a linear trend with an
R2N.96 (Fig. 11). However, the equation that allows to
compare thin-section-derived parameters to sieve-
derived parameters does not explain the bias found
in the finest aggregates. A systematic deviation from
the ideal straight-line pattern, detected by both the
analyses, points out how textural parameters of
ean computed in millimeters; bottom: mean computed in phi units.
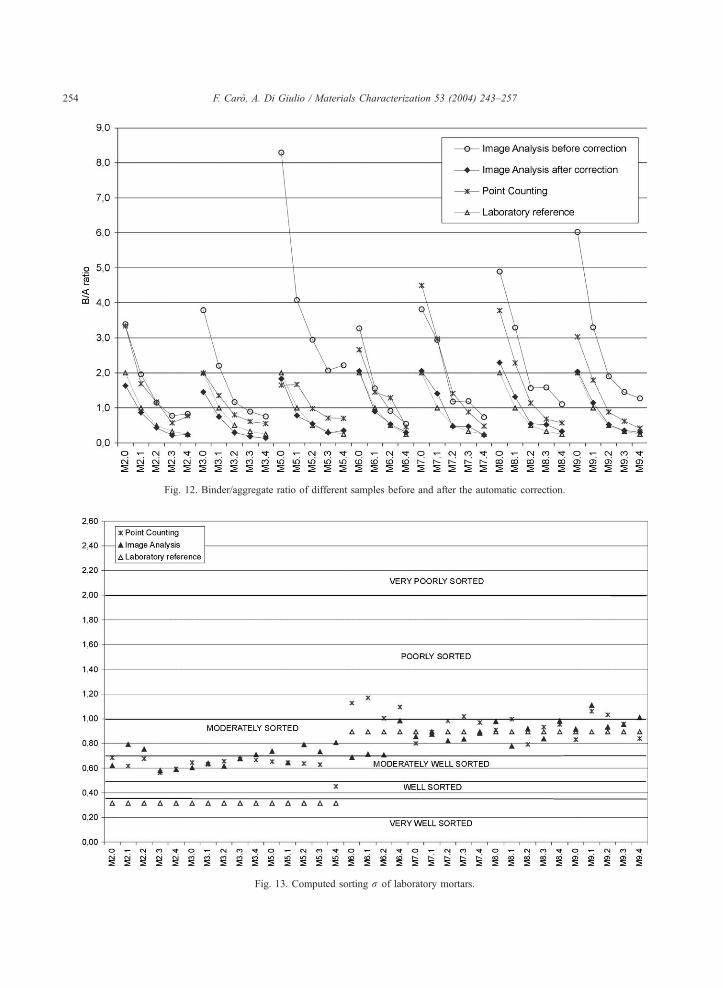
Fig. 12. Binder/aggregate ratio of different samples before and after the automatic correction.
Fig. 13. Computed sorting r of laboratory mortars.
F. Caro, A. Di Giulio / Materials Characterization 53 (2004) 243–257254
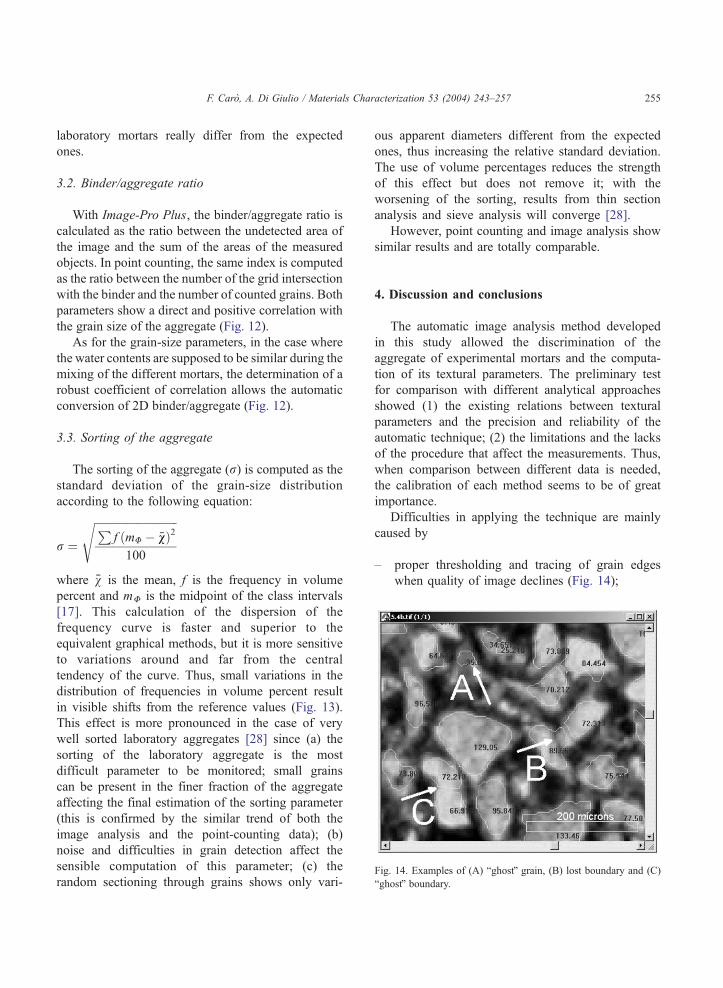
Fig. 14. Examples of (A) bghostQ grain, (B) lost boundary and (C
bghostQ boundary.
F. Caro, A. Di Giulio / Materials Characterization 53 (2004) 243–257 255
laboratory mortars really differ from the expected
ones.
3.2. Binder/aggregate ratio
With Image-Pro Plus, the binder/aggregate ratio is
calculated as the ratio between the undetected area of
the image and the sum of the areas of the measured
objects. In point counting, the same index is computed
as the ratio between the number of the grid intersection
with the binder and the number of counted grains. Both
parameters show a direct and positive correlation with
the grain size of the aggregate (Fig. 12).
As for the grain-size parameters, in the case where
the water contents are supposed to be similar during the
mixing of the different mortars, the determination of a
robust coefficient of correlation allows the automatic
conversion of 2D binder/aggregate (Fig. 12).
3.3. Sorting of the aggregate
The sorting of the aggregate (r) is computed as the
standard deviation of the grain-size distribution
according to the following equation:
r ¼
ffiffiffiffiffiffiffiffiffiffiffiffiffiffiffiffiffiffiffiffiffiffiffiffiffiffiffiffiffiffiPf ðmU � vvÞ2
100
s
where v is the mean, f is the frequency in volume
percent and mU is the midpoint of the class intervals
[17]. This calculation of the dispersion of the
frequency curve is faster and superior to the
equivalent graphical methods, but it is more sensitive
to variations around and far from the central
tendency of the curve. Thus, small variations in the
distribution of frequencies in volume percent result
in visible shifts from the reference values (Fig. 13).
This effect is more pronounced in the case of very
well sorted laboratory aggregates [28] since (a) the
sorting of the laboratory aggregate is the most
difficult parameter to be monitored; small grains
can be present in the finer fraction of the aggregate
affecting the final estimation of the sorting parameter
(this is confirmed by the similar trend of both the
image analysis and the point-counting data); (b)
noise and difficulties in grain detection affect the
sensible computation of this parameter; (c) the
random sectioning through grains shows only vari-
ous apparent diameters different from the expected
ones, thus increasing the relative standard deviation.
The use of volume percentages reduces the strength
of this effect but does not remove it; with the
worsening of the sorting, results from thin section
analysis and sieve analysis will converge [28].
However, point counting and image analysis show
similar results and are totally comparable.
4. Discussion and conclusions
The automatic image analysis method developed
in this study allowed the discrimination of the
aggregate of experimental mortars and the computa-
tion of its textural parameters. The preliminary test
for comparison with different analytical approaches
showed (1) the existing relations between textural
parameters and the precision and reliability of the
automatic technique; (2) the limitations and the lacks
of the procedure that affect the measurements. Thus,
when comparison between different data is needed,
the calibration of each method seems to be of great
importance.
Difficulties in applying the technique are mainly
caused by
– proper thresholding and tracing of grain edges
when quality of image declines (Fig. 14);
)
F. Caro, A. Di Giulio / Materials Characterization 53 (2004) 243–257256
– inaccurate grain detection when too many adjacent
grains are present (i.e., for very low binder/
aggregate ratio);
– pixel resolution when measurements of unsorted
aggregate are performed on a single image.
In the case of low magnification (�1.6 objective)
and image resolution of 2048�1536, the pixel width
equals to 3.7 Am. Because of algorithm characteristics
and image defects, the grain boundaries can be
rounded up or down by at most one pixel. Therefore,
if we fix a percentage error limit of 10% [5], particles
whose size are less than 20 pixel (75 Am) are not
expected to be measured accurately.
The comparison of different computed textural
parameters shows that (1) in the case of coarse
aggregates, both in image analysis and point-counting
analysis, bias concerns the scale of the images; (2) in
the case of fine aggregates, bias concerns image
resolution and grain detection, thus resulting in a
general overestimation of grain size; this trend is more
pronounced in mortars with small grains and low
binder/aggregate ratio.
The detection of adjacent grains is more problem-
atic in the case of blurred images of fine fractions. The
blurring effect is intensified at the corners of the
image and is caused by an intrinsic lack in the image
acquisition. When a large number of grains is present
in a single image, it is possible to select a central area
of interest (AOI) not affected by noise; counting will
be performed on this area if a representative number
of grain will be attained.
From the above, it becomes apparent that a fully
automated procedure with no interaction from the ope-
rator is not always possible; the more manifold is the
nature of the aggregate, the more indispensable is the
interaction. Nevertheless, if the interaction is limited
and guided by interactive windows during the analysis,
results remain in any case objective and repeatable.
The use of etched thin sections can give consistent
results in textural analysis of mortars and plasters with
aggregates ranging from fine to very coarse sands.
Results are similar to those obtained by classical point
counting but they are more objective, repeatable and
extremely quicker then manual computation. Con-
version from point to volume percentage allows the
comparison of thin section data to those derived by
mechanical sieving.
Automatic corrections are needed to adjust the
systematic errors due to the image processing and
analysis. However, the suggested equations are valid
for this algorithm sequence only. Thus, it is of great
importance for each user to adopt a strong procedure of
calibration before any routine grain-size assessment.
References
[1] Alessandrini G. Gli intonaci nell’edilizia storica: metodologie
analitiche per la caratterizzazione chimica e fisica. Proc
Annual Conf L’Intonaco: Storia, Cultura e Tecnologia.
Bressanone, Italy, June 24–27; 1985, p. 147–66.
[2] Sch7fer A, Teyssen T. Size, shape and orientation of grains in
sands and sandstones—image analysis applied to rock thin-
sections. Sediment Geol 1987;52:251–71.
[3] Harrel JA, Eriksson KA. Empirical conversion equation for
thin section to sieve derived size distribution parameters.
J Sediment Petrol 1979;49:273–80.
[4] Pettijohn FJ, Potter PE, Siever R. Sands and sandstones. 2nd
ed. New York7 Springer-Verlag; 1987.
[5] Mora CF, Kwan AKH, Chan HC. Particle size distribution
analysis of coarse aggregate using digital image processing.
Cem Concr Res 1998;28:921–32.
[6] Beard DC, Weyl PK. Influence of texture on porosity and
permeability of unconsolidated sand. AAPG Bull 1973;57:
349–69.
[7] Jongmans D, Pirard E, Marsh S. Geological application of
digital imaging. Comput Geosci 2001;27:1015–7.
[8] Chermant J-L. Why automatic image analysis? An introduc-
tion to this issue. Cem Concr Compos 2001;23:127–31.
[9] Chermant J-L, Chermant L, Coster M, Dequiedt A-S, Redon
C. Some field of applications of automatic image analysis in
civil engineering. Cem Concr Compos 2001;23:157–69.
[10] DeHoff R. Probes, populations, samples, measurements and
relations in stereology. Image Anal Stereol 2000;19:1–8.
[11] Montana G. Mineralogical–petrographic characterization of
plasters by BSE images and their digital processing. Sci
Technol Cult Herit 1995;4-2:23–31.
[12] Francus P. An image-analysis technique to measure grain-size
variation in thin sections of soft clastis sediments. Sediment
Geol 1998;121:289–98.
[13] Ortenzi A, Fioriani M. Petrographic applications of image
analysis. In: Spencer AM, editor. Generation, accumulation
and production of europe’s hydrocarbons III.Special Publica-
tion of the European Association of Petroleum Geoscientists,
vol. 3, p. 369–75.
[14] Stroeven P, Stroeven AP, Dalhuisen DH. Image analysis of
dnaturalT concrete samples by automated and manual proce-
dures. Cem Concr Compos 2001;23:227–36.
[15] Persson AL. Image analysis of shape and size of fine
aggregates. Eng Geol 1998;50:177–86.
[16] Krumbein WC, Pettijohn FJ. Manual of sedimentary petrog-
raphy. New York (NY)7 Appleton–Century–Crofts; 1963.
F. Caro, A. Di Giulio / Materials Characterization 53 (2004) 243–257 257
[17] McManus J. Grain size determination and interpretation. In:
Tucker M, editor. Techniques in sedimentology, 3rd ed.
Oxford7 Blackwell Scientific Publications; 2001. p. 63–85.
[18] Arcolao C. Le ricette del restauro. Malte, intonaci, stucchi dal
XV al XIX secolo. Venezia7 Marsilio Editori; 1998.
[19] Balsillie JH, Donoghue JF, Butler KM, Koch JL. Plotting
equation for gaussian percentiles and a spreadsheet program
for generating probability plots. J Sediment Res 2002;72:
929–43.
[20] Folk RL, Ward WC. Brazos River bar: a study in significance
of grain size parameters. J Sediment Petrol 1957;27:3–26.
[21] ASTM International. E1382-97 Standard Test Methods for
Determining Average Grain Size Using Semiautomatic and
Automatic Image Analysis.
[22] Humphries DW. In: Hammond C, editor. The preparation of
thin section of rocks, minerals, and ceramics. New York (NY)7
Oxford University Pres; 1992. p. 56–62.
[23] Friedman GM. Identification of carbonate minerals by staining
methods. J Sediment Petrol 1959;29:87–97.
[24] Coster M, Chermant J-L. Image analysis and mathematical
morphology for civil engineering materials. Cem Concr
Compos 2001;23:133–51.
[25] VandenBygaart AJ, Protz R. The rapresentative elementary
area (REA) in studies of quantitative soil micromorphology.
Geoderma 1999;89:333–46.
[26] Lataya Z, Wojnar L. Computer-aided versus manual grain size
assessment in a single phase material. Mater Charact 2001;46:
227–33.
[27] Chermant J-L, Coster M. Granulometry and granulomorphy
by image analysis. Acta Stereol 1991;10:7–23.
[28] Johnson MR. Thin section grain size analysis revisited.
Sedimentology 1994;41:985–99.