religious fragmentation, social identity and other
TRANSCRIPT

Contents lists available at ScienceDirect
Journal of Behavioral and Experimental Economics
journal homepage: www.elsevier.com/locate/jbee
Religious fragmentation, social identity and other-regarding preferences:Evidence from an artefactual field experiment in India☆
Surajeet Chakravartya, Miguel A. Fonseca⁎,a, Sudeep Ghoshb, Pradeep Kumara, Sugata MarjitcaUniversity of Exeter, Exeter, United KingdombHong Kong Polytechnic University, Kowloon, Hong Kongc Center for Studies in the Social Sciences, Calcutta, India
A R T I C L E I N F O
Keywords:Social identitySocial fragmentationArtefactual field experiment
JEL classification:C93D03H41
A B S T R A C T
We examine the impact of religious identity and village-level religious fragmentation on other-regarding pre-ferences. We report on a series of two-player binary Dictator experiments conducted on a sample of 516 Hinduand Muslim participants in rural West Bengal, India. Our treatments are the identity of the two players and thedegree of religious fragmentation in the village where subjects reside. Both Muslims’ and Hindus’ aversion toadvantageous inequality declines as the probability of facing an out-group member increases. We find no evi-dence of aversion to disadvantageous inequality on either religious sample. Both Muslim and Hindu participantsdisplay aversion to advantageous inequality in both fragmented villages and homogeneous villages. The effect ofvillage fragmentation on aversion to disadvantageous inequality differs across religious groups.
1. Introduction
Over the last 20 years, development economists have uncovered anegative correlation between social fragmentation and economic per-formance (Easterly & Levine, 1999; Alesina, Devleeschauwer, Easterly,Kurlat, & Wacziarg, 2003; Miguel & Gugerty, 2005; Khwaja, 2009).Social identity theory makes a plausible case for why socially homo-geneous groups might be more cooperative. Indeed, group membershippositively affects cooperation in the lab, provided that group identity issufficiently salient (Eckel & Grossman, 2005; Charness, Rigotti, &Rustichini, 2007), as well as in high stakes, lab-in-the-field experimentswith real social groups (Goette, Huffman, & Meier, 2006; Chakravarty,Fonseca, Ghosh, & Marjit, 2016b). Social preferences have long beenidentified as a primary mechanism through which identity operates(Tajfel, Billig, Bundy, & Flament, 1971; Chen & Li, 2009).
In the present paper, we examine the extent to which social pre-ferences are affected by social fragmentation, and if this occurs as aresult of in-group/out-group differences. We estimate group-contingentsocial preferences through individuals’ choices over income distribu-tions. The relevant dimension in our experiment is religious affiliation:
Hindu and Muslim. We conducted our experiment in rural West Bengal,India, where religious identity and religious fragmentation are centralto almost all aspects of life.
Our experimental design varies the group membership of the dic-tator player and the recipient player to generate in-group/out-grouppairings. The main innovation of our experimental design is that itvaries the degree of social fragmentation within the locality of the ex-perimental subjects. We do so by selecting villages on the basis of theirreligious breakdown: Hindu-dominated, Muslim-dominated, and vil-lages with a relatively equal proportion of both religious groups. Thisquasi-experimental dimension of our design is motivated by the insightsfrom Allport (1954) and Brewer (1991, 1999) that individuals mayidentify more with their in-group in a heterogenous environment thanin a homogenous environment. Therefore, inter-group biases ought tobe more pronounced in more heterogenous communities.
We find consistent evidence with our hypothesis. We find in-group/out-group differences in social preferences, in that subjects are onaverage more averse to inequality when sharing financial resourceswith an in-group member than with an out-group member. As pre-dicted, those differences in preferences are more pronounced in more
https://doi.org/10.1016/j.socec.2019.101451Received 6 September 2018; Received in revised form 8 July 2019; Accepted 15 July 2019
☆ We gratefully acknowledge financial support from the ESRCgrant ES/J018643/1. We thank Jharna Phanda, Sujit Kumar Mondal, Ramkrishna Mondal, NareshChandra Mondal, Sk.Md. Basiruddin for their excellent assistance with running the sessions. We thank two anonymous reviewers and the editor for helpful sug-gestions and comments. All errors are ours alone. We have obtained approval to conduct this research from the ethics officer (IRB-equivalent) at the University ofExeter.
⁎ Corresponding author.E-mail addresses: [email protected] (S. Chakravarty), [email protected] (M.A. Fonseca), [email protected] (S. Ghosh),
[email protected] (P. Kumar), [email protected] (S. Marjit).
Journal of Behavioral and Experimental Economics 82 (2019) 101451
Available online 18 July 20192214-8043/ © 2019 The Authors. Published by Elsevier Inc. This is an open access article under the CC BY license (http://creativecommons.org/licenses/BY/4.0/).
T
brought to you by COREView metadata, citation and similar papers at core.ac.uk
provided by Open Research Exeter

socially fragmented villages. However, our estimates of inequalityaversion are rather small compared to estimates from similar tasks in aminimal group paradigm (and no fragmentation). This suggests thatinequality aversion may not be the principal channel through whichgroup membership operates in religious identities.
Understanding social preferences is important because they affordus insight into individual preferences for redistribution (Dimick, Rueda,& Stegmueller, 2018). Social identity is important to consider in thecontext of redistribution, since it creates a wedge between inequalityand group membership. The former is typically conceptualized and/ormeasured at a level that supersedes group identities (nationality beingthe obvious exception). But reducing overall inequality may come at theexpense of reducing inter-group income or status differences, whichmay be unpalatable to those with strong in-group preferences and leadto the emergence of political movements that cater to specific socialgroups. The BJP is a prominent case in point in India, although ex-amples abound worldwide, including Northern Ireland (where the twomain religious groups are Catholics and Protestants).
Tajfel et al. (1971) first established in-group/out-group biases indistribution games using an unincentivized third-party dictator game,although they did not operate in an expected utility framework. Thefirst paper that establishes and formally quantifies an effect of identityon preferences is Chen and Li (2009), who find in-group biases in socialpreferences in a minimal group paradigm. Our results show a muchweaker effect of social identity on preferences than that estimated byChen and Li (2009). Our results are also in line with a recent wave ofwork on identity and redistribution. Berge et al. (2015) study the role ofethnic biases on the standard dictator game in Kenya. They find noevidence of ethnic biases in preferences. Kranton, Pease, Sanders, andHuettel (2016) study the role of group affiliation on social preferences.They study this both in a minimal group framework, as well as politicalmembership (Democratic vs. Republican). They find large hetero-geneity in their sample: some subjects exhibit no difference in socialpreferences towards in-group or out-group, while others exhibit in-group biases regardless of whether their group is minimal or political innature – the latter individuals are more likely to affiliate with politicalparties than the former. The authors suggest that group divisions maybe more important than group identity. In other words, our resultsconfirm a line of work that suggests that distributional preferences maynot be the main channel through which social identity operates.
Social preferences are an important determinant of cooperation insocial dilemmas (Fehr & Schmidt, 1999). The literature on socialidentity has identified three mechanisms for why group membershipmay affect cooperation in social dilemmas. Individuals may care morefor the welfare of their own in-group members than for that of outsiders(Chen & Li, 2009). Group membership may change individuals’ beliefsabout others’ cooperativeness, which in turn may amplify the effect ofsocial preferences (Berge et al., 2015). Group membership can alsointroduce prescriptions of behavior, which facilitates cooperationamong group members (Akerlof & Kranton, 2000). It is still an openquestion as to which of the three mechanisms is most important. Bymeasuring the impact of religious identity on distributional preferences,we are able to inform the existing literature on religious identity andcooperation.
There is a small literature on religious identity and cooperation towhich our results may speak. Chakravarty et al. (2016b) study the roleof religious affiliation and religious fragmentation along Hindu-Muslimlines on cooperation in the Prisoners’ Dilemma and Stag Hunt game inWest Bengal, India. They vary the religious identity of the two players,as well as the degree of religious fragmentation at the village level(through choice of village). They find strong evidence of in-group biasesin the Prisoners’ Dilemma, but only partial evidence in the Stag Huntgame. In-group biases were higher in villages that were socially frag-mented, supporting the hypothesis that a given identity is more salientin a heterogeneous society. Chuah, Hoffmann, Ramasamy, andTan (2014) find similar evidence of religious in-group biases in the
Prisoners’ Dilemma in Malaysia.The fact that we find small estimates on group-contingent other-
regarding preferences suggests that the large differences in cooperationin the aforementioned studies might not be explained by social pre-ferences alone. Our evidence, in addition to existing evidence fromsocial dilemma games, suggests that social preferences play a limitedrole in determining behavior in circumstances in which a religiousidentity is relevant.
2. Social identity theory
The theory of social identity (Tajfel & Turner, 1979; 1986), postu-lates that individuals derive well-being from group membership, even ifsaid membership provides no survival benefits. This positive groupidentity comes in large part from favourable comparisons with thosewho do not belong to one’s group. Social identity theory argues thatindividuals belonging to a social group exhibit positive biases towardsother members of the same group relative to individuals who do notbelong to the same group.
2.1. Incorporating social identity in social preferences
Chen and Li (2009) extend the utility function proposed byCharness and Rabin (2002), which assumes economic agents derive(dis)utility not only from their own wealth, but also from wealth dif-ferences with regards to other agents.1 Eq. (1) describes a simplifiedversion of Charness and Rabin’s functional form2:
= + +U r s( ) ( ) ,i i i i j i j i (1)
where =r 1 if πi> πj and 0 otherwise; =s 1 if πj> πi and 0 otherwise.The ρ parameter captures our attitudes to inequality in income when
we are better off than our counterpart; σ captures our attitudes to in-equality when we are worse off than our counterpart. This formulationcoincides with the model proposed by Fehr and Schmidt (1999) ifσ≤ ρ≤0 (Charness and Rabin, 2002, p.823), but it can also encompassspiteful/competitive preferences if σ<0< ρ<1.
This model can be easily extended to incorporate group-contingentsocial preferences. Let =g I O, , where I and O stand respectively for in-group and out-group. Charness and Rabin’s modified, group-contingentmodel of social preferences becomes:
= + +U r s( ) ( ) ,i ig
ig
i jg
ig
j i(2)
The social identity model predicts that individuals care about thewelfare of in-group members more than that of out-group members.This implies that <i
IiO and <i
IiO. That is to say, player i places
more weight on interpersonal comparisons of income between herselfand out-group members than between herself and in-group members. Aconsequence of this assumption is that individuals will tolerate higherdegrees of inequality within their in-group than across social groups.
2.2. Muslim and Hindu identities in West Bengal, India
Studying social identity is complex, especially given the difficulty inisolating the identities which play a dominant role in socioeconomiccontexts. A key social institution which forges identity of an individualin India is religion. Since the modern Indian state was formed in 1947,religious divisions have caused social and economic tensions.Turner and Brown (1978) suggest that there is an insecure relationship
1 For other theoretical models of social identity in economics, see Akerlof andKranton (2000), Basu (2007) and Shayo (2009).2 Charness and Rabin’s functional form also includes a reciprocity parameter,
θ. Since our experiment does not test for reciprocity concerns, we do not con-sider the full version of that utility function.
S. Chakravarty, et al. Journal of Behavioral and Experimental Economics 82 (2019) 101451
2

between Hindus and Muslims. The tension between the two commu-nities is caused in part by India, after partition, being Hindu dominant,as well as the fact there has been a reversal of power relations, asMuslims provided most of the ruling elite a couple of centuries back.The underlying division between the two religious groups has oftenmanifested itself in conflict and violence in regular intervals, with over7000 deaths between 1950 and 2000 (Mitra & Ray, 2013). Such regularconflicts suggest that the religious differences are socially entrenched inIndia.
Bengal has been politically divided twice on religious (Hindu-Muslim) lines, both in 1905 and in 1947.3 Both partitions causedsignificant involuntary human displacements, with Muslims mi-grating to East Bengal (East Pakistan or Bangladesh at present) andHindus moving in the other direction to West Bengal.4 There havealso been major violent incidents attributed to religious conflict be-tween Hindus and Muslims after 1947 (Akbar, 2003; Brass, 2003).The violence and religious tension between the two groups has con-tinued in the state as seen recently in the riots in Canning in 2013 andDeganga in 2010.
According to the Census of India 2001, 80.5% of the total Indianpopulation is Hindu and 13.4% is Muslim. The Muslims are the majorityin the states of Lakshadweep and Jammu & Kashmir. The percentage ofMuslims is sizeable in Assam (30.9%), West Bengal (25.2%), Kerala(24.7%), Uttar Pradesh (18.5%) and Bihar (16.5%). In West Bengal, thestate in which we conduct our study, 5 districts have significant Muslimpopulation, two of which are Murshidabad and Burdawan (the districtsin which we carry out our experiments). In West Bengal there are64.63% Hindus and 33.45% Muslims in rural areas and there are 85.26Hindus and 13.24% Muslims in urban areas.
John and Mutaktar (2005) document that economic and socialindicators are marginally worse for the Muslims in India. In ruralareas there is a marginal difference in poverty ratios between Mus-lims and Hindus in India, but difference is more significant in urbanareas. The authors estimate marginal per capita expenditure index forMuslims (Hindu = 100) for across India is 96.3; in West Bengal it is86.63 in rural areas and 90.54 in urban areas. According to headcount data on poverty, 36.96% Muslims are counted as poor and28.7% Hindus are poor in rural West Bengal. In West Bengal, 31.7%are poor, while the India-wide rate of poverty is 27.02%. The Hindu-Muslim literacy gap in rural West Bengal is 11.2% (Hindus 66.8% andMuslims 55.6%) and in urban West Bengal it is 17.5% (Hindus 83%,and Muslims 66%).
3. Experimental design and procedures
3.1. Experimental design and village selection
To study the effect of religious fragmentation on social preferences,we sampled our participants from three different types of villages,based on their religious composition: “Homogeneous - Muslim” and“Homogenous - Hindu” villages, where 90% or more of the village’spopulation was of one religion, and “Fragmented” villages, where nomore than 60% of the village’s population was of one religion. Village-level data on religious composition is not publicly available data — theIndian Census data only provides religious composition data at thedistrict level. To circumvent this problem, we selected our villagesbased on data from Das, Kar, and Kayal (2011), who conducted a large-
scale household survey on the effects of religious fragmentation in WestBengal villages.5
In order for this quasi-experimental design to be valid, we requirevillage composition to be exogenous. If people self-select into differentvillages on the basis of their religious breakdown, we would not be ableto identify the causal mechanism between fragmentation and beha-viour. In India, rural-rural migration is predominantly due to marriage,whereby women move to their husband’s village; other motives includefamily reasons, employment and education (Bhattacharya, 2000). All ofthese motives are uncorrelated with a village’s religious composition.About 70% of our participants reported having been born in the villageand/or their father and grandfather being born in the village. Anotherpotential concern with using a quasi-experimental design is that theparticipant sample systematically differs on the basis of the type ofvillage (i.e. homogeneous vs. fragmented) we sampled. We are con-fident that this is not the case on the basis of data on observablecharacteristics we collected from participants, including gender, age,caste, profession, marital status, place of birth, land ownership andliteracy — see Table 4. We are therefore confident that our assumptionabout the exogeneity of villages’ religious composition holds.
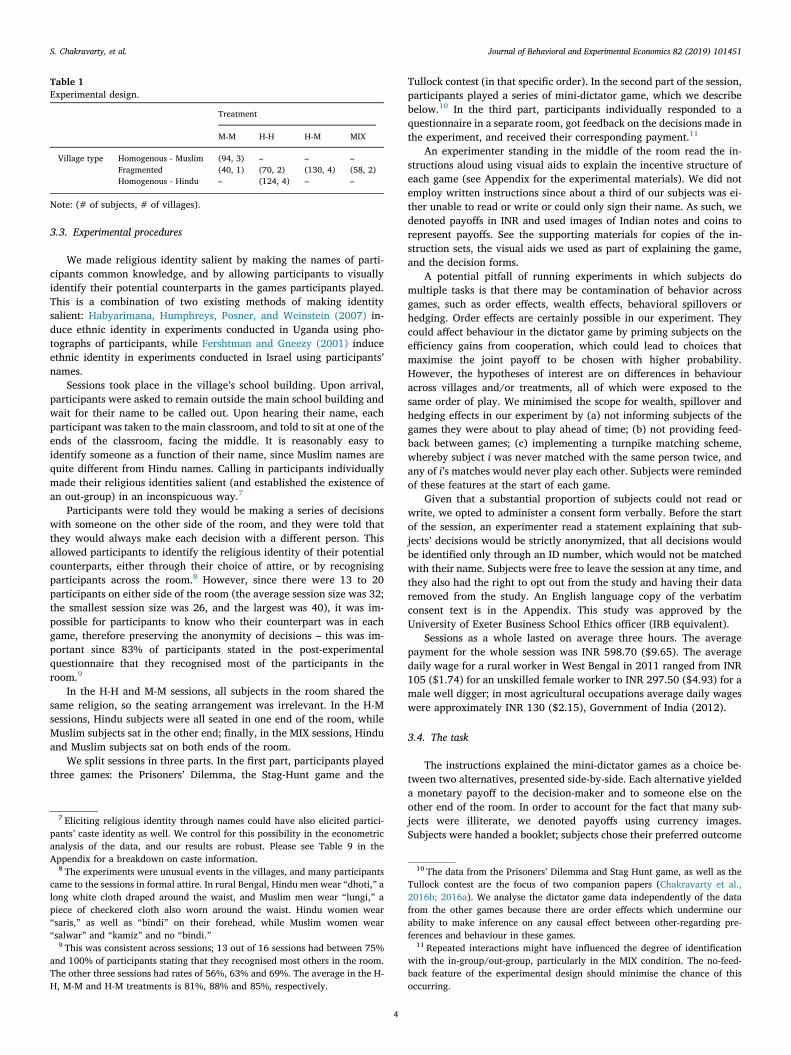
In the fragmented villages, we conducted four different types oftreatments, each of which refers to a matching protocol. The M-M(i.e. Muslim-Muslim) treatment consisted of sessions in which allparticipants were Muslim. Likewise, the H-H (i.e. Hindu-Hindu)treatment was such that the only participants were Hindu. The H-M(i.e. Hindu-Muslim) treatment consisted of sessions in which half ofthe participants were Hindu and the other half were Muslim, andparticipants knew they were playing someone from another religion.Finally, the MIX treatment consisted of sessions with both Hindu andMuslim participants, but where the religious identity of their matchwas uncertain. We elaborate on how we accomplished this when wedescribe the experimental procedures below. In the homogeneousvillages we conducted only H-H or M-M sessions, the religious com-position of these villages meant in most cases there were very few orno residents of the other religious group. Table 1 describes the ex-perimental design.
3.2. Participant recruitment
We employed a mixed-gender, mixed-religion team of local researchassistants to recruit participants and conduct the sessions, so as tominimise any possible experimenter demand effect. A week ahead of aplanned session, our research assistants travelled to the village wherethat session would take place. A set of neighbourhoods were randomlyselected, and within each neighbourhood, recruitment was done on adoor-by-door basis. On a given street, every two consecutive houseswere skipped and the third house would be approached and those whoagreed to participate would be signed up. Participants were remindedabout the session the day before it took place. Participants did not knowthe purpose of the experiment: when approached, they were informedthat the research team would be conducting decision-making sessions.We conducted one session per village.6
3 The first partition of Bengal along Hindu-Muslim lines was during theBritish rule in 1905; the second partition of Bengal into West Bengal and EastPakistan (now Bangladesh) took place in 1947, when the modern Indian statewas formed.4 An estimate of migration in Bengal during 1947, notes that around 6.31% of
the local population migrated to East Bengal and 8.47% migrated to WestBengal (Bharadwaj, Khawaja, & Mian, 2008).
5 The village selection was further restricted by whether or not a given villagewould have an appropriate building for the running of sessions — we opted forvillages that had a primary school. The villages that fit our demographic cri-teria, had a primary school, and whose local authority would allow us to use itwere the following: Alampur, Bhurkunda, Char Mathurapur, Chupi, Domohani,Ganfulia, Gokarno, Hasanpur, Jhikra, Kanakpara, Kirtipur, Pilsowa, Roshanpur,Shuhari, Sridharpur and Tungi.6 After the first session in the first village, it was clear that participants dis-
cussed the experiments among their social network. Due to a combination of thenovelty factor and the generous incentive payments, the sessions themselvesraised interest among villagers in the hours after the sessions ended, thereforecontaminating the pool of potential participants in that village.
S. Chakravarty, et al. Journal of Behavioral and Experimental Economics 82 (2019) 101451
3
3.3. Experimental procedures
We made religious identity salient by making the names of parti-cipants common knowledge, and by allowing participants to visuallyidentify their potential counterparts in the games participants played.This is a combination of two existing methods of making identitysalient: Habyarimana, Humphreys, Posner, and Weinstein (2007) in-duce ethnic identity in experiments conducted in Uganda using pho-tographs of participants, while Fershtman and Gneezy (2001) induceethnic identity in experiments conducted in Israel using participants’names.
Sessions took place in the village’s school building. Upon arrival,participants were asked to remain outside the main school building andwait for their name to be called out. Upon hearing their name, eachparticipant was taken to the main classroom, and told to sit at one of theends of the classroom, facing the middle. It is reasonably easy toidentify someone as a function of their name, since Muslim names arequite different from Hindu names. Calling in participants individuallymade their religious identities salient (and established the existence ofan out-group) in an inconspicuous way.7
Participants were told they would be making a series of decisionswith someone on the other side of the room, and they were told thatthey would always make each decision with a different person. Thisallowed participants to identify the religious identity of their potentialcounterparts, either through their choice of attire, or by recognisingparticipants across the room.8 However, since there were 13 to 20participants on either side of the room (the average session size was 32;the smallest session size was 26, and the largest was 40), it was im-possible for participants to know who their counterpart was in eachgame, therefore preserving the anonymity of decisions – this was im-portant since 83% of participants stated in the post-experimentalquestionnaire that they recognised most of the participants in theroom.9
In the H-H and M-M sessions, all subjects in the room shared thesame religion, so the seating arrangement was irrelevant. In the H-Msessions, Hindu subjects were all seated in one end of the room, whileMuslim subjects sat in the other end; finally, in the MIX sessions, Hinduand Muslim subjects sat on both ends of the room.
We split sessions in three parts. In the first part, participants playedthree games: the Prisoners’ Dilemma, the Stag-Hunt game and the
Tullock contest (in that specific order). In the second part of the session,participants played a series of mini-dictator game, which we describebelow.10 In the third part, participants individually responded to aquestionnaire in a separate room, got feedback on the decisions made inthe experiment, and received their corresponding payment.11
An experimenter standing in the middle of the room read the in-structions aloud using visual aids to explain the incentive structure ofeach game (see Appendix for the experimental materials). We did notemploy written instructions since about a third of our subjects was ei-ther unable to read or write or could only sign their name. As such, wedenoted payoffs in INR and used images of Indian notes and coins torepresent payoffs. See the supporting materials for copies of the in-struction sets, the visual aids we used as part of explaining the game,and the decision forms.
A potential pitfall of running experiments in which subjects domultiple tasks is that there may be contamination of behavior acrossgames, such as order effects, wealth effects, behavioral spillovers orhedging. Order effects are certainly possible in our experiment. Theycould affect behaviour in the dictator game by priming subjects on theefficiency gains from cooperation, which could lead to choices thatmaximise the joint payoff to be chosen with higher probability.However, the hypotheses of interest are on differences in behaviouracross villages and/or treatments, all of which were exposed to thesame order of play. We minimised the scope for wealth, spillover andhedging effects in our experiment by (a) not informing subjects of thegames they were about to play ahead of time; (b) not providing feed-back between games; (c) implementing a turnpike matching scheme,whereby subject i was never matched with the same person twice, andany of i’s matches would never play each other. Subjects were remindedof these features at the start of each game.
Given that a substantial proportion of subjects could not read orwrite, we opted to administer a consent form verbally. Before the startof the session, an experimenter read a statement explaining that sub-jects’ decisions would be strictly anonymized, that all decisions wouldbe identified only through an ID number, which would not be matchedwith their name. Subjects were free to leave the session at any time, andthey also had the right to opt out from the study and having their dataremoved from the study. An English language copy of the verbatimconsent text is in the Appendix. This study was approved by theUniversity of Exeter Business School Ethics officer (IRB equivalent).
Sessions as a whole lasted on average three hours. The averagepayment for the whole session was INR 598.70 ($9.65). The averagedaily wage for a rural worker in West Bengal in 2011 ranged from INR105 ($1.74) for an unskilled female worker to INR 297.50 ($4.93) for amale well digger; in most agricultural occupations average daily wageswere approximately INR 130 ($2.15), Government of India (2012).
3.4. The task
The instructions explained the mini-dictator games as a choice be-tween two alternatives, presented side-by-side. Each alternative yieldeda monetary payoff to the decision-maker and to someone else on theother end of the room. In order to account for the fact that many sub-jects were illiterate, we denoted payoffs using currency images.Subjects were handed a booklet; subjects chose their preferred outcome
Table 1Experimental design.
Treatment
M-M H-H H-M MIX
Village type Homogenous - Muslim (94, 3) – – –Fragmented (40, 1) (70, 2) (130, 4) (58, 2)Homogenous - Hindu – (124, 4) – –
Note: (# of subjects, # of villages).
7 Eliciting religious identity through names could have also elicited partici-pants’ caste identity as well. We control for this possibility in the econometricanalysis of the data, and our results are robust. Please see Table 9 in theAppendix for a breakdown on caste information.8 The experiments were unusual events in the villages, and many participants
came to the sessions in formal attire. In rural Bengal, Hindu men wear “dhoti,” along white cloth draped around the waist, and Muslim men wear “lungi,” apiece of checkered cloth also worn around the waist. Hindu women wear“saris,” as well as “bindi” on their forehead, while Muslim women wear“salwar” and “kamiz” and no “bindi.”9 This was consistent across sessions; 13 out of 16 sessions had between 75%
and 100% of participants stating that they recognised most others in the room.The other three sessions had rates of 56%, 63% and 69%. The average in the H-H, M-M and H-M treatments is 81%, 88% and 85%, respectively.
10 The data from the Prisoners’ Dilemma and Stag Hunt game, as well as theTullock contest are the focus of two companion papers (Chakravarty et al.,2016b; 2016a). We analyse the dictator game data independently of the datafrom the other games because there are order effects which undermine ourability to make inference on any causal effect between other-regarding pre-ferences and behaviour in these games.11 Repeated interactions might have influenced the degree of identification
with the in-group/out-group, particularly in the MIX condition. The no-feed-back feature of the experimental design should minimise the chance of thisoccurring.
S. Chakravarty, et al. Journal of Behavioral and Experimental Economics 82 (2019) 101451
4
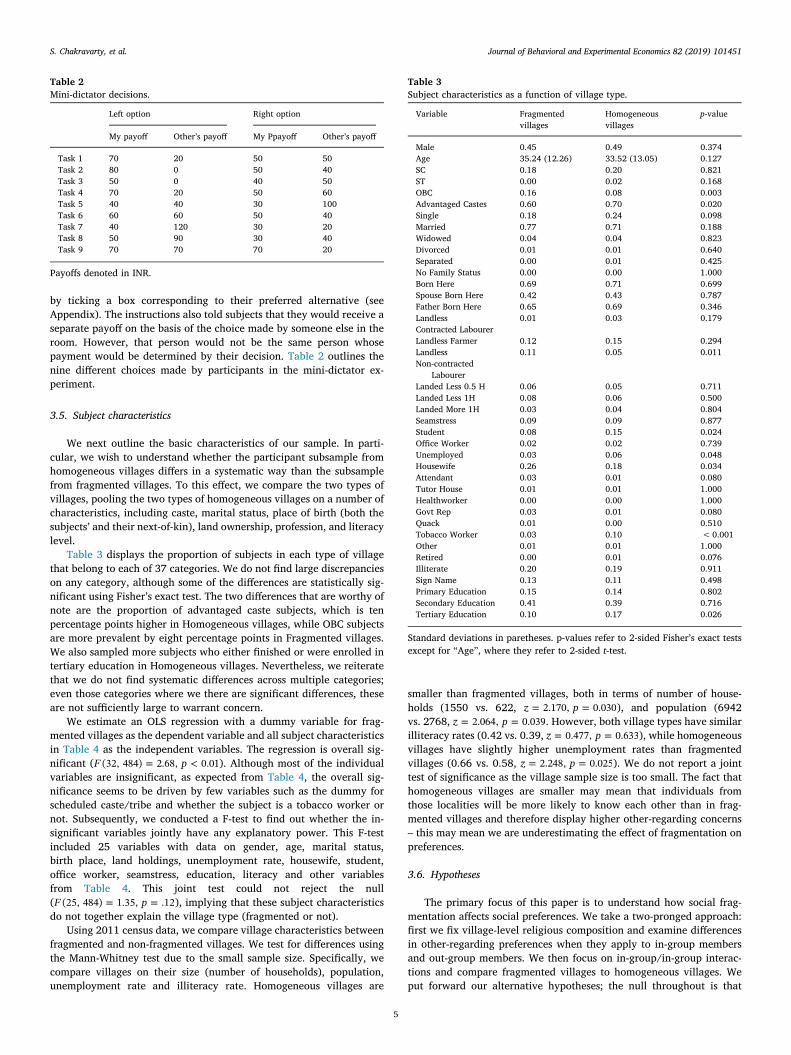
by ticking a box corresponding to their preferred alternative (seeAppendix). The instructions also told subjects that they would receive aseparate payoff on the basis of the choice made by someone else in theroom. However, that person would not be the same person whosepayment would be determined by their decision. Table 2 outlines thenine different choices made by participants in the mini-dictator ex-periment.
3.5. Subject characteristics
We next outline the basic characteristics of our sample. In parti-cular, we wish to understand whether the participant subsample fromhomogeneous villages differs in a systematic way than the subsamplefrom fragmented villages. To this effect, we compare the two types ofvillages, pooling the two types of homogeneous villages on a number ofcharacteristics, including caste, marital status, place of birth (both thesubjects’ and their next-of-kin), land ownership, profession, and literacylevel.
Table 3 displays the proportion of subjects in each type of villagethat belong to each of 37 categories. We do not find large discrepancieson any category, although some of the differences are statistically sig-nificant using Fisher’s exact test. The two differences that are worthy ofnote are the proportion of advantaged caste subjects, which is tenpercentage points higher in Homogeneous villages, while OBC subjectsare more prevalent by eight percentage points in Fragmented villages.We also sampled more subjects who either finished or were enrolled intertiary education in Homogeneous villages. Nevertheless, we reiteratethat we do not find systematic differences across multiple categories;even those categories where we there are significant differences, theseare not sufficiently large to warrant concern.
We estimate an OLS regression with a dummy variable for frag-mented villages as the dependent variable and all subject characteristicsin Table 4 as the independent variables. The regression is overall sig-nificant ( = <F p(32, 484) 2.68, 0.01). Although most of the individualvariables are insignificant, as expected from Table 4, the overall sig-nificance seems to be driven by few variables such as the dummy forscheduled caste/tribe and whether the subject is a tobacco worker ornot. Subsequently, we conducted a F-test to find out whether the in-significant variables jointly have any explanatory power. This F-testincluded 25 variables with data on gender, age, marital status,birth place, land holdings, unemployment rate, housewife, student,office worker, seamstress, education, literacy and other variablesfrom Table 4. This joint test could not reject the null( = =F p(25, 484) 1.35, .12), implying that these subject characteristicsdo not together explain the village type (fragmented or not).
Using 2011 census data, we compare village characteristics betweenfragmented and non-fragmented villages. We test for differences usingthe Mann-Whitney test due to the small sample size. Specifically, wecompare villages on their size (number of households), population,unemployment rate and illiteracy rate. Homogeneous villages are
smaller than fragmented villages, both in terms of number of house-holds (1550 vs. 622, = =z p2.170, 0.030), and population (6942vs. 2768, = =z p2.064, 0.039. However, both village types have similarilliteracy rates (0.42 vs. 0.39, = =z p0.477, 0.633), while homogeneousvillages have slightly higher unemployment rates than fragmentedvillages (0.66 vs. 0.58, = =z p2.248, 0.025). We do not report a jointtest of significance as the village sample size is too small. The fact thathomogeneous villages are smaller may mean that individuals fromthose localities will be more likely to know each other than in frag-mented villages and therefore display higher other-regarding concerns– this may mean we are underestimating the effect of fragmentation onpreferences.
3.6. Hypotheses
The primary focus of this paper is to understand how social frag-mentation affects social preferences. We take a two-pronged approach:first we fix village-level religious composition and examine differencesin other-regarding preferences when they apply to in-group membersand out-group members. We then focus on in-group/in-group interac-tions and compare fragmented villages to homogeneous villages. Weput forward our alternative hypotheses; the null throughout is that
Table 2Mini-dictator decisions.
Left option Right option
My payoff Other’s payoff My Ppayoff Other’s payoff
Task 1 70 20 50 50Task 2 80 0 50 40Task 3 50 0 40 50Task 4 70 20 50 60Task 5 40 40 30 100Task 6 60 60 50 40Task 7 40 120 30 20Task 8 50 90 30 40Task 9 70 70 70 20
Payoffs denoted in INR.
Table 3Subject characteristics as a function of village type.
Variable Fragmentedvillages
Homogeneousvillages
p-value
Male 0.45 0.49 0.374Age 35.24 (12.26) 33.52 (13.05) 0.127SC 0.18 0.20 0.821ST 0.00 0.02 0.168OBC 0.16 0.08 0.003Advantaged Castes 0.60 0.70 0.020Single 0.18 0.24 0.098Married 0.77 0.71 0.188Widowed 0.04 0.04 0.823Divorced 0.01 0.01 0.640Separated 0.00 0.01 0.425No Family Status 0.00 0.00 1.000Born Here 0.69 0.71 0.699Spouse Born Here 0.42 0.43 0.787Father Born Here 0.65 0.69 0.346Landless 0.01 0.03 0.179Contracted LabourerLandless Farmer 0.12 0.15 0.294Landless 0.11 0.05 0.011Non-contracted
LabourerLanded Less 0.5 H 0.06 0.05 0.711Landed Less 1H 0.08 0.06 0.500Landed More 1H 0.03 0.04 0.804Seamstress 0.09 0.09 0.877Student 0.08 0.15 0.024Office Worker 0.02 0.02 0.739Unemployed 0.03 0.06 0.048Housewife 0.26 0.18 0.034Attendant 0.03 0.01 0.080Tutor House 0.01 0.01 1.000Healthworker 0.00 0.00 1.000Govt Rep 0.03 0.01 0.080Quack 0.01 0.00 0.510Tobacco Worker 0.03 0.10 <0.001Other 0.01 0.01 1.000Retired 0.00 0.01 0.076Illiterate 0.20 0.19 0.911Sign Name 0.13 0.11 0.498Primary Education 0.15 0.14 0.802Secondary Education 0.41 0.39 0.716Tertiary Education 0.10 0.17 0.026
Standard deviations in paretheses. p-values refer to 2-sided Fisher’s exact testsexcept for “Age”, where they refer to 2-sided t-test.
S. Chakravarty, et al. Journal of Behavioral and Experimental Economics 82 (2019) 101451
5

social identity and village fragmentation will have no impact on be-havior.
Our first hypothesis comes from the literature reviewed earlier inthe paper, from both social psychology and experimental economics,which postulates that individuals exhibit a bias in their concerns for thewelfare for their fellow in-group members. To test this hypothesis, wecompare treatments (within fragmented villages) where the likelihoodof being matched to an in-group member is 100% (i.e. H-H or M-M) totreatments where that likelihood is either 50% (MIX) or 0% (H-M).
Hypothesis 1. In fragmented villages, the estimated ρ and σ willincrease in the probability of facing an out-group member.
We now turn to the effect of fragmentation, and the possible rolesocial identity plays in determining behaviour. Brewer (1991) theorizesthat in-group identification is a function of two competing needs. Onthe one hand, individuals have a need for inclusion: an isolated in-dividual would seek to identify herself with a collective. On the otherhand, people require a degree of distinctiveness: members of very large
Table 4Village characteristics as a function of village type.
Village Village type No. of nouseholds Population Illiteracy Unemployment
Bhurkunda Homogeneous 512 2539 0.43 0.54Chupi Homogeneous 1596 7159 0.36 0.65Hasanpur Homogeneous 893 3942 0.44 0.68Kanakpara Homogeneous 303 1262 0.29 0.62Roshanpur Homogeneous 482 2191 0.34 0.53Shuhari Homogeneous 329 1319 0.41 0.53Sridharpur Homogeneous 240 964 0.46 0.49Alampur Fragmented 955 4206 0.32 0.55Domohani Fragmented 2603 12,480 0.35 0.65Ganfulia Fragmented 1179 5150 0.39 0.65Gokarno Fragmented 3720 16,198 0.42 0.68Jhikra Fragmented 913 3837 0.58 0.68Kirtipur Fragmented 765 3098 0.48 0.69Mathurapur Fragmented 1392 7112 0.44 0.72Pilsowa Fragmented 323 1274 0.40 0.61Tungi Fragmented 2103 9128 0.41 0.68
Fig. 1. Relative frequency of left option choices conditional on treatment in Fragmented Villages.
S. Chakravarty, et al. Journal of Behavioral and Experimental Economics 82 (2019) 101451
6
groups may search for alternative identities through which they canaffirm their uniqueness. It follows that subjects’ sense of religiousidentity should be less salient in villages where their own religiondominates: individuals ought to identify with groups which providethem with a better sense of uniqueness. In contrast, the salience of re-ligious identity should be strongest in fragmented villages, since notonly there is an out-group to provide a comparison, but also becauseboth religious groups are equally numerous within the village. Existinglab evidence supports this argument: Eckel and Grossman (2005) andCharness et al. (2007) show in a laboratory setting that inducing groupidentity is only effective if that identity is sufficiently salient. In otherwords, group identity should be most salient in diverse villages, asopposed to homogeneous ones.
Hypothesis 2. The estimated ρ and σ should be larger in absolute valuein fragmented villages than in homogeneous villages in both H-H andM-M treatments.
An important caveat is warranted with regards to the final hy-pothesis and our ability to test it. Village residency and religiouscomposition are not randomly and exogenously assigned. Althoughrural-rural migration patterns are not a function of religious composi-tion (Bhattacharya, 2000), it is possible that different villages haveevolved with different customs and norms, and that those normsmanifest themselves in different behavior in our experiment. Wetherefore cannot offer a causal explanation for behavior in the eventthat the data supports our second hypothesis; we can only offer a highlyplausible explanation, based on social identity theory.
We conclude this section with a remark about the two religiousgroups that we are studying in this paper. Our model has nothing to sayabout comparisons of behavior across groups. That is to say, we do nothave any a priori hypothesis about how other-regarding Muslims arerelative to Hindus, and how that relationship changes as a function offragmentation. All our hypotheses relate to the behavior of members ofone group, fixing village type and changing the identity of the otherplayer; or fixing the identity of the other player and changing the vil-lage type. Perhaps our data might be useful to scholars interested incultural differences in behavior; those questions, however, are clearlybeyond the scope of the present paper.
4. Results
4.1. Econometric specification
We use a mixed-effects logit model to estimate the latent utilityparameters in Eq. (3).12 Hence, we account for the unobserved individualheterogeneity which might affect the decision across observations perindividual. We report results from separate regressions run on the religioussub-samples in each of the treatments separately, to facilitate the exposi-tion of the results. To perform hypothesis tests on differences in para-meters across different treatments, we ran a series of regressions using thewhole data set, where we interacted the ρ, σ parameters with treatmentdummies. The output from the pooled regressions is in Appendix A. Wealso report q-values in the pooled regression output since we are testingmultiple hypothesis using these parameters. The q-values seem to bereasonably small to mitigate any concerns due to false positives.
The utility of an individual i from choosing option =k L R{ , } in agame n is given by,
= + + + + +U r s( ) ( ) ,ink k
ink
g
ginL
jnR
g
gjnL
inL
i ink
0
(3)
where ρ and σ capture player i’s attitude towards inequality when she isbetter/worse off than her counterpart. While β measures the selfishnessmotive, k
0 captures the (payoff-independent) latent utility of choosingk. ηi controls for the random effects which allows us to capture theplayer specific unobserved correlation across all the games. in
k is as-sumed to be Type 1 i.i.d. error.
Since the left option in all choices gave the decision-maker (weakly)higher payoffs than the right option —which was a feature of the designby Charness and Rabin (2002)— the idiosyncratic utility from choosingleft ( k
0 ) and the selfishness motive (β) are jointly determining pre-ferences for the left option without regard for the other individual’swelfare. Therefore, for ease of comparison among treatments, we onlykeep the intercept term. Also, the mixed effects logit model combines
+i ink into a single random error ,in
k which gives us the followingspecification,
= + + +U r s( ) ( ) ,ink k
g
ginL
jnR
g
gjnL
inL
ink
0(4)
We assume that the binary response variable yin, takes value 1 if player ichooses L i.e. >U U( 0)in
LinR . We estimate the following mixed effects
logistic regression,
= = +Pr y x x( 1| , ) ( ( , , ) ),in in i in i (5)
where i=1, ...,N are clusters (= number of players) where each clustercontains 9 observations. Λ is the logistic cumulative distribution func-tion. The function xin(β, ρ, σ) can be represented as,
= +
+
x r r
s s
( , , ) ( ) [( ) ( ) ]
[( ) ( ) ]i
L Rg
ginL
jnL
L inR
jnR
R
gg
jnL
inL
L jnR
inR
R
0 0
(6)
4.2. In-Group/out-group differences in preferences in Fragmented Villages
We start by providing summary statistics on behavior in each of themini-dictator games. These summary statistics are not the basis for anyhypothesis; they simply provide an illustration of behavior game-by-game. We see marked differences in behavior in tasks 1–3, in which theleft option implies a favourable division of the pie which results in largeincome inequality, and in which the right option gives a more egali-tarian split of the pie, which also maximizes the total pie size. In thesethree mini-dictator games, the fraction of own-payoff maximizingchoices is smallest in the H-H/M-M treatments, and it increases with theprobability of the other player being an out-group member. The othersix games put forward different trade-offs between equality and effi-ciency, but there is no clear pattern to be discerned on the aggregatelevel (Fig. 1). To test Hypothesis 1, we estimate the model in Eq. (4)using data from fragmented villages only. Table 5 presents results fromthe econometric analysis of treatment effects on preferences. We startwith the Muslim sample. The estimated ρ coefficient is lowest(i.e. greatest advantageous inequality aversion) in the M-M condition(M-M < MIX: z = 3.22, p < 0.01; M-M < H-M: z = 3.98,p < 0.01); however, we find no difference between MIX and H-M(z = 0.67, p = 0.51). A similar pattern applies to the estimated σcoefficients, although the absolute differences in estimated coefficientsin M-M and the other two treatments are smaller and we find no sig-nificant differences. (M-M = MIX: z = 1.01, p = 0.315 ; M-M = H-M:0.47, p = 0.64; MIX = H-M: z = 0.91, p = 0.36).
In the Hindu sample, we observe a negative and significant coeffi-cient on ρ in the H−H case, which is significantly smaller to the esti-mated ρ coefficients in the MIX and H-M conditions (H-H < MIX:z = 5.80, p < 0.01; H-H < H-M: z = 6.95, p < 0.01). The ρ coef-ficients in the MIX treatment is only marginally significantly differentfrom zero (z = 1.82, p = 0.07). The coefficient on ρ in the H-M con-dition is not significantly different from zero; the latter two coefficientsare also not significantly different from each other (MIX = H-M:z = 0.91, p = 0.36). In the case of the σ coefficient, we only find a
12 Both Logit and Probit models give similar results. We also tried to use arandom coefficient utility model to account for individual heterogeneity, butour panel wasn’t big enough to obtain stable parameter estimates.
S. Chakravarty, et al. Journal of Behavioral and Experimental Economics 82 (2019) 101451
7

marginally significant coefficient on H-M (z = 1.83, p = 0.07).
Observation 1. Muslims’ and Hindus’ aversion to advantageousinequality declines as the probability of facing an out-group memberincreases. We find no evidence of aversion to disadvantageousinequality on either religious sample.
4.3. Village-level fragmentation and the salience of social identity
We again start by examining aggregate choices for each of the nine
games. Again, the most salient differences come from the first threemini-dictator games (first row in Fig. 2. This time, the proportion of“selfish” left choices is smaller in fragmented villages than in homo-geneous villages in all the three cases and for both religious groups. Inthe other six games, there differences between village types are lessaccentuated.
We now formally test Hypothesis 2, which states that fragmentationalong religious lines should make religious identities more salient andtherefore the effect of group membership on preferences stronger.Table 6 displays the results of estimating Eq. (2) on the M-M and H-H
Table 5Estimated , and coefficients as a function of recipient’s identity in fragmented villages.
Muslim sample Hindu sample
(1) (2) (3) (4) (5) (6)M-M Mixed H-M H-H Mixed H-M
ρ ***0. 0202 **0. 0110 **0. 0075 ***0. 0223 0. 0066* −0.0030(0.0040) (0.0047) (0.0029) (0.0029) (0.0038) (0.0030)
σ −0.0035 0.0018 0.0033 0.0010 0.0014 0.0060*(0.0036) (0.0047) (0.0029) (0.0026) (0.0038) (0.0031)
β 0.5720 1.2560⁎⁎⁎ 0.7280⁎⁎ 0.7350⁎⁎⁎ 0.7960⁎⁎⁎ 0.3300(0.3510) (0.4300) (0.2850) (0.1840) (0.2610) (0.3350)
Variance 3.7750⁎⁎⁎ 3.307⁎⁎ 4.1620⁎⁎⁎ 1.4450⁎⁎⁎ 1.314⁎⁎ 6.795⁎⁎⁎
(1.4420) (1.6680) (1.2900) (0.4410) (0.6330) (2.2270)N 360 234 585 630 288 585Individuals 40 26 65 70 32 65
Standard errors in parentheses. ⁎⁎⁎: p<0.01; ⁎⁎: p<0.05; *: p<0.10.
Fig. 2. Relative frequency of left option choices conditional on treatment in Fragmented and Homogeneous Villages.
S. Chakravarty, et al. Journal of Behavioral and Experimental Economics 82 (2019) 101451
8

treatments in homogeneous and fragmented villages. Again for clarityof exposition, we present the results from regressions on each of thesub-samples separately. Hypothesis test results are based on a regres-sions that pool both village types for a given religious sample. Theoutput from these regressions is in the Appendix.
We start with the Muslim sample: we do not find a significantlyhigher coefficient on ρ in homogeneous villages than in fragmentedvillages (z = 0.44, p = 0.66); interestingly, we find a small, positiveand marginally significant coefficient on σ in homogeneous villages,while the σ coefficient in fragmented villages is not significant; thedifference between the two is significant (z = 1.91, p = 0.06). In theHindu sample, we do not find that the ρ coefficient in homogeneousvillages is significantly higher than in fragmented villages (z = 0.35,p = 0.72). We however find that the σ coefficient in homogeneousvillages is negative and significant, and significantly smaller to that infragmented villages (z = 2.39, p = 0.017).
Observation 4. Village fragmentation has no effect on Muslim andHindu participants’ aversion to advantageous inequality in bothfragmented villages and homogeneous villages. The effect of villagefragmentation on aversion to disadvantageous inequality differs acrossreligious groups.
5. Discussion
In an increasingly globalised world, social fragmentation, be it atthe religious, ethnic or linguistic level, is gaining relevance both at apolitical and social level. It is therefore important for social scientists tobe able to understand the relevance of social identity on preferences. Inthis paper we jointly analyse the effect of religious identity and re-ligious fragmentation on social preferences. While the evidence on so-cial preferences is overwhelming, our understanding of how they areaffected by group membership is limited.
How social preferences work across group memberships is crucial toour understanding of how individuals will value (and support throughtheir votes) different forms of redistribution through taxation.Individuals that exhibit inequality aversion preferences should favourmore redistribution as inequality increases. If their inequality concernsare group specific, this has dramatic implications for how taxationfunds are used. This is particularly so in a country like India: Hindusand Muslims have a history of conflict, which has resulted regularepisodes of inter-religious conflict over the course of recent history.
Our findings are rather surprising. We find evidence of aversion tobeing ahead, which declines as the probability of facing an out-groupmember increases. In contrast we find very little evidence of aversion tobeing behind; we only find some evidence of this for Hindu subjects(and only within-group in homogeneous villages), not Muslim. Thissuggests that income redistribution policies would be widely supported.Interestingly, while inequality-reducing policies would clearly find
support, the lack of evidence for disadvantageous inequality aversionmeans that it is possible that Pareto-improving policies that increaseinequality would also find support, particularly if they affect the out-group (for whom inequality concerns are weakest).
Another key finding is that fragmentation makes the social identityof players salient. This adds credence to Allport (1954)’s account thatsocial identity of individuals becomes more salient in fragmented so-cieties or groups. We find that aversion to advantageous inequalityamong both Muslims and Hindus is much stronger in fragmented vil-lages in comparison to homogenous villages.
An important caveat to these findings is that the magnitude of theestimated parameters is rather small. It is pertinent to place our findingsin the context of the rather large differences in cooperation rates in thePrisoners’ Dilemma reported in our companion paper with the sameparticipants (Chakravarty et al., 2016b). The two pieces of evidencesuggest that the role of identity is perhaps stronger in shaping beliefsabout the behaviour of others, perhaps through the establishment ofnorms of behaviour as suggested by Akerlof and Kranton (2000), orthrough differentiated priors. The latter explanation is certainly a verypromising avenue of research.
Supplementary material
Supplementary material associated with this article can be found, inthe online version, at 10.1016/j.socec.2019.101451.
References
Akbar, M.J., 2003. Riot after riot: Reports on caste and communal violence in India. RoliBooks, New Delhi.
Akerlof, G.A., Kranton, R.E., 2000. Economics and identity. Quarterly Journal ofEconomics 115 (3), 715–753.
Alesina, A., Devleeschauwer, A., Easterly, W., Kurlat, S., Wacziarg, R., 2003.Fractionalization. Journal of Economic Growth 8 (2), 155–194.
Allport, G., 1954. The nature of prejudice. Addison-Wesley, Cambrige, Mass.Basu, K. (2007). Participatory equity, identity, and productivity: Policy implications for
promoting development. Cornell University Center for Analytic Economics WorkingPaper 065. http://ssrn.com/abstract=956080.
Berge, L.I.O., Bjorvatn, K., Galle, S., Miguel, E., Posner, D.N., Tungodden, B., Zhang, K.,2015. How strong are ethnic preferences? (no. w21715). National Bureau ofEconomic Research
Bharadwaj, P., Khawaja, A., Mian, A., 2008. The big march: Migratory flows after thepartition of India. Economic & Political Weekly August 30, 2008
Bhattacharya, P.C., 2000. An analysis of rural-to-rural migration in India. Journal ofInternational Development 12, 655–667.
Brass, P.R., 2003. The production of Hindu-Muslim violence in contemporary India.University of Washington Press, Seattle.
Brewer, M.B., 1991. The social self: On being the same and different at the same time.Personality and Social Psychology Bulletin 17 (5), 475–482.
Brewer, M.B., 1999. The psychology of prejudice: Ingroup love or outgroup hate? Journalof Social Issues 55 (3), 429–444.
Chakravarty, S., Fonseca, M.A., Ghosh, S., Marjit, S., 2016a. Religious fragmentation,social identity and conflict: Evidence from an artefactual field experiment in India.PloS one 11 (10), e0164708.
Chakravarty, S., Fonseca, M.A., Ghosh, S., Marjit, S., 2016b. Religious fragmentation,social identity and cooperation: Evidence from an artefactual field experiment inIndia. European Economic Review 90, 265–279.
Charness, G., Rabin, M., 2002. Understanding social preferences with simple tests. TheQuarterly Journal of Economics 117 (3), 817–869.
Charness, G., Rigotti, L., Rustichini, A., 2007. Individual behavior and group membership.American Economic Review 97 (4), 1340–1352.
Chen, Y., Li, S.X., 2009. Group identity and social preferences. American EconomicReview 99 (1), 431–457.
Chuah, S.H., Hoffmann, R., Ramasamy, B., Tan, J.H.W., 2014. Religion, ethnicity andcooperation: an experimental study. Journal of Economic Psychology 45, 33–43.
Das, K. P., Kar, S., & Kayal, M. (2011). Religious minorities and provision of public goods:Evidence from rural West Bengal. IZA Discussion Paper No. 6154.
Dimick, M., Rueda, D., Stegmueller, D., 2018. Models of other-regarding preferences,inequality, and redistribution. Annual Review of Political Science 21, 441–460.
Easterly, W., Levine, R., 1999. Africa’s growth tragedy: Policies and ethnic divisions.Quarterly Journal of Economics 112 (4), 1203–1250.
Eckel, C.C., Grossman, P.J., 2005. Managing diversity by creating team identity. Journalof Economic Behavior and Organization 58, 371–392.
Fehr, E., Schmidt, K., 1999. A theory of fairness, competition and cooperation. QuarterlyJournal of Economics 114 (3), 817–868.
Fershtman, C., Gneezy, U., 2001. Discrimination in a segmented society: An experimentalapproach. Quarterly Journal of Economics 116 (1), 351–377.
Table 6Estimated , and coefficients within in-group interactions as a function ofvillage type.
Sample Muslim Hindu
Village type Fragmented Homogenous Fragmented Homogenous
ρ ***0. 0202 ***0. 0075 ***0. 0223 ***0. 0109(0.0040) (0.0022) (0.0029) (0.0021)
σ −0.0035 0.0037* 0.0010 ***0. 0055(0.0036) (0.0022) (0.0026) (0.0021)
β 0.5720 0.8300⁎⁎⁎ 0.7350⁎⁎⁎ 1.0610⁎⁎⁎
(0.3510) (0.1430) (0.1840) (0.1740)Variance 3.7750⁎⁎⁎ 1.1020⁎⁎⁎ 1.4450⁎⁎⁎ 2.5470⁎⁎⁎
(1.4420) (0.3050) (0.4410) (0.5580)N 360 864 630 1116Individuals 40 96 70 124
S. Chakravarty, et al. Journal of Behavioral and Experimental Economics 82 (2019) 101451
9

Goette, L., Huffman, D., Meier, S., 2006. The impact of group membership on cooperationand norm enforcement: Evidence using random assignment to real social groups.American Economic Review 96 (2), 212–216.
Habyarimana, J., Humphreys, M., Posner, D.N., Weinstein, J.M., 2007. Why does ethnicdiversity undermine public goods provision? American Political Science Review 101(4), 709–725.
John, R.M., Mutaktar, R., 2005. Statewise estimates of poverty among religious groups inIndia. Economic and Political Weekly 40 (13). 1337+1339–1345
Khwaja, A.I., 2009. Can good projects succeed in bad communities? Journal of PublicEconomics 93 (7), 899–916.
Kranton, R., Pease, M., Sanders, S., Huettel, S., 2016. Groupy and non-groupy behavior:Deconstructing bias in social preferences. Discussion paper, Duke University, mimeo
Miguel, E., Gugerty, M.K., 2005. Ethnic diversity, social sanctions, and public goods inkenya. Journal of Public Economics 89 (11–12), 2325–2368.
Mitra, A., Ray, D., 2013. Implications of an economic theory of conflict: Hindu-muslimviolence in India. Journal of Political Economy 122 (4), 719–765.
Shayo, M., 2009. A model of social identity with an application to political economy:Nation, class, and redistribution. American Political Science Review 103 (02),147–174.
Tajfel, H., Billig, M.G., Bundy, R.P., Flament, C., 1971. Social categorization in intergroupbehavior. European Journal of Social Psychology 1 (2), 149–178.
Tajfel, H., Turner, J.C., 1979. An integrative theory of intergroup conflict. The SocialPsychology of Intergroup Relations 33 (47), 74.
Tajfel, H., Turner, J.C., 1986. The social identity theory of inter group behavior. In:Worchel, S., Austin, W.G. (Eds.), Psychology of intergroup relations. Chicago: Nelson
Turner, J.C., Brown, R.J., 1978. Social status, cognitive alternatives and intergroup re-lations. In: Tajfel, H. (Ed.), Differentiation between social groups. Academic Press,London.
S. Chakravarty, et al. Journal of Behavioral and Experimental Economics 82 (2019) 101451
10