remotely sensed spatial heterogeneity as an exploratory … · · 2018-01-10and functional...
TRANSCRIPT

Contents lists available at ScienceDirect
Ecological Indicators
journal homepage: www.elsevier.com/locate/ecolind
Brief article
Remotely sensed spatial heterogeneity as an exploratory tool for taxonomicand functional diversity study
Duccio Rocchinia,b,c,⁎, Giovanni Bacarod, Gherardo Chiricie, Daniele Da Red, Hannes Feilhauerf,Giles M. Foodyg, Marta Galluzzie, Carol X. Garzon-Lopezh, Thomas W. Gillespiei, Kate S. Hej,Jonathan Lenoirk, Matteo Marcantoniol, Harini Nagendram, Carlo Ricottan, Edvinas Rommelo,Sebastian Schmidtleinp, Andrew K. Skidmoreq,r, Ruben Van De Kerchoves, Martin Wegmannt,Benedetto Ruganiu
a Center Agriculture Food Environment, University of Trento, Via E. Mach 1, 38010 S. Michele all’Adige (TN), Italyb Centre for Integrative Biology, University of Trento, Via Sommarive, 14, 38123 Povo (TN), Italyc Fondazione Edmund Mach, Department of Biodiversity and Molecular Ecology, Research and Innovation Centre, Via E. Mach 1, 38010 S. Michele all’Adige (TN), Italyd Department of Life Sciences, University of Trieste, Via L. Giorgieri 10, 34127 Trieste, Italye geoLAB – Laboratory of Forest Geomatics, Department of Agricultural, Food and Forestry Systems, University of Florence, Via San Bonaventura, 13, 50145 Firenze, Italyf Institute of Geography, University of Erlangen-Nuremberg, Wetterkreuz 15, 91058 Erlangen, GermanygUniversity of Nottingham, University Park, Nottingham NG7 2RD, UKh Ecology and Vegetation Physiology Group (EcoFiv), Universidad de los Andes, Cr. 1E No 18A, Bogotá, Colombiai Department of Geography, University of California Los Angeles, Los Angeles, CA 90095-1524, USAjDepartment of Biological Sciences, Murray State University, Murray, KY 42071, USAkUR “Ecologie et dynamique des systèmes anthropisées” (EDYSAN, FRE3498 CNRS-UPJV), Université de Picardie Jules Verne, 1 Rue des Louvels, 80037 Amiens Cedex 1,Francel Department of Pathology, Microbiology, and Immunology, School of Veterinary Medicine, University of California, Davis, USAmAzim Premji University, PES Institute of Technology Campus, Pixel Park, B Block, Electronics City, Hosur Road, Bangalore 560100, IndianDepartment of Environmental Biology, University of Rome “La Sapienza”, Rome 00185, Italyo Department of Biogeography, BayCEER, University of Bayreuth, Universitaetsstr. 30, 95440 Bayreuth, Germanyp Institute of Geography and Geoecology, Karlsruhe Institute of Technology, Kaiserstr. 12, 76131 Karlsruhe, GermanyqDepartment of Natural Resources, Faculty of Geo-Information Science and Earth Observation (ITC), University of Twente, P.O. Box 217, AE Enschede 7500, TheNetherlandsr Department of Environmental Science, Macquarie University, NSW, 2109, Australias VITO (Flemish Institute for Technological Research), Boeretang 200, 2400 Mol, Belgiumt Department of Remote Sensing, Remote Sensing and Biodiversity Research Group, University of Wuerzburg, Wuerzburg, Germanyu Luxembourg Institute of Science and Technology (LIST), Dept. Environmental Research and Innovation (ERIN), 41 rue du Brill, L-4422 Belvaux, Luxembourg
A R T I C L E I N F O
Keywords:CartogramsFunctional diversityRemote sensingRao's quadratic diversitySatellite imagerySpectral rarefactionTaxonomic diversity
A B S T R A C T
Assessing biodiversity from field-based data is difficult for a number of practical reasons: (i) establishing the totalnumber of sampling units to be investigated and the sampling design (e.g. systematic, random, stratified) can bedifficult; (ii) the choice of the sampling design can affect the results; and (iii) defining the focal population ofinterest can be challenging. Satellite remote sensing is one of the most cost-effective and comprehensive ap-proaches to identify biodiversity hotspots and predict changes in species composition. This is because, in contrastto field-based methods, it allows for complete spatial coverages of the Earth's surface under study over a shortperiod of time. Furthermore, satellite remote sensing provides repeated measures, thus making it possible tostudy temporal changes in biodiversity. While taxonomic diversity measures have long been established, pro-blems arising from abundance related measures have not been yet disentangled. Moreover, little has been doneto account for functional diversity besides taxonomic diversity measures. The aim of this manuscript is topropose robust measures of remotely sensed heterogeneity to perform exploratory analysis for the detection ofhotspots of taxonomic and functional diversity of plant species.
https://doi.org/10.1016/j.ecolind.2017.09.055Received 2 June 2017; Received in revised form 29 September 2017; Accepted 29 September 2017
⁎ Corresponding author at: Center Agriculture Food Environment, University of Trento, Via E. Mach 1, 38010 S. Michele all’Adige (TN), Italy.E-mail address: [email protected] (D. Rocchini).
Ecological Indicators 85 (2018) 983–990
1470-160X/ © 2017 Elsevier Ltd. All rights reserved.
T

1. Introduction
The assessment of biodiversity for a conservation purpose is difficultto undertake via field survey (Palmer, 1995). Species richness is thesimplest, most intuitive and most frequently used measure for char-acterizing the diversity of an assemblage (Chiarucci et al., 2012; Chaoand Chiu, 2016). In nearly all biodiversity studies, however, the com-pilation of complete species census and inventories often requires ex-traordinary efforts and is an almost unattainable goal in practical ap-plications. There are undiscovered species in almost every taxonomicsurvey or species inventory (Palmer, 1995). Consequently, a simplecount of species (observed richness) in a sample underestimates the truespecies richness (observed plus undetected), with the magnitude of thenegative bias possibly substantial. In addition, empirical richnessstrongly depends on sampling effort and thus also depends on samplecompleteness. Statistically sound sampling of biodiversity requiresseveral assumptions to be fulfilled in order to allow reproducibility andcredible estimation. The crucial assumption is a random sampling de-sign, i.e. the random spatial distribution of samples based on standar-dised statistical sampling procedures, which generally hampers rapidsampling mainly due to logistic problems. In fact, complex ecosystemsmight not be systematically surveyed or temporarily monitored byconventional biodiversity surveys because of high costs, challenges toaccess the sampling sites or the lack of historical data (Roy and Tomar,2000).
From this point of view, remote sensing is an efficient tool allowingto cover large areas over a short period of time, hence providing keyinformation on the spatio-temporal variation of biodiversity.
This is overall true (from a biodiversity conservation viewpoint),considering the fact that recent Life Cycle Impact Assessment (LCIA)studies acknowledged the importance of understanding the human in-duced cause–effect mechanisms shaping the decline or improvement ofbiodiversity and thus the provision of biodiversity-related ecosystemservices (Moran et al., 2016).
Recently, Souza et al. (2015) explicitly observed that landscape-oriented approaches to evaluate biodiversity loss in a LCIA context arestill lacking (Scheiner et al., 2000; Dungan et al., 2002). Changing thefocus from individuals to communities, entire ecosystems and biomesmight represent a key concept to a correct and widely usable LCIAmodel.
The aim of this paper is to propose novel approaches using remotesensing to perform exploratory analysis for the detection of hotspots oftaxonomic and functional diversity of plant species. The complete Rcode (R Core Team, 2017) used to implement all the presented algo-rithms is available in Appendix 1.
2. Heterogeneity measurement from remote sensing and therelationship with taxonomic diversity
According to the spectral variation hypothesis (Palmer et al., 2002)the larger the spectral heterogeneity the higher will be the nicheavailability for different organisms to survive. Hence, the higher thespectral variability of an environment the higher might be its biodi-versity. Such a hypothesis has been widely tested with taxonomic data(Rocchini, 2007; Rocchini et al., 2016; Schmeller et al., 2017) and oftenresulted in a positive statistical relationship although the link does notalways hold true (Schmidtlein and Fassnacht, 2017).
The variability over space is generally tested relying on a localcalculation of heterogeneity based on a moving window in a satelliteimage and connecting it to human-related and ecological/geographicaldrivers shaping biodiversity in the field.
For instance, spectral heterogeneity measurements, based on thecalculation of indices of variability of neighboring pixels in an imagehave been recently proposed as a possible solution to support the as-sessment of land use impacts on biodiversity (Rugani and Rocchini,2017). Such approaches might help detecting the geographical locationof hotspots of diversity and their temporal changes in a straightforwardmanner. Fig. 1 shows as an example the Rao's quadratic diversity in twodimensions over the world, theoretically depicted by Rocchini et al.(2017), calculated from Normalized Difference Vegetation Index(hereafter NDVI) based on Moderate Resolution Imaging Spectro-radiometer (MODIS) satellite data. As far as we know, this is the firstapplication of Rao's Q metric to satellite data covering the whole world.The complete R code is available in Appendix 1.
Given a certain number of reflectance values in a portion of a re-motely sensed image (usually a moving window of n × n pixels), suchmetric is defined as the expected difference in reflectance values be-tween two pixels drawn randomly with replacement from the set ofpixels:
∑ ∑= × ×Q d p pi jij (1)
where dij is the spectral distance between pixel i and j and pi is therelative proportion of pixel i (i.e. in a window of n x n pixels pi = 1/n2).The spectral distance dij can be calculated either for a single band or in amultispectral system, thus allowing to consider more than one band at atime (Rocchini et al., 2017). If Q is calculated for a single band, theresulting value can be directly related to the variance of the reflectancevalues within the considered set of pixels, a well-known metric forsummarizing the spatial complexity of remotely sensed images(Rocchini et al., 2010). Rao's Qmetric weights the distance among pixelvalues in a spectral space and their evenness. In practice, higher di-versity in this example is related to the relative distance of NDVIspectral values and to relative evenness in the distribution of such
Fig. 1. Rao's quadratic diversity metric applied to an NDVI map of the world (date 2016-06-06, http://land.copernicus.eu/global/products/ndvi), resampled at 2 km resolution with amoving window of 5 pixels. As far as we know, this is the first application of Rao's Q metric to satellite data covering the whole world. The complete R code is provided in Appendix 1.
D. Rocchini et al. Ecological Indicators 85 (2018) 983–990
984

values.Once applied at large spatial scales, Rao's quadratic diversity might
reveal differences among different countries, areas, habitats or land usetypes to be potentially linked to related ecosystem services.
In this view, the use of cartograms (Fig. 2, Gastner and Newman,2004) can help to show the differences among units (in this case, dif-ferent countries are shown, as an example) in terms of Rao's Q, bydistorting each unit depending on the relative value of the entropyindex reported in Fig. 1 (restricted to Europe in Fig. 2).
Using multitemporal remotely-sensed imagery, such a map mightprove useful to detect abrupt changes, referred to as “catastrophic re-gime shifts”, which can lead to an alteration in the provision of eco-system services, such as water provision (Guttal and Jayaprakash,2009). An example is provided in Fig. 3 in which MODIS tiles (NDVI,16-days product, June, Appendix 1) have been used to calculate Rao's Qat a spatial resolution of 1 km. Care might be taken considering the firstyears after the launch of the Terra MODIS satellite (launched December18th 1999), in which calibration was still in process but provisionaldata were acquired (e.g. year 2000). As pointed out by Rocchini et al.(2017) variations at large spatial scales (large extent) are mainly due tothe variability of climatic conditions, e.g. the high variability at higherlatitudes (Fig. 3a and b), while local scale variability could be related toprocesses like local management practices, urban spread, agriculturalland conversion or disturbance. Rao’s Q applied over multiple dates
(also potentially including different seasons) might help detecting localto global scale changes in heterogeneity. In fact, the approach is genericand applicable to different datasets at all scales, from local to global,and at different resolutions (grain, sensu Dungan et al., 2002). In orderto allow reproducible experiments using the proposed metric, we alsoprovide a multitemporal Rao’s Q diversity set (together with the R dataproject based on the code of Appendix 1) from 2000 to 2016 usingMODIS data with a resampled spatial grain of 5 km (Appendix 2; data athigher resolution are available upon request).
Furthermore, the so-called global disparities and habitat lossesmight be also detected once applying proper diversity measures atglobal spatial scales. Major disparities between habitat loss and con-servation lead some areas of the world to be more sensible to en-vironmental change. In such a case, measuring diversity from satellitescan help to anticipate habitat loss, providing useful tools to furtherimprove management actions (Hoekstra et al., 2005).
The spectral variation approach has been observed to be com-plementary to the current state-of-the-art practice in LCIA of land useon biodiversity, where characterization models are mainly based on theconsideration of species–area relationships (De Schryver et al., 2010; deBaan et al., 2013; Elshout et al., 2014; Chaudhary et al., 2015; Veroneset al., 2015). Assessing spectral heterogeneity seems also a com-plementary approach to the study of (Human Appropriation of) NetPrimary Production ((HA)NPP, Haberl et al., 2014). Indeed, detecting
Fig. 2. Cartograms showing univariate statistics of the Rao's Qmetric in Europe, distorting the shape of units (in this case, as an example, countries) depending on the relative value of theindex. ci = confidence interval at 95%, se = standard error, sd = standard deviation. The free software ScapeToad (https://scapetoad.choros.ch/) was used to generate the cartograms.
D. Rocchini et al. Ecological Indicators 85 (2018) 983–990
985

heterogeneity through the processing of remotely sensed imagery al-lows to capture possible changes associated with plant species diversityloss or gain over time and at various spatial resolutions and extents,while (HA)NPP indicators can provide a quantitative measure of theimpact associated with spatial variability patterns.
In some cases, the heterogeneity measured from space might bedirectly related to human-based processes, like urban spread, whichseem to affect both ecosystem functioning and the provision of eco-system services (Tratalos et al., 2007). As an example, Fig. 4 representsthe number of accumulated spectral values once increasing the extent of
analysis (sampling effort), attained by calculating a rarefaction curveon the spectral values of a Landsat 8 image (pixel resolution = 30 m) inthe Tenerife island (Canary Islands) as in Rocchini et al. (2011). After(i) superimposing a grid of 500 × 500 m on the Landsat 8 image and(ii) extracting the first principal component (Appendix 1), the amountof spectral values accumulated by increasing the extent (number of gridcells) was calculated as:
Fig. 3. Multi spatio-temporal comparison of Rao index on NDVI images:(a) spatial pattern of heterogeneity at European scale and (b) tempor-al–latitude profile of Rao's Q index with an increase of heterogeneity be-tween 60° and 70° (i.e. mainly in the Scandinavian region), principally dueto the variability related to temporary snow cover. Once data on differentphenological seasons are attained, different patterns are also expected.
D. Rocchini et al. Ecological Indicators 85 (2018) 983–990
986

= −∑ −
= ( )( )
E S S
N Nn
Nn
( )iS i
1
(2)
where S= total number of spectral values, Ni = number of grid cells inwhich the spectral value i is found, n = number of randomly chosengrid cells. Reader is referred to Shinozaki (1963) and Kobayashi (1974)
for the original formulation of the rarefaction curve algorithm, and toUgland et al. (2003) and Chiarucci et al. (2008, 2009) for a critique onits application to ecological data (species rarefaction), and further toRocchini et al. (2011) for its application to remote sensing data (spec-tral rarefaction). In this example, human-related land use, mainly re-lated to urban spread, is concentrated in the arid coastal (vegetation)belt at low elevations (Fernandez-Palacios and Nicolás, 1995), leading
Fig. 4. Applying rarefaction techniques to a Landsat 8 image might reveal the diversity of different land use classes which can be related to human-based processes. As an example, inTenerife (a), human-related land use, mainly related to urban spread, is concentrated in the arid coastal (vegetation) belt at low elevations (b). This leads to a higher spectral het-erogeneity caused by a mixed anthropic–natural landscape which is described by a higher number of accumulated spectral values (c).
D. Rocchini et al. Ecological Indicators 85 (2018) 983–990
987
to a higher spectral heterogeneity caused by a mixed anthropic–naturallandscape which is described by a higher number of accumulatedspectral values.
3. The importance of estimating functional diversity
Beside taxonomic diversity, the combination of different traits isgenerally investigated by remote sensing to find indirect measures offunctional diversity from a remote sensing perspective (Schmidtleinet al., 2012; Kattenborn et al., 2017).
The underlying assumption for the use of taxonomic diversity as aproxy of general biodiversity of an area is that the taxa are equallydistinct from one another, disregarding the fact that communities arecomposed by species with different evolutionary history and a diversearray of ecological functions. More recently, the concept of functionaldiversity has received considerable attention because it captures in-formation on species functional traits, which is absent in traditionalmeasures of species diversity (Violle et al., 2007; Bartha, 2008; Lavorelet al., 2008; Ricotta et al., 2014). Functional traits are morphological,physiological, and phenological attributes, which impact individualfitness via their effects on growth, reproduction and survival.
There is an increasing body of literature demonstrating that func-tional diversity tends to correlate more strongly than traditional speciesdiversity with ecosystem functions such as productivity (Loreau, 2000;Petchey et al., 2004; Hooper et al., 2005; Cardoso et al., 2014), resi-lience to perturbations (Moretti and Legg, 2009; Mori et al., 2013), orregulation of biogeochemical fluxes (Waldbusser et al., 2004; Legendreand Rivkin, 2005). Functional diversity might also be a tool for pre-dicting the functional consequences of human-induced biotic change(Ricotta and Bacaro, 2012).
The observed relationships between functional diversity and
ecosystem functioning raise the question of how to measure functionaldiversity in meaningful ways. One of the most established systems forplant functional types is the strategy types proposed by Grime (1974,1977). The CSR plant strategy type system categorizes plants accordingto their abilities to compete for resources (C strategists), tolerate stress(S strategists) and survive disturbance (R strategists), recognizing theinterplay of plant functional types, plant functional traits and ecosystemfunctions (Schweiger et al., 2016).
However, as for species inventories, field measurements of plantfunctional traits are costly, time-consuming and notoriously difficult toacquire, especially in remote areas. In contrast, plant functional typescan be deduced from botanical inventories (releve data) and corre-sponding trait databases, which are more widely available than plantfunctional trait measurement.
Recently, increasing efforts have been devoted in assessing existinglinks between plant species spectral signatures (Asner and Martin,2008) and plant community functional diversity. Imaging spectroscopycould enable modeling and predicting plant functional types at thevegetation community scale with high accuracy and greater consistencythan plant life/growth forms (Schmidtlein et al., 2012; Schweiger et al.,2016; Kattenborn et al., in press). Based on these results, it can be af-firmed that remote sensing methods mainly proposed for estimatingbiodiversity at the taxonomic level could even be related to the varia-tion of community functional characteristics: in other words, thespectral signature of plant functional types is preserved in the vegeta-tion community's spectral response.
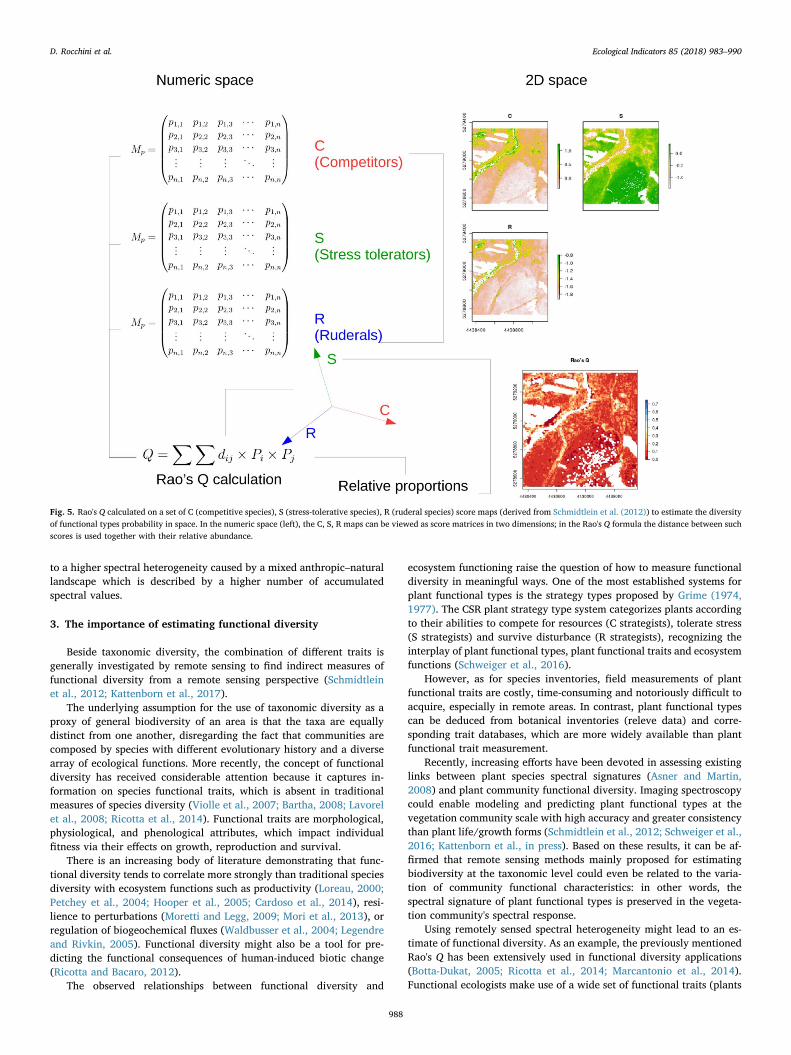
Using remotely sensed spectral heterogeneity might lead to an es-timate of functional diversity. As an example, the previously mentionedRao's Q has been extensively used in functional diversity applications(Botta-Dukat, 2005; Ricotta et al., 2014; Marcantonio et al., 2014).Functional ecologists make use of a wide set of functional traits (plants
Fig. 5. Rao's Q calculated on a set of C (competitive species), S (stress-tolerative species), R (ruderal species) score maps (derived from Schmidtlein et al. (2012)) to estimate the diversityof functional types probability in space. In the numeric space (left), the C, S, R maps can be viewed as score matrices in two dimensions; in the Rao's Q formula the distance between suchscores is used together with their relative abundance.
D. Rocchini et al. Ecological Indicators 85 (2018) 983–990
988

functional characteristics) to assess the diversity of natural systems.Rao's Q has been shown to be a valid candidate to summarize them in asingle diversity value (Botta-Dukat, 2005).
In Fig. 5 we applied the Rao's Q measure to a set of C (competitivespecies), S (stress-tolerative species), R (ruderal species) scores reportedin Schmidtlein et al. (2012). Seeing the probability of a plant species tobelong to a certain functional group as a numeric array, or a 2D matrix,the Rao's Q might be applied to calculate the diversity of functionaltypes probability in space (and time).
4. Conclusion and outlook
When assessing impacts associated with land use, biodiversity lossin terms of species richness and vulnerability is explicitly considered tohave an intrinsic value for the ecosystem quality, while ecosystemservices are reflected to have rather an instrumental value.
However, heterogeneity measurements can only capture spatialvariability at different scales of complexity. Therefore, in the absence offield data it is difficult if not impossible to find the best solution toassess other functional biodiversity related issues, such as vulnerabilityresilience and recoverability of species or ecosystems.
This said, the use of remotely-sensed diversity might prove usefulsince in most cases satellite imagery is directly related to variablesconnected to ecosystem services. As an example, NDVI, which has beenused to measure diversity from space in a number of papers (Gillespie,2005; He and Zhang, 2009) is directly linked to the photosyntheticactivity of the vegetation and thus indirectly to vegetation biomass(Krishnaswamy et al., 2009).
It might be clear that ecosystems biodiversity provides ecosystemservices which also regulate human livelihood, like, as previouslystated, water and carbon cycle regulation or soil erosion prevention. Inthis sense, remote sensing and the analysis of satellite data providespatial models which are crucial for assessing the current (and pre-dicting the future) conditions of habitats (Newton et al., 2009).
Acknowledgments
DR is partially supported by the Life project Future For CoppiceS.
Appendix A. Supplementary data
Supplementary data associated with this article can be found, in theonline version, at https://doi.org/10.1016/j.ecolind.2017.09.055.
References
Asner, G.P., Martin, R.E., 2008. Spectral and chemical analysis of tropical forests: scalingfrom leaf to canopy levels. Remote Sens. Environ. 112, 3958–3970.
Bartha, S., 2008. Beyond trivial relationships: on the hidden aspects of biodiversity. FoliaGeobot. 43, 371–382.
Botta-Dukat, Z., 2005. Rao's quadratic entropy as a measure of functional diversity basedon multiple traits. J. Veg. Sci. 16, 533–540.
Cardoso, P., Rigal, F., Borges, P.A.V., Carvalho, J.C., 2014. A new frontier in biodiversityinventory: a proposal for estimators of phylogenetic and functional diversity.Methods Ecol. Evol. 5, 452–461.
Chao, A., Chiu, C.H., 2016. Species Richness: Estimation and Comparison. Wiley StatsRef:Statistics Reference Online, pp. 1–26.
Chaudhary, A., Verones, F., de Baan, L., Hellweg, S., 2015. Quantifying land use impactson biodiversity: combining species–area models and vulnerability indicators.Environ. Sci. Technol. 49, 9987–9995.
Chiarucci, A., Bacaro, G., Rocchini, D., Fattorini, L., 2008. Discovering and rediscoveringthe rarefaction formula in ecological literature. Community Ecol. 9, 121–123.
Chiarucci, A., Bacaro, G., Rocchini, D., Ricotta, C., Palmer, M.W., Scheiner, S.M., 2009.Spatially constrained rarefaction: incorporating the autocorrelated structure of bio-logical communities in sample-based rarefaction. Community Ecol. 10, 209–214.
Chiarucci, A., Bacaro, G., Scheiner, S.M., 2012. Old and new challenges in using speciesdiversity for assessing biodiversity. Philos. Trans. R. Soc. B: Biol. Sci. 366,2426–2437.
De Schryver, A., Goedkoop, M., Leuven, R.E.W., Huijbregts, M.J., 2010. Uncertainties inthe application of the species area relationship for characterisation factors of landoccupation in life cycle assessment. Int. J. Life Cycle Assess. 15, 682–691.
de Baan, L., Mutel, C.L., Curran, M., Hellweg, S., Koellner, T., 2013. Land use in life cycleassessment: global characterization factors based on regional and global potentialspecies extinction. Environ. Sci. Technol. 47, 9281–9290.
Dungan, J., Perry, J.N., Dale, M., Legendre, P., Citron-Pousty, S., Fortin, M.J.,Jakomulska, A., Miriti, M., Rosenberg, M.S., 2002. A balanced view of scale in spatialstatistical analysis. Ecography 25, 626–640.
Elshout, P.M.F., van Zelm, R., Karuppiah, R., Laurenzi, I.J., Huijbregts, M.A.J., 2014. Aspatially explicit data-driven approach to assess the effect of agricultural land oc-cupation on species groups. Int. J. Life Cycle Assess. 19, 758–769.
Fernandez-Palacios, J.M., Nicolás, J.P., 1995. Altitudinal pattern of vegetation variationon Tenerife. J. Veg. Sci. 6, 183–190.
Gastner, M., Newman, M.E.J., 2004. Diffusion-based method for producing density-qqualizing maps. Proc. Natl. Acad. Sci. U. S. A. 101, 7499–7504.
Gillespie, T.W., 2005. Prospects for quantifying structure, floristic composition and spe-cies richness of tropical forests. Int. J. Remote Sens. 25, 707–715.
Grime, J.P., 1974. Vegetation classification by reference to strategies. Nature 250, 26–31.Grime, J.P., 1977. Evidence for the existence of three primary strategies in plants and its
relevance to ecological and evolutionary theory. Am. Nat. 111, 1169–1194.Guttal, V., Jayaprakash, C., 2009. Spatial variance and spatial skewness: leading in-
dicators of regime shifts in spatial ecological systems. Theor. Ecol. 2, 3–12.Haberl, H., Erb, K.-H., Krausmann, F., 2014. Human appropriation of net primary pro-
duction: patterns, trends, and planetary boundaries. Annu. Rev. Environ. Resour. 39,363–391.
He, K., Zhang, J., 2009. Testing the correlation between beta diversity and differences inproductivity among global ecoregions, biomes, and biogeographical realms. Ecol.Inform. 4, 93–98.
Hoekstra, J., Boucher, T., Ricketts, T., Roberts, C., 2005. Confronting a biome crisis:global disparities of habitat loss and protection. Ecol. Lett. 8, 23–29.
Hooper, D.U., Chapin, F.S., Ewel, J.J., Hector, A., Inchausti, P., Lavorel, S., Lawton, J.H.,Lodge, D.M., Loreau, M., Naeem, S., Schmid, B., Setala, H., Symstad, A.J.,Vandermeer, J., Wardle, D.A., 2005. Effects of biodiversity on ecosystem functioning:a consensus of current knowledge. Ecol. Monogr. 75, 3–35.
Kattenborn, T., Fassnacht, F.E., Pierce, S., Lopatin, J., Grime, J.P., Schmidtlein, S., 2017.Linking plant strategies and plant traits derived by radiative transfer modelling. J.Veg. Sci. 28, 717–727.
Kobayashi, S., 1974. The species–area relation. I. A model for discrete sampling. Res.Popul. Ecol. 15, 223–237.
Krishnaswamy, J., Bawa, K.S., Ganeshaiah, K.N., Kiran, M.C., 2009. Quantifying andmapping biodiversity and ecosystem services: utility of a multi-season NDVI basedMahalanobis distance surrogate. Remote Sens. Environ. 113, 857–867.
Lavorel, S., Grigulis, K., McIntyre, S., Williams, N.S.G., Garden, D., Dorrough, J., Berman,S., Quetier, F., Thebault, A., Bonis, A., 2008. Assessing functional diversity in the field– methodology matters!. Funct. Ecol. 22, 134–147.
Loreau, M., 2000. Biodiversity and ecosystem functioning: recent theoretical advances.Oikos 91, 3–17.
Legendre, L., Rivkin, R.B., 2005. Integrating functional diversity, food web processes, andbiogeochemical carbon fluxes into a conceptual approach for modeling the upperocean in a high-CO2 world. J. Geophys. Res. 110, C09S17.
Marcantonio, M., Rocchini, D., Ottaviani, G., 2014. Impact of alien species on dunesystems: a multifaceted approach. Biodivers. Conserv. 23, 2645–2668.
Moran, D., Petersone, M., Verones, F., 2016. On the suitability of input–output analysisfor calculating product-specific biodiversity footprints. Ecol. Indic. 60, 192–201.
Moretti, M., Legg, C., 2009. Combining plant and animal traits to assess communityfunctional responses to disturbance. Ecography 32, 299–309.
Mori, A.S., Furukawa, T., Sasaki, T., 2013. Response diversity determines the resilience ofecosystems to environmental change. Biol. Rev. 88, 349–364.
Newton, A., Hill, R., Echeverria, C., Golicher, D., Benayas, J.R., Cayuela, L., Hinsley, S.,2009. Remote sensing and the future of landscape ecology. Prog. Phys. Geogr. 33,528–546.
Palmer, M.W., 1995. How should one count species? Nat. Areas J. 15, 124–135.Palmer, M.W., Earls, P.G., Hoagland, B.W., White, P.S., Wohlgemuth, T., 2002.
Quantitative tools for perfecting species lists. Environmetrics 13, 121–137.Petchey, O.L., Hector, A., Gaston, K.J., 2004. How do different measures of functional
diversity perform? Ecology 85, 847–857.R Core Team, 2017. R: A Language and Environment for Statistical Computing. R
Foundation for Statistical Computing, Vienna, Austria. https://www.R-project.org/.Ricotta, C., Bacaro, G., 2012. On plot-to-plot dissimilarity measures based on species
functional traits. Community Ecol. 11, 113–119.Ricotta, C., Bacaro, G., Moretti, M., 2014. A new measure of functional evenness and
some of its properties. PLOS ONE 9, e104060.Rocchini, D., 2007. Distance decay in spectral space in analysing ecosystem beta-di-
versity. Int. J. Remote Sens. 28, 2635–2644.Rocchini, D., Balkenhol, N., Carter, G.A., Foody, G.M., Gillespie, T.W., He, K.S., Kark, S.,
Levin, N., Lucas, K., Luoto, M., Nagendra, H., Oldeland, J., Ricotta, C., Southworth,J., Neteler, M., 2010. Remotely sensed spectral heterogeneity as a proxy of speciesdiversity: recent advances and open challenges. Ecol. Inform. 5, 318–329.
Rocchini, D., Boyd, D.S., Féret, J.B., Foody, G.M., He, K.S., Lausch, A., Nagendra, H.,Wegmann, M., Pettorelli, N., 2016. Satellite remote sensing to monitor species di-versity: potential and pitfalls. Remote Sens. Ecol. Conserv. 2, 25–36.
Rocchini, D., Marcantonio, M., Ricotta, C., 2017. Measuring Rao's Q diversity index fromremote sensing: an open source solution. Ecol. Indic. 72, 234–238.
Rocchini, D., McGlinn, D., Ricotta, C., Neteler, M., Wohlgemuth, T., 2011. Landscapecomplexity and spatial scale influence the relationship between remotely sensedspectral diversity and survey-based plant species richness. J. Veg. Sci. 22, 688–698.
Roy, P.S., Tomar, S., 2000. Biodiversity characterization at landscape level using geos-patial modelling technique. Biol. Conserv. 95, 95–109.
D. Rocchini et al. Ecological Indicators 85 (2018) 983–990
989

Rugani, B., Rocchini, D., 2017. Boosting the use of spectral heterogeneity in the impactassessment of agricultural land use on biodiversity. J. Clean. Prod. 140, 516–524.
Scheiner, S., Cox, S.B., Willig, M., Mittelbach, G.G., Osenberg, C., Kaspari, M., 2000.Species richness, species–area curves and Simpson's paradox. Evol. Ecol. Res. 2,791–802.
Schmeller, D., Weatherdon, L., Loyau, A., Bondeau, A., Brotons, L., Brummitt, N.,Geijzendorffer, I., Haase, P., Kuemmerlen, M., Martin, C., Mihoub, J.-B., Rocchini, D.,Saarenmaa, H., Stoll, S., Regan, E., 2017. A suite of essential biodiversity variables fordetecting critical biodiversity change. Biol. Rev (in press).
Schmidtlein, S., Feilhauer, H., Bruelheide, H., 2012. Mapping plant strategy types usingremote sensing. J. Veg. Sci. 23, 395–405.
Schmidtlein, S., Fassnacht, F.E., 2017. The spectral variability hypothesis does not holdacross landscapes. Remote Sens. Environ. 192, 114–125.
Schweiger, A.K., Schutz, M., Risch, A.C., Kneubuhler, M., Haller, R., Schaepma, M.E.,2016. How to predict plant functional types using imaging spectroscopy: linkingvegetation community traits, plant functional types and spectral response. MethodsEcol. Evol. 8, 86–95.
Shinozaki, K., 1963. Note on the species area curve. Proceedings of the 10th AnnualMeeting of Ecological Society of Japan, vol. 5 (in Japanese).
Souza, D.M., Teixeira, R.F.M., Ostermann, O.P., 2015. Assessing biodiversity loss due toland use with Life Cycle Assessment: are we there yet? Glob. Change Biol. 21, 32–47.
Tratalos, J., Fuller, R., Warren, P., Davies, R., Gaston, K., 2007. Urban form, biodiversitypotential and ecosystem services. Landsc. Urban Plan. 83, 308–317.
Ugland, K.I., Gray, J.S., Ellingen, K.E., 2003. The species–accumulation curve and esti-mation of species richness. J. Anim. Ecol. 72, 888–897.
Verones, F., Huijbregts, M.A.J., Chaudhary, A., de Baan, L., Koellner, T., Hellweg, S.,2015. Harmonizing the assessment of biodiversity effects from land and water usewithin LCA. Environ. Sci. Technol. 49, 3584–3592.
Violle, C., Navas, M.L., Vile, D., Kazakou, E., Fortunel, C., Hummel, I., Garnier, E., 2007.Let the concept of trait be functional!. Oikos 116, 882–892.
Waldbusser, G.G., Marinelli, R.L., Whitlatch, R.B., Visscher, P.T., 2004. The effects ofinfaunal biodiversity on biogeochemistry of coastal marine sediments. Limnol.Oceanogr. 49, 1482–1492.
D. Rocchini et al. Ecological Indicators 85 (2018) 983–990
990