report #40364 enlighted technical proof of concept … · pilot site measured performance analysis...
TRANSCRIPT

July 9, 2013
REPORT #40364
Enlighted Technical
Proof of Concept
Study
Prepared by:
Amy Cortese
Adam Scherba
New Buildings Institute
1601 Broadway Street
Vancouver, WA 98663
Northwest Energy Efficiency Alliance PHONE
503-688-5400 FAX
503-688-5447 EMAIL

Acknowledgements
New Buildings Institute (NBI) would like to thank NEEA and Mark Rehley, project contract
manager, for their contribution to the outcome of this study. In addition, the following people
contributed to the research and reporting:
Barb Hamilton, New Buildings Institute
Dan Harris, New Buildings Institute
Cathy Higgins, New Buildings Institute
Ulrike Mengelberg, New Buildings Institute
NBI would especially like to recognize the participation and patience of the project
manufacturer’s representative and the individuals at the building sites that facilitated this
valuable work:
Kasiana McLenaghan, Enlighted
Bing Tso, SBW Consulting
Randy Birk, SBW Consulting
Chris Lewis, Fred Hutchinson Cancer Research Center
Kirk Myers, REI
Kent Fowler, REI
Enlighted Technical Proof of Concept
New Buildings Institute
Table of Contents
EXECUTIVE SUMMARY ............................................................................................................ 1
Project Description ...................................................................................................................... 1
Results ......................................................................................................................................... 2
Next Steps ................................................................................................................................... 3
1. INTRODUCTION ................................................................................................................... 4
1.1. The Enlighted System ...................................................................................................... 4
1.2. Technical Proof of Concept Study Approach .................................................................. 5
1.2.1. Stepped Baseline Approach ...................................................................................... 6
1.2.2. Details of Enlighted Out-of-Box Default Settings .................................................... 7
1.3. Lighting Metrics for Comparison of Controlled Lighting Systems ................................. 8
1.4. Task Lighting ................................................................................................................. 10
1.5. Light Level Measurements ............................................................................................. 10
1.6. Occupant and Contractor Surveys .................................................................................. 10
2. PILOT SITE CHARACTERISTICS AND INSTALLED SYSTEM COSTS ...................... 12
2.1. Fred Hutchinson Cancer Research Center Yale Building (Yale Building) .................... 12
2.1.1. Existing Lighting System Characteristics ............................................................... 13
2.1.2. Retrofit Lighting System Characteristics ................................................................ 13
2.1.3. Flickering Issues ..................................................................................................... 14
2.1.4. Costs ........................................................................................................................ 14
2.1.5. Monitoring Period ................................................................................................... 15
2.2. REI Headquarters Office Building ................................................................................. 15
2.2.1. Existing Lighting System Characteristics ............................................................... 16
2.2.2. Retrofit Lighting System Characteristics ................................................................ 16
2.2.3. Costs ........................................................................................................................ 16
2.2.4. REI Building Monitoring Period ............................................................................ 17
2.3. Kivel & Howard ............................................................................................................. 17
2.3.1. Existing Lighting System Characteristics ............................................................... 18
2.3.2. Retrofit Lighting System Characteristics ................................................................ 19
2.3.3. Costs ........................................................................................................................ 19
2.3.4. Kivel & Howard Office Monitoring Period ............................................................ 20
2.4. Installation Summary ..................................................................................................... 20
Enlighted Technical Proof of Concept
New Buildings Institute
2.4.1. Summary of Monitoring Periods ............................................................................ 21
3. PILOT SITE MEASURED PERFORMANCE ANALYSIS ................................................ 23
3.1. Fred Hutchinson Cancer Research Center - Yale Building (Yale Building) ................. 24
3.1.1. Yale Building Average Daily Profile ...................................................................... 24
3.1.2. Yale Building Average Lighting Power Density .................................................... 26
3.1.3. Yale Building Estimated Annual Energy Consumption ......................................... 26
3.2. REI Headquarters Office ................................................................................................ 26
3.2.1. REI Building Average Daily Profile ....................................................................... 26
3.2.2. REI Building Average Lighting Power Density ..................................................... 27
3.2.3. REI Building Estimated Annual Energy Consumption .......................................... 28
3.3. Kivel & Howard Office .................................................................................................. 28
3.3.1. Kivel & Howard Office Average Daily Profile ...................................................... 28
3.3.2. Kivel & Howard Office Average Lighting Power Density .................................... 29
3.3.3. Kivel & Howard Estimated Annual Energy Consumption ..................................... 30
3.4. Summary of Annual Energy Consumption .................................................................... 30
4. LIGHT LEVEL MEASUREMENTS .................................................................................... 31
5. TASK LIGHT ANALYSIS ................................................................................................... 32
6. OCCUPANT AND CONTRACTOR SURVEYS ................................................................. 34
6.1. Occupancy Survey Methodology ................................................................................... 34
6.2. Site-Specific Findings from Occupancy Survey ............................................................ 35
6.2.1. Yale Building .......................................................................................................... 35
6.2.2. REI Building ........................................................................................................... 35
6.2.3. Kivel & Howard Building ....................................................................................... 36
6.2.4. Comparison across All Three Buildings ................................................................. 36
6.3. Contractor Survey .......................................................................................................... 36
6.4. Fixture and Occupancy Analysis.................................................................................... 37
7. SUMMARY / CONCLUSIONS ........................................................................................... 39
7.1. NEXT STEPS .................................................................................................................... 40
APPENDIX A: SUMMARY OF OCCUPANT SURVEY RESULTS ........................................ 41
Site-Specific Findings ............................................................................................................... 41
Yale Building ......................................................................................................................... 41
REI Building .......................................................................................................................... 41
Kivel & Howard Building ..................................................................................................... 42
Comparison across All Three Buildings ................................................................................ 42

Enlighted Technical Proof of Concept
New Buildings Institute
Methodology ............................................................................................................................. 42
Occupant Survey Results .......................................................................................................... 43
Fred Hutchinson Yale Building ............................................................................................. 44
Yale Building Occupant Survey Conclusions ....................................................................... 49
REI ......................................................................................................................................... 50
REI Occupant Survey Conclusions ....................................................................................... 58
Kivel & Howard .................................................................................................................... 58
Kivel & Howard Occupant Survey Summary ....................................................................... 65
Summary across the Three Sites ............................................................................................ 65
APPENDIX B: OCCUPANT SURVEY INSTRUMENT ............................................................ 66
APPENDIX C: CONTRACTOR SURVEY INSTRUMENT ...................................................... 71
APPENDIX D: LIGHT LEVEL MEASUREMENTS ................................................................. 72
Yale Building Light Level Measurements ................................................................................ 72
REI Light Level Measurements ................................................................................................ 74
Kivel & Howard Light Level Measurements ............................................................................ 76
Summary of Light Level Measurements ................................................................................... 77
APPENDIX E: TASK LIGHTING ANALYSIS .......................................................................... 79
Yale Building Task Lighting Analysis ...................................................................................... 79
REI Building Task Lighting Analysis ....................................................................................... 82
Task Light Summary ................................................................................................................. 85
Yale Building Fixture-Level Data Analysis .............................................................................. 86
Yale Building Occupancy Data Analysis .................................................................................. 90

Enlighted Technical Proof of Concept
New Buildings Institute
List of Tables
Table 1: Overview of Pilot Sites and Breakdown of Costs ............................................................ 1
Table 2: Enlighted Out-of-Box Settings ......................................................................................... 8
Table 3: Overview of Pilot Sites and Costs .................................................................................. 12
Table 4: Summary of Costs at Yale Building ............................................................................... 14
Table 5: Yale Building Monitoring Periods.................................................................................. 15
Table 6: Summary of Costs at REI ............................................................................................... 17
Table 7: REI Building Monitoring Periods ................................................................................... 17
Table 8: Summary of Costs at Kivel & Howard ........................................................................... 20
Table 9: Kivel & Howard Office Monitoring Periods .................................................................. 20
Table 10: Summary of Pilot Site Before-and-After Characteristics ............................................. 21
Table 11: Monitoring Time Summary - Number of Days in Each Research Phase By Building 22
Table 12: Percentage of Average Lighting Power Density Savings on Weekday Occupied and
Weeknight Hours .......................................................................................................................... 23
Table 13: Off Hours and Weekend Ratios .................................................................................... 24
Table 14: Estimated Annual Energy Savings Compared to Existing Baseline ............................ 24
Table 15: Yale Building Measured Average Lighting Power Density ......................................... 26
Table 16: Yale Building Estimated Annual Energy Consumption and Percent Savings ............. 26
Table 17: REI Building Measured Average Lighting Power Density .......................................... 28
Table 18: REI Building Estimated Annual Energy Consumption ................................................ 28
Table 19: Kivel & Howard Measured Average Lighting Power Density ..................................... 30
Table 20: Kivel & Howard Estimated Annual Energy Consumption and .................................... 30
Table 21: Estimated Annual Energy Savings Relative to Existing Baseline ................................ 30
Table 22: Summary of Instantaneous Light Level Measurements by Site and Phase of Research
....................................................................................................................................................... 31
Table 23: Annual Task Light Estimated Energy Use ................................................................... 32
Table 24: Overall Survey Completions......................................................................................... 35
Table 25: Overall Survey Completions......................................................................................... 43
Table 26: Yale Building: Percentage of Respondents with Glare Issues By Phase of Research .. 47
Table 27: Yale Building: Light Reactions .................................................................................... 47
Table 28: REI: Percentage of Occupants Experiencing Glare ...................................................... 53
Table 29: REI: Burning Eyes and Headaches ............................................................................... 54
Table 30: Kivel & Howard: Glare Is an Issue Sometimes, Often or Always ............................... 62

Enlighted Technical Proof of Concept
New Buildings Institute
Table 31: Summary of Instantaneous Light Level Measurements by Site and Phase of Research
....................................................................................................................................................... 78
Table 32: Yale Building Annual Task Light Energy Use per Fixture .......................................... 82
Table 33: REI Building Annual Task Light Energy Use per Fixture ........................................... 84
Table 34: Annual Task Light Energy Use Summary for Yale Building and REI ........................ 85
Table 35: Yale Building Metrics for Core versus Perimeter Offices ............................................ 90

Enlighted Technical Proof of Concept
New Buildings Institute
List of Figures
Figure 1: Enlighted Lighting System Control Components ........................................................... 5
Figure 2: Graphic Representation of the Stepped Baseline Approach ........................................... 7
Figure 3: Yale Building Site Plan ................................................................................................. 13
Figure 4: REI Reflective Ceiling Plan .......................................................................................... 16
Figure 5: Kivel & Howard Site Plan ............................................................................................. 18
Figure 6: Yale Building Average Daily Profile ............................................................................ 25
Figure 7: REI Building Average Daily Profile ............................................................................. 27
Figure 8: Kivel & Howard Office Average Daily Profile............................................................. 29
Figure 9: Yale Building Average Fixture Power, Core and Perimeter ......................................... 38
Figure 10: Yale Building: Rating of Overall Level of Light by Space Type During User
Preference Phase ........................................................................................................................... 44
Figure 11: Yale Building: Satisfaction with Lighting Controls by Space Type during User
Preference Phase ........................................................................................................................... 45
Figure 12: Yale Building: Lighting Controls Allow to User to Create Lighting Conditions They
Want by Phase of Research ........................................................................................................... 46
Figure 13: Yale Building: Workspace Lighting for Reading from a Paper .................................. 48
Figure 14: Yale Building: Workspace Lighting for Reading from Computer Screen .................. 48
Figure 15: Yale Building: Daylight is Suitable for Working Most Hours of the Day during User
Preference Phase ........................................................................................................................... 49
Figure 16: REI: Lighting Controls Allow to User to Create Lighting Conditions They Want by
Phase of Research ......................................................................................................................... 51
Figure 17: REI: Lighting Feels Gloomy by Phase of Research .................................................... 52
Figure 18: REI: Daylight is Suitable for Working Most Hours of the Day by Phase of Research53
Figure 19: REI: Percentage of Occupants Experiencing Glare during Each Phase ...................... 54
Figure 20: REI: Workspace Lighting for Reading Paper.............................................................. 55
Figure 21: REI: Workspace Lighting for Reading from Computer Screen .................................. 56
Figure 22: REI Workspace Lighting for Typing........................................................................... 56
Figure 23: REI: Workspace Lighting for Filing ........................................................................... 57
Figure 24: REI: Overall Level of Light ........................................................................................ 57
Figure 25: Kivel & Howard Satisfaction with Lighting Control .................................................. 59
Figure 26: Kivel & Howard: Light in Primary Workstation: Fixture Brightness ......................... 60
Figure 27: Kivel & Howard Satisfaction with Lighting Control .................................................. 61
Figure 28: Kivel & Howard: Workspace Lighting for Reading Paper ......................................... 62

Enlighted Technical Proof of Concept
New Buildings Institute
Figure 29: Kivel and Howard: Workspace Lighting for Reading Computer Screen .................... 63
Figure 30: Kivel & Howard: Workspace Lighting for Typing .................................................... 63
Figure 31: Kivel & Howard: Workspace Lighting for Filing ...................................................... 64
Figure 32: Kivel & Howard: Amount of Light Overall ................................................................ 64
Figure 33: Yale Building Light Levels during As-Is Baseline ..................................................... 72
Figure 34: Yale Building Light Levels during Construction Period............................................. 73
Figure 35: Yale Building Light Levels during Out-of-Box Phase ................................................ 73
Figure 36: Yale Building Light Levels during User Preference Phase ......................................... 74
Figure 37: REI Light Levels during As-Is Baseline ..................................................................... 75
Figure 38: REI Light Level Measurements during Adjusted Baseline Phase .............................. 75
Figure 39: REI Light Level Measurements during Out-of-Box Phase ......................................... 76
Figure 40: REI Light Level Measurements during Designer Preference Phase ........................... 76
Figure 41: Kivel & Howard Light Level Measurements during Out-of-Box Phase ..................... 77
Figure 42: Kivel & Howard Light Level Measurements during Occupant Preference Phase ...... 77
Figure 43: Representative Task Light Use Patterns and Daily Energy Estimates ........................ 79
Figure 44: Yale Building Weekday Hourly Load Profile ............................................................. 81
Figure 45: Yale Building Weekend Hourly Load Profile ............................................................. 81
Figure 46: REI Weekday Hourly Load Profile ............................................................................. 83
Figure 47: REI Weekend Hourly Load Profile ............................................................................. 84
Figure 48: REI Estimated Annual Task Light Energy Use Histogram ......................................... 85
Figure 49: Comparison of Single Fixture Energy Metering ......................................................... 87
Figure 50: Daily kWh for Yale Building – Comparison of NBI and Enlighted Metering ........... 88
Figure 51: Weekday Hourly Load Profile for Yale Building - Comparison of ............................ 88
Figure 52: Yale Building Average Fixture Power, Core and Perimeter ....................................... 89
Figure 53: Yale Building Average Hourly Power, Core and Perimeter ....................................... 90
Figure 54: Energy Use vs. Occupancy at Yale Building .............................................................. 91

Enlighted Technical Proof of Concept
Northwest Energy Efficiency Alliance (NEEA) - 1
Executive Summary
This report represents the findings on research on the Enlighted lighting control system. New
Buildings Institute (NBI) conducted the work on behalf of the Northwest Energy Efficiency
Alliance (NEEA) from May 2011 to December 2012. The technical Proof of Concept study
aimed to validate manufacturer claims for costs, ease of installation, end user satisfaction and
energy savings.
The four primary goals were to:
1) Provide third-party validation of energy savings and costs at three pilot sites.
2) Measure owner/occupant and contractor satisfaction at each operating mode.
3) Measure installer satisfaction with the product and collect installers’ feedback about
installation issues.
4) Compare energy savings, costs, ease of installation and user satisfaction with
manufacturer claims.
Project Description
Researchers investigated three sites in the Pacific Northwest, including the third floor of the Yale
Building at the Fred Hutchinson Cancer Research Center in Seattle, Washington; a wing of the
REI Headquarters office building in Kent, Washington; and part of the seventeenth floor of the
Unico Building in Portland, Oregon, where the Kivel & Howard law firm has its offices. Table 1
shows a summary of the three sites and equipment and installation costs for each.
Table 1: Overview of Pilot Sites and Breakdown of Costs
Site Location Size of
Installation
Equipment
Cost/SF
Installation
Cost/SF
Total
Cost/SF
Total
Cost/
Fixture
Fred Hutchinson
Yale Building
Seattle, WA 20,000 SF $1.44/SF $1.18/SF $2.62/SF $292
REI Headquarters Kent, WA 15,000 SF $1.26/SF $0.45/SF $1.71/SF $185
Kivel & Howard
Office
Portland, OR 5,418 SF $1.42/SF $1.69/SF $3.11/SF $280
Note: NBI based the Kivel & Howard costs on total size of the office installation, as well as on total costs for the Enlighted
system installation in 6,763 SF of office – not only on the 5,418 SF in the study area.
Two of the sites were simple retrofits of the system that included installation of dimming ballasts
and the Enlighted control system. However, the renovation of the Kivel & Howard system
involved a more complicated delamping on non-egress fixtures in addition to the reballasting,
which increased the installation costs and affected the energy savings estimates.
The Enlighted Technical Proof of Concept Study used a stepped baseline, previously utilized by
the Office of the Future Consortium, to establish the estimated impact of various stages of
control, including the as-is existing condition; the adjusted condition after the dimming ballasts
were installed but before controls were activated; the out-of box Enlighted system operation; and
the designer preference and user preference settings.

Enlighted Technical Proof of Concept
Northwest Energy Efficiency Alliance (NEEA) - 2
Measured energy performance was not the sole focus of the research. It also included
investigations into the use of task lighting, light level measurements, and occupant and
contractor surveys. Additionally, NBI conducted a fixture-by-fixture comparison of measured
performance from loggers to the occupancy and trending data collected by the Enlighted system.
Results
Measured results of this technical Proof of Concept research reveal that the Enlighted lighting
control technology and dimming ballast can deliver significant savings at relatively low cost. The
results of the technical Proof of Concept study align with manufacturer claims of low cost, ease
of installation and end user satisfaction, though its claims of fifty to seventy percent of lighting
energy savings may be optimistic. Measured energy savings of the Enlighted lighting control
system over the existing baseline system ranged from thirty-two to fifty-nine percent, though
savings at Kivel & Howard (32%) are also attributable to changes to the lighting system.
Total costs of the installations ranged from $1.71/SF to $3.11/SF. Hiring installers holding a
California Non-Residential Lighting technical certification with training by the manufacturer was
most cost-effective ($0.45 on the low end compared to $1.69 per SF). The REI costs ($0.45/SF
for installation and $1.26 for equipment) also benefitted because the project was part of a retrofit
of an entire building as opposed to tenant space within a larger building.
Occupant surveys suggest that most people are satisfied with the new lighting system. As
expected, this varied depending on the particular circumstances, e.g., whether an office was open
or private and the level of control they had before the retrofit. Interestingly, the occupants’
perceptions of actual control did not change as expected, since facility managers were still
responsible for making any changes to the lighting levels.
In addition to comparing projected annual energy savings, NBI used other methodologies to
compare energy use before and after renovation. One is the Daily Consumption Profile, which
illustrates the measured lighting power density (LPD, in W/SF) over the course of a typical
weekday in the office, providing clarity on the magnitude of energy savings and the approximate
time of day that most energy savings occur. Another is the off hours and weekend ratios which
provide indication of how well the controls are turning off lights when the space is unoccupied.
In addition to energy savings, costs and occupant/contractor satisfaction, researchers investigated
other areas such as task lighting, light level measurements, and the comparison of measured
energy use at the fixture level to that reported by the Enlighted system.
Task Lighting - Researchers estimated an annual task lighting energy use of 15-30 kWh -
up to 50% of the overhead fixture energy use. A change in task light behavior could
easily affect the estimated energy savings/penalties of a lighting system. However, this
research suggested that occupants did not significantly change their task light use after
the retrofit.
Light Levels - Snapshots of light level readings demonstrated a high degree of variability
among the sites. While light level readings at the REI site were most likely in the industry
standard range of 35-55 foot-candles, the Yale Building often experienced light level
Enlighted Technical Proof of Concept
Northwest Energy Efficiency Alliance (NEEA) - 3
readings both higher and lower than industry standards, and readings at the Kivel &
Howard site were much lower.
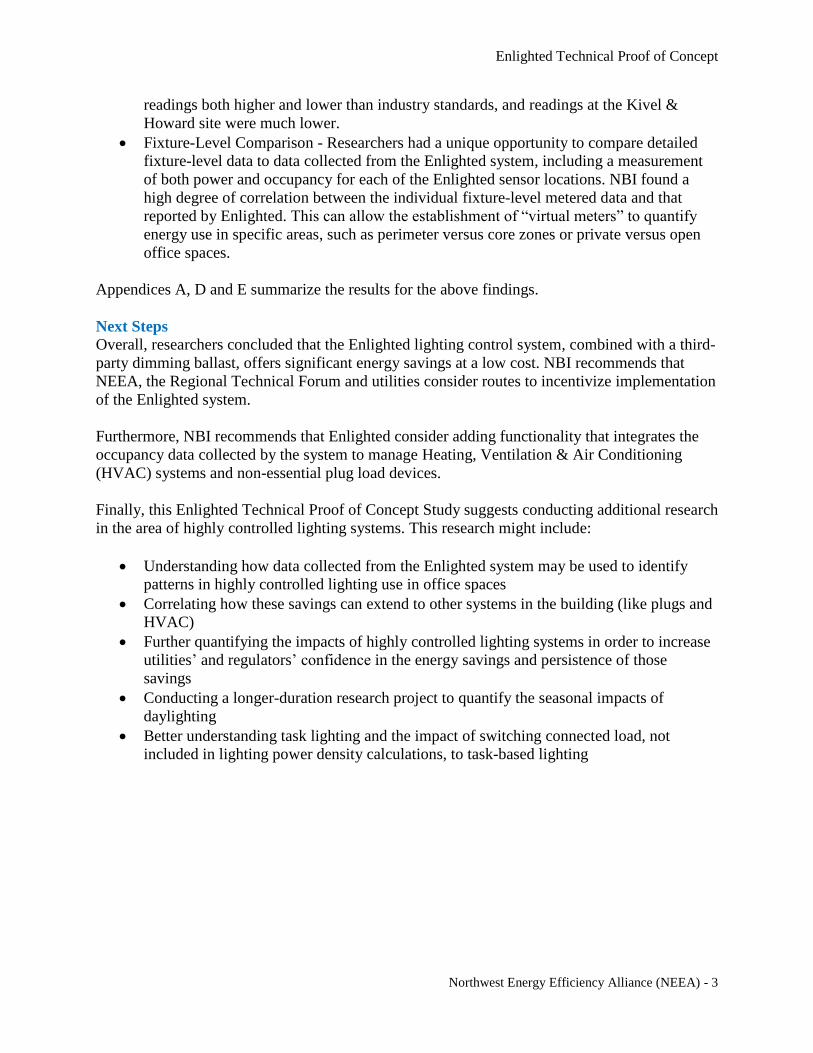
Fixture-Level Comparison - Researchers had a unique opportunity to compare detailed
fixture-level data to data collected from the Enlighted system, including a measurement
of both power and occupancy for each of the Enlighted sensor locations. NBI found a
high degree of correlation between the individual fixture-level metered data and that
reported by Enlighted. This can allow the establishment of “virtual meters” to quantify
energy use in specific areas, such as perimeter versus core zones or private versus open
office spaces.
Appendices A, D and E summarize the results for the above findings.
Next Steps
Overall, researchers concluded that the Enlighted lighting control system, combined with a third-
party dimming ballast, offers significant energy savings at a low cost. NBI recommends that
NEEA, the Regional Technical Forum and utilities consider routes to incentivize implementation
of the Enlighted system.
Furthermore, NBI recommends that Enlighted consider adding functionality that integrates the
occupancy data collected by the system to manage Heating, Ventilation & Air Conditioning
(HVAC) systems and non-essential plug load devices.
Finally, this Enlighted Technical Proof of Concept Study suggests conducting additional research
in the area of highly controlled lighting systems. This research might include:
Understanding how data collected from the Enlighted system may be used to identify
patterns in highly controlled lighting use in office spaces
Correlating how these savings can extend to other systems in the building (like plugs and
HVAC)
Further quantifying the impacts of highly controlled lighting systems in order to increase
utilities’ and regulators’ confidence in the energy savings and persistence of those
savings
Conducting a longer-duration research project to quantify the seasonal impacts of
daylighting
Better understanding task lighting and the impact of switching connected load, not
included in lighting power density calculations, to task-based lighting

Enlighted Technical Proof of Concept
Northwest Energy Efficiency Alliance (NEEA) - 4
1. Introduction
This report represents the findings on research on the Enlighted luminaire level lighting control
system. New Buildings Institute (NBI) conducted the work for the Northwest Energy Efficiency
Alliance (NEEA) from May 2011 to December 2012. The objective was to perform a Technical
Proof of Concept to verify manufacturer claims on an emerging lighting technology that could
increase the energy savings and project opportunities for Northwest utilities.
Commercial lighting retrofits continue to offer significant energy-saving opportunities, but
changes to the national commercial lighting standard will eventually make T8 lamps the norm
and a part of the baseline. This leaves a hole in lighting program offerings and jeopardizes an
entire industry of lighting trade allies.
Electrical contractors working on commercial lighting retrofit projects typically have no formal
design experience. They rely instead on field experience, rules of thumb and simple one-for-one
equipment upgrades. One way to preserve this valuable trade ally network and to ensure a
continued energy savings stream for utilities is to identify new savings measures for simple
retrofit equipment.
Utility studies and research by NBI and others have shown that lighting controls including
occupancy, dimming and daylight detection are able to reduce energy use significantly.
However, most commercial lighting control systems are expensive, difficult to install and
commission, and provide poor end-user satisfaction. Enlighted claims to remedy these issues.
This report aims to compare measured performance to manufacturer claims that the Enlighted
System can provide fifty to seventy percent energy savings with low installed cost, easy
installation and high occupant satisfaction.
1.1. The Enlighted System
The First Generation Enlighted system is comprised of five main components: Enlighted Sensor,
Enlighted Control Unit, off-the-shelf dimmable ballast, Enlighted Gateway and Enlighted Energy
Manager, as shown in Figure 1: Enlighted Lighting System Control Components.

Enlighted Technical Proof of Concept
Northwest Energy Efficiency Alliance (NEEA) - 5
Figure 1: Enlighted Lighting System Control Components
The sensor bundle collects data on occupancy, light levels and temperature. The control unit
collects energy consumption information and passes this information from the sensor unit to the
dimmable ballast. The sensor unit stores the control profile/program and wirelessly
communicates with the Enlighted gateway. One Enlighted gateway can cover 50-150 fixtures,
depending on the floor plan. The gateway relays information via Ethernet to a dedicated server
called the Enlighted Green Energy Manager.
Out of the box, the Enlighted system controls each luminaire independently, but operators can
also program the system from a central location in order to maximize user satisfaction and
energy savings.
1.2. Technical Proof of Concept Study Approach
The NEEA Enlighted Proof of Concept study had four primary goals:
1) Provide third-party validation of energy savings and costs at three pilot sites.
2) Measure owner/occupant satisfaction at each operating mode and contractor satisfaction
with the ease of installation.
3) Measure installer satisfaction with the product and collect installers’ feedback about
installation issues.
4) Compare energy savings, costs, ease of installation and user satisfaction with
manufacturer claims. Specifically, these claims include:
Smart
o Networked independent sensors
o Pinpoint control

Enlighted Technical Proof of Concept
Northwest Energy Efficiency Alliance (NEEA) - 6
o Interoperable with all existing lighting types including LED
o Extensible to other energy services
Simple
o Zero lighting design required
o Simple to install (approximately 20 minutes per sensor)
o Minimal tenant disruption
o Rapid commissioning
Savings
o 50-70% lighting energy savings
o Cost-effective installation
o Low maintenance costs
o Lower cost per unit
o Reduction in carbon footprint
1.2.1. Stepped Baseline Approach
The Enlighted Technical Proof of Concept Study leveraged the approach used to evaluate the
effectiveness of lighting controls used by the Office of the Future Consortium. The approach
used a stepped baseline to establish the estimated impact of various energy conservation
measures, in this case the various stages of control.
The steps of the Enlighted research included:
Existing Baseline - Measurement of the existing system as operated
Adjusted Baseline - Measurement of the retrofit system, with new dimming ballasts,
lamps replaced and the Enlighted control system turned off
Out-of-Box Mode - Measurement of the retrofit system with the Enlighted system turned
to “out-of-box” control settings as explained in the table further below
Designer Preference - For each pilot, a lighting designer did a walk-through of the “out-
of-box” mode installation. They collected foot-candle measurements and made
recommendations for adjustments to the lighting levels. Lighting designers paid specific
attention to corridor lighting and occupied spaces near the windows.
User/Occupant Preference - Measurement of the retrofit system after making
adjustments per occupant preferences. Facility managers made all changes of lighting
levels using the Enlighted control system based on specific user requests.
The “stepped” baseline quantifies the effectiveness of the controls at each phase, as Figure 2
shows. The hypothesis was that additional savings might be measured at each step in the stepped
baseline.

Enlighted Technical Proof of Concept
Northwest Energy Efficiency Alliance (NEEA) - 7
Figure 2: Graphic Representation of the Stepped Baseline Approach
While it may seem counterintuitive, recently renovated lighting systems sometimes use more
energy than they did before the renovation. Many existing lighting systems have burned-out
lamps that are not drawing full power. Therefore, when the retrofit calls for a one-for-one
lamp/ballast change-out, upon replacement more lamps are functioning and the system uses more
energy. In addition, some dimming ballasts use slightly more energy than do their non-dimming
counterparts.
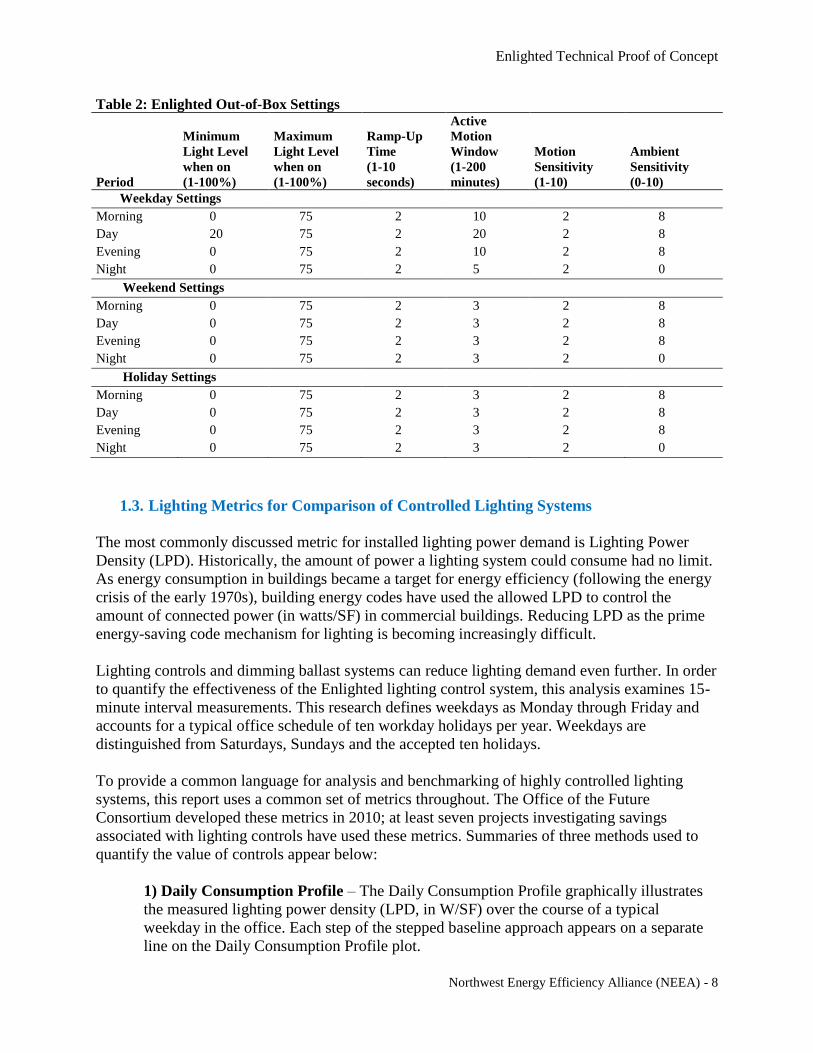
1.2.2. Details of Enlighted Out-of-Box Default Settings
The Enlighted system ships with pre-programmed default control settings. This study
investigated occupant preferences and energy savings associated with the out-of-box settings,
shown in Table 2.
Enlighted Technical Proof of Concept
Northwest Energy Efficiency Alliance (NEEA) - 8
Table 2: Enlighted Out-of-Box Settings
Period
Minimum
Light Level
when on
(1-100%)
Maximum
Light Level
when on
(1-100%)
Ramp-Up
Time
(1-10
seconds)
Active
Motion
Window
(1-200
minutes)
Motion
Sensitivity
(1-10)
Ambient
Sensitivity
(0-10)
Weekday Settings
Morning 0 75 2 10 2 8
Day 20 75 2 20 2 8
Evening 0 75 2 10 2 8
Night 0 75 2 5 2 0
Weekend Settings
Morning 0 75 2 3 2 8
Day 0 75 2 3 2 8
Evening 0 75 2 3 2 8
Night 0 75 2 3 2 0
Holiday Settings
Morning 0 75 2 3 2 8
Day 0 75 2 3 2 8
Evening 0 75 2 3 2 8
Night 0 75 2 3 2 0
1.3. Lighting Metrics for Comparison of Controlled Lighting Systems
The most commonly discussed metric for installed lighting power demand is Lighting Power
Density (LPD). Historically, the amount of power a lighting system could consume had no limit.
As energy consumption in buildings became a target for energy efficiency (following the energy
crisis of the early 1970s), building energy codes have used the allowed LPD to control the
amount of connected power (in watts/SF) in commercial buildings. Reducing LPD as the prime
energy-saving code mechanism for lighting is becoming increasingly difficult.
Lighting controls and dimming ballast systems can reduce lighting demand even further. In order
to quantify the effectiveness of the Enlighted lighting control system, this analysis examines 15-
minute interval measurements. This research defines weekdays as Monday through Friday and
accounts for a typical office schedule of ten workday holidays per year. Weekdays are
distinguished from Saturdays, Sundays and the accepted ten holidays.
To provide a common language for analysis and benchmarking of highly controlled lighting
systems, this report uses a common set of metrics throughout. The Office of the Future
Consortium developed these metrics in 2010; at least seven projects investigating savings
associated with lighting controls have used these metrics. Summaries of three methods used to
quantify the value of controls appear below:
1) Daily Consumption Profile – The Daily Consumption Profile graphically illustrates
the measured lighting power density (LPD, in W/SF) over the course of a typical
weekday in the office. Each step of the stepped baseline approach appears on a separate
line on the Daily Consumption Profile plot.

Enlighted Technical Proof of Concept
Northwest Energy Efficiency Alliance (NEEA) - 9
The Daily Consumption Profile shows how occupancy use patterns affect lighting power
levels throughout the course of a typical office weekday. Increased availability from
daylighting may also affect the Daily Consumption Profile. Although the magnitude of
this contribution is difficult to determine, it likely contributes during the hours of peak
energy use.
To create this plot, NBI averages measurements of lighting power density, at a particular
time of the day, for all of the weekdays in the monitoring period. This is repeated for
every hour and these results are plotted over the 24-hour daytime/nighttime period to
graphically show the average weekday profile. NBI averages the profile for all weekdays
over the period to eliminate day-to-day anomalies.
2) Average Lighting Power Density (in W/SF) –The average lighting power density
analysis separately examines daytime and nighttime measured LPD, separating weekdays
from weekends, and compares the numeric values of these average lighting power
densities within a table. For this analysis in office spaces, NBI defines daytime as the 12-
hour period of 6:00 AM to 6:00 PM, and nighttime is 6:00 PM to 6:00 AM. “Occupied
hours” is another name for the daytime period, since it is the time the office space is most
likely to be in use.
In this average lighting power density calculation methodology, the daytime power
demand (or occupied hours) is the sum of every 15-minute interval reading between 6:00
AM and 6:00 PM divided by the total number of readings. This calculates an average
reading for the entire daytime period. The nighttime power demand is a similar
calculation using meter readings between 6:00 PM and 6:00 AM. Since weekend/holiday
periods are typically unoccupied, NBI calculated a weekend/holiday power demand over
a 24-hour timespan.
Off-Hours Ratio
This is the ratio of weekday nighttime power density to weekday daytime power density,
given by: WperSFnight / WperSFday.
The off-hours ratio describes how effectively a system reduces lighting energy use
overnight when the building is lightly occupied. This metric is also affected by occupant
behavior and scheduling: sites with employees who work night shifts or late into the
evening will affect the off-hours ratio. A low off-hours ratio indicates significantly less
lighting use overnight.
Weekend Ratio
This is the ratio of weekend power density to weekday daytime power density, given by:
WperSFweekend / WperSFweekday-daytime
The weekend ratio describes how effectively a system reduces lighting energy use during
the weekends when the building is lightly occupied. This metric is also affected by
occupant behavior and scheduling: sites with employees who work weekend shifts will

Enlighted Technical Proof of Concept
Northwest Energy Efficiency Alliance (NEEA) - 10
affect the off-hours ratio. A low weekend ratio indicates will affect the off-hours ratio on
weekends.
Peak Demand
Separate from the calculation above, NBI calculates peak demand using a 15-minute
rolling average power measurement. NBI documents the maximum 15-minute average
during each phase of the stepped baseline as the Peak Demand, in W/SF. This is
analogous to how a utility would calculate peak demand charges. Although NBI expects
this peak to occur during weekday daytime periods, the analysis methodology allows it to
occur at any time during the measurement period.
3) Annual Energy Consumption - The Average Energy Consumption estimates the
expected annual energy use given the measurements taken at each phase of the stepped
baseline. NBI calculates the estimated annual consumption based on the average 24-hour
weekday kWh/day multiplied by 251 weekdays plus the average 24-hour weekend
kWh/day x 114 weekend/holiday days. NBI also normalizes this estimated annual
consumption by the size of the office in order to allow for easy comparisons among the
sites.
1.4. Task Lighting
Task lighting creates complexities for measuring the energy performance of lighting systems
because task lights are often not included in the measured lighting circuits. Instead, task lights
are typically included in the plug load circuit. Since NBI did not measure plug load circuits in
this study, the research required a different approach.
With a goal of assessing the relative impact of task lights, researchers installed loggers on
twenty-five percent of the task lights in the space. These “state” loggers recorded whether task
lights were on or off to compare task light use before and after deployment of lighting controls to
determine whether the use patterns would change as the overhead lighting system dimmed. This
methodology was not part of the initial scope and limited the investigation of task lighting
impact to two pilot sites.
1.5. Light Level Measurements
Light levels are measured in foot-candles, a commonly used metric to specify and determine if
there is sufficient light for the space use. Collecting light-level measurements in the study areas
constituted another aspect of the Enlighted Technical Proof of Concept Study. This involved
collecting light-level measurements throughout the study area at various phases of the research
project.
1.6. Occupant and Contractor Surveys
One key component of the research consisted of surveys of occupants and installing contractors.
Occupant feedback surveys provided insights into the satisfaction level with the office space
lighting. Figure 2 above shows the point in the research at which occupants completed surveys.

Enlighted Technical Proof of Concept
Northwest Energy Efficiency Alliance (NEEA) - 11
Surveys collected information about the occupants’ particular space locations; their perceptions
of the lighting comfort and glare; and overall observations.
NBI also conducted contractor telephone surveys for all three pilot sites to clarify the scope of
effort associated with the installation, timing and coordination with occupants in an existing
office; the specific steps involved in the installation; familiarity and comfort with the products;
commissioning; and costs associated with installation.

Enlighted Technical Proof of Concept
Northwest Energy Efficiency Alliance (NEEA) - 12
2. Pilot Site Characteristics and Installed System Costs
This Enlighted Technical Proof of Concept Study investigated three sites in the Pacific
Northwest. This report describes each of the pilot sites in further detail, including descriptions
and site plans as well as lighting system conditions before and after retrofit. Table 3 summarizes
the installations and costs.
Table 3: Overview of Pilot Sites and Costs
Site Location Size of
Installation
Equipment
Cost/SF
Installation
Cost/SF
Total Cost/SF
Fred Hutchinson Yale
Building
Seattle, WA 20,000 SF $1.44/SF $1.18/SF $2.62/SF
REI Headquarters Kent, WA 15,000 SF $1.26/SF $0.45/SF $1.71/SF
Kivel & Howard Office Portland, OR 5,418 SF* $1.42/SF $1.69/SF $3.11/SF
Note: NBI based the Kivel & Howard costs on total size of the office installation, as well as on total costs for the Enlighted
system installation in 6,763 SF of office – not only on the 5,418 SF in the study area.
2.1. Fred Hutchinson Cancer Research Center Yale Building (Yale Building)
The installation at the Fred Hutchinson Cancer Research Center project took place on the third
floor of the Yale Building, located at 820 Yale Avenue North, Seattle, Washington (hereinafter
the “Yale Building”). Approximately 100 employees occupy 20,000 SF of office space in a mix
of private and open office spaces. The floor also includes a kitchen, five conference/meeting
rooms, two storage areas and a small lobby/waiting area. The metered space contained 180
T5HO recessed center-basket fixtures. Ten egress fixtures added to the amount of light available
in the space but were not included in the metering due to separate circuiting. A site plan depicts
the office layout and ratio for the various space uses in Figure 3.

Enlighted Technical Proof of Concept
Northwest Energy Efficiency Alliance (NEEA) - 13
Figure 3: Yale Building Site Plan
2.1.1. Existing Lighting System Characteristics
The existing lighting system included:
180 recessed center-basket linear fluorescent fixtures
2 T5HO lamps (Sylvania FP54/835/HO/ECO)
1 ballast (Sylvania QTP2x54T5HO/UNV)
Total system watts for each luminaire: 121 watts
The building had sweep timers with override buttons. Private offices have manual wall switches
that also had sweep timers with override buttons. Each luminaire (with a two lamp and ballast
combination) contributed 121 watts for a total installed capacity of 21,780 watts for the entire
lighting system. The 20,000 square foot study area yielded a lighting power density of 1.09
watts/square foot (W/SF).
2.1.2. Retrofit Lighting System Characteristics
The final retrofit lighting system included:
180 recessed center-basket linear fluorescent fixtures (existing)
2 T5HO lamps (Sylvania FP54/835/HO/ECO)
1 dimming ballast (Sylvania Quicktronic Powersense QHE 2x54T5HO/UNV DIM-TCL)
Total system watts for each luminaire: 116 watts

Enlighted Technical Proof of Concept
Northwest Energy Efficiency Alliance (NEEA) - 14
Each luminaire (with a two lamp and ballast combination) contributed 116 watts for a total
installed capacity of 20,880 watts for the entire lighting system. The 20,000 square foot study
area yielded a lighting power density of 1.04 watts/square foot (W/SF).
2.1.3. Flickering Issues
One important lesson learned in the Yale Building project pertained to the ballasts. The
originally installed Sylvania Quicktronic ballasts experienced flickering issues. Since they were
under warranty, Sylvania provided and paid for the installation of Quicktronic Powersense
dimming ballasts throughout the site.
The Sylvania Quicktronic dimming ballast originally installed in the retrofit was a seven-wire
ballast. This worked fine at full output and even during the out-of-box dimming mode, but as
lighting levels dimmed to approximately 50%, some occupants began to complain about lamp
flickering.
Staff at Fred Hutchinson attempted to remedy the situation in three ways:
1) Installed alternative Philips and GE lamps, with the same flickering result.
2) Investigated power quality in the building, but found no issues.
3) Tested the Fred Hutchinson campus standard dimming ballast (Advance brand ballast),
which immediately remedied the problem. Despite the fact that the Advance ballast
worked fine, Fred Hutchinson staff replaced all of the ballasts with Sylvania Powersense
Quicktronic ballasts due to warranty coverage issues.
Enlighted and Sylvania were involved in the investigations. Eventually Fred Hutchinson staff
replaced all of the originally installed Quicktronic dimming ballasts with Sylvania Quicktronic
Powersense dimming ballasts. This resolved the flickering issue; however, no root cause analysis
explained the cause of the flickering.
2.1.4. Costs
The total cost for the Yale Building project was $52,494 or $2.62/SF for 20,000 square feet. A
breakdown of costs follows in Table 4. This amounts to $292/fixture for 180 fixtures.
Table 4: Summary of Costs at Yale Building
Item Cost Description / Notes
Installation $15,187 191 Fred Hutchinson staff hours, including a licensed electrician
Equipment $27,500 180 Wireless Sensor Units (elf-SU-W-0-0)
180 Wireless Control Units (elf-CU-W-0-0)
2 Enlighted Gateway Units (elf-GW-W-0-0)
1 Enlighted GEM Server (elf-GEM-SAP-1)
180 two-lamp T5HO dimming ballasts
Training & Clean Up $7,375 55 Fred Hutchinson staff hours
Small Parts $1,329
Corrective Labor $1,103 Fred Hutchinson staff time to address malfunctioning ballasts
Sub-Total $52,494
Cost / Square Foot $2.62 Based on 20,000 SF

Enlighted Technical Proof of Concept
Northwest Energy Efficiency Alliance (NEEA) - 15
2.1.5. Monitoring Period
The total monitoring period for this site extended from September 5, 2011 through June 19,
2012. Construction work took place over four weekends during the construction period. Fred
Hutchinson electricians installed the equipment with support from Enlighted manufacturer
representatives. A secondary construction period occurred upon discovery of the need for a
ballast replacement, from April 9, 2012 to May 28, 2012. Subsequent tables present a single line
for the entire “user preference” period, which reflects operation with both the original and the
replacement ballasts, since a separate data analysis showed no change in energy use between the
periods with the original and the replacement ballasts. Table 5 below summarizes the monitoring
periods by phase of research.
Table 5: Yale Building Monitoring Periods
Beginning End # of Days
As Is Baseline 9-5-2011 10-29-2011 54
Construction 10-30-2011 11-22-2011 23
Adjusted Baseline 11-28-2011 12-17-2011 19
Out-of-Box Operation 12-19-2011 1-13-2012 25
User Preference 1-18-2012 4-9-2012 82
User Preference (with new
ballasts)
5-28-2012 6-19-12 22
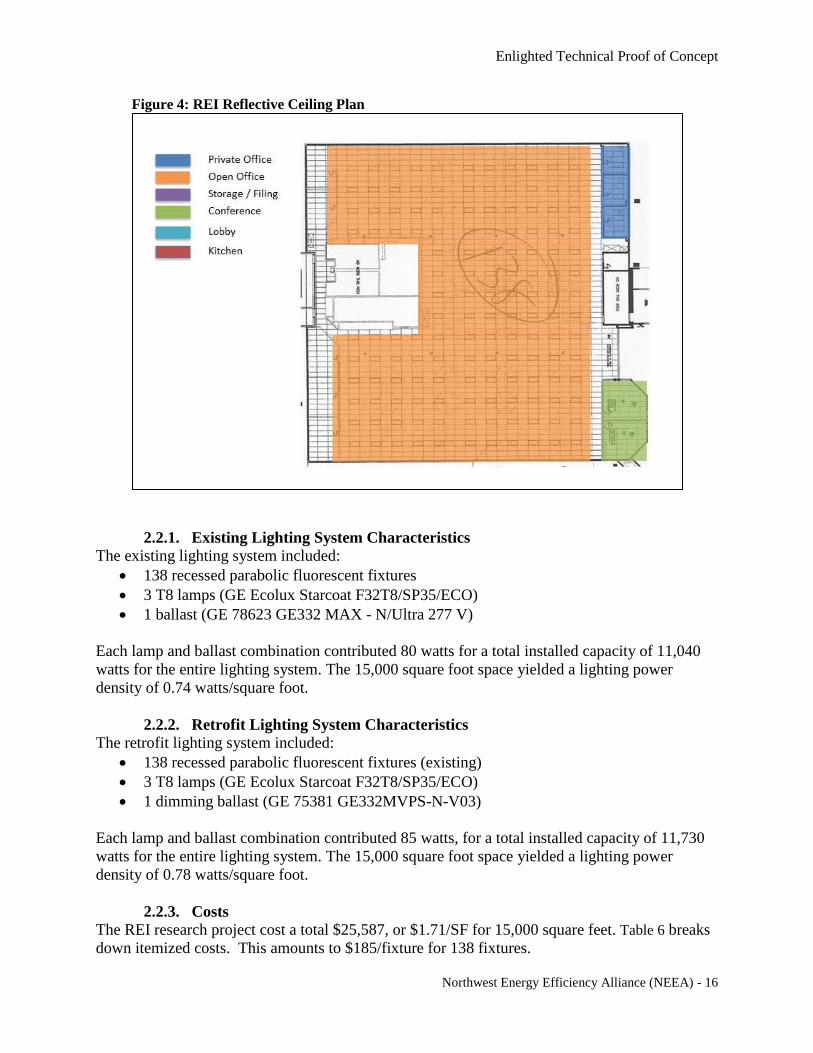
2.2. REI Headquarters Office Building
REI chose to install the Enlighted system throughout its entire headquarters building at 6750
South 228th Street in Kent, Washington. While the overall building is 79,600 SF, the study area
included approximately 15,000 SF of office space on the south wing of the first floor. The space
was primarily open office with few private offices and two conference rooms, as shown in Figure
4. This area included about 90 occupants from REI’s Merchandising group in an open office
area. The study area at REI included 138 recessed parabolic linear fluorescent fixtures.
Enlighted Technical Proof of Concept
Northwest Energy Efficiency Alliance (NEEA) - 16
Figure 4: REI Reflective Ceiling Plan
2.2.1. Existing Lighting System Characteristics
The existing lighting system included:
138 recessed parabolic fluorescent fixtures
3 T8 lamps (GE Ecolux Starcoat F32T8/SP35/ECO)
1 ballast (GE 78623 GE332 MAX - N/Ultra 277 V)
Each lamp and ballast combination contributed 80 watts for a total installed capacity of 11,040
watts for the entire lighting system. The 15,000 square foot space yielded a lighting power
density of 0.74 watts/square foot.
2.2.2. Retrofit Lighting System Characteristics
The retrofit lighting system included:
138 recessed parabolic fluorescent fixtures (existing)
3 T8 lamps (GE Ecolux Starcoat F32T8/SP35/ECO)
1 dimming ballast (GE 75381 GE332MVPS-N-V03)
Each lamp and ballast combination contributed 85 watts, for a total installed capacity of 11,730
watts for the entire lighting system. The 15,000 square foot space yielded a lighting power
density of 0.78 watts/square foot.
2.2.3. Costs
The REI research project cost a total $25,587, or $1.71/SF for 15,000 square feet. Table 6 breaks
down itemized costs. This amounts to $185/fixture for 138 fixtures.

Enlighted Technical Proof of Concept
Northwest Energy Efficiency Alliance (NEEA) - 17
Table 6: Summary of Costs at REI
Item Cost Description / Notes
Installation $6,141 84 hours (6 staff for 14 hours) with California non-residential
lighting technical certification
Equipment $18,899 138 Wireless Sensor Units (elf-SU-W-0-0)
138 Wireless Control Units (elf-CU-W-0-0)
2 Enlighted Gateway Units (elf-GW-W-0-0)
1 Enlighted GEM Server (elf-GEM-SAP-1)
138 3 lamp GE dimming ballasts
Various unshunted tombstones & Ethernet cables
Washington State Tax $1,639
Lamp Recycling $546
Sub-Total $25,586
Cost / Square Foot $1.71 Based on 15,000 SF
2.2.4. REI Building Monitoring Period
The total monitoring period for this site extended from December 20, 2011 through September
27, 2012. Authorized installers of Enlighted handled the installation, and the work took place
during unoccupied periods over weekends and in the evenings. Table 7 summarizes the other
phases of research.
Table 7: REI Building Monitoring Periods
Beginning End # of Days
As Is Baseline 12/20/2011 1/25/2012 36
Construction 1/26/2012 2/3/2012 8
Adjusted Baseline 2/6/2012 3/13/2012 36
Out-of-Box Operation 3/13/2012 6/22/2012 101
Designer Preference 6/23/12 8/10/12 48
User Preference 8/11/12 9/27/12 47
2.3. Kivel & Howard
Kivel & Howard is a law firm located on part of the 17th floor of the US Bancorp Tower in
Portland, Oregon. The tenant was in the process of a lease renewal and tenant improvement
upgrade at the time of the pilot demonstration opportunity. Unico, the landlord at US Bancorp,
had some prior experience with the Enlighted technology; Unico recommended that Kivel &
Howard proceed with the installation in return for the NBI research and analysis.
Although the office covers 6,763 total square feet, only 5,418 square feet of the space was
included in the study area. The study area space types included roughly half private offices; three
conference rooms; a small amount of open office space; storage; corridors; lobby; and kitchen
spaces. The study area included 105 fixtures.

Enlighted Technical Proof of Concept
Northwest Energy Efficiency Alliance (NEEA) - 18
Figure 5: Kivel & Howard Site Plan
The Kivel & Howard site experienced a number of complications. Specifically, the circuiting
was more complicated than had been understood at the beginning of the pilot, in the following
ways:
The north part of the office shared a circuit with the neighboring tenant and was not
metered as part of this pilot study
All middle lamps (luminaires have 3-lamp cross-sections) in the study area went to a
separate circuit that was metered as part of this pilot study
Egress fixtures were separately circuited and were not metered as part of this pilot study
2.3.1. Existing Lighting System Characteristics
The existing lighting system included:
73 - 2 x 4 paracube linear fluorescent troffers
3 T8 lamps (F032 / 735 T8)
2 ballast (Motorola “1st generation” electronic)
Total system watts for each luminaire: 96 watts
Plus:
2 - 2 x 2 paracube linear fluorescent troffers
2 U-tube T8 lamps
1 ballast (Motorola “1st generation” electronic)
Total system watts for each luminaire: 64 watts

Enlighted Technical Proof of Concept
Northwest Energy Efficiency Alliance (NEEA) - 19
Each of the 2x4 fixtures contributed 96 watts and the 2x2 fixtures contributed 64 watts for a total
of 7,136 watts of measured connected load. The total 5,418 square foot space yielded a LPD of
1.32 watts/square foot.
2.3.2. Retrofit Lighting System Characteristics
The retrofit lighting system included:
69 - 2 x 4 paracube linear fluorescent troffers
2 T8 lamps (F032 / 735 T8)
1 ballast (GE 75383 – GE232MVPS-H-V03 Ultrastart 100-3% dimming EB 277 Volt
circuiting)
Total system watts for each luminaire: 74 watts
Plus:
4 - 2 x 4 paracube linear fluorescent troffers
3 T8 lamps (F032 / 735 T8)
2 ballast (Motorola “1st generation” electronic)
Total system watts for each luminaire: 96 watts
Plus:
2 - 2 x 2 paracube linear fluorescent troffers
2 U-tube T8 lamps is
1 ballast (Motorola “1st generation” electronic)
Total system watts for each luminaire: 64 watts
In addition to the complicated circuiting, the lighting system renovation turned out to be more
extensive than simply replacing ballasts and adding controls. Specifically:
Existing Condition – 3-lamp T8 with two “1st generation” Motorola ballasts (one ballast
drove inner lamp and the other ballast drove outer lamps)
Adjusted Condition – middle lamp and ballast removed (de-lamped from existing
condition to two-lamp T8 with single dimming ballast)
As an important note, the Existing Condition had many lamps out or unplugged. For
example, during a walk-through of the Kivel & Howard study area before the renovation,
researchers counted only 18 three-lamp fixtures with all three lamps illuminated, 15
three-lamp fixtures with two lamps illuminated, and 30 with only one lamp illuminated.
The remaining fixtures were not illuminated.
Each of the 69 2x4 fixtures contributed 74 system watts; each of the remainder of the 2x4
fixtures (that were not retrofitted) contributed 96 watts; and the 2x2 fixtures contributed 64 watts
for a total of 5,618 watts of measured connected load. The total 5,418 square foot space yielded
an LPD of 1.04 W/square foot.
2.3.3. Costs
The entire Kivel & Howard project cost a total of $21,029, or $3.11/SF. NBI based these costs
on total size of the office installation, as well as on total costs for the Enlighted system

Enlighted Technical Proof of Concept
Northwest Energy Efficiency Alliance (NEEA) - 20
installation in 6,763 SF of office – not only on the 5,418 SF in the study area. Table 8 shows a
breakdown of costs. This amounts to $280/fixture for 75 fixtures.
Table 8: Summary of Costs at Kivel & Howard
Item Cost Description / Notes
Installation $11,439 8 days for two licensed electricians to complete. Work included
ballast replacement, Enlighted control installation, as well as
delamping.
Equipment $9,590
66 Wireless Sensor Units (elf-SU-W-0-0)
66 Wireless Control Units (elf-CU-W-0-0)
2 Enlighted Gateway Units (elf-GW-W-0-0)
1 Enlighted GEM Server (elf-GEM-SAP-1)
105 two-lamp dimming ballasts
Total $21,029 Total costs for the 6,763 SF site
Cost / Square Foot $3.11 Costs are based on total site costs and total size (6,763 SF),
even though only part of this area was in the study area.
2.3.4. Kivel & Howard Office Monitoring Period
The total monitoring period was June 23, 2011, through February 22, 2012. The onsite facility
manager installed the Enlighted equipment. This work happened early in the morning with
special effort to keep tenant disruption to a minimum. Table 9 below summarized the other
phases of research.
Table 9: Kivel & Howard Office Monitoring Periods
Beginning End # of Days
As Is Baseline 6/23/2011 7/26/2011 33
Construction 7/27/2011 8/10/2011 15
Adjusted Baseline* 11/21/2011 11/30/2011 9
Out-of-Box Operation 8/11/2011 11/20/2011 101
Designer Preference 3/1/2012 4/12/2012 42
User Preference 12/1/2011 2/22/2012 83
*Note: the adjusted baseline took place after the initial system installation and out-of-box operation. This baseline is not
representative due to a very irregular occupancy period (Thanksgiving) during the adjustment that did not provide a stable and
comparable baseline.
2.4. Installation Summary
The Enlighted Technical Proof of Concept Study involved three research sites in the Pacific
Northwest. The analysis included detailed investigations into the before-and-after measured
performance of each site using a stepped baseline approach in order to identify incremental
improvements. In addition to the baseline performance, other phases of research included the
Enlighted out-of-box mode, designer preference and user preferences.
Two sites included investigations into the impacts of lighting controls on task lighting use. This
began after the installation of the controls at the Yale Building – therefore no data is available on
occupant task lighting use before installation of the controls. At REI, researchers collected task
lighting information before and after installation of the controls.
Researchers also collected detailed information about the system characteristics, summarized in
Table 10.

Enlighted Technical Proof of Concept
Northwest Energy Efficiency Alliance (NEEA) - 21
Table 10: Summary of Pilot Site Before-and-After Characteristics
Site
Number and
Type of
Fixture Lamp Type Ballast Type
Total
System
Watts
Lighting
Power
Density
Yale Building
Before
Installation
180 recessed
center-basket
linear
fluorescent
fixtures
2 T5HO lamps
(Sylvania
FP54/835/HO/ECO
1 ballast (Sylvania
QTP2x54T5HO/UNV)
121 watts
1.09 W/SF
Yale Building
After
Installation
Same Same 1 dimming ballast
(Sylvania Quicktronic
Powersense QHE
2x54T5HO/UNV DIM-
TCL)
116 watts
1.04 W/SF
REI Before
Installation
138 recessed
parabolic
fluorescent
fixtures
3 T8 lamps (GE
Ecolux® Starcoat®
F32T8/SP35/ECO)
1 ballast (GE 78623
GE332 MAX - N/Ultra
277 V)
80 watts 0.74 W/SF
REI After
Installation
Same Same 1 dimming ballast (GE
75381 GE332MVPS-N-
V03)
85 watts 0.78 W/SF
Kivel &
Howard
Before
Installation
73 - 2 x 4
paracube linear
fluorescent
troffers
2 - 2 x 2
paracube linear
fluorescent
troffers
3 T8 lamps (F032 /
735 T8)
2 U-tube T8 lamps
2 ballast (Motorola “1st
generation” electronic)
1 ballast (Motorola “1st
generation” electronic)
96 watts
64 watts
1.32 W/SF
Kivel &
Howard
After
Installation
69 - 2 x 4
paracube linear
fluorescent
troffers
4 - 2 x 4
paracube linear
fluorescent
troffers
2 - 2 x 2
paracube linear
fluorescent
troffers
2 T8 lamps (F032 /
735 T8)
3 T8 lamps (F032 /
735 T8)
2 U-tube T8 lamps
1 ballast (GE 75383 –
GE232MVPS-H-V03
Ultrastart 100-3%
dimming EB 277 Volt
circuiting)
2 ballast (Motorola “1st
generation” electronic)
1 ballast (Motorola “1st
generation” electronic)
74 watts
96 watts
64 watts
1.04 W/SF
2.4.1. Summary of Monitoring Periods
The monitoring periods for each site ranged from a low of 19 days to a high of over 100 days for
the out-of-box and user preference phases of the Enlighted system study. In total, this research
represents 123 days of initial baseline monitoring, over 200 days monitoring the Out-of-Box
Operation and User Preference. Table 11 shows the total days of monitoring for the project.

Enlighted Technical Proof of Concept
Northwest Energy Efficiency Alliance (NEEA) - 22
Table 11: Monitoring Time Summary - Number of Days in Each Research Phase By Building
Research Phase Yale Building REI Kivel & Howard Total Days
As Is Baseline 54 36 33 123
Construction 23 8 15 46
Adjusted Baseline 19 36 9* 64
Out-of-Box Operation 25 101 101 227
Designer Preference N/A 48 42 90
User Preference 104 47 83 234
*Note: the adjusted baseline took place after the initial system installation and out-of-box operation. This baseline is not
representative due to a very irregular occupancy period (Thanksgiving) during the adjustment that did not provide a stable and
comparable baseline.

Enlighted Technical Proof of Concept
Northwest Energy Efficiency Alliance (NEEA) - 23
3. Pilot Site Measured Performance Analysis
Through this project and previous lighting monitoring work, NBI has selected and established
three methods that enable a comparative performance assessment across a range of metrics. Each
method reveals particular insights for how well the lighting controls are working. In representing
the energy use, savings and demand, NBI believes these categories and metrics provide a
consistent and comprehensive methodology and vocabulary for industry consideration. The three
are as follows (discussed below): 1) Daily Consumption Profiles, 2) Average Lighting Power
Density and 3) Estimated Annual Energy Consumption.
1) The Daily Consumption Profiles show the average lighting energy use on weekdays at the
various phases of the research project. While this report details patterns at each site, overall this
measured performance analysis reveals a few important trends where lighting controls can save
significant energy, including the following observations:
Lighting controls can delay the morning ramp-up of lighting systems to turn lights on
only when occupants enter the space.
Similarly, lighting controls allow the evening ramp-down of lighting systems as
occupants exit the space.
Lighting controls appear to be successfully turning off lights at night to reduce the
duration of time when lights are on to accommodate nighttime cleaning crews.
When given a choice, users prefer less light. Therefore, providing them with the
opportunity to influence the light levels in their area can help reduce energy use
associated with lighting controls.
The amount of savings correlates to the amount of time that occupants spend at their
desks.
2) The Average Lighting Power Density analysis provides measured performance metrics that
allow further analysis. Overall, the results show that the new Enlighted lighting control systems
consistently reduced average lighting power density compared with the existing systems. These
savings are more dramatic during nighttime hours than during regular occupied weekday hours.
The savings ranged from 14 to 51% during weekdays and from 53 to 79% on weekday evenings,
as shown in Table 12.
Table 12: Percentage of Average Lighting Power Density Savings on Weekday Occupied and
Weeknight Hours
Weekday Occupied Hours Weeknight Hours
Out-of-Box
User
Preference
Designer
Preference Out-of-Box
User
Preference
Designer
Preference
Yale
Building 23% 51% N/A 79% 74% N/A
REI 14% 23% 16% 66% 70% 63%
Kivel &
Howard 21% 27% 27% 53% 59% 59%
The Average Lighting Power Density metrics offer another interesting analysis possibility in the
form of the “off-hours ratio” or “weekend ratio.” A lower “off-hour ratio” or “weekend ratio”

Enlighted Technical Proof of Concept
Northwest Energy Efficiency Alliance (NEEA) - 24
demonstrates that lighting controls are effectively turning off lights during unoccupied hours.
Table 13 provides a summary of the off-hours and weekend ratios.
Table 13: Off Hours and Weekend Ratios
Yale Building REI Kivel & Howard
Off Hours
Ratio
Weekend
Ratio
Off Hours
Ratio
Weekend
Ratio
Off Hours
Ratio
Weekend
Ratio
Existing Baseline 30% 14% 44% 26% 31% 18%
Adjusted Baseline 23% 10% 48% 35% 38% 15%
Out-of-Box Mode 8% 2% 17% 12% 19% 12%
User Preference 13% 6% 17% 17% 18% 13%
Designer Preference N/A N/A 20% 16% 18% 13%
3) The Estimated Annual Energy Consumption provides insights into potential annualized
energy savings given the measured performance results. Savings ranged from 32-59% as
outlined in the following table. Please note that savings at the Kivel & Howard site are also
attributable to the delamping and are not all associated with the lighting controls. Additionally,
Kivel & Howard had no adjusted baseline (where lamps are running at full output after the
ballast replacement).
Table 14: Estimated Annual Energy Savings Compared to Existing Baseline
Yale Building REI Kivel & Howard
Out-of-Box 41% 35% 32%
User Preference 59% 39% 36%
Designer Preference N/A 35% 37%
3.1. Fred Hutchinson Cancer Research Center - Yale Building (Yale Building)
3.1.1. Yale Building Average Daily Profile
Figure 6 shows the Yale Building average daily profile for each phase of the stepped baseline.

Enlighted Technical Proof of Concept
Northwest Energy Efficiency Alliance (NEEA) - 25
Figure 6: Yale Building Average Daily Profile
The Yale Building’s Average Daily Profile clearly depicts energy savings patterns enabled by
the new lighting control system. Most importantly, the graph clearly shows a significant
reduction in energy use during occupied hours. This may be attributable to a number of factors:
1. Occupants are not at their desks for extended periods at the Yale Building. As part of the
survey, occupants reported that they were typically at their desks between four and six
hours per day, thus providing many opportunities for the lighting control system to adjust
lights when desks are not in use.
2. The Yale Building includes many private offices where lighting controls are able to turn
off lights when occupants are not present, thus realizing substantial energy savings
opportunities.
3. Another potential factor in the occupied-hours energy savings: when given the
opportunity to control their lighting system, the occupants preferred less light.
In addition to the overall drop in occupied-hours lighting energy use of 59% (over the existing
baseline), savings occur in three distinct timeframes: early morning, evening and after hours. The
morning ramp-up occurs later and is less steep than that observed with the uncontrolled lighting
system. The evening ramp-down starts earlier than before. The Average Daily Profile also
clearly shows that lighting controls are successful in after-hours energy savings presumably
associated with janitorial services. Before installation of the lighting controls, this “janitor bump”
was significant in terms of magnitude and duration. The addition of controls minimizes the
“janitor bump.”

Enlighted Technical Proof of Concept
Northwest Energy Efficiency Alliance (NEEA) - 26
3.1.2. Yale Building Average Lighting Power Density
Table 15 outlines the average lighting power density from measured results during various phases
of the study.
Table 15: Yale Building Measured Average Lighting Power Density
Installed
LPD
(W/SF)
Weekday
Daytime
(W/SF)
Weekday
Nighttime
(W/SF)
Off
Hours
Ratio
(%)
Weekend
Holiday
(W/SF)
Weekend
Ratio
(%)
Peak
(W/SF)
Baseline 1.32 0.64 0.19 30% 0.09 14% 0.76
Adjusted Baseline 1.04 0.73 0.17 23% 0.07 10% 0.90
Out-of-Box Mode 1.04 0.49 0.04 8% 0.01 2% 0.71
User Preference 1.04 0.31 0.04 13% 0.02 6% 0.49
3.1.3. Yale Building Estimated Annual Energy Consumption
The following table summarizes the estimated annual energy use for the Yale Building during
the various phases of the study.
Table 16: Yale Building Estimated Annual Energy Consumption and Percent Savings
kWh/Yr kWh/SF-Yr
% Savings from
Existing Baseline
Existing 54,998 2.75 -
Adjusted Baseline 57,847 2.89 -
Out-of-Box Mode 32,625 1.63 41%
User Preference 22,366 1.12 59%
3.2. REI Headquarters Office
3.2.1. REI Building Average Daily Profile
Figure 7 shows the REI headquarters average daily profile for each phase of the stepped baseline.

Enlighted Technical Proof of Concept
Northwest Energy Efficiency Alliance (NEEA) - 27
Figure 7: REI Building Average Daily Profile
The REI Average Daily Profile shows obvious reductions in the before- and after-hours energy
use. Lighting controls successfully delayed the energy consumption during the hours of 5:00 to
7:00 AM. Significant savings are attributable to a reduction of lighting energy use between 6:00
PM and 11:00 PM when the office is obviously unoccupied. Savings during the occupied
workday are not as dramatic as at the Yale Building, which may attributable to the fact that
occupants at REI are mostly in an open office environment and they claim to be at their desks for
more than six hours each workday. In contrast, occupants at the Fred Hutchinson Yale Building
are more likely to sit in private offices and claim to be at their desks between four and six hours
each workday. Appendix A contains additional information about occupant surveys.
3.2.2. REI Building Average Lighting Power Density
The following table outlines the average power density from measured results during various
phases of the study.

Enlighted Technical Proof of Concept
Northwest Energy Efficiency Alliance (NEEA) - 28
Table 17: REI Building Measured Average Lighting Power Density
Installed
LPD
(W/SF)
Weekday
Daytime
(W/SF)
Weekday
Nighttime
(W/SF)
Off
Hours
Ratio
Weekend
Holiday
(W/SF)
Weekend
Ratio
Peak
(W/SF)
Existing Baseline 0.74 0.61 0.27 44% 0.16 26% 0.66
Adjusted Baseline 0.78 0.65 0.31 48% 0.23 35% 0.69
Out-of-Box Mode 0.78 0.52 0.09 17% 0.06 12% 0.69
User Preference 0.78 0.47 0.08 17% 0.08 17% 0.59
Designer Preference 0.78 0.51 0.10 20% 0.08 16% 0.61
3.2.3. REI Building Estimated Annual Energy Consumption
The following table summarizes the estimated annual energy use for the REI building during the
various phases of the study.
Table 18: REI Building Estimated Annual Energy Consumption
kWh/Yr kWh/SF-Yr
% Savings from
Existing Baseline
Existing 46,800 3.1
Adjusted Baseline 52,900 3.5
Out-of-Box Mode 30,100 2.0 35%
User Preference 28,100 1.9 39%
Designer Preference 30,700 2.0 35%
3.3. Kivel & Howard Office
3.3.1. Kivel & Howard Office Average Daily Profile
Figure 8 shows the Kivel & Howard office average daily profile for each phase of the stepped
baseline.

Enlighted Technical Proof of Concept
Northwest Energy Efficiency Alliance (NEEA) - 29
Figure 8: Kivel & Howard Office Average Daily Profile
The reductions revealed in the Average Daily Profile at Kivel & Howard warrant additional
discussion. As explained earlier in this report, this site was delamped from a 3-lamp T8 condition
to a 2-lamp T8 condition, which obviously affects the savings. While it is difficult to segregate
the savings from delamping and controls, the patterns in the Average Daily Profile do
graphically illustrate the savings that may be more associated with the lighting controls. For
example, notice the delay in the ramping up of the lighting system in the morning. Before
installation of the controls, this began at 5:30 AM; in the user preference mode, morning ramp-
up started at 6:30 AM. Similarly, the ramp-down at the end of the day starts earlier post-
installation of controls than it did with the old system. Another noticeable impact is around the
lunch hour, where a “dip” is noticeable in the chart. Finally, after-hours also shows a noticeable
drop in energy use, which is also likely attributable to the Enlighted system.
The adjusted baseline period merits an important note in this case. Enlighted initially disregarded
this step at this first Kivel & Howard pilot location. Researchers attempted to go back and
recreate this situation; however, the data was collected during Thanksgiving week and is likely
not representative given irregular occupancy patterns from that particular holiday week.
3.3.2. Kivel & Howard Office Average Lighting Power Density
The following table outlines the average lighting power density from measured results during
various phases of the study.

Enlighted Technical Proof of Concept
Northwest Energy Efficiency Alliance (NEEA) - 30
Table 19: Kivel & Howard Measured Average Lighting Power Density
Installed
LPD
(W/SF)
Weekday
Daytime
(W/SF)
Weekday
Nighttime
(W/SF)
Off
Hours
Ratio
Weekend
Holiday
(W/SF)
Weekend
Ratio
Peak
(W/SF)
Existing Baseline 1.32 0.55 0.17 31% 0.10 18% 0.78
Adjusted Baseline This baseline is not represented due to a very irregular occupancy period (Thanksgiving) during the
adjustment that did not provide a stable and comparable baseline.
Out-of-Box Mode 1.04 0.43 0.08 19% 0.05 12% 0.66
User Preference 1.04 0.40 0.07 18% 0.05 13% 0.54
Designer Preference 1.04 0.40 0.07 18% 0.05 13% 0.54
3.3.3. Kivel & Howard Estimated Annual Energy Consumption
The following table summarizes the estimated annual energy use for the Kivel & Howard office
during the various phases of the study.
Table 20: Kivel & Howard Estimated Annual Energy Consumption and
Savings Relative to Existing Baseline
kWh/Yr kWh/SF-Yr
% Savings from
Existing Baseline
Existing 14,029 2.45 -
Adjusted Baseline - - -
Out-of-Box Mode 9,504 1.66 32%
User Preference 8,977 1.57 36%
Designer Preference 8,813 1.54 37%
3.4. Summary of Annual Energy Consumption
The Estimated Annual Energy Consumption provides insights into the annualized energy
savings compared to an existing condition baseline given the measured performance results.
Savings ranged from 32 to 59%, as outlined in Table 21. Savings at the Kivel & Howard site are
also attributable to the delamping and are not all associated with the lighting controls.
Table 21: Estimated Annual Energy Savings Relative to Existing Baseline
Yale Building REI Kivel & Howard
Out-of-Box 41% 35% 32%
User Preference 59% 39% 36%
Designer Preference N/A 35% 37%
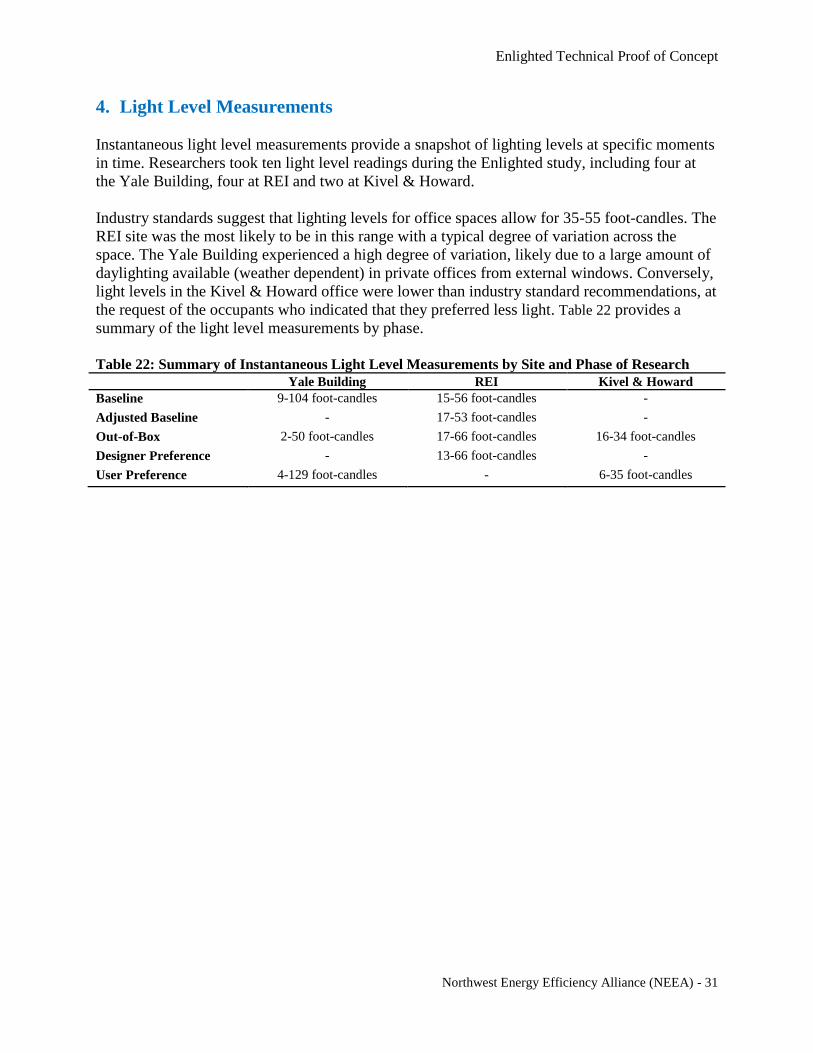
Enlighted Technical Proof of Concept
Northwest Energy Efficiency Alliance (NEEA) - 31
4. Light Level Measurements
Instantaneous light level measurements provide a snapshot of lighting levels at specific moments
in time. Researchers took ten light level readings during the Enlighted study, including four at
the Yale Building, four at REI and two at Kivel & Howard.
Industry standards suggest that lighting levels for office spaces allow for 35-55 foot-candles. The
REI site was the most likely to be in this range with a typical degree of variation across the
space. The Yale Building experienced a high degree of variation, likely due to a large amount of
daylighting available (weather dependent) in private offices from external windows. Conversely,
light levels in the Kivel & Howard office were lower than industry standard recommendations, at
the request of the occupants who indicated that they preferred less light. Table 22 provides a
summary of the light level measurements by phase.
Table 22: Summary of Instantaneous Light Level Measurements by Site and Phase of Research
Yale Building REI Kivel & Howard
Baseline 9-104 foot-candles 15-56 foot-candles -
Adjusted Baseline - 17-53 foot-candles -
Out-of-Box 2-50 foot-candles 17-66 foot-candles 16-34 foot-candles
Designer Preference - 13-66 foot-candles -
User Preference 4-129 foot-candles - 6-35 foot-candles

Enlighted Technical Proof of Concept
Northwest Energy Efficiency Alliance (NEEA) - 32
5. Task Light Analysis
Task lighting creates complexities for measuring the energy performance of lighting systems
because task lights are often not included in measured lighting circuits. Instead, task lights are
typically included in the plug load circuit. Since this study did not measure the plug load circuits,
the research required a different approach.
With a goal of assessing the relative impact of task lights, researchers installed loggers on
twenty-five percent of the task lights in the REI and Yale Building sites. These “state” loggers
recorded whether task lights were on or off to compare task light use before and after
deployment of lighting controls. The aim was to determine whether the use patterns would
change as the overhead lighting system dimmed. This methodology was not part of the initial
scope and limited the investigation of task lighting impact to two pilot sites.
The research demonstrates the relative impact of the task lights compared to the overhead
fixtures in the office. Annual usage of 15-30 kWh constitutes up to 50% of the overhead fixture
energy use. This illustrates the importance of accounting for task lights in future studies. A
change in task light behavior could easily affect the estimated energy savings/penalty of a
lighting system.
Each site varies in task lighting use. REI used less task light energy than did the Yale Building.
This could be due to differences in occupant behavior (note that the Yale Building had a small
sample size); type of work typically conducted by employees; workstation layout; balance
between open and private office; and/or occupant schedules. Table 203 provides a summary of
the annual task light energy use for both sites.
Table 23: Annual Task Light Estimated Energy Use
kWh/Fixture/Year
Measurement Period REI Yale Building
Adjusted Baseline 18.6 31.4
Out-of-Box 17.4 25.1
Designer Preference 15.6 N/A
User Preference 16.4 N/A
Despite this potential for increasing combined task and overhead lighting use, researchers
concluded that the use of task lights did not significantly change from before to after the
renovation of the lighting system at REI. Researchers did not collect data both before and after
the renovation at any other pilot site. This finding begins to alleviate concern over a
“compensating” effect that leads to increased task light usage as the Enlighted system dims the
overhead fixtures. Further analysis for a large set of task lights will bolster this conclusion.
This dataset also demonstrates the relative impact of the task lights compared to the overhead
fixtures in the office. Annual usage of approximately 30 kWh per fixture is between 20% and
50% of the overhead fixture energy use measured during the user preference period (depending

Enlighted Technical Proof of Concept
Northwest Energy Efficiency Alliance (NEEA) - 33
on whether the comparison is to fixtures in the office core or on the perimeter). This finding
illustrates the importance of accounting for task lights in future studies. A change in task light
behavior could easily affect the estimated energy savings/penalty of a lighting system.

Enlighted Technical Proof of Concept
Northwest Energy Efficiency Alliance (NEEA) - 34
6. Occupant and Contractor Surveys
6.1. Occupancy Survey Methodology
NBI developed a web-based survey instrument, which it administered multiple times during the
research. The survey contained ten questions specifically referencing perceptions of lighting in
the space during specific phases of the stepped baseline. The goal was to collect responses during
at least three phases of the research (as-is baseline, out-of-box, designer preference and user
preference).
Survey questions helped researchers compare respondents’ perceptions of lighting comfort based
on their locations within the office. Specific areas of inquiry included overall satisfaction with
the lighting system including control, glare, reactions such as burning eyes or headaches, and
other general questions.
Respondents used a five-point scale to rate their levels of agreement with six statements about
their workspace lighting including evenness of lighting; brightness; controls; gloom; room
surface brightness and daylighting.
The survey also asked respondents to evaluate various aspects of glare on another five-point
scale that included never, sometimes and always. Respondents indicated how often they
experience certain glare conditions in their personal workspaces on an average day. The
conditions included:
1. Glare reflected from work surfaces
2. Light fixture glare reflected on the computer screen
3. Window glare reflected on the computer screen
4. Direct glare from the window
5. Direct glare from fixtures
Respondents also indicated the extent to which they agreed or disagreed with statements about
lighting and controls in their personal workspaces. They rated whether the light fixtures and
controls created conditions that were distracting or annoying, if daylight without electric lighting
is suitable for working most hours of the day and if a task light is necessary to augment the light
most hours of the day.
Researchers administered surveys at all sites. At each site, both the number and the identity of
respondents differed from survey to survey. In other words, the same occupants may have taken
the survey multiple times. REI experienced excellent survey participation due to a raffle for a
$50 gift certificate awarded to one participant during each phase of the research.
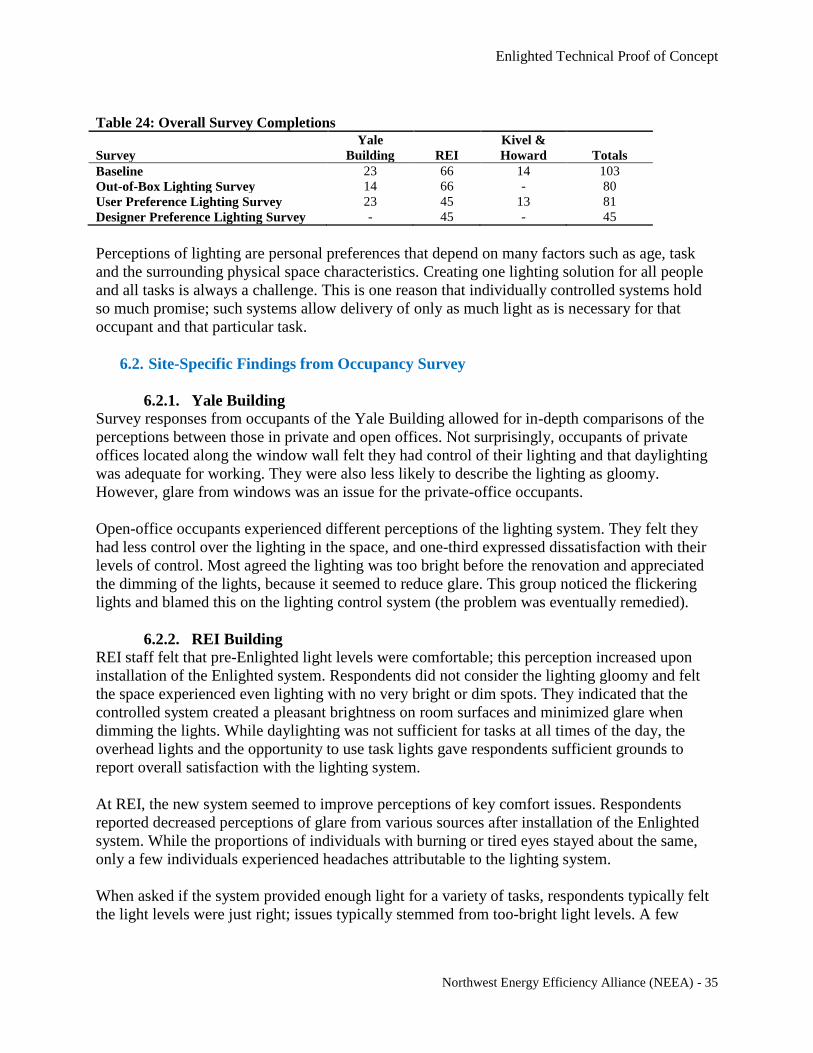
Enlighted Technical Proof of Concept
Northwest Energy Efficiency Alliance (NEEA) - 35
Table 24: Overall Survey Completions
Survey
Yale
Building REI
Kivel &
Howard Totals
Baseline 23 66 14 103
Out-of-Box Lighting Survey 14 66 - 80
User Preference Lighting Survey 23 45 13 81
Designer Preference Lighting Survey - 45 - 45
Perceptions of lighting are personal preferences that depend on many factors such as age, task
and the surrounding physical space characteristics. Creating one lighting solution for all people
and all tasks is always a challenge. This is one reason that individually controlled systems hold
so much promise; such systems allow delivery of only as much light as is necessary for that
occupant and that particular task.
6.2. Site-Specific Findings from Occupancy Survey
6.2.1. Yale Building
Survey responses from occupants of the Yale Building allowed for in-depth comparisons of the
perceptions between those in private and open offices. Not surprisingly, occupants of private
offices located along the window wall felt they had control of their lighting and that daylighting
was adequate for working. They were also less likely to describe the lighting as gloomy.
However, glare from windows was an issue for the private-office occupants.
Open-office occupants experienced different perceptions of the lighting system. They felt they
had less control over the lighting in the space, and one-third expressed dissatisfaction with their
levels of control. Most agreed the lighting was too bright before the renovation and appreciated
the dimming of the lights, because it seemed to reduce glare. This group noticed the flickering
lights and blamed this on the lighting control system (the problem was eventually remedied).
6.2.2. REI Building
REI staff felt that pre-Enlighted light levels were comfortable; this perception increased upon
installation of the Enlighted system. Respondents did not consider the lighting gloomy and felt
the space experienced even lighting with no very bright or dim spots. They indicated that the
controlled system created a pleasant brightness on room surfaces and minimized glare when
dimming the lights. While daylighting was not sufficient for tasks at all times of the day, the
overhead lights and the opportunity to use task lights gave respondents sufficient grounds to
report overall satisfaction with the lighting system.
At REI, the new system seemed to improve perceptions of key comfort issues. Respondents
reported decreased perceptions of glare from various sources after installation of the Enlighted
system. While the proportions of individuals with burning or tired eyes stayed about the same,
only a few individuals experienced headaches attributable to the lighting system.
When asked if the system provided enough light for a variety of tasks, respondents typically felt
the light levels were just right; issues typically stemmed from too-bright light levels. A few

Enlighted Technical Proof of Concept
Northwest Energy Efficiency Alliance (NEEA) - 36
occupants found the new lighting control system distracting because it dimmed or turned off
lights in their areas even when they were present.
6.2.3. Kivel & Howard Building
At Kivel & Howard, researchers also noticed a distinct split between the open office and private
office occupants. Contrary to the Yale Building findings, private-office occupants at Kivel &
Howard were less satisfied with the lighting after the retrofit. While reports of glare were fewer,
private office staff felt the new system resulted in less personal control over their lit
environments.
Open office staff at Kivel & Howard had strongly desired a reduction in the lighting levels;
therefore, they expressed overall favorable perceptions of the lighting controls. Fewer staff
experienced burning, tired eyes or headaches after the renovation. While many perceived the old
system as too bright, the new system may have created a reliance on task lights for paper tasks
such as reading and filing.
6.2.4. Comparison across All Three Buildings
After installation of the Enlighted controls, occupants generally experienced increased comfort
and satisfaction with the light levels and with their ability to control those levels. In general,
most thought the new system improved the brightness levels of fixtures originally deemed too
bright; decreased the gloominess; increased the pleasantness of the surface brightness; and
decreased glare and burning eyes and headaches (except for one site, where headaches
increased). Task lighting elicited a diversity of opinions. Most thought the system was an
improvement, but that it was too dim to complete high-light tasks, such as reading or filing. A
few found the new controls distracting when the lights turned off while they occupied the space.
Feedback on daylighting varied depending on the type of office space. Open office occupants
typically felt they have insufficient daylight, while occupants in private offices along the window
wall considered their levels of daylight sufficient.
6.3. Contractor Survey
Researchers conducted phone surveys of the installers at the three pilot sites shortly after
installation. At least one licensed electrician participated in the installations at the Yale Building
and at Kivel & Howard. At both of these sites, the installers had little, if any, familiarity with the
Enlighted system except for what they learned from the Enlighted representatives on-site during
the installations. At REI, the installer had certification under the California Non-Residential
Lighting technical standard and also had extensive experience with Enlighted systems.
REI was the only site to use Enlighted-recommended installers (from California); they had more
than two months of experience installing the system. This crew of six journeyman/technician
level (equivalent) took a total of fourteen hours for installation in the 15,000 SF study area. The
entire 79,600 SF REI Headquarters building took the same crew six days at nine hours per day.
The REI installers achieved significant economies of scale directly reflected in the cost of
installation, given that the crew lead could describe the exact process used to install the

Enlighted Technical Proof of Concept
Northwest Energy Efficiency Alliance (NEEA) - 37
Enlighted system. In addition, the REI installers successfully addressed one of their primary
concerns – cleanliness – by achieving their goal of no complaints.
The fixture itself had an impact on the ease of installation. The recessed T5HO fixture at the
Yale Building had a complex process for accessing and replacing the ballast and adding the
control system. The installer mentioned that this may have added to the time needed for
installation on the project. Installers at Fred Hutchinson noted that they would hire Enlighted-
recommended installers for all future installations instead of using campus electricians to do the
work.
The Kivel & Howard installer believed that the manufacturer’s claim of installing the Enlighted
system on two fixtures per hour is optimistic. Instead, he suggested the ballast replacement,
control and sensor installation, and delamping on one fixture would take approximately 45
minutes. He noted that adding multiple fixtures to only one controller and sensor (as in a private
office situation) took about 65 minutes. A fixture requiring replacement of shunted sockets took
about 85 minutes. The installer suspected that economies of scale could be achieved, leading to
more cost-effective installations, but noted that was not the case for this project.
At all locations, installers made efforts to avoid disturbing occupants by working either late at
night or early in the morning. However, installers at the Kivel & Howard site did work around
tenants, which may have contributed to an additional 10-20% on installation costs.
All three sites also had Enlighted staff commission the systems and provide training to the on-
site facility managers on how to make changes in the future. Despite the systems’ capabilities to
allow occupants to modify lighting levels, occupants at all sites needed to contact facility
managers to adjust lighting controls.
6.4. Fixture and Occupancy Analysis
The Enlighted system collects occupancy and estimated energy use information at the fixture
level. As part of this research, NBI used meters on individual fixtures at the Yale Building to
investigate the representation of the fixture-level information. With confidence in these results,
researchers have the unique opportunity to create “virtual meters” by aggregating a number of
fixtures into groups.
Using data from the Enlighted system, researchers developed two “virtual meters”:
Core: This meter is composed of nine fixtures. Each fixture is located in the central
portion of the office, which is an open floor plan cubicle layout.
Perimeter: This meter is composed of 12 fixtures. To account for the possible bias of
different light levels as the sun moves across the sky, researchers selected three fixtures
from each aspect of the building (north, south, east and west). Each fixture is located in a
private office.
Figure 9 below provides a high-level overview of the two meters and clearly indicates that the
perimeter offices consistently use less power than the core, although this data lacks
normalization for size.

Enlighted Technical Proof of Concept
Northwest Energy Efficiency Alliance (NEEA) - 38
Figure 9: Yale Building Average Fixture Power, Core and Perimeter
Introduction of this data may enhance the energy analysis methodology. With a consistent
measure of occupancy across a study period, researchers could, for example:
Assess the total occupancy over a multi-day measurement period. Confirm that
occupancy is within a reasonable tolerance level between comparison periods.
Determine if assumptions about weekday, weekend and holiday use are accurate. Some
offices may have more weekend activity or alternative holiday schedules.
Develop a daily regression model that relates occupancy to energy use. Apply the
regression model to energy savings projections.
Collection of this type of granular data allows the industry to bridge the gap between lighting
power density and energy use. This is critical to moving beyond lighting power density as the
standard metric for lighting energy use.
Enlighted Technical Proof of Concept
Northwest Energy Efficiency Alliance (NEEA) - 39
7. Summary / Conclusions
Measured results of this Technical Proof of Concept research reveal that the Enlighted lighting
control technology and dimming ballast can deliver significant savings at relatively low cost. The
results of the Technical Proof of Concept study align with manufacturer claims of low costs, ease
of installation and end user satisfaction, although its claims of 50-70% lighting energy savings
may be optimistic in some circumstances. Measured energy savings of the Enlighted lighting
control system over the existing baseline system ranged from 32 to 59%, although savings at the
Kivel & Howard site (32%) are also attributable to changes to the lighting system.
Total costs of the installations ranged from $1.71/SF to $3.11/SF. Hiring installers holding
California Non-Residential Lighting technical certifications with training by the manufacturer
was most cost-effective ($0.45 on the low end, compared to $1.69 per SF). The REI costs
($0.45/SF for installation and $1.26 for equipment) also benefitted because the project was part
of a retrofit of an entire building as opposed to tenant space within a larger building. Overall,
occupants seemed satisfied with their ability to control the overhead lighting. This allowed
facility managers to remove sleeves previously placed over lamps to reduce lighting levels.
Daily Consumption Profiles reveal key opportunities for savings associated with the Enlighted
system lighting controls. Enlighted lighting controls successfully shortened the amount of time
the lights were on by delaying the morning ramp-up and by turning lights off earlier at the end of
the day, based on occupancy. Reduced lighting during after-hours operation, often associated
with janitorial services, seems to be another prime energy savings opportunity with the Enlighted
system.
A comparison of daytime and nighttime Average Lighting Power Density made clear the
distinction between day and nighttime energy use. This analysis relied on the most common
lighting metric – lighting power density – calculated separately during occupied and non-
occupied hours. Savings in the Enlighted sites are more dramatic during nighttime hours than
during regular occupied weekday hours. The savings compared to existing conditions ranged
from 14 to 51% during weekdays and from 53 to 79% on weekday evenings.
Light level measurements showed a range of conditions across the three sites, with the REI
Headquarters building most likely to fall within industry standards of 35 to 55 foot-candles. The
Yale Building experienced lighting levels both much higher and much lower than industry
standards, and occupants at the Kivel & Howard site preferred lighting much lower than industry
standards.
Generally, occupants were satisfied with the Enlighted system and preferred less light than that
provided by their existing systems or even by the out-of-box Enlighted system levels. They
reported less glare and experienced fewer burning eyes and headaches after installation of the
Enlighted lighting system. However, occupants at the Yale Building experienced a flickering
situation caused by defective ballasts, not by the Enlighted system itself.
Notably, it appears that the use of task lights did not increase over the course of this study.
Researchers attempted to use data collected during the study to quantify energy use associated

Enlighted Technical Proof of Concept
Northwest Energy Efficiency Alliance (NEEA) - 40
with task lighting. They noted such energy use is significant, up to 50% of the energy use
associated with the overhead lighting system, and warrants further investigation.
Finally, this Technical Proof of Concept study allowed researchers to compare data collected by
the Enlighted system itself to that collected by meters and loggers installed on the site, including
“virtual meters” to compare groups of individual fixtures. NBI found a high degree of correlation
between these measurements and the Enlighted data.
While not part of this analysis, researchers noted the opportunity offered by Enlighted to conduct
much more detailed investigations into lighting control energy savings. For example, with the
Enlighted data, NBI can compare energy use in private offices to that in open office space, or
core to perimeter, etc. This type of analysis is advantageous as it does not require the installation
of expensive metering.
7.1. Next Steps
This Enlighted Technical Proof of Concept Study suggests additional research in the area of
highly controlled lighting systems. This research might include:
Understanding how data collected from the Enlighted system may be used to identify
patterns in highly controlled lighting use in office spaces
Correlating how these savings can extend to other systems in the building (like plugs and
HVAC)
Further quantifying the impacts of highly controlled lighting systems in order to increase
utilities’ and regulators’ confidence in their energy savings and the persistence of those
savings
Conducting a longer-duration research project to quantify the seasonal impacts of
daylighting
Better understanding task lighting and the impact of switching connected load, not
included in lighting power density calculations, to task-based lighting
Furthermore, NBI recommends that Enlighted consider adding functionality that integrates the
occupancy data collected by the system to manage HVAC systems and non-essential plug load
devices. Customers may realize even more significant savings if the occupancy information
collected by the Enlighted system is used in an integrated fashion to turn off or turn down
systems not in use. Marketing materials explaining the “Fourth Generation” Enlighted system
suggest this is possible, however this Technical Proof of Concept study did not confirm this.

Enlighted Technical Proof of Concept
Northwest Energy Efficiency Alliance (NEEA) - 41
Appendix A: Summary of Occupant Survey Results
The Enlighted Technical Proof of Concept study included occupancy surveys at each location to
determine changes in perception during project implementation. This study provides a snapshot
of conditions before, during and after the installation of the new lighting systems. The survey
findings represent feedback from the occupants within the areas affected by the changed lighting
system and constitute a key component for assessing the market potential of this new retrofit
dimming product. The survey yielded feedback on the users’ perceptions of the space lighting
and system changes. This summary addresses each building individually.
Site-Specific Findings
Yale Building
Survey responses from occupants of the Yale Building allowed for in-depth analysis comparing
the perceptions of those in private and open offices. Not surprisingly, occupants of private
offices located along the window wall felt they had control of their lighting and that daylighting
was adequate for working. They were also less likely to describe the lighting as gloomy.
However, glare from windows was an issue for the private-office occupants.
Open-office occupants experienced different perceptions of the lighting system. They felt they
had less control over the lighting in the space, and one-third expressed dissatisfaction. Most
agreed the lighting was too bright before the renovation and appreciated the dimming of the
lights, because it seemed to reduce glare. This group noticed the flickering lights and blamed this
on the lighting control system (the problem was eventually remedied).
REI Building
REI staff felt that pre-Enlighted light levels were comfortable; this perception increased upon
installation of the Enlighted system. Respondents did not consider the lighting gloomy and felt
the space experienced even lighting with no very bright or dim spots. They indicated that the
controlled system created a pleasant brightness on room surfaces and minimized glare when
dimming the lights. While daylighting was not sufficient for tasks at all times of the day, the
overhead lights and the opportunity to use task lights gave respondents sufficient grounds to
report overall satisfaction with the lighting system.
At REI, the new system seemed to improve some key comfort issues. Respondents reported
decreased perceptions of glare from various sources after installation of the Enlighted system.
While the number of individuals with burning or tired eyes stayed about the same, only a few
individuals experienced headaches attributable to the lighting system.
When asked if the system provided enough light for a variety of tasks, respondents typically felt
the light levels were just right; issues typically stemmed from too-bright light levels. A few
occupants found the new lighting control system distracting because it dimmed or turned off
lights in their areas even when they were present.

Enlighted Technical Proof of Concept
Northwest Energy Efficiency Alliance (NEEA) - 42
Kivel & Howard Building
At Kivel & Howard, researchers also noticed a distinct split between the open office and private
office occupants. Contrary to the Yale Building findings, private-office occupants at Kivel &
Howard were less satisfied with the lighting after the retrofit. While reports of glare were fewer,
private office staff felt the new system resulted in less personal control over their lit
environments.
Open office staff at Kivel & Howard had strongly desired a reduction in the lighting levels;
therefore, they expressed overall favorable perceptions of the lighting controls. Fewer staff
experienced burning, tired eyes or headaches after the renovation. While many perceived the old
system as too bright, the new system may have created a reliance on task lights for paper tasks
such as reading and filing.
Comparison across All Three Buildings
After installation of the Enlighted controls, occupants generally experienced increased comfort
and satisfaction with the light levels and with their ability to control those levels. In general,
most thought the new system improved the brightness of fixtures originally deemed too bright;
decreased the gloominess; increased the pleasantness of the surface brightness; and decreased
glare and burning eyes and headaches (except for one site, where headaches increased). Task
lighting elicited a diversity of opinions. Most thought the system was an improvement, but that it
was too dim to complete high-light tasks, such as reading or filing. A few found the new controls
distracting when the lights turned off while they occupied the space. Feedback on daylighting
varied depending on the type of office space. Open office occupants typically felt they have
insufficient daylight, while occupants in private offices along the window wall considered their
levels of daylight sufficient.
Methodology
NBI developed a web-based survey instrument to assess occupant preferences. It administered
largely the same survey multiple times to occupants at each of three sites. Researchers aimed to
collect responses during at least three of the four phases of the research (baseline, out-of-box,
designer preference and user preference).
At each site, the numbers and identities of respondents differed from survey to survey.
Additionally, some occupants may have taken the survey multiple times. Each building engaged
the occupants differently to encourage survey completion; in some cases, a supervisor directed
staff to complete the survey. REI had excellent survey participation due to a raffle for a $50 gift
certificate awarded to one participant during each phase of the research, which likely contributed
to the high number of responses.
Survey fatigue may have become an issue in this research effort. Researchers asked the same
group of individuals to complete a survey on the same topic up to four times. This may have led
some to place undue emphasis on survey topics to which they were repeatedly exposed or to
answer in manners consistent with their responses to similar surveys earlier in the study. In
addition, some may have chosen not to participate in later versions of the survey, as evidenced
by the lower number of responses for later surveys noted in Table 25.

Enlighted Technical Proof of Concept
Northwest Energy Efficiency Alliance (NEEA) - 43
Table 25: Overall Survey Completions
Survey
Yale
Building REI
Kivel &
Howard Totals
Baseline 23 66 14 103
Out-of-Box Lighting Survey 14 66 - 80
User Preference Lighting Survey 23 45 13 81
Designer Preference Lighting Survey - 45 - 45
The survey instrument (included as Appendix B to this report) included questions about:
1. Hours spent in workspace
2. Distance from outside wall
3. Type of office space (private or open)
4. Overall comfort with lighting in the building
5. Quality of the light in work areas (evenness, brightness, controllability, gloominess,
pleasantness of wall brightness, satisfaction with lighting, requests to modify lighting)
6. Glare (reflected from work surface, reflected on computer screen from fixtures)
7. Physical reactions to the lighting (e.g. burning or tired eyes, headaches)
8. Light in the primary work location that focused on light levels for various tasks (read
paper, read screens, type, filing, overall light)
9. Lighting controls (distracting, enough daylight, overall light levels)
10. Overall observations (satisfaction with light levels and ability to control light; comments
on light system appearance; operation; satisfaction with lighting system; comments on
survey)
Respondents used five-point scales to indicate the extent to which they agreed or disagreed with
a number of statements. They responded to additional questions for the workspace lighting and
lighting controls topics. For example, respondents rated their levels of agreement with various
statements about their workspace lighting, including lighting evenness; brightness; controls;
gloom; room surface brightness and daylighting. Respondents also rated their levels of
agreement with statements about the lighting and controls in their personal workspaces. They
rated whether the light fixtures and controls created distracting or annoying conditions; whether
daylight alone without electric lighting is suitable for working most hours of the day; and
whether task lights are necessary to augment the light most hours of the day.
Occupant Survey Results
This section presents the survey findings in two different ways: first the results for all surveys at
each of the three buildings, followed by a general summary of similarities among results at the
three buildings and perceptions before and after renovations.
Each of the three sites exhibits significantly different work environments. REI has an open plan;
the Yale Building has many private offices along a window wall with some interior open
workspace; and Kivel & Howard has interior open workspace separated by partitions, with
private offices along a window wall. Baseline lighting conditions also differed among the three
sites, as described earlier in this report.

Enlighted Technical Proof of Concept
Northwest Energy Efficiency Alliance (NEEA) - 44
These differences among the workspaces made aggregation of survey results infeasible. Ideally,
NBI could have analyzed all baseline responses in one combined set of responses. However,
because the respondents experience such different environments, they are answering
fundamentally different questions although the wording of the questions is the same. For
example, an individual in a private office with a paracube fixture and tinted window at Kivel &
Howard works in a significantly different environment than someone in a Yale Building glassy
private office with recessed T5 HO fixtures. As a result, this report does not combine survey
responses from different buildings; rather, it presents individual analyses for each building.
Fred Hutchinson Yale Building
The Yale Building staff answered three of the four surveys: baseline (n=23), out-of-box (n=14),
and user preference lighting (n=23). Staff reported they are typically at their workstations
between four and six hours per day; the workstations include many private offices as well as
open office areas.
When asked to rate the overall level of light during the user preference mode, about half of
respondents (52%) found the overall lighting to be comfortable, with strong distinctions between
perceptions of those in open and private offices, as seen in Figure 10. Most private-office
occupants (80%) felt the light levels were just right, compared to about one-third of open-office
occupants. However, 46% of open-office occupants found the space too dim and 23% too bright
during the out-of-box mode.
Figure 10: Yale Building: Rating of Overall Level of Light by Space Type During User
Preference Phase
Q6e. How would you rate the lighting in your workspace for the following task: Overall level of light
13%
0%
23%
52%
80%
31%35%
20%
46%
0%
10%
20%
30%
40%
50%
60%
70%
80%
90%
General (n=23) Private Office (n=10) Open Office (n=13)
Too Bright
Just Right
Too Dim

Enlighted Technical Proof of Concept
Northwest Energy Efficiency Alliance (NEEA) - 45
Respondents expressed no strong opinions regarding the light levels and ability to control the
levels in their areas. The percentage dissatisfied with the ability to control the light levels
dropped to 32% during the user preference phase from 43% prior to the installation of the
controls. Figure 11 shows differences in responses to the question “Overall, how satisfied are you
with the lighting levels and ability to control the light in your area?” during the user preference
phase, based upon where staff sits. Respondents in open office workstations were less likely to
be satisfied with their ability to control light levels in their areas than were respondents in private
offices.
Figure 11: Yale Building: Satisfaction with Lighting Controls by Space Type during User
Preference Phase
Q8. Overall, how satisfied are you with the light levels and ability to control the light level in your area?
As Figure 12 shows, approximately 50–60% of the respondents felt they could not create the
conditions they wanted with lighting controls even after installation of the new systems; they still
had to call facilities for assistance in adjusting the lighting levels.
32%
11%
46%
36%
44%
31%32%
44%
23%
0%
10%
20%
30%
40%
50%
60%
70%
80%
90%
100%
General (n=22) Private Office (n=9) Open Office (n=13)
Dissatisfied
Neutral
Satisfied

Enlighted Technical Proof of Concept
Northwest Energy Efficiency Alliance (NEEA) - 46
Figure 12: Yale Building: Lighting Controls Allow to User to Create Lighting Conditions They
Want by Phase of Research
Q3c. To what extent do you agree or disagree with the following statement about the lighting in your personal workspace:
“The light controls allow me to create the lighting conditions I want.”
A majority of respondents in the Yale Building do not feel the lighting is gloomy (52% prior to
installation of controls and 64% during the out-of-box mode). Open space occupants considered
the lighting gloomy (30%) at a higher rate than did private-office occupants (16%).
The percentage of respondents who felt room surfaces had pleasant brightness increased slightly
from 39% to 43% after installation of the new system.
In all three surveys, nearly half or more found the daylight from the windows satisfactory (52%
before controls; 64% during out-of-box mode; and 48% during the user preference mode). Not
surprisingly, this was especially true of those in private offices along the exterior window wall.
Yale Building respondents reported fewer issues with glare from lighting fixtures on computer
screens after installation of the new lighting system. Before installation, the majority of
respondents (57%) never or rarely experienced screen glare from light fixtures. The percentage
that did have issues decreased significantly from 43% to 29% in the out-of-box mode and to 26%
in the user preference mode. The user preference survey found that respondents in open offices
(80%) are considerably more likely to experience glare on computer screens than are respondents
in private offices (25%).
With regard to glare reflecting from windows, occupants in private offices are much more likely
to have glare issues (50%) than are occupants in open offices; ninety-two percent of the latter
group reported rarely or never having window glare issues on their computer screen.
57%
50%
61%
9%
21% 22%22% 21%17%
0%
10%
20%
30%
40%
50%
60%
70%
80%
90%
100%
Baseline (n=23) Out of Box(n=14) User Preference (n=23)
Disagree
Neutral
Agree

Enlighted Technical Proof of Concept
Northwest Energy Efficiency Alliance (NEEA) - 47
Table 26 summarizes the percentages of respondents who experienced particular types of glare
during various phases of research.
Table 26: Yale Building: Percentage of Respondents with Glare Issues By Phase of Research
Baseline Out-of-Box User Preference
Glare reflected from work surfaces 48% 28% 26%
Light fixture glare reflected on the computer screen 43% 29% 26%
Window glare reflected on the computer screen 35% 14% 26%
As Table 27 shows, prior to replacement of the lighting system, the majority of respondents
(73%) experienced burning or tired eyes after reading or using the computer extensively. After
installation of the new system that percentage decreased to 50%; once users could set their
preferences, that percentage decreased to forty-four percent.
After implementation of users’ abilities to set their lighting preferences, the percentage who
reported lighting-related headaches decreased to 22% from 35 percent.
Table 27: Yale Building: Light Reactions
Experienced
Burning Eyes
Experienced
Headaches
Baseline 73% 35%
Out-of-Box 50% 36%
User Preference 44% 22%
Yale Building respondents rated the lighting in their workspaces from “too bright” to “too dim”
on a five-point scale on each of five tasks: reading from a paper; reading from a computer
screen; typing on a keyboard; filing or locating papers; and overall level of light. As summarized
in or all five tasks, most felt the lighting was just right; concerns before lighting control
installation typically leaned toward perceptions of too-bright workspaces. For example, the
percentage of respondents who thought the lighting was just right for reading papers increased
from 55% before installation of controls to 64% in the user preference mode (with a dip to 43%
during out-of-box mode). The percentage who thought the lighting was too bright for reading
papers dropped from 41% before installation of controls to 9% in the user preference phase.
Conversely, the percentage who thought that the lighting was too dim for reading increased from
only 5% before installation of controls to 27% in the user preference phase.

Enlighted Technical Proof of Concept
Northwest Energy Efficiency Alliance (NEEA) - 48
Figure 13: Yale Building: Workspace Lighting for Reading from a Paper
Q6a. How do you rate the lighting in your workspace for reading from a paper?
The percentage that felt light levels for reading from a computer screen were just right increased
from 41% before installation of controls to 57% during out-of-box mode, and rose considerably
to 82% during user preference mode. Those who thought the lighting was too bright for reading
from a computer screen dropped from 55% before installation to only 14% in the user preference
phase.
Figure 14: Yale Building: Workspace Lighting for Reading from Computer Screen
Q6b. How do you rate the lighting in your workspace for reading from the computer screen?
40%43%
9%
55%
43%
64%
5%
14%
27%
0%
10%
20%
30%
40%
50%
60%
70%
80%
90%
100%
Baseline (n=22) Out of Box(n=14) User Preference (n=22)
Too Bright
Just Right
Too Dim
55%
43%
14%
40%
57%
81%
0% 0%4%
0%
10%
20%
30%
40%
50%
60%
70%
80%
90%
100%
Baseline (n=22) Out of Box (n=14) User Preference (n=22)
Too Bright
Just Right
Too Dim

Enlighted Technical Proof of Concept
Northwest Energy Efficiency Alliance (NEEA) - 49
With regard to lighting in their personal workspaces, respondents identified whether the light
fixture controls create conditions that are distracting or annoying; whether daylight alone without
electric lighting is suitable for working most hours of the day; and whether a task light is
necessary to augment the light most hours of the day.
Respondents obviously noticed the flickering lamp issue, with almost 70% agreeing in the user
preference phase that the lighting controls created a condition that was distracting or annoying,
compared to 38% during the baseline period.
Respondents had mixed reactions to the suitability of daylight alone for working most hours of
the day. During the user preference phase, occupants in private offices considered daylighting
suitable at a substantially higher rate than did those in open offices, as shown in Figure 15.
Figure 15: Yale Building: Daylight is Suitable for Working Most Hours of the Day during User
Preference Phase
Q7b: To what extent do you agree or disagree with the following statement: The daylight alone, without electric lighting, is
suitable for working most hours of the day.
Respondents’ reactions varied regarding the necessity of task lighting to augment the available
light most hours of the day. The proportions relying on task lighting before installation of the
system and after the setting of user preferences were similar (38% and 36%, respectively). The
percentages claiming not to need task lighting increased from 48% before installation to 59%
after setting of user preferences.
Yale Building Occupant Survey Conclusions
Staff at the Yale Building found their light levels to be comfortable, with mixed reactions toward
the controllability of the system. They felt that changing out the system was positive because it
55%
22%
77%
23%
33%
15%18%
44%
0%0%
10%
20%
30%
40%
50%
60%
70%
80%
90%
100%
General (n=22) Private Office (n=9) Open Office (n=13)
Disagree
Neutral
Agree
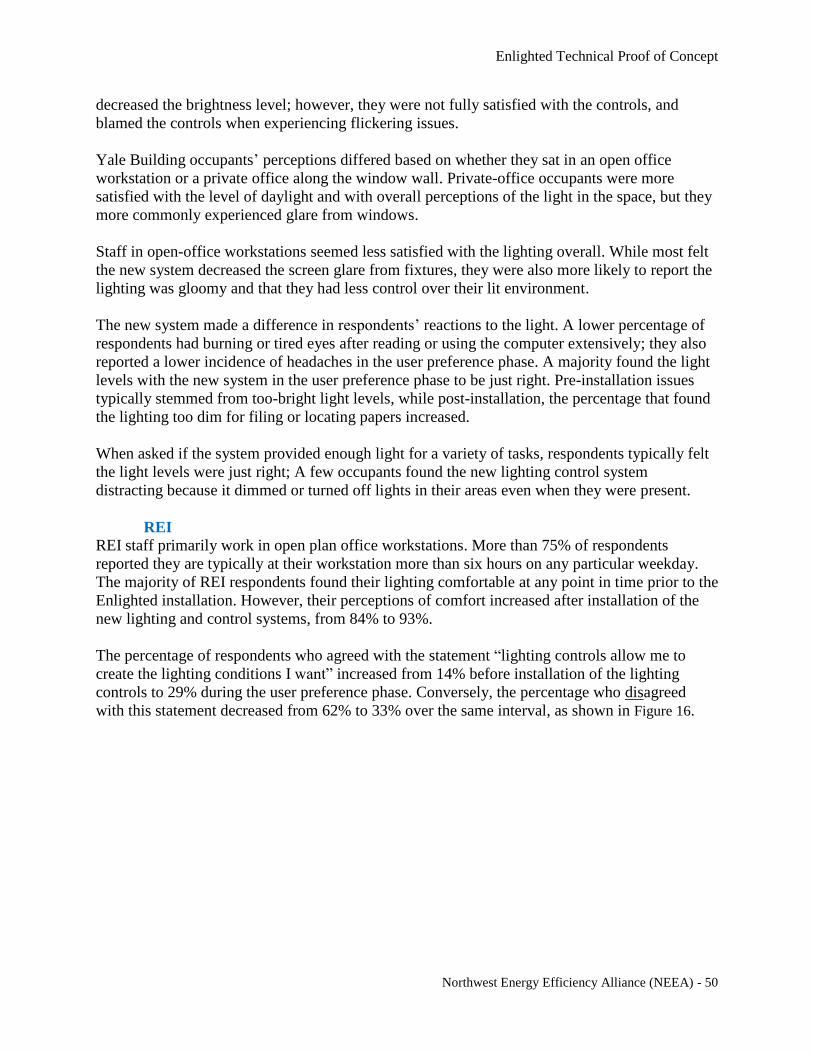
Enlighted Technical Proof of Concept
Northwest Energy Efficiency Alliance (NEEA) - 50
decreased the brightness level; however, they were not fully satisfied with the controls, and
blamed the controls when experiencing flickering issues.
Yale Building occupants’ perceptions differed based on whether they sat in an open office
workstation or a private office along the window wall. Private-office occupants were more
satisfied with the level of daylight and with overall perceptions of the light in the space, but they
more commonly experienced glare from windows.
Staff in open-office workstations seemed less satisfied with the lighting overall. While most felt
the new system decreased the screen glare from fixtures, they were also more likely to report the
lighting was gloomy and that they had less control over their lit environment.
The new system made a difference in respondents’ reactions to the light. A lower percentage of
respondents had burning or tired eyes after reading or using the computer extensively; they also
reported a lower incidence of headaches in the user preference phase. A majority found the light
levels with the new system in the user preference phase to be just right. Pre-installation issues
typically stemmed from too-bright light levels, while post-installation, the percentage that found
the lighting too dim for filing or locating papers increased.
When asked if the system provided enough light for a variety of tasks, respondents typically felt
the light levels were just right; A few occupants found the new lighting control system
distracting because it dimmed or turned off lights in their areas even when they were present.
REI
REI staff primarily work in open plan office workstations. More than 75% of respondents
reported they are typically at their workstation more than six hours on any particular weekday.
The majority of REI respondents found their lighting comfortable at any point in time prior to the
Enlighted installation. However, their perceptions of comfort increased after installation of the
new lighting and control systems, from 84% to 93%.
The percentage of respondents who agreed with the statement “lighting controls allow me to
create the lighting conditions I want” increased from 14% before installation of the lighting
controls to 29% during the user preference phase. Conversely, the percentage who disagreed
with this statement decreased from 62% to 33% over the same interval, as shown in Figure 16.
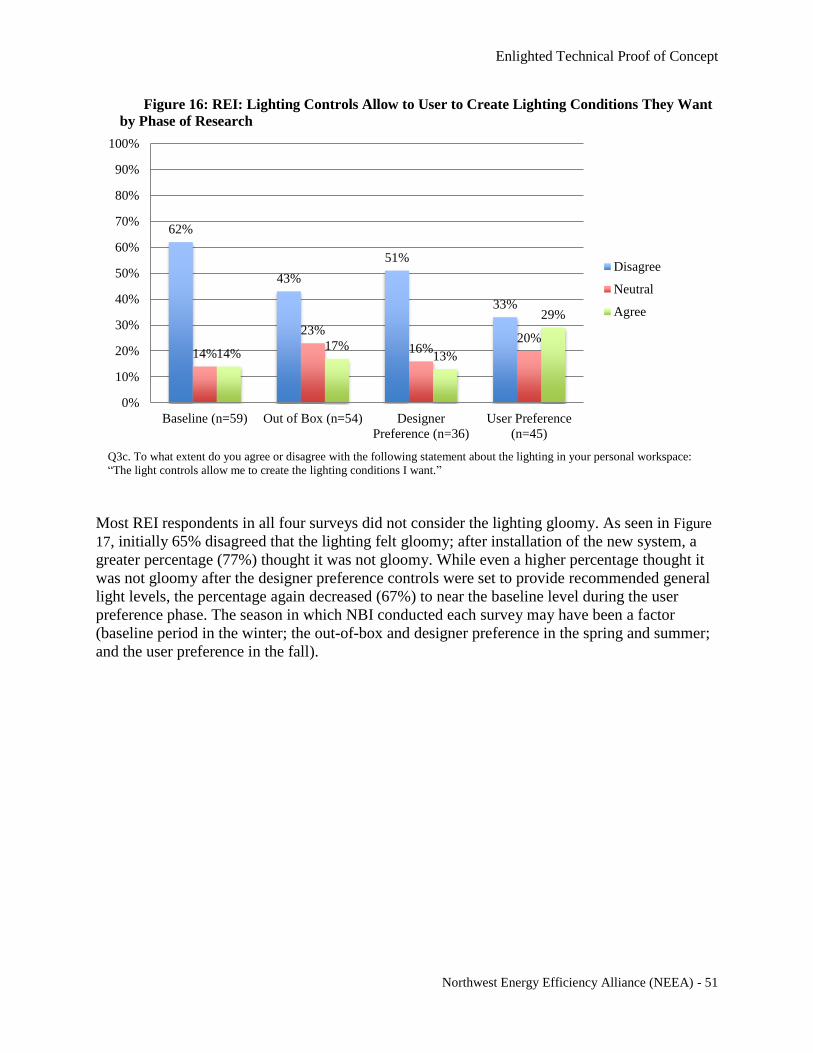
Enlighted Technical Proof of Concept
Northwest Energy Efficiency Alliance (NEEA) - 51
Figure 16: REI: Lighting Controls Allow to User to Create Lighting Conditions They Want
by Phase of Research
Q3c. To what extent do you agree or disagree with the following statement about the lighting in your personal workspace:
“The light controls allow me to create the lighting conditions I want.”
Most REI respondents in all four surveys did not consider the lighting gloomy. As seen in Figure
17, initially 65% disagreed that the lighting felt gloomy; after installation of the new system, a
greater percentage (77%) thought it was not gloomy. While even a higher percentage thought it
was not gloomy after the designer preference controls were set to provide recommended general
light levels, the percentage again decreased (67%) to near the baseline level during the user
preference phase. The season in which NBI conducted each survey may have been a factor
(baseline period in the winter; the out-of-box and designer preference in the spring and summer;
and the user preference in the fall).
62%
43%
51%
33%
14%
23%
16%20%
14%17%
13%
29%
0%
10%
20%
30%
40%
50%
60%
70%
80%
90%
100%
Baseline (n=59) Out of Box (n=54) Designer
Preference (n=36)
User Preference
(n=45)
Disagree
Neutral
Agree

Enlighted Technical Proof of Concept
Northwest Energy Efficiency Alliance (NEEA) - 52
Figure 17: REI: Lighting Feels Gloomy by Phase of Research
Q3d. To what extent do you agree or disagree with the following statement about the lighting in your personal workspace:
“The lighting feels gloomy.”
Approximately half the respondents in each survey phase agreed that the daylight from windows
in their workspace is sufficient; aside from a decline during the fourth (user preference) survey,
this percentage varied little, as shown in Figure 18. However, the percentage who disagreed that
daylight is sufficient increased from 26% at baseline to 36% in the user preference survey.
65%
77%82%
67%
17% 17%
9% 11%
18%
7% 9%
22%
0%
10%
20%
30%
40%
50%
60%
70%
80%
90%
100%
Baseline (n=65) Out of Box (n=66) Designer
Preference (n=45)
User Preference
(n=45)
Disagree
Neutral
Agree

Enlighted Technical Proof of Concept
Northwest Energy Efficiency Alliance (NEEA) - 53
Figure 18: REI: Daylight is Suitable for Working Most Hours of the Day by Phase of Research
Q7b: To what extent do you agree or disagree with the following statement: The daylight alone, without electric lighting, is
suitable for working most hours of the day.
Table 28 summarizes findings on five specific glare conditions respondents experienced in their
personal workspaces on an average day. (Figure 19 shows this same data in line graphs to show
changes over time.) Window glare reflected on the computer screen and glare direct from
windows exhibited the most substantial declines from the baseline to the user preference phase.
Table 28: REI: Percentage of Occupants Experiencing Glare
Baseline Out-of-Box
Designer
Preference
User
Preference
Glare reflected from work surfaces 36% 21% 11% 21%
Light fixture glare reflected on the
computer screen 26% 21% 20% 20%
Window glare reflected on the computer
screen 42% 31% 27% 25%
Direct from windows 43% 38% 22% 25%
Direct from fixtures 26% 23% 24% 25%
Note: Percentages responding “sometimes,” “often” or “always”
26% 24%
16%
36%
18% 17%
24%
18%
53% 55%51%
40%
0%
10%
20%
30%
40%
50%
60%
70%
80%
90%
100%
Baseline (n=65) Out of Box (n=65) Designer
Preference (n=43)
User Preference
(n=42)
Disagree
Neutral
Agree

Enlighted Technical Proof of Concept
Northwest Energy Efficiency Alliance (NEEA) - 54
Figure 19: REI: Percentage of Occupants Experiencing Glare during Each Phase
Note: Percentages responding “sometimes,” “often” or “always”
Generally, glare seemed a larger issue before the retrofit (i.e., at baseline) than it was after the
lighting controls were installed. Just less than half the respondents never considered work surface
glare a problem. Installing new fixtures and control systems and further optimizing those
controls helped address glare issues that did exist. The most notable decreases in glare issues
from the first survey to the last seen in glare direct from windows (43% to 25%); window glare
reflected on the computer screen (42% to 25%); and glare reflected from work surfaces (36% to
21%).
A large percentage of respondents in each survey experienced burning or tired eyes after reading
or using the computer extensively, with little variation among phases. The percentages of
individuals who experienced headaches attributable to the lighting system remained low
throughout the duration of the study with a slight dip during the designer preference phase.
Table 29: REI: Burning Eyes and Headaches
Experienced
Burning Eyes
Experienced
Headaches
Baseline 49% 11%
Out-of-Box 42% 9%
Designer Preference 47% 4%
User Preference 45% 10%
Respondents rated the lighting in their workspaces from too bright to too dim on a five-point
scale for five tasks: reading from a paper, reading from a computer screen, typing on a keyboard,
0%
5%
10%
15%
20%
25%
30%
35%
40%
45%
50%
Baseline Out-of-Box DesignerPreference
UserPreference
Glare reflected from worksurfaces
Light fixture glare reflectedon the computer screen
Window glare reflected onthe computer screen
Direct from windows
Direct from fixtures

Enlighted Technical Proof of Concept
Northwest Energy Efficiency Alliance (NEEA) - 55
filing or locating papers, and overall level of light. Figure 20 through Figure 24 below summarize
their ratings for pre-installation and post-installation, respectively.
The majority of respondents (62% to 80%, depending on task) deemed the post-installation light
levels just about right – substantial increases from the percentages observed for each task pre-
installation. The percentages considering the light too bright or too dim for specific tasks varied
based on the task. For respondents who had issues with light levels for filing or reading from
paper, it was typically too dim. For those who were typing or using a screen, it was typically too
bright. This may be a reflection of the difficulty associated with finding one lighting solution to
fit all people in all tasks.
Figure 20: REI: Workspace Lighting for Reading Paper
Q6a. How do you rate the lighting in your workspace for reading paper?
12% 10% 9% 7%
67%
76% 74% 74%
20%
14% 16% 18%
0%
10%
20%
30%
40%
50%
60%
70%
80%
90%
100%
Baseline (n=63) Out of Box (n=66) Designer
Preference (n=45)
User Preference
(n=44)
Too Bright
Just Right
Too Dim

Enlighted Technical Proof of Concept
Northwest Energy Efficiency Alliance (NEEA) - 56
Figure 21: REI: Workspace Lighting for Reading from Computer Screen
Q6b. How do you rate the lighting in your workspace for reading from the computer screen?
Figure 22: REI Workspace Lighting for Typing
Q6c. How do you rate the lighting in your workspace for typing?
27%24%
18%
26%
58%
67%
78%
65%
14%9%
4%9%
0%
10%
20%
30%
40%
50%
60%
70%
80%
90%
100%
Baseline (n=61) Out of Box (n=66) Designer
Preference (n=45)
User Preference
(n=45)
Too Bright
Just Right
Too Dim
7% 8%13% 15%
70%
83%80%
76%
22%
9% 7% 9%
0%
10%
20%
30%
40%
50%
60%
70%
80%
90%
100%
Baseline (n=63) Out of Box (n=66) Designer
Preference (n=45)
User Preference
(n=45)
Too Bright
Just Right
Too Dim
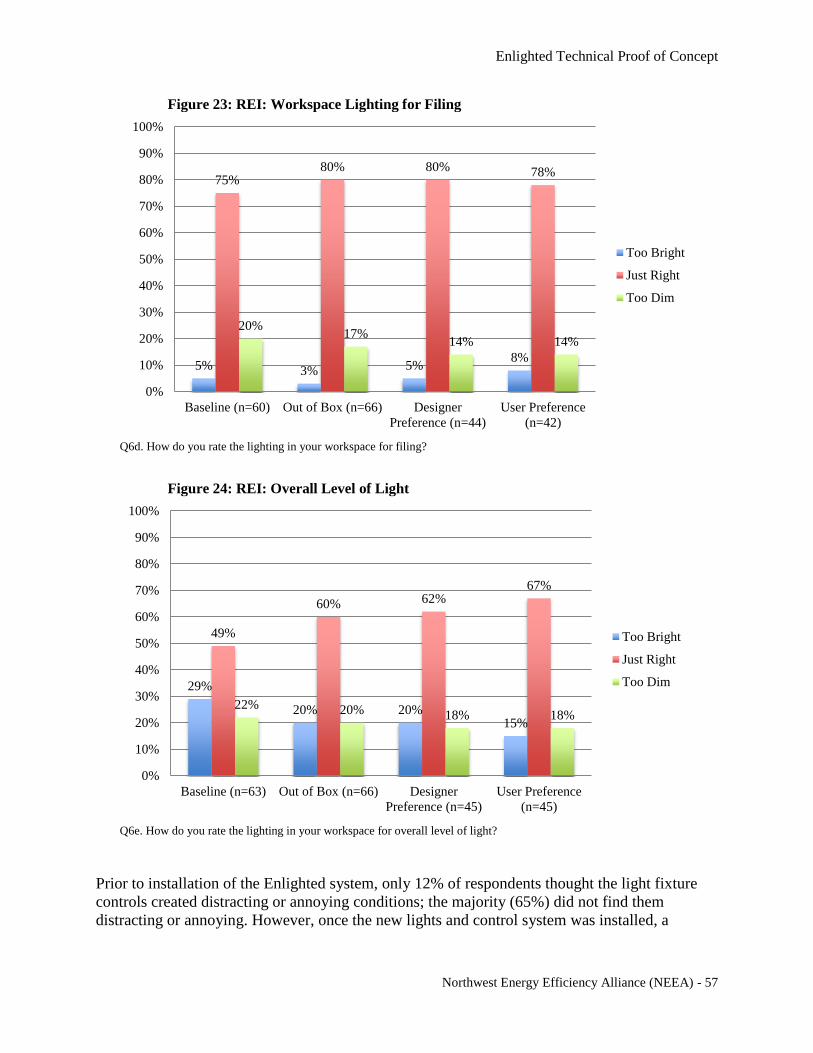
Enlighted Technical Proof of Concept
Northwest Energy Efficiency Alliance (NEEA) - 57
Figure 23: REI: Workspace Lighting for Filing
Q6d. How do you rate the lighting in your workspace for filing?
Figure 24: REI: Overall Level of Light
Q6e. How do you rate the lighting in your workspace for overall level of light?
Prior to installation of the Enlighted system, only 12% of respondents thought the light fixture
controls created distracting or annoying conditions; the majority (65%) did not find them
distracting or annoying. However, once the new lights and control system was installed, a
5% 3% 5%8%
75%80% 80% 78%
20%17%
14% 14%
0%
10%
20%
30%
40%
50%
60%
70%
80%
90%
100%
Baseline (n=60) Out of Box (n=66) Designer
Preference (n=44)
User Preference
(n=42)
Too Bright
Just Right
Too Dim
29%
20% 20%15%
49%
60% 62%67%
22% 20% 18% 18%
0%
10%
20%
30%
40%
50%
60%
70%
80%
90%
100%
Baseline (n=63) Out of Box (n=66) Designer
Preference (n=45)
User Preference
(n=45)
Too Bright
Just Right
Too Dim

Enlighted Technical Proof of Concept
Northwest Energy Efficiency Alliance (NEEA) - 58
slightly higher percentage of respondents (20%) found them distracting. Further, eight
respondents noted issues related to occupancy sensors in open-ended comments.
REI Occupant Survey Conclusions
REI respondents considered their office light levels comfortable, and even more so after
installation of the Enlighted system. While their satisfaction with their ability to control light
levels for certain conditions increased to a degree across the four surveys, it remained fairly low.
They considered their workspaces evenly lighted with no very bright or dim spots; they did not
feel brightness was an issue. Some expressed some dissatisfaction that they could not personally
control the lighting conditions.
REI respondents generally felt that the new system created a pleasant brightness on room
surfaces. Roughly 40% of respondents in the user preference phase felt daylight was sufficient to
work most hours of the day; they want task lights for when daylight is not enough. They also felt
that the new system helped alleviate glare issues.
Burning or tired eyes after extensive use affected just under half of the REI respondents, with
little change among the phases. Only small percentages experienced headaches due to the
lighting system. Respondents typically felt the system provided the right levels of light for a
variety of tasks, although some noted light that was too bright by which to file and read or type.
Kivel & Howard
Kivel & Howard staff participated in two surveys: the baseline (n=14) and user preference
(n=13). Staff reported they are typically at their workstations more than six hours. The
workstations include a few open plan offices with partitions, with most occupants in closed
offices.
Impressions of lighting comfort improved slightly post-installation of the new system. Initially,
over half (57%) felt the lighting was not comfortable; after installation of the new system, 62%
felt the lighting was comfortable. Most open plan occupants (80%) found the lighting
comfortable; a lower proportion in private offices (50%) considered the lighting comfortable
during the user preference phase.
Over 60% of respondents remained dissatisfied with the light levels and with their ability to
control the levels in their areas, both initially and after installation of the lighting new system. As
seen in Figure 25 below, those in private offices are considerably more dissatisfied (87%) with
their ability to control lights than those in open office space (20% dissatisfied). This may be
because private office occupants originally had switches with gave them complete control even
before installation of the lighting controls.

Enlighted Technical Proof of Concept
Northwest Energy Efficiency Alliance (NEEA) - 59
Figure 25: Kivel & Howard Satisfaction with Lighting Control
Q8. Overall, how satisfied are you with the light levels and ability to control the light level in your area?
The percentage that considered the fixtures too bright decreased substantially between the two
surveys (from 43% to 23%), as Figure 26 shows; the reverse also held true, in that the percentage
who disagreed the fixtures were too bright increased from 43% to 69% from the baseline to the
user preference survey.
62%
87%
20%23%
17%
40%
15%
0%
40%
0%
10%
20%
30%
40%
50%
60%
70%
80%
90%
100%
General (n=13) Private Office (n=5) Open Office (n=8)
Dissatisfied
Neutral
Satisfied

Enlighted Technical Proof of Concept
Northwest Energy Efficiency Alliance (NEEA) - 60
Figure 26: Kivel & Howard: Light in Primary Workstation: Fixture Brightness
Q3b. To what extent do you agree or disagree with the following statements about the lighting: The light fixtures are too bright.
During the baseline period, most Kivel & Howard respondents (64%) felt the light controls did
not allow them to create the desired lighting conditions; this perception remained after
installation of the new lighting system, with 62% disagreeing with the statement “the lighting
controls allow me to create the lighting conditions I want.” Perceptions diverged between those
in private offices and in open workstations. Open office staff was more likely to feel (40%) they
could create their desired lighting conditions, whereas staff in private offices (71%) did not feel
they could create the conditions they wanted.
43%
69%
14%
8%
43%
23%
0%
10%
20%
30%
40%
50%
60%
70%
80%
Baseline (n=14) User Preference (n=13)
Disagree
Neutral
Agree

Enlighted Technical Proof of Concept
Northwest Energy Efficiency Alliance (NEEA) - 61
Figure 27: Kivel & Howard Satisfaction with Lighting Control
Q3c, To what extent do you agree or disagree with the following statements about the lighting: The lighting controls allow me to
create the conditions that I want.
After installation of the new lighting system, the percentage indicating that the lighting did not
feel gloomy increased from 36% (prior to installation) to 54%. 80% of staff in open workstations
disagreed that “the lighting feels gloomy,” whereas just over half (57%) of staff in private offices
agreed with that statement.
Pre-installation, a substantial proportion of respondents (43%) disagreed with the statement “the
room surfaces have a pleasant brightness.” This percentage changed little post-installation
(39%). Similarly, the percentages that disagreed with this statement moved only a few points
(21% pre-installation and 15% post-installation).
The new lighting system led to a slight decrease in the percentage that considered daylight from
the windows in their workspaces satisfactory, from 36% to 31%. Most respondents pre-
installation (64%) had no issues with glare reflected from the work surface; only 7% always had
such an issue, while 29% mentioned it sometimes is a concern. The second survey did not
include this question.
Glare on computer screens from overhead light fixtures was a moderate issue both before after
installation of the new system. Before the installation, 29% of respondents sometimes
experienced glare from light fixtures and 7% always experienced glare. After the installation,
23% sometimes experienced glare from fixtures on computer screens. The percentage that never
or rarely experienced glare on computer screens increased from 64% before installation to 77%
after.
62%
71%
40%
0% 0% 0%
15%
0%
40%
23%
29%
20%
0%
10%
20%
30%
40%
50%
60%
70%
80%
General (n=13) Private Office(n=5) Open Office (n=8)
Disagree
Neutral
Agree
Not Applicable

Enlighted Technical Proof of Concept
Northwest Energy Efficiency Alliance (NEEA) - 62
None of those in open workstations found direct glare from the window an issue, as they had no
windows. However, 83% of staff in private offices reported instances of glare from the window
reflected on their computer screen.
Table 30: Kivel & Howard: Glare Is an Issue Sometimes, Often or Always
Baseline User Preference
Glare reflected from work surfaces 36% -
Light fixture glare reflected on the computer screen 36% 23%
Window glare reflected on the computer screen 7% 25%
Direct from window 14% -
Direct from fixtures 43% -
After installation of the new system, the percentage of Kivel & Howard respondents claiming
burning or tired eyes after reading or using the computer extensively dropped from 64% to 54%.
However, the percentage claiming they experienced headaches increased from 29% to 39%.
Respondents’ perceptions of the workspace task illumination is summarized in the figures below.
Figure 28: Kivel & Howard: Workspace Lighting for Reading Paper
Q6a: How do you rate the lighting in your workspace for reading from paper.
43%
8%
29%
42%
29%
50%
0%
10%
20%
30%
40%
50%
60%
70%
80%
90%
100%
Baseline (n=14) Designer Preference (n=11)
Too Bright
Just Right
Too Dim
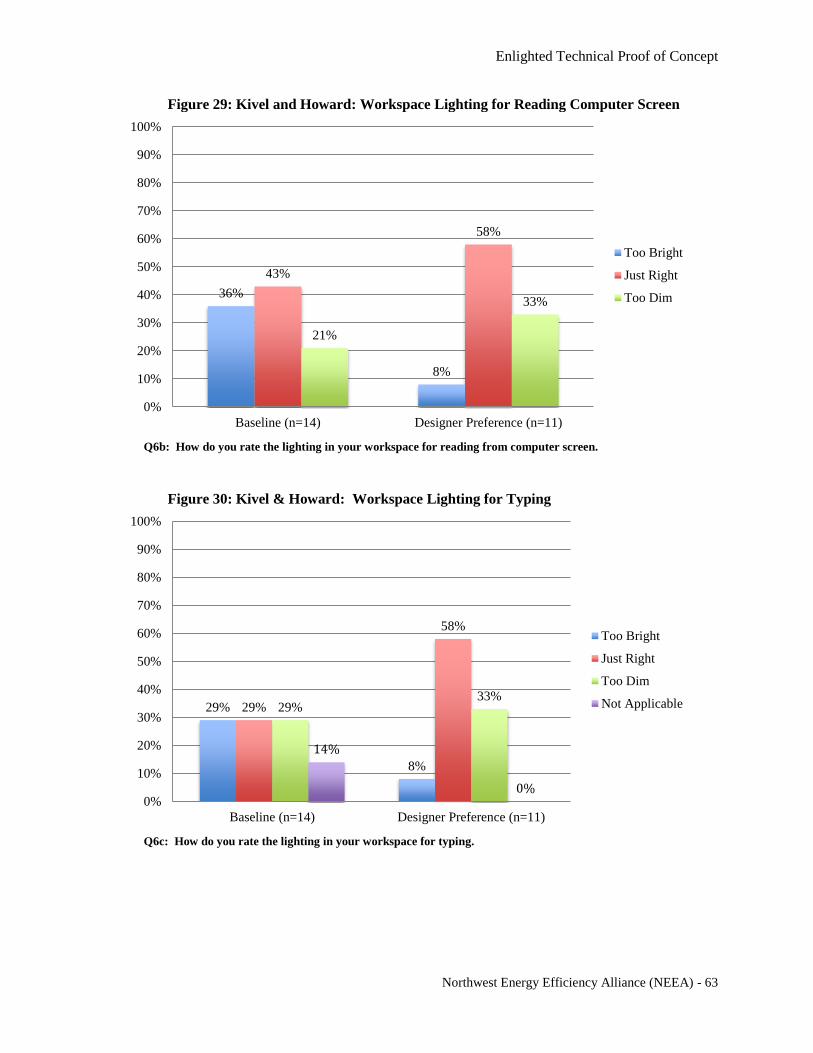
Enlighted Technical Proof of Concept
Northwest Energy Efficiency Alliance (NEEA) - 63
Figure 29: Kivel and Howard: Workspace Lighting for Reading Computer Screen
Q6b: How do you rate the lighting in your workspace for reading from computer screen.
Figure 30: Kivel & Howard: Workspace Lighting for Typing
Q6c: How do you rate the lighting in your workspace for typing.
36%
8%
43%
58%
21%
33%
0%
10%
20%
30%
40%
50%
60%
70%
80%
90%
100%
Baseline (n=14) Designer Preference (n=11)
Too Bright
Just Right
Too Dim
29%
8%
29%
58%
29%33%
14%
0%0%
10%
20%
30%
40%
50%
60%
70%
80%
90%
100%
Baseline (n=14) Designer Preference (n=11)
Too Bright
Just Right
Too Dim
Not Applicable

Enlighted Technical Proof of Concept
Northwest Energy Efficiency Alliance (NEEA) - 64
Figure 31: Kivel & Howard: Workspace Lighting for Filing
Q6d: How do you rate the lighting in your workspace for reading from paper.
Figure 32: Kivel & Howard: Amount of Light Overall
Q6e: How do you rate the lighting in your workspace for overall lighting.
After installation of the new system, open office staff generally considered the lighting levels
just right (60%), whereas private office staff more commonly found the new systems light levels
to be too dim (50%).
36%
8%
36%
50%
21%
42%
7%
0%0%
10%
20%
30%
40%
50%
60%
70%
80%
90%
100%
Baseline (n=14) Designer Preference (n=12)
Too Bright
Just Right
Too Dim
Not Applicable
50%
17%
29%
42%
21%
42%
0%
10%
20%
30%
40%
50%
60%
70%
80%
90%
100%
Baseline (n=14) Designer Preference (n=11)
Too Bright
Just Right
Too Dim

Enlighted Technical Proof of Concept
Northwest Energy Efficiency Alliance (NEEA) - 65
Around half (54%) of respondents felt the installation of the new lighting system led to
conditions that were distracting or annoying; only 21% felt this way prior to installation of the
new system.
Kivel & Howard Occupant Survey Summary
Over half of Kivel & Howard respondents found the light levels comfortable post-installation.
Over half claimed dissatisfaction with lighting controls post-installation, in particular those in
private offices. Private office occupants were typically not satisfied with the lighting system
controls because prior to installation they felt better able to create the lighting conditions that
they desired.
Reports of glare from fixtures decreased from 36% before controls to 23% post-installation. The
percentage with burning or tired eyes after reading or using the computer extensively also
decreased post-installation, while the percentage reporting headaches attributable to the lighting
system increased. The percentages finding lighting levels for a variety of tasks “just right”
increased across the board post-installation – although the percentages finding the lighting levels
“too bright” decreased for all tasks. In addition, 54% found the controls after installation of the
new system to be distracting, as opposed to 21% who felt the lighting controls were distracting
prior to installation.
Summary across the Three Sites
Open office staff tended to be more comfortable with the lighting controls than private office
staff. The open office respondents also tend to be more satisfied with the light levels and with
their ability to control the light levels, even when the facilities group has to implement the
controls. In general, respondents thought that the new system improved the brightness levels of
the fixtures originally deemed too bright; decreased the gloominess; increased the pleasantness
of the surface brightness; and decreased glare and burning eyes. Open office space occupants
typically do not feel they have enough daylight, while private office staff does. Most considered
the Enlighted system an improvement, but felt the light levels from overhead lighting were too
dim to complete high-light tasks such as reading or filing.

Enlighted Technical Proof of Concept
Northwest Energy Efficiency Alliance (NEEA) - 66
Appendix B: Occupant Survey Instrument
The occupant survey instrument follows on the next four pages.

Enlighted Technical Proof of Concept
Northwest Energy Efficiency Alliance (NEEA) - 67

Enlighted Technical Proof of Concept
Northwest Energy Efficiency Alliance (NEEA) - 68

Enlighted Technical Proof of Concept
Northwest Energy Efficiency Alliance (NEEA) - 69

Enlighted Technical Proof of Concept
Northwest Energy Efficiency Alliance (NEEA) - 70

Enlighted Technical Proof of Concept
Northwest Energy Efficiency Alliance (NEEA) - 71
Appendix C: Contractor Survey Instrument
The contractor survey consisted of the following 15 questions:
1. On what date(s) did the installation take place?
2. How long did it take?
3. How many individuals were involved in the installation?
4. What training or qualifications did each person involved in the installation have?
(journeyman, technician, etc.) Are they union members?
5. Did the installation happen before office hours or while the office was occupied?
6. Was there any down time for the office occupants?
7. Did the occupants express any concerns during the installation?
8. Please describe the steps involved in the installation. Did you identify some steps in the
process that made the installation go more quickly?
9. Did you re-lamp the office during the installation? What is the make and model of the lamps?
10. Please describe your familiarity with the product before the installation.
11. What training did the manufacturer provide?
12. Did the Enlighted system require any special programming? If so, please describe.
13. Have you received any call backs on the installation?
14. Can you please describe the process for estimating the costs associated with the installation?
It would be helpful if you could include all of the factors that were considered in the
estimates. Based on experience with the install, could you reduce or eliminate some of the
costs that were originally anticipated?
15. What was the cost of the system for:
a. Equipment?
b. Installation labor?

Enlighted Technical Proof of Concept
Northwest Energy Efficiency Alliance (NEEA) - 72
Appendix D: Light Level Measurements
At all project sites, researchers took light level measurements at various phases of the project.
The numbers represent the foot-candle readings taken at the time and location indicated on the
particular figure. General results are summarized below.
Yale Building Light Level Measurements
The Yale Building Light Level Measurements appear in the figures that follow. The
measurements show a high degree of variability, specifically the difference between private
offices along the exterior window wall and the interior open offices. Some private offices had
task lights on, while others had them off, and some had shades drawn. From the measurements,
the importance of daylighting on sunny days is notable with very high light level readings on
sunny days.
Figure 33: Yale Building Light Levels during As-Is Baseline

Enlighted Technical Proof of Concept
Northwest Energy Efficiency Alliance (NEEA) - 73
Figure 34: Yale Building Light Levels during Construction Period
Figure 35: Yale Building Light Levels during Out-of-Box Phase
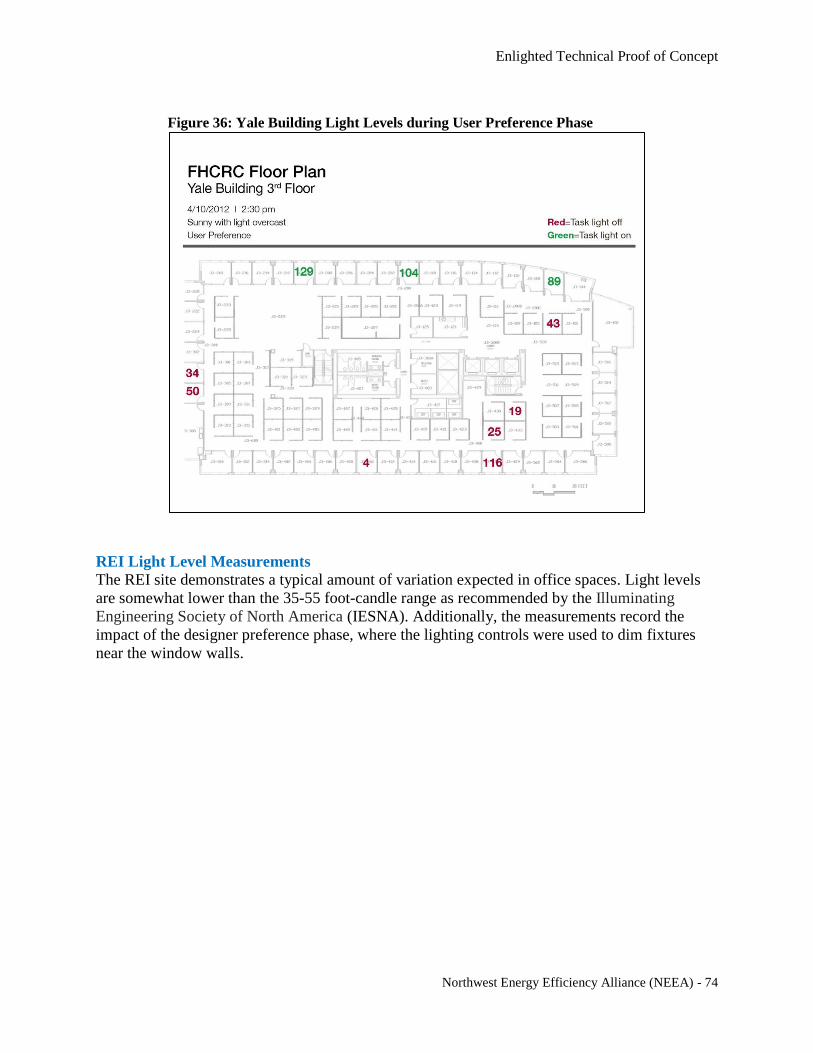
Enlighted Technical Proof of Concept
Northwest Energy Efficiency Alliance (NEEA) - 74
Figure 36: Yale Building Light Levels during User Preference Phase
REI Light Level Measurements
The REI site demonstrates a typical amount of variation expected in office spaces. Light levels
are somewhat lower than the 35-55 foot-candle range as recommended by the Illuminating
Engineering Society of North America (IESNA). Additionally, the measurements record the
impact of the designer preference phase, where the lighting controls were used to dim fixtures
near the window walls.

Enlighted Technical Proof of Concept
Northwest Energy Efficiency Alliance (NEEA) - 75
Figure 37: REI Light Levels during As-Is Baseline
Figure 38: REI Light Level Measurements during Adjusted Baseline Phase
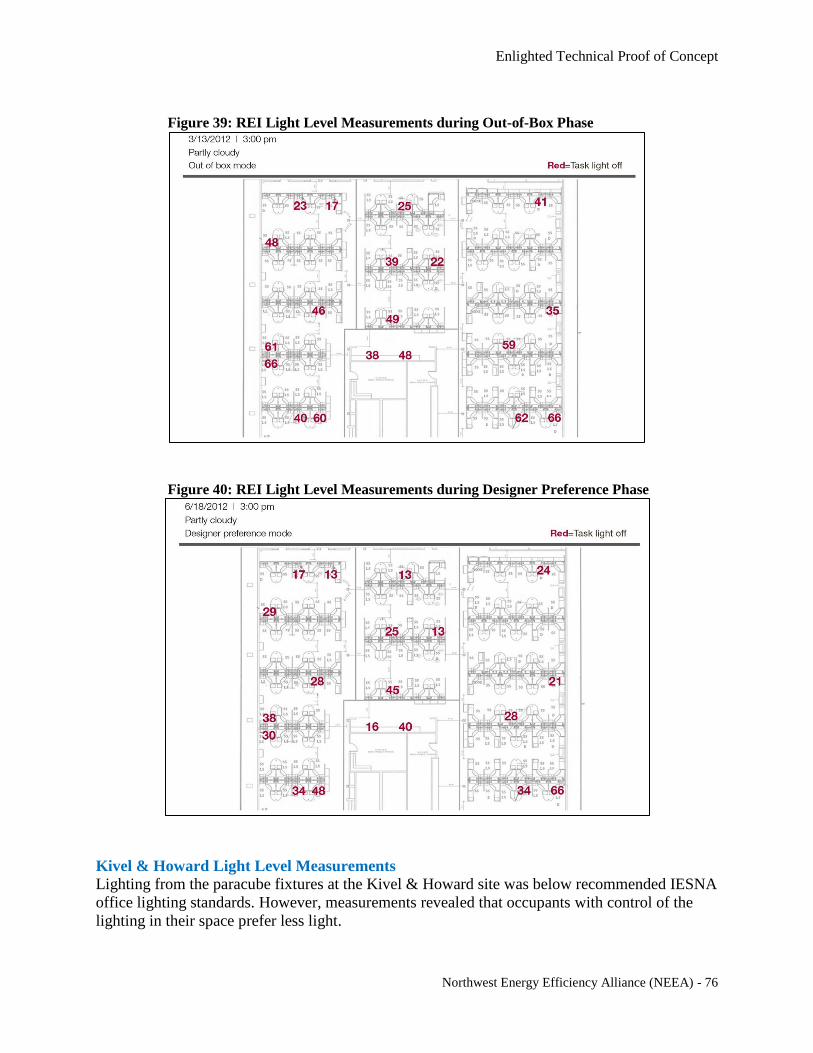
Enlighted Technical Proof of Concept
Northwest Energy Efficiency Alliance (NEEA) - 76
Figure 39: REI Light Level Measurements during Out-of-Box Phase
Figure 40: REI Light Level Measurements during Designer Preference Phase
Kivel & Howard Light Level Measurements
Lighting from the paracube fixtures at the Kivel & Howard site was below recommended IESNA
office lighting standards. However, measurements revealed that occupants with control of the
lighting in their space prefer less light.

Enlighted Technical Proof of Concept
Northwest Energy Efficiency Alliance (NEEA) - 77
Figure 41: Kivel & Howard Light Level Measurements during Out-of-Box Phase
Figure 42: Kivel & Howard Light Level Measurements during Occupant Preference
Phase
Summary of Light Level Measurements
Instantaneous light level measurements provide a snapshot of lighting levels at a certain moment
in time. Researchers took ten light level readings during the Enlighted study, including four at
the Yale Building, four at REI and two at Kivel & Howard.

Enlighted Technical Proof of Concept
Northwest Energy Efficiency Alliance (NEEA) - 78
Industry standards suggest that lighting levels for office spaces allow for 35-55 foot-candles. The
REI site was the most likely to be in this range with a typical amount of variation across the
space. The Yale Building had a high degree of variation likely due to a high level of daylighting
available (weather dependent) in private offices from external windows. Conversely, light levels
in the Kivel & Howard office were lower than industry standard recommendations, at the request
of the occupants, who indicated that they preferred less light. Table 31 below provides a summary
of the light level measurements by phase.
Table 31: Summary of Instantaneous Light Level Measurements by Site and Phase of Research
Yale Building REI Kivel & Howard
Baseline 9-104 foot-candles 15-56 foot-candles -
Adjusted Baseline - 17-53 foot-candles -
Out-of-Box 2-50 foot-candles 17-66 foot-candles 16-34 foot-candles
Designer Preference - 13-66 foot-candles -
User Preference 4-129 foot-candles - 6-35 foot-candles

Enlighted Technical Proof of Concept
Northwest Energy Efficiency Alliance (NEEA) - 79
Appendix E: Task Lighting Analysis Yale Building Task Lighting Analysis
After the adjusted baseline phase of the research, NEEA and NBI agreed to add a task to study
the task-level light use at the Yale Building. Researchers installed on/off loggers on 25% of the
task lights in the space. However, due to the late addition of the task, researchers only collected
baseline data at the REI site. This obviously limits the applicability of the comparisons.
Task light data was further reduced due to data logging errors, and a number of data loggers that
were removed from the site during the study and could not be recovered (presumably the
occupants removed the loggers, unaware of the ongoing study).
Eleven sensors provided on/off data. Data collection began on 11/28/2011 with inconsistent end
dates among the sensors, ranging from 1/12/2012 to 4/30/2012. Fortunately, the available data
does cover the two measurement periods of Adjusted Baseline and Out-of-Box, and resulted in
44 days of data collection.
Researchers converted each of the on/off measurements to an estimated measure of power,
reported in watts. This estimate assumes that each task light is 25 watts. The following collection
of plots provides an overview of the activity on each sensor. Each plot presents the average
watts/day recorded by each data logger. This collection of data illustrates a significant diversity
of behavior. Figure 43 summarizes typical observations in multiple graphs.
Figure 43: Representative Task Light Use Patterns and Daily Energy Estimates
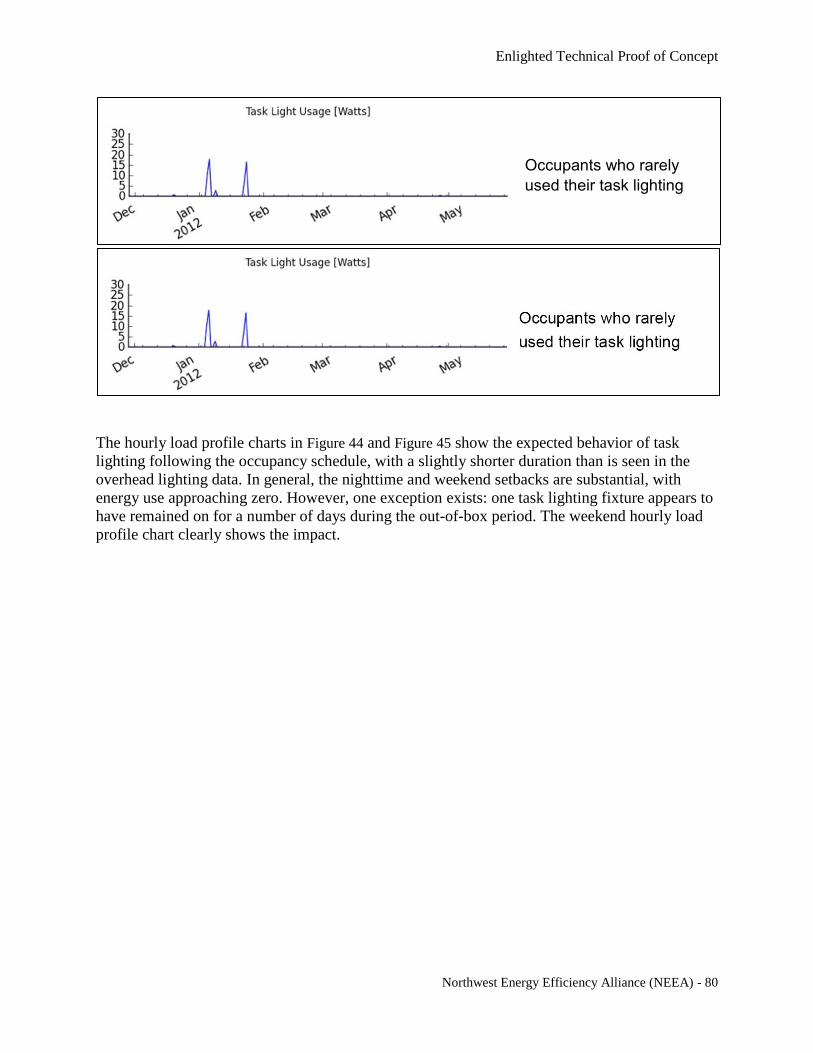
Enlighted Technical Proof of Concept
Northwest Energy Efficiency Alliance (NEEA) - 80
The hourly load profile charts in Figure 44 and Figure 45 show the expected behavior of task
lighting following the occupancy schedule, with a slightly shorter duration than is seen in the
overhead lighting data. In general, the nighttime and weekend setbacks are substantial, with
energy use approaching zero. However, one exception exists: one task lighting fixture appears to
have remained on for a number of days during the out-of-box period. The weekend hourly load
profile chart clearly shows the impact.
Occupants who rarely
used their task lighting

Enlighted Technical Proof of Concept
Northwest Energy Efficiency Alliance (NEEA) - 81
Figure 44: Yale Building Weekday Hourly Load Profile
Figure 45: Yale Building Weekend Hourly Load Profile

Enlighted Technical Proof of Concept
Northwest Energy Efficiency Alliance (NEEA) - 82
To better quantify the energy impact of these task lights, researchers calculated an estimated
annual usage. Table 32 below presents these results twice, both including and excluding Fixture 4
(the errant fixture that remained on for multiple days).
Due to the small sample size of eleven fixtures (out of approximately 100 task light fixtures in
the study area), the impact of any single fixture is significant. Unfortunately, insufficient data
exists to establish a strong conclusion as to the relative change (if any) in task light usage
between the two measurement periods. The available data does appear to indicate that no
significant change in task light use occurred between the adjusted baseline and out-of-box
periods. This begins to alleviate concern of a “compensating” effect that leads to increased task
light usage as the Enlighted system dims overhead fixtures. Further analysis for a large set of
task lights will bolster this conclusion.
This dataset also demonstrates the relative impact of the task lights compared to the overhead
fixtures in the office. Annual usage of approximately 30 kWh per fixture is approximately 20%
to 50% of the overhead fixture energy use measured during the user preference period
(depending on whether the comparison is to fixtures in the office core or on the perimeter). This
illustrates the importance of accounting for task lights in future studies. A change in task light
behavior could easily affect the estimated energy savings/penalty of a lighting system. It also
identified a significant lighting load currently not addressed by a system such as Enlighted.
Table 32: Yale Building Annual Task Light Energy Use per Fixture
With Fixture 4* Without Fixture 4
kWh/Fixture/Year
Adjusted Baseline 31.1 31.4
Out-of-Box 33.7 25.1
*Note: Fixture 4 remained on for multiple days during the out-of-box period. Due to the small sample size, this has a
significant impact on the energy use estimates.
REI Building Task Lighting Analysis Researchers collected task light data for a sample of task lights in the REI office space. Loggers
provided on/off data for 41 sensors between 1/30/2012 and 10/1/2012. This logging period
covers the adjusted baseline, out-of-box, designer preference and user preference stages of
research. Researchers converted each of the on/off measurements to an estimated measure of
power, reported in watts. This estimate assumes that each task light is 25 watts.
The hourly load profile charts in Figure 46 and Figure 47 show the expected behavior of task
lighting following the occupancy schedule, with a slightly shorter schedule than that seen in the
overhead lighting data – especially during the adjusted baseline period when overhead lighting is
not well-controlled. The nighttime and weekend task light setbacks are substantial, with average
energy use below 1W per fixture. The average power calculation is the average reading of all 41
metered task lights at any given hour. Another way to think of this chart is as a depiction of how
many task lights are on at any given time, averaged across a number of days. For example, if all
41 were on every weekday at 11:00 AM, the average power for that hour would be 25W. If ten
lights (or 25% of the metered fixtures) were on every weekday at 11:00 AM, the average power
would be 6W. Although the behavior of each fixture may vary from day to day and hour to hour,

Enlighted Technical Proof of Concept
Northwest Energy Efficiency Alliance (NEEA) - 83
the aggregate of all 41 fixtures over a number of days represents a very consistent and repeatable
pattern.
Figure 46 and Figure 47 show a minor trend between the different measurement periods in the
weekday load profile. There is a reduction of about 1W in daytime task light use between the
adjusted baseline period and the user preference period. While this difference may possibly be
negligible, it may also be due to increasing daylight availability as the seasons change from
winter through early fall.
Figure 46: REI Weekday Hourly Load Profile

Enlighted Technical Proof of Concept
Northwest Energy Efficiency Alliance (NEEA) - 84
Figure 47: REI Weekend Hourly Load Profile
To better quantify the energy impact of these task lights, researchers calculated an estimated
annual usage. Table 33 below presents these results. This calculation uses the average weekday
energy use and average weekend/holiday energy use, with an assumption of ten holidays per
year.
Table 33: REI Building Annual Task Light Energy Use per Fixture
kWh / Fixture / Year
Measurement Period Count Mean Std. Dev. Max
Adjusted Baseline 41 18.6 24.9 77.9
Out-of-Box 41 17.4 21.3 59.8
Designer Preference 41 15.6 20.0 53.4
Occupant Preference 41 16.4 21.3 64.7
Figure 48 provides a more detailed perspective of this calculation. To develop this histogram,
researchers used the previously discussed methodology to calculate the annual energy use (kWh)
for each task light. Then researchers used the distribution of annual kWh among different task
lights to generate a histogram. Across all phases of the monitoring period, the majority of task
lights are seldom used, with annual energy use estimates of less than 5 kWh. This group heavily
influences the mean energy use of approximately 16kWh. When task lights are more frequently
used, their annual energy is commonly in the range of 30-60 kWh. The large range of usage

Enlighted Technical Proof of Concept
Northwest Energy Efficiency Alliance (NEEA) - 85
demonstrates the influence of behavior, and possibly workstation location and job function, on
energy use.
Figure 48: REI Estimated Annual Task Light Energy Use Histogram
Task Light Summary This dataset demonstrates the relative impact of the task lights compared to the overhead fixtures
in the office. Annual usage of approximately 15-30 kWh constitutes up to 50% of the overhead
fixture energy use. This illustrates the importance of accounting for task lights in future studies.
A change in task light behavior could easily affect the estimated energy savings/penalty of a
lighting system. This dataset also identified a significant lighting load currently not addressed by
a system such as Enlighted. In addition, REI used less task light energy than did Fred
Hutchinson; this could be due to differences in occupant behavior (note that Fred Hutchinson had
a small sample size), type of work typically conducted by employees, workstation layout,
balance between open and private offices, and/or in occupant schedules. Table 34 provides a
summary of the annual task light energy use for both sites.
Table 34: Annual Task Light Energy Use Summary for Yale Building and REI
kWh/Fixture/Year
Measurement Period REI Fred Hutchinson
Adjusted Baseline 18.6 31.4
Out-of-Box 17.4 25.1
Designer Preference 15.6 N/A
User Preference 16.4 N/A

Enlighted Technical Proof of Concept
Northwest Energy Efficiency Alliance (NEEA) - 86
Appendix E: Additional Data Analysis: Fixture and Occupancy Data
Yale Building Fixture-Level Data Analysis
The Yale building presented a unique opportunity to explore detailed fixture-level data, which
provide 15-minute-increment analyses of the energy use at each fixture. Enlighted provided a
period of detailed system data that includes a measurement of both power and occupancy for
each of the Enlighted sensor locations. To provide a degree of redundancy, NBI also installed a
stand-alone Hobo U12 data logger on a single light fixture. Since researchers can analyze energy
use at such a granular level, they are able to create “virtual meters” by aggregating a number of
fixtures into groups. In this analysis, virtual meters help to assess the different energy use
patterns seen in private perimeter offices, and in a centrally located open office area.
Before delving deeper into the power monitoring data collected by the Enlighted system,
researchers conducted a brief analysis to evaluate the data quality. A stand-alone data logger
collected data on power at a single fixture. The Enlighted system used a map of the physical
location to identify and collect energy use data. Figure 49 below presents power logging data
from both the NBI data logger and from the Enlighted system for a four-day period; Figure 49
shows that the two measurements are in very close agreement. The coefficient of determination,
or R2 value, provides an additional measure of agreement between the two datasets. Over this
four-day period, R2 is 0.98, indicating a very close fit. The REI site had similar results.

Enlighted Technical Proof of Concept
Northwest Energy Efficiency Alliance (NEEA) - 87
Figure 49: Comparison of Single Fixture Energy Metering
Another means of comparison is to relate the total energy use recorded by the Enlighted system
to that metered at the circuit level by NBI. Figure 50 and Figure 51 present this information for the
portion of the “user preference” period after new ballast installation (currently the only time
period for which Enlighted data is available). The two datasets exhibit close agreement, with
slightly higher energy use recorded by the NBI metering. This discrepancy is most likely due to
the circuit configuration in the building: a few non-lighting loads may be included on the lighting
circuit, or egress or other fixtures that are not part of the Enlighted system may be present. The
Hourly Power Density chart indicates that most of the discrepancy occurred during unoccupied
periods. An Enlighted representative also indicated this difference may be due to the calibration
of the Enlighted power monitoring hardware. The newest generation of the system now uses
different hardware that is reputedly more accurate.

Enlighted Technical Proof of Concept
Northwest Energy Efficiency Alliance (NEEA) - 88
Figure 50: Daily kWh for Yale Building – Comparison of NBI and Enlighted Metering
Figure 51: Weekday Hourly Load Profile for Yale Building - Comparison of
NBI and Enlighted Metering

Enlighted Technical Proof of Concept
Northwest Energy Efficiency Alliance (NEEA) - 89
Using power data from the Enlighted system, researchers developed two “virtual meters”:
Core: this meter is comprised of nine fixtures. Each fixture is located in the central
portion of the office, which is an open floor plan cubicle layout.
Perimeter: This meter is composed of 12 fixtures. To account for the possible bias of
different light levels as the sun moves across the sky, researchers selected three fixtures
from each aspect of the building (north, south, east and west). Each fixture is located in a
private office.
Figure 52 below provides a high-level overview of the two meters, showing that the perimeter
offices consistently use less power than the core.
Figure 52: Yale Building Average Fixture Power, Core and Perimeter
Analysis of the average hourly power at each meter is also possible. Figure 53 below presents the
average weekday power at each hour of the day. Note that this chart presents the average watts
per fixture, and does not attempt to normalize for square feet. This figure depicts that the core
fixtures used approximately twice the power of the perimeter office fixtures. Figure 53 clearly
shows that the typical schedule was longer in the core, leading to a further increase in energy
use.

Enlighted Technical Proof of Concept
Northwest Energy Efficiency Alliance (NEEA) - 90
Figure 53: Yale Building Average Hourly Power, Core and Perimeter
Researchers further quantified these differences by applying some of the metrics used to evaluate
each site. Table 35 presents this data. Both the annual and daytime energy use exhibit a difference
of more than 50% between energy use in the private perimeter offices and that in the open core
office area. The perimeter offices have a higher weekend ratio, indicated more lighting energy
use on weekends versus weekdays. However, the core offices have a higher off-hours ratio,
indicating more energy use outside of the 6:00 AM-6:00 PM occupancy window. This could be
due to the influence of a few occupants on a larger number of overhead fixtures, which would all
be in range to detect motion and thus to remain on.
Table 35: Yale Building Metrics for Core versus Perimeter Offices
Metric Core Perimeter
Estimated Annual Energy
(kWh)
137.6 59
Daytime Power (W) 40.5 17.7
Weekend Ratio 0.04 0.10
Off-Hours Ratio 0.11 0.06
Yale Building Occupancy Data Analysis
One of the key features of the Enlighted system is the presence of an occupancy sensor used in
the control algorithm for each fixture. The data acquisition system also logs the occupancy
readings from each sensor at five-minute intervals. For each interval, a binary number is stored
that indicates how much motion a sensor observed: higher numbers indicate more motion, and
lower numbers less motion.
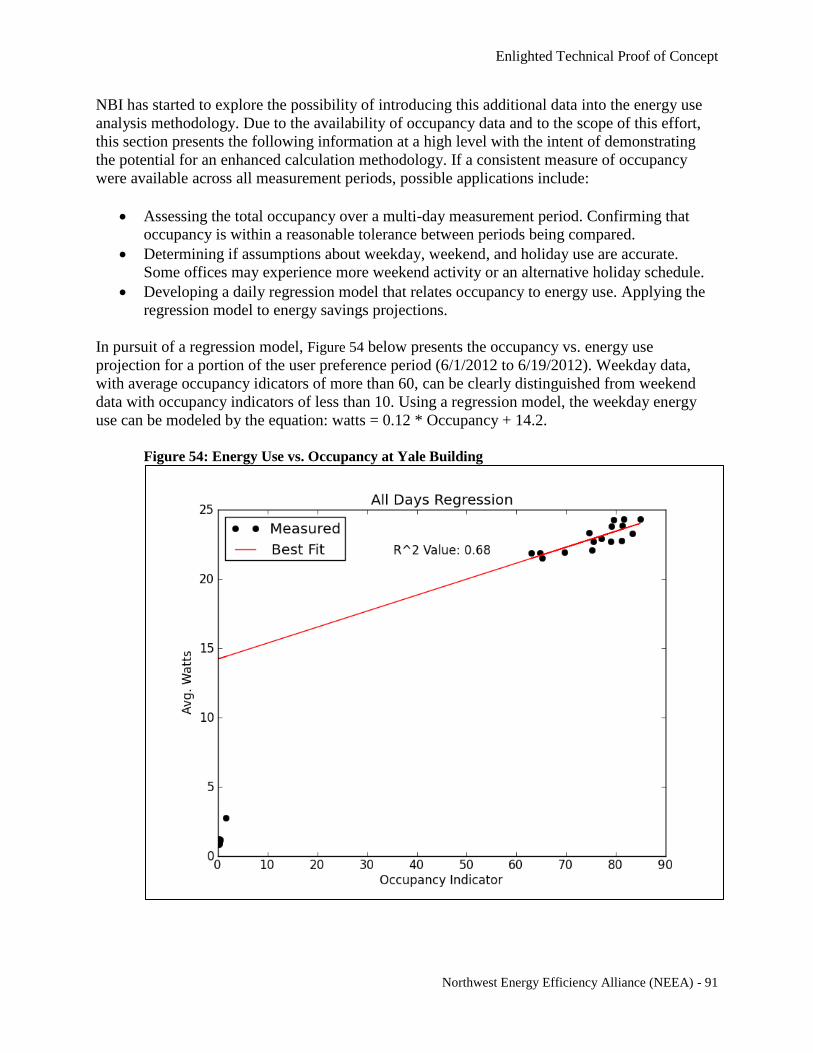
Enlighted Technical Proof of Concept
Northwest Energy Efficiency Alliance (NEEA) - 91
NBI has started to explore the possibility of introducing this additional data into the energy use
analysis methodology. Due to the availability of occupancy data and to the scope of this effort,
this section presents the following information at a high level with the intent of demonstrating
the potential for an enhanced calculation methodology. If a consistent measure of occupancy
were available across all measurement periods, possible applications include:
Assessing the total occupancy over a multi-day measurement period. Confirming that
occupancy is within a reasonable tolerance between periods being compared.
Determining if assumptions about weekday, weekend, and holiday use are accurate.
Some offices may experience more weekend activity or an alternative holiday schedule.
Developing a daily regression model that relates occupancy to energy use. Applying the
regression model to energy savings projections.
In pursuit of a regression model, Figure 54 below presents the occupancy vs. energy use
projection for a portion of the user preference period (6/1/2012 to 6/19/2012). Weekday data,
with average occupancy idicators of more than 60, can be clearly distinguished from weekend
data with occupancy indicators of less than 10. Using a regression model, the weekday energy
use can be modeled by the equation: watts = 0.12 * Occupancy + 14.2.
Figure 54: Energy Use vs. Occupancy at Yale Building

Enlighted Technical Proof of Concept
Northwest Energy Efficiency Alliance (NEEA) - 92
Unfortunately, the same type of occupancy data is not available for a baseline measurement
period. If it were, researchers could develop a similar regression model and compare energy use
between the two periods by plugging the occupancy data from one period into the regression
equation for the other period, thus normalizing for any change in occupancy between the two
periods. With a sufficient sample size, this analysis would begin to develop a methodology for
assessing the savings potential of a system in offices with different occupancy patterns and
vacancy rates.