research article maintainability analysis of...
TRANSCRIPT

Research ArticleMaintainability Analysis of Underground Mining EquipmentUsing Genetic Algorithms Case Studies with an LHD Vehicle
Sihong Peng and Nick Vayenas
Laurentian University 935 Ramsey Lake Road Sudbury ON Canada P3E 2C6
Correspondence should be addressed to Nick Vayenas nvayenaslaurentianca
Received 29 August 2013 Accepted 9 December 2013 Published 19 February 2014
Academic Editor Luis A Cisternas
Copyright copy 2014 S Peng and N Vayenas This is an open access article distributed under the Creative Commons AttributionLicense which permits unrestricted use distribution and reproduction in any medium provided the original work is properlycited
While increased mine mechanization and automation make considerable contributions to mine productivity unexpectedequipment failures and planned or routine maintenance prohibit the maximum possible utilization of sophisticated miningequipment and require a significant amount of extra capital investmentThis paper deals with aspects of maintainability predictionforminingmachinery A PC software called GenRel was developed for this purpose In GenRel it is assumed that failures of miningequipment caused by an array of factors follow the biological evolution theory GenRel then simulates the failure occurrences duringa time period of interest using genetic algorithms (GAs) coupled with a number of statistical techniques A group of case studiesfocuses on maintainability analysis of a Load Haul Dump (LHD) vehicle with two different time intervals three months and sixmonths The data was collected from an underground mine in the Sudbury area in Ontario Canada In each prediction case studya statistical test is carried out to examine the similarity between the predicted data set with the real-life data set in the same timeperiod The objectives of case studies include an assessment of the applicability of GenRel using real-life data and an investigationof the impacts of data size and chronological sequence on prediction results
1 Introduction
With more and more technological advances made availablenowadays the manufacturing industry is producing varioustypes of equipment worth billions of dollars for use by themining industry throughout the world For instance as perthe United States Census Bureau in 2008 American miningequipmentmanufacturers shipped approximately $40 billionworth of goods [1] compared to $2 billion in 2005 [2]Withinthese 2008 figures underground mining machinery (exceptparts sold separately) accounted for $10 billion or 25 percentIt is worthwhile to mention that portable drilling rigs andparts accounted for $17 billion or 425 percent In somemines maintenance cost might take up to 50 to 60 percent oftotal costs [3 4] Today the global economic recession is forc-ingmining companies tomodernize their operations throughincreased mechanization and automation To this endit is desirable to design and utilize mining equipment systemswith better reliability and maintainability both for engineersand mining managers Particularly in a state of economic
recession mining companies are urged to make the best useof enterprise resources including equipment and mainte-nance crew while dealing with market volatility and share-holdersrsquo expectations of profitability A number of crucial rea-sons for improving mining equipment reliability and main-tainability are summarized as follows [5]
(1) to maximize profit(2) to reduce the cost of poor reliabilitymaintainability(3) to reduce the performance of mining equipment ser-
vices in an unplannedmanner because of short notice(4) to provide more accurate short-term forecasts for
equipment operating hours(5) to overcome challenges imposed by global competi-
tion(6) to take advantage of lessons learned fromother indus-
trial sectors such as aerospace defense and nuclearpower generation
(7) to improve workplace safety
Hindawi Publishing CorporationJournal of MiningVolume 2014 Article ID 528414 10 pageshttpdxdoiorg1011552014528414
2 Journal of Mining
Step 1 InitializationGenerate initial population 119868 at random or with prior knowledgeStep 2 Fitness evaluationEvaluate the fitness for all individuals in 119868Step 3 SelectionSelect a set of promising candidates 119862 from 119868
Step 4 CrossoverApply crossover to the mating pool 119862 for generating a set of offspring 119874Step 5MutationApply mutation to the offspring set 119874 for obtaining its perturbed set 1198741015840Step 6 ReplacementReplace the current population 119868 with the set of offspring 1198741015840Step 7 TerminationIf the termination criteria are not met go to Step 2
Pseudocode 1 Pseudocode of a simple genetic algorithm [13]
2 Maintainability
Theearliest occurrence of the termmaintainability was foundin a contract in the development of the Wright brothersrsquo air-plane in which it was clearly stated that the aircraft should beldquosimple to operate and maintainrdquo [6] Today maintenancecosts of sophisticated engineering systems are so high thatmaintainability draws great attention from scientific re-searchers to operations managers For instance a study [7]shows that American manufacturers spend more than 300billion US dollars on plant maintenance and operationsTherefore it is understandable that the main objectives ofapplying maintainability principles to engineering systemsare to reduce projected maintenance costs and time to usemaintainability data to estimate systemequipment availabil-ityunavailability and to determine labor-hours and otherrelated resources needed to perform the projected mainte-nance
A system with better maintainability would inherentlyprovide the benefit of lower maintenance costs less time torecover with lower breakdown frequency (design for sim-plicity) less complexity of maintenance tasks and relativelyreduced man-hours [8]
Most maintainability functions use the time to repair asindependent variable It is common to use probabilistic orstatistical concepts to define a maintainability function forexample the probability density function Let 119905 denote thetime Assuming a repair starts at 119905 = 0 and completes at time119879 the maintainability can be mathematically defined [2] asfollows
119872(119879) = int
119879
0
119891119903(119905) 119889119905 (1)
or119872(119879) = 119865
119903(119905 le 119879) (2)
where119872(119879) is the maintainability function 119879 and 119905 are time119891119903(119905) is the repair time probability density function and 119865
119903(119905)
is the repair time cumulative distribution functionFrom the above maintainability is the probability of car-
rying out a repair within a known time period In maintain-ability studies the variable of interest is time to repair (TTR)
whereas in reliability studies the variable of interest is timebetween failures (TBF) As a clarification reliability is definedas the probability of a product system or service to performits expected task under the specified conditions of use over anintended period of time [10ndash12]
3 Genetic Algorithms and Their Applications
In 1975 Hollandwrote a ground-breaking book adaptation innatural and artificial systems in which he described a generalframework for understanding the mechanisms behind adap-tive behaviors in a number of systems over a broad range oftimescales [14] Later on a series of further researchwork [15ndash17] revealed further characteristics and potential applicationsof genetic algorithms (GAs)
A genetic algorithm imitates a biological evolution pro-cess and is often used to seek optimal solution to a practicalproblem expressed by the best fitted individual string of val-ues (representing parameters of the practical problem) GAsencode the decision variables (or input parameters) of theunderlying problem into strings Each string called individ-ual is a candidate solution To differentiate good candidatesolutions from bad candidate solutions a fitness function isneeded as a measure A fitness function could be a mathe-matical expression or a complex computer simulation or interms of subjective human evaluation and guide the evolutionof solutions to the problem Pseudocode 1 shows the pseu-docode of a simple genetic algorithm [13]
In each of the procedures three genetic operators will beimplemented in each individual candidate solution selectioncrossover (or recombination) and mutation In a selectionoperation superior individuals will be given a better chanceto reproduce the next generation since the fitter gene hastendency to yield good quality offspring which means abetter solution to any problem In a crossover procedure theindividuals obtained from the selection procedure will ex-change and combine partial solutions at a certain crossoverprobability In a mutation procedure a small portion ofoffspring genes is altered to form the new solution
Research on GAs has a wide spectra from computerscience [18 19] to engineering [15 20] and more recently to
Journal of Mining 3
Information flow in GenRel
Raw dataGenerated
Perform Perform
Finalstatistics
Test for
End
No
Yes
convergence
Convergencecriteria met
Select mates
data
crossover mutation
Dat
a inp
ut an
dG
enet
ical
gorit
hmVe
rifica
tion
Fina
l res
ult
gene
ratio
n
Figure 1 A schematic illustration of data flow in GenRel
fields such asmolecular biology immunology and economics[21ndash23] In the mining engineering field GAs have been usedalso for ore grade estimation [24] ore grade optimization[25] solving scheduling and open-pit design problems [26]coal mine production scheduling [27] and open pit equip-ment selection [28]
Reliability and maintainability models with or withoutcovariates are based on the use of rigorous and complicatedstatistical techniques which include for instance theoreticalprobability distribution fitting and trend and serial corre-lation tests and require assumptions of homogeneous ornonhomogeneous Poisson process or assumptions of propor-tionality of the hazard rate The assumptions and statisticalconstraints of probabilistic models limit the ability of thesemodels to accurately represent and fit all real life miningconditions [29] The authorsrsquo research offers an alternativemethod to the above conventionalstatistical methods andprovides an approach that can complement the existingmaintainability techniques in an effort to contribute to betterunderstanding of failures of capital intensive mining equip-ment systems over time
GAs offer several key advantages over conventionalmath-ematical models including simplicity of randomized searcheswhile retaining important historical information with thepopulation computational simplicity GAs search from apopulation of solutions not just from a single solution andthey can handle any kind of objective function linear ornonlinear constraints defined in discrete continuous ormixed search spaces [15 30]
4 Overview of GenRel
GenRel is a computer software developed for reliabilitymaintainability prediction based on genetic algorithms using
historical data It was developed at Laurentian UniversityMining Automation Laboratory (LUMAL) and runs in theMicrosoft Excel environment
In a typical genetic algorithm variables of interest arecoded Afterwards the processes of mate selection crossoverand mutation circulate until the fitness function yields des-ired values [15] The application of GAs in GenRel can beillustrated in Figure 1
In GenRel the user can define the maximum numberof iterations the convergence limit and the probability ofmutation see Figure 2
The raw data used in GenRel is derived from historicalrecords in terms of time to repair (TTR) TTR measures thetime needed to fix a failure The distribution fitting processusing the software BestFit by PalisadeCorporation [31] selectsthe best fitted probability distribution function 119865(119909) to theraw data For example take the exponential distribution [32]
119865 (119909) = 1 minus 119890minus(119909minus120574)120573
(3)
where 119909 is a TTR value 120573 is the mean and 120574 is the locationparameter We divide the entire raw data into two equal setsthe raw input data set and the raw evaluation data setThe rawinput data set is used to generate new data sets while the rawevaluation data is used in the evaluation process of the gen-erated data set Suppose
119865 (119909) = 1 minus 119890minus(119909minus1205740)1205730 119909 isin [120574
0infin) (4)
119865 (119909) = 1 minus 119890minus(119909minus1205740)1205730 119909 isin [120574
0infin) (5)
where 1205730and 120573
0are the means 120574
0and 120574
0are the location
parameters and 119865(119909) and 119865(119909) are the best fitted probabilitydistribution functions for the raw evaluation data set and forthe raw input data set respectively In order to generate new
4 Journal of Mining
Step 1 perform the continuous or discrete distribution fitting for the input data
(discrete distribution fitting for integer input)
Step 2 Start simulation with GA3430000 Step 3 Calculate and view data statistics64446
Raw input data standard deviation 51301 Step 4 View convergence summaryNew generated data mean 60156New generated data variance 55355
Step 5 View graph of convergence
56338Raw evaluation data variance 46600
Step 6 View final iteration results
Step 7 View detailed final convergence graph
Maximum of GA iterations 15
Convergence limit of GAProbability of mutationShape parameter 1205721 (for beta model)Shape parameter 1205722 (for beta model) Boundary parameter min (for beta model) Boundary parameter max (for beta model)
The convergence limit for the genetic algorithm to compare the difference between the meanof the generated population against the raw evaluation data mean must be between 0 and 1
Calculated parameters of the input data
Raw input data mean
Raw evaluation data mean
Population size
025
062434
26698
005000500
00000
Genetic algorithm (GA) model setup-step by step
Data statistics
Convergence summary
Graph of convergence
Final iteration results
Final convergence graph
Help on inverse transform technique
Continuous distribution fitting
Start simulation
Return to input menu
Rep
Discrete distribution fitting
Input parameters entered by the user
0 le the probability of mutation le 1
1205721 gt 0 this is the shape parameter for the beta distribution1205722 gt 0 this is the shape parameter for the beta distributionMin gt 0 this is the lower boundary parameter for the beta distributionMin gt 0 this is the upper boundary parameter for the beta distribution
Figure 2 User interface for GenRel to set relevant configurations
data from the raw input data we use the inverse transformtechnique or ITT [33] by transforming the exponential dis-tribution function into the inverse format and by generating auniformly distributed random variable 119877 sim 119880(0 1) Then sixsets of generated data can be yielded by 119909 = minus120573
0ln(1minus119877)+120574
0
(from (5) an inverse of the function can be expressed as119909 = minus120573
0ln(1minus119865)+120574
0 where119865 isin [0 1] substituting119865with the
random variable 119877 yields the expression) After six simulationruns the created six sets of new data are considered adequatefor the prediction process within GenRel
The generated data is then used for mate selection andcrossover in which a random number determines the posi-tions and total number of crossovers yielding offspring dataAfterwards mutation is performed at a specified rate definedby the user as mutation probability Six sets of new offspringdata follow the respective best fitted exponential probabilitydistribution functions denoted by parameter pairs (120573
119894 120574119894)
(119894 = 1 2 3 6) where 120573119894and 120574119894represent mean and loca-
tion of the respective probability distribution functions Afitness function
119891 =
1003816100381610038161003816120573119894 minus 12057301003816100381610038161003816 +
1003816100381610038161003816120574119894 minus 12057401003816100381610038161003816
100381610038161003816100381612057301003816100381610038161003816 +
100381610038161003816100381612057401003816100381610038161003816
(119894 = 1 2 3 6) (6)
is designed tomeasure the fitness of each individual offspringdata set for detailed discussion of this procedure see [34]
If the smallest value of the six fitness function values isnot greater than the user-defined convergence limit then theiterative process is terminated and GenRel is consideredapplicable for prediction of future data otherwise anotheriteration will be implemented as long as the preset maximumnumber of iterations is not exceeded and the smallest fitness
function value is within a user-defined convergence limitTheconvergence limit is the upper limit of deviation between theprobability distribution function of the generated data set andthe probability distribution function of the raw evaluationdata set
Overall after the above described algorithmic process issuccessful GenRel can be applied to predict future data Oth-erwise GenRel is considered not acceptable for prediction offuture data based on the raw data under study For detailsof the algorithmic procedure applied in GenRel see [35]Besides the exponential probability distribution GenRel alsoincludes other probability distribution functions (eg log-normal weibull)
5 Implementation of GenRel
Implementation ofGenRel normally encompasses fourmajorprocedures data preparation validation of independent andidentical distribution (iid) assumption verification of conver-gence and prediction
51 Data Preparation To fit the data into the maintenanceanalysis the original data is processed in the form of time torepair (TTR)
52 Trend Test and Serial Correlation Test Prior to statisticalanalysis and probability distribution fitting the data shouldbe tested for trends and serial correlations [3]The purpose ofthese tests is to verify the assumption that the data is indepen-dent and identically distributed (IID) This step is critical forthe probabilistic modeling approach If the data presents
Journal of Mining 5
a trend or serial correlation then the data is considered notindependent and not identically distributed [33 36] Inthis case nonstationarymaintainabilityreliabilitymodels aremore appropriate than models based on probability distribu-tion fitting to analyze the data
53 Verification of the Applicability of GenRel If a specificprobability distribution function can fit the raw input datathen we can utilize the inverse transform statistical technique[33] to generate new sets of data which conform to the sametype of probability distribution function but with slightly dif-ferent probability distribution function parameter values Inour study six sets of generated data having the same size as theraw input data set are considered sufficient to mimic thebiological process for the prediction of future failures
To carry out the verification process of GenRel based onhistorical data it is necessary to determine the convergencecriteria including the convergence limit the probability ofmutation and the maximum number of iterations If thesmallest fitness function value of an initially generated dataset through the inverse transform statistical technique fallswithin the convergence limit then the verification process isconsidered successful otherwise we proceed to the crossoverand mutation process iterating the initially generated datasets aiming to yield a set of data with acceptable fitness func-tion value without exceeding the user-defined number ofiterations and the probability of mutation In the case studiesproposed in this paper the following configuration is appliedby the end user of GenRel in all verification and predictionprocesses
(i) maximum number of GA iterations 15(ii) convergence limit of GA 005(iii) probability of mutation 005
54 Prediction of Data for the Period of Interest After thesuccessful completion of the verification process for the inputdata GenRel then can be applied to predict future dataGenRel is then run to generate the initial offspring data set ofthe same size as the raw input data set with the parametersvalues obtained from the raw input data distribution fittingprocess In GenRel six data sets are considered sufficient Inthese six data sets selection crossover and mutation are per-formed until either of the following two criteria is satisfied(1) the fitness value of the best offspring data set falls withinthe user-defined convergence limit (2) total iterations run inGenRel reaches the user-defined maximum number of itera-tions Upon completion of the prediction the t-test is used toexamine the statistical similarity of the predicted data set withthe raw evaluation data set see [32]
6 LHD Vehicles in Mining
A Load Haul Dump vehicle (LHD) also known as a scooptram is a specialized loading machine manufactured for theunderground mining industry LHDs are used to scoopextracted ore with a bucket load it into the bucket and dumpit in the bottom of the mine to undergo primary crushing
before being hoisted to the surface out of the mine Figure 3shows the design layout of a typical LHD vehicle
The Load Haul Dump vehicle concept was introduced toundergroundmining operations during the late 1960sWith alarge bucket in front the LHDoperator sits transversely in thecontrol compartment and drives the LHD in either directionas required LHD vehicles are designed to perform not onlyloading but also the hauling function since the haulagedistances underground for LHDs are relatively short Theyhave a large carrying capacity to vehicle size ratio With thecentral pin joining design LHD vehicles can achieve smallerturning radius compared to other similar size vehicles Thesefeatures make the LHD a particularly versatile machineLHDs are mainly diesel powered
Literature of applications of GenRel to analyze LHDvehiclesrsquo reliability can be found in [35 37 38] based on TBFdata compiled from historical records Yet to the best knowl-edge of the authors little has been done with regard to pre-diction of maintainability of LHD vehicles
7 Data Collection and Preprocessing
Data was gathered from a mine site in Sudbury area inOntario Canada on a daily basis Operators recorded equip-ment hours for usage and delays every shiftThis informationwas gathered and reviewed by mine management and orga-nized into a spreadsheet for further analysis [39] An excerp-tion of the originally obtained data is shown in the leftfive col-umns in Table 1
Since this group of case studies is about the maintainabil-ity characteristics of the LHD vehicle time to repair (TTR)value should be obtained To this end several assumptions aremade as follows
(1) If a shift is missing from the data set then the shift isadded and it is assumed that there is no failure duringthe added shift
(2) Machine standby time during a shift is registeredseparately Table 1 illustrates an example of the finaldatabase The example shows the date shift codecumulative time between failures (CTBF) workgroup failure code (type of failure) time to repair(TTR) time between failures and machine standbytime during a shift
(3) If a failure code is missing for a repair on a specificshift and it is less than 3 hours an AV status code isassumed
The case studies discussed below are based on the col-lected data sets Some of the data may not be considered assufficiently large for statistical analysis (eg probability fit-ting) however the applicability and usefulness of the pro-posed methodology can be demonstrated
8 Results and Discussion
81 Prediction of TTR Data for Three Months Time PeriodTwo case studies are considered prediction of TTR data forthe period from April 1 to June 30 2006 based on historical
6 Journal of Mining
R2 800
R2 100
16∘
3977plusmn50
1830plusmn150
2540 plusmn 156738 plusmn 100
7060 plusmn 100
1880
plusmn50
Figure 3 This picture presents the schematic design of a typical LHD vehicle commonly used in modern mining industry [9]
Table 1 Original LHD vehicle delay records from mine site
Date Shift CTBF Group Failure type TTR TBF Available time2-Jan-06 7 82186 Mobile MH 4 00 802-Jan-06 8 82200 Mobile AV 0 14 1063-Jan-06 7 82287 Mobile AV 0 87 333-Jan-06 8 82374 Mobile AV 0 87 334-Jan-06 7 82461 Mobile AV 0 87 334-Jan-06 8 82548 Mobile AV 0 87 335-Jan-06 7 82634 Mobile AV 0 87 335-Jan-06 8 82634 Mobile MM 12 00 006-Jan-06 7 82721 Mobile AV 0 87 336-Jan-06 8 82808 Mobile AV 0 87 337-Jan-06 1 82888 Mobile AV 0 80 007-Jan-06 2 82895 Mobile MM 2 07 537-Jan-06 3 82895 Mobile MM 2 00 608-Jan-06 7 83002 Mobile AV 0 106 148-Jan-06 8 83108 Mobile AV 0 106 14CTBF cumulative time between failures TTR time to repair TBF time between failures
Journal of Mining 7
Table 2 Delay data overview in the periods from January to March2006 and from October to December 2006
Failuretype
JanuaryndashMarch 2006 OctoberndashDecember 2006
Time Frequency Percentage () Time Frequency Percent
age ()AV 63 3 106 566 10 1437ME 6 2 101 407 5 1034MH 781 12 1313 4 1 102MM 389 42 6542 45 1 114MP 1072 10 1803 208 19 5282OW 8 1 135 80 8 2031Total 5946 70 100 3938 44 100AV available ME electrical down MH hydraulic downMM mechanical down MP planned maintenance OW other
data from January 1 toMarch 31 2006 and prediction of TTRdata for the period from January 1 toMarch 31 2007 based onhistorical data from October 1 to December 31 2006 Withpreliminary manipulations Table 2 shows an overview of thehistorical delay data composition in two different time peri-ods inwhichAV stands for availableME for electrical failureMH for hydraulic failure MM for mechanical failure MPfor planned maintenance and OW for other
811 Verification of Applicability of GenRel to the Data Setsunder Study Before GenRel is run the validity of indepen-dent and identical distribution (iid) assumption for the datasets should be checked Graphical tests show that the data setsunder study are independent and identically distributedThen the verification process is aimed at providing a pre-screening result of GenRelrsquos applicability to the data set understudy In the first case TTR data for the period of January 1 toMarch 31 2006 is the data set of interest which is to be used asraw input data set to predict repair data for the period of April1 to June 30 2006 if GenRel is to be found applicable throughthe verification process
As described in Section 54 in the data input interfaceTTR data for the period of January to March 2006 is dividedchronologically into two parts with equal number of dataentries 35
The first step is to find the best fitting distribution func-tion for the raw input data set The best fitting distributionfunction given by Risk [31] is the normal distribution forthe raw input data with mean 120583 = 80057 and standard devi-ation 120590 = 4115
In the environment of Microsoft Excel with Visual Basicfor Applications a builtin function NORMINV can be dir-ectly called to generate random variables from the best fittednormal distribution with location parameter 120583 and scaleparameter 120590 In light of this convenient ready-to-use func-tion GenRel produces six sets of data with size identical tothat of the raw input data set These six sets of data generatedthrough the inverse transform statistical technique constitutethe initial population for the crossover and mutation opera-tions to follow
Next the initial population of six sets of generated data asparents starts to cross over and mutate at a rate of the user-defined mutation probability 005 Elite individuals whichpossess smaller cost function values have better chance to sur-vive and to be selected to reproduce offspring through selec-tion crossover and mutation These genetic operations iter-ate until either the maximum number of iterations which is15 or the convergence limit which is 005 has been reachedIn this case after one iteration the fitness function valuefalls within the user-defined convergence limit as shown inTable 3
Therefore it is concluded that GenRel is applicable toanalyze the data set from January to March 2006 Similarlyand after four iterations GenRel is found applicable to analyzethe data set from October to December 2006 as shown inTable 4
812 Prediction of TTR Data for the Time Periods from Aprilto June 2006 and from January to March 2007 After oneiteration GenRel returns a set of TTR data as the predictionof failures on the LHD vehicle during the time period fromApril to June 2006 Fitting results from Risk show thatthe Normal probability distribution fits the predicted dataset best Parameters of the normal probability distributioninclude 120583 = 8541 and 120590 = 41901 At a level of significanceof 5 119905-test statistic is 199 with a degree of freedom of 140Based on the result of the 119905-test it is concluded that there isno significant difference between generated data set and rawevaluation data set in terms of mean at a given level of sig-nificance of 5
After one iteration in GenRel a set of TTR data isacquired to project the maintenance characteristic of theLHD vehicle during the period from January to March 2007based on historical records during the time period fromOctober to December 2006 The software Risk is used toseek the probability distribution function that best fits thepredicted data set The fitting result shows the normal proba-bility distribution function is the best fit with parameters 120583 =89502 and 120590 = 35633 At a level of significance of 5 119905-teststatistic is 063 with a degree of freedom of 100 Based on theresult of the 119905-test it is concluded that there is no significantdifference between generated data set and raw evaluation dataset in terms of mean at a given level of significance of 5
The maintainability function of the LHD vehicle duringthe time periods fromApril to June 2006 and from January toMarch 2007 to describe the failure characteristic with respectto repair time can be expressed mathematically in the follow-ing equations
119872(119905) =1
2[1 + erf ( 119905 minus 8541
41901radic2
)]
119872 (119905) =1
2[1 + erf (119905 minus 89502
35633radic2
)]
(7)
Figures 4 and 5 representmaintainability profiles for thesetwo time periods respectively
Table 5 shows maintainability function values at somerepresentative TTRThe second row representsmaintainabil-ity values with respect to TTR from April to June 2006 and
8 Journal of Mining
Table 3 Iteration result of TTR data for the period from January to March 2006
Iteration Sum of distribution parameters Upper limit Lower limit Deviation of generated data Accepted convergence1 121207 0606035 0 01452 Yes
Table 4 Iteration result of TBF data for the period from October to December 2006
Iteration Sum of distribution parameters Upper limit Lower limit Deviation of generated data Accepted convergence1 797248 0398624 0 040962 No2 797248 0398624 0 040962 No3 797248 0398624 0 040962 No4 797248 0398624 0 005513 Yes
Table 5 A table of maintainability function values with representative TTR values
TTR (hours) 3 5 7 9 11 13 15Maintainability 041 455 2310 5867 8797 9833 9990Maintainability 004 133 1368 5111 8750 9885 9997
Table 6Delay data composition for the period from January to June2006
Type ofdelay
JanuaryndashJune 2006 MayndashOctober 2006
Time Frequency Percentage () Time Frequency Percent
age ()AV 283 9 217 102 21 1048ME 74 10 569 447 7 459MH 2941 32 2260 2796 27 2873MI 4 1 031 4 1 041MM 7209 74 5540 4809 46 4941MP 172 16 1322 62 7 637OW 8 1 061 0 0 000Total 13013 143 100 9732 109 100
the third row represents maintainability values with respectto TTR from January to March 2007
82 Prediction of TTR Data for Six Months Time PeriodIn order to compare with the results obtained for a three-month period a group of predictions of TTR data for sixmonths period is carried out Two case studies are consideredprediction of TTR data for the period from July 1 toDecember 31 2006 based onhistorical data from January 1 toJune 30 2006 and prediction of TTRdata for the period fromNovember 1 2006 to April 30 2007 based on historical datafrom May 1 to October 31 2006 Table 6 shows an overviewof the historical delay data composition in two different timeperiods
821 Verification of Applicability of GenRel to the Data Setsunder Study Similar graphical testing processes as afore-mentioned are implemented and show that the two data setsunder study are both independent and identically distributedTables 7 and 8 show that after one iteration GenRel yieldsan offspring data set within the convergence limit in the two
0
20
40
60
80
100
0 5 10 15 20 25
Mai
ntai
nabi
lity
()
Time to repair (hours)
Profile of maintainability function (normal 120583 = 8541 120590 = 41901)
M(t = 033)= 25
Figure 4The maintainability profile of the LHD vehicle during thetime period from April to June 2006
0
20
40
60
80
100
0 5 10 15 20 25
Mai
ntai
nabi
lity
()
Time to repair (hours)
Profile of maintainability function (normal 120583 = 89502 120590 = 35633)
M(t = 197)= 25
Figure 5The maintainability profile of the LHD vehicle during thetime period from January to March 2007
cases respectivelyTherefore GenRel is considered applicableto predict future repair data set based on the given historicaldata sets under this set of configurations
822 Prediction of TTR Data for the Time Period from July toDecember 2006 With one iteration GenRel renders a set ofTTR data to project the maintainability characteristic of theLHD vehicle during the time period from July to December2006 It is found that this set of TTR data follows the normalprobability distribution according to the fitting result from
Journal of Mining 9
Table 7 Iteration result of TTR data for the period from January to June 2006 (verification)
Iteration Sum of distribution parameters Upper limit Lower limit Deviation of generated data Accepted convergence1 122817 0614085 0 0316 Yes
Table 8 Iteration result of TTR data for the period fromMay to October 2006 (verification)
Iteration Sum of distribution parameters Upper limit Lower limit Deviation of generated data Accepted convergence1 129152 064576 0 01336 Yes
Table 9 A table of maintainability function values with representative TTR values
TTR (hours) 3 5 7 9 11 13 15Maintainability 003 113 1257 4950 8691 9880 9997
Risk The normal probability distribution is defined withthe parameters 120583 = 90221 and120590 = 35256 For the predictionof TTR from November 2006 to April 2007 GenRel alsoyields a set of data which falls within the user-defined limit Itis found that the best fitting result is the exponential probabil-ity distribution defined with the parameters 120573 = 78884 and120574 = 088779
Thus the maintainability functions are shown as follows
119872(119905) =1
2[1 + erf (119905 minus 90221
35256radic2
)]
119872 (119905) = 1 minus 119890minus(119905minus088779)7884
(8)
Figures 6 and 7 reveal maintainability profiles of the LHDvehicle during the time periods from July to December 2006and from November 2006 to April 2007 respectively Table 9gives maintainability function values at representative TTRs
9 Conclusion
In historical TTR data mechanical failures (MM) consumethe most repair time in all the time periods under consid-eration The case studies discussed in this paper indicate asuccessful application of a genetic algorithms based softwareGenRel to predict maintenance characteristics of an LHDvehicle expressed in terms of maintainability Two separategroups of case studies at time intervals of three months andsix months both present acceptable prediction results at agiven level of confidence 5 At each time interval two casestudies are investigated and no significant impact of chrono-logical sequence on prediction results is found Furtherstudy is required to investigate how to incorporate the pre-dicted results to improve preventative maintenance policiesin practice in underground hard rock mines
Conflict of Interests
The authors declare that there is no conflict of interestsregarding the publication of this paper
0
20
40
60
80
100
05 10 15 20 25
Mai
ntai
nabi
lity
()
Time to repair (hours)
Profile of maintainability function (normal 120583 = 90221 120590 = 35256)
M(t = 211)= 25
Figure 6The maintainability profile of the LHD vehicle during thetime period from July to December 2006
0
20
40
60
80
100
0 5 10 15 20 25 30 35 40 45
Mai
ntai
nabi
lity
()
Time to repair (hours)
Profile of maintainability function (exponential 120573 = 78884 120574 = 088779)
M(t = 109)= 25
Figure 7The maintainability profile of the LHD vehicle during thetime period from November 2006 to April 2007
Acknowledgment
Theauthors wish to thank theNatural Sciences and Engineer-ing Research Council of Canada (NSERC) for the fundingsupport related to this research
References
[1] USCensus Bureau (Current Industrial Reports)MiningMachin-ery and Mineral Processing Equipment US Census BureauSuitland Md USA 2009
[2] B S DhillonMining Equipment ReliabilityMaintainability andSafety Springer Series in Reliability Engineering Springer NewYork NY USA 2008
10 Journal of Mining
[3] N Vagenas N Runciman and S Rclement ldquoA methodologyfor maintenance analysis of mining equipmentrdquo InternationalJournal of Surface Mining Reclamation and Environment vol11 no 1 pp 33ndash40 1997
[4] A K S Jardine and A H C TsangMaintenance Replacementand ReliabilityTheory and Applications CRCTaylor amp FrancisBoca Raton Fla USA 2006
[5] S Dunn ldquoOptimising production scheduling for maximumplant utilisation and minimum downtime the reliability revo-lutionrdquo in Proceedings of the Dollar Driven Mining ConferencePerth Australia July 1997
[6] AMCP706-133 Engineering Design Handbook MaintainabilityEngineering Theory and Practice US Department of DefenseWashington DC USA 1976
[7] C J Latino ldquoHidden treasure eliminating chronic failures cancut maintenance costs up to 60rdquo Technical Report ReliabilityCenter Hopewell Va USA 1999
[8] AMCP706-134 Engineering Design Handbook MaintainabilityGuide for Design US Department of Defense Washington DCUSA 1972
[9] ldquoEverpros Mining Machinery Co Ltd 2m3 lhd loaderrdquo under-ground mining loader load haul dump vehicle lhd vehicleunderground mining vehicle 2010
[10] International Electrotechnical Commission ldquoList of basic termsand definitions and related mathematics for reliabilityrdquo IECPublication 271-1974 1974
[11] W J Layman ldquoFundamental consideration in preparing a mas-ter system planrdquo Electric World vol 101 pp 778ndash792 1933
[12] S A Smith ldquoService reliabilitymeasured by probabilities of out-agerdquo Electric World vol 103 pp 371ndash374 1934
[13] C W Ahn Advances in Evolutionary Algorithms-Theory Designand Practice Volume 18 of Studies in Computational IntelligenceSpringer Berlin Germany 2006
[14] K F Man K S Tang and S Kwong Genetic Algorithms Spri-nger London UK 1999
[15] D E GoldbergGenetic Algorithms in Search Optimization andMachine Learning Addison-Wesley Reading Mass USA 1989
[16] L D Davis and M Mitchell Handbook of Genetic AlgorithmsVan Nostrand Reinhold New York NY USA 1991
[17] J Michalewicz Genetic Algorithms + Data Structures = Evolu-tion Programs Springer Berlin Germany 3rd edition 1999
[18] L A Rendell ldquoGenetic plans and the probabilistic learningsystem synthesis and resultsrdquo in Proceedings of an InternationalConference on Genetic Algorithms and Their Applications pp60ndash73 July 1985
[19] H Gunadhi and A Segev ldquoA framework for query optimizationin temporal databasesrdquo in Proceedings of the 5th InternationalConference on Statistical Scientific Databases Z MichalewiczEd vol 420 of Lecture Notes in Computer Science pp 131ndash147Springer New York NY USA 1990
[20] MGen andRChengGenetic AlgorithmsampEngineeringDesignJohn Wiley amp Sons New York NY USA 1997
[21] H Aytug M Khouja and F E Vergara ldquoUse of genetic algo-rithms to solve production and operations management prob-lems a reviewrdquo International Journal of ProductionResearch vol41 no 17 pp 3955ndash4009 2003
[22] R Cheng M Gen and Y Tsujimura ldquoA tutorial survey ofjob-shop scheduling problems using genetic algorithms-I Rep-resentationrdquo Computers and Industrial Engineering vol 30 no4 pp 983ndash997 1996
[23] N C Proudlove S Vadera and K A H Kobbacy ldquoIntelligentmanagement systems in operations a reviewrdquo Journal of theOperational Research Society vol 49 no 7 pp 682ndash699 1998
[24] S Clement and N Vagenas ldquoUse of genetic algorithms in amining problemrdquo International Journal of SurfaceMining Recla-mation amp Environment vol 8 no 4 pp 131ndash136 1994
[25] MAtaei andMOsanloo ldquoUsing a combination of genetic algo-rithm and the grid searchmethod to determine optimum cutoffgrades of multiple metal depositsrdquo International Journal of Sur-faceMining Reclamation and Environment vol 18 no 1 pp 60ndash78 2004
[26] B Denby and D Schofield ldquoOpen-pit design and scheduling byuse of genetic algorithmsrdquoTransactions of the Institution ofMin-ing amp Metallurgy A vol 103 pp A21ndashA26 1994
[27] P C Pendharkar and J A Rodger ldquoNonlinear programmingand genetic search application for production scheduling in coalminesrdquo Annals of Operations Research vol 95 no 1ndash4 pp 251ndash267 2000
[28] A Haidar and S Naoum ldquoSelection of opencast mine equip-ment using knowledge base and genetic algorithmrdquo in Proceed-ings of the 4th International Symposium on Mine Planning andEquipment Selection R K Singhal Ed pp 409ndash414 Taylor ampFrancis Calgary Canada November 1995
[29] N Vagenas and T Nuziale ldquoGenetic algorithms for reliabilityassessment of mining equipmentrdquo Journal of Quality in Mainte-nance Engineering vol 7 no 4 pp 302ndash311 2001
[30] R L Haupt and S E Haupt Practical Genetic Algorithms JohnWiley and Sons New Jersey NJ USA 2nd edition 2004
[31] Palisade Corporation Bestfit Distribution Fitting Palisade Cor-poration Ithaca NY USA 2010
[32] G K Kanji 100 Statistical Tests SAGE Thousand Oaks CalifUSA 2006
[33] A M Law andW D Kelton Simulation Modeling and AnalysisMcGraw-Hill Boston Mass USA 2000
[34] X Wu Reliability assessment of mobile mining equipment usinggenetic algorithms combined with maintenance analysis a casestudy of a fleet of load-haul-dump (lhd) vehicles [MS thesis]Laurentian University Ontario Canada 2009
[35] N Vayenas and XWu ldquoGenrel a computerisedmodel for relia-bility prediction of mining machineryrdquo International Journal ofMining andMineral Engineering vol 1 no 4 pp 365ndash382 2009
[36] L M Leemis Reliability Probabilistic Models and StatisticalMethods Prentice-Hall Englewood Cliffs NJ USA 1995
[37] T Nuziale and N Vagenas ldquoA software architecture for relia-bility analysis of mining equipmentrdquo International Journal ofSurface Mining Reclamation and Environment vol 14 no 1 pp19ndash34 2000
[38] G Yuriy and N Vayenas ldquoDiscrete-event simulation of mineequipment systems combined with a reliability assessmentmodel based on genetic algorithmsrdquo International Journal ofMining Reclamation and Environment vol 22 no 1 pp 70ndash832008
[39] S Peng Application of GenRel for reliability and maintainabilityanalysis of underground mining equipment three case studies[MS thesis] Laurentian University Sudbury Ontario 2011
Submit your manuscripts athttpwwwhindawicom
Hindawi Publishing Corporationhttpwwwhindawicom Volume 2014
ClimatologyJournal of
EcologyInternational Journal of
Hindawi Publishing Corporationhttpwwwhindawicom Volume 2014
EarthquakesJournal of
Hindawi Publishing Corporationhttpwwwhindawicom Volume 2014
Hindawi Publishing Corporationhttpwwwhindawicom
Applied ampEnvironmentalSoil Science
Volume 2014
Mining
Hindawi Publishing Corporationhttpwwwhindawicom Volume 2014
Journal of
Hindawi Publishing Corporation httpwwwhindawicom Volume 2014
International Journal of
Geophysics
OceanographyInternational Journal of
Hindawi Publishing Corporationhttpwwwhindawicom Volume 2014
Journal of Computational Environmental SciencesHindawi Publishing Corporationhttpwwwhindawicom Volume 2014
Journal ofPetroleum Engineering
Hindawi Publishing Corporationhttpwwwhindawicom Volume 2014
GeochemistryHindawi Publishing Corporationhttpwwwhindawicom Volume 2014
Journal of
Atmospheric SciencesInternational Journal of
Hindawi Publishing Corporationhttpwwwhindawicom Volume 2014
OceanographyHindawi Publishing Corporationhttpwwwhindawicom Volume 2014
Advances in
Hindawi Publishing Corporationhttpwwwhindawicom Volume 2014
MineralogyInternational Journal of
Hindawi Publishing Corporationhttpwwwhindawicom Volume 2014
MeteorologyAdvances in
The Scientific World JournalHindawi Publishing Corporation httpwwwhindawicom Volume 2014
Paleontology JournalHindawi Publishing Corporationhttpwwwhindawicom Volume 2014
ScientificaHindawi Publishing Corporationhttpwwwhindawicom Volume 2014
Hindawi Publishing Corporationhttpwwwhindawicom Volume 2014
Geological ResearchJournal of
Hindawi Publishing Corporationhttpwwwhindawicom Volume 2014
Geology Advances in
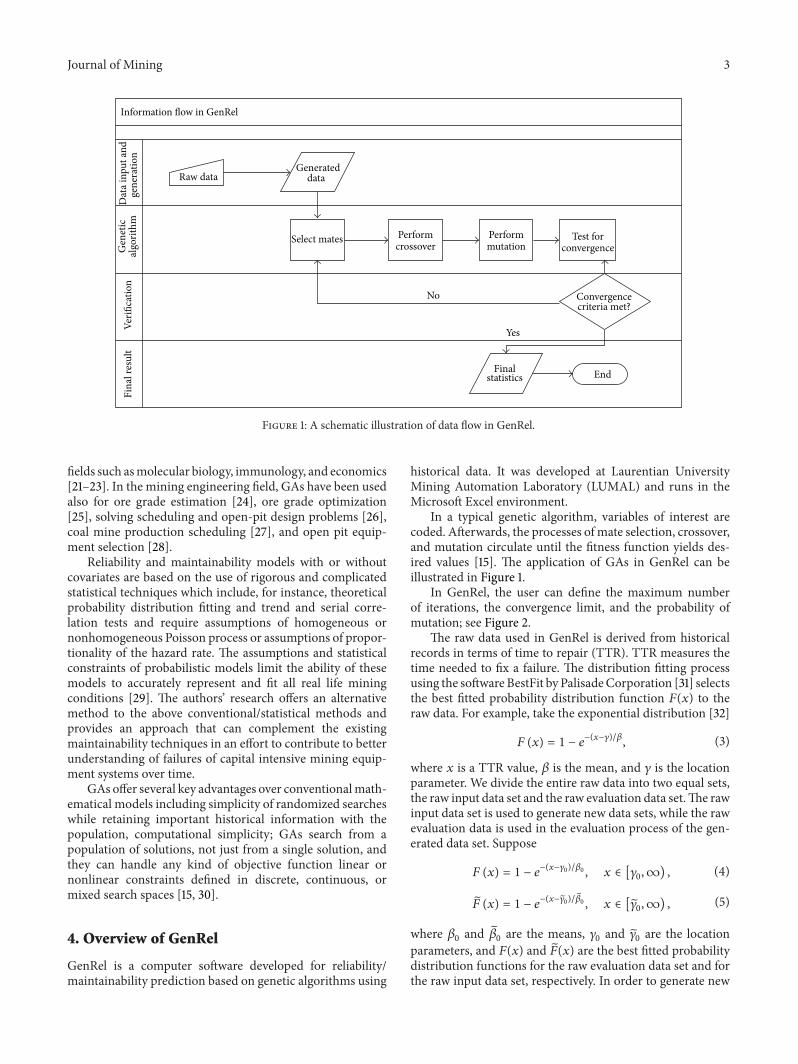