research article thermoeconomic analysis and...
TRANSCRIPT
Research ArticleThermoeconomic Analysis and Multiobjective Optimization ofa Solar Desalination Plant
Hamid Mokhtari Mokhtar Bidi and Mahdi Gholinejad
Faculty of Mechanical amp Energy Engineering Shahid Beheshti University AC 1983963113 Tehran Iran
Correspondence should be addressed to Mokhtar Bidi m bidisbuacir
Received 26 May 2014 Revised 17 August 2014 Accepted 18 August 2014 Published 16 September 2014
Academic Editor Santanu Bandyopadhyay
Copyright copy 2014 Hamid Mokhtari et al This is an open access article distributed under the Creative Commons AttributionLicense which permits unrestricted use distribution and reproduction in any medium provided the original work is properlycited
A solar desalination plant consisting of solar parabolic collectors steam generators and MED unit was simulated technoeco-nomically and optimized using multiobjective genetic algorithm A simulation code was developed using MATLAB languageprogramming Indirect steam generation using different thermal oils including THERMINOL VP1 THERMINOL66 andTHERMINOL59 was also investigated Objective function consisted of 17 essential parameters such as diameter of heat collectorelement collector width steam generator pinch approach temperatures and MED number of effects Simulation results showedthat THERMINOL VP1 had superior properties and produced more desalinated water than other heat transfer fluids Performanceof the plant was analyzed on four characteristic days of the year to show that multiobjective optimization technique can be used toobtain an optimized solution in which the product flow rate increased while total investment and OampM costs decreased comparedto the base case
1 Introduction
Limited sources of clean potable water have motivatedhumans to find alternative sources to resolve the problemIndustrial desalination plants are among the best technologi-cal solutions for clean water production from sea water Tra-ditional plants use fossil fuels to provide required steam butnowadays using solar collectors has become more attractiveto prevent global pollution For example in the southwesternpart of USA in 2010 only about 10 Gm3year of waterdemand was provided by solar desalination technologieswhile in 2014 this portion reached 30Gm3year whichshows 200 increase during 4 years Prediction says thatthis value would be increased to 120Gm3year by 2050[1] A list of installed desalination plants operated withrenewable energy sources up to 2003 is given by Tzen andMorris [2] Beside industrial development many researchgroups have focused on developing software tools to simulateinvestigate and theoretically optimize desalination plantsFor example Kamali et al [3] developed a code for thermalsimulation of multieffect desalination-thermal vapor com-pression (MED-TVC) unit to find optimized parameters for
higher gain output ratio (GOR)They concluded that thermaloptimization could lead to higher GOR in a constant surfacearea for a sample of 1500m3day unit They also completedtheir codes to implement evaporator thermocompressorand ejector design and study Qeshm island MED unit[4] Skiborowski et al [5] used mixed integer nonlinearprogramming (MINLP) algorithm to optimize two reverseosmosis (RO) and MED desalination unit in combinationwith a thermal power plant
Multiobjective optimization technique based on thegenetic algorithm was proved to be a reliable tool for techno-economic improvement of plants and has been used bymany researchers Najafi et al [6] utilized this techniquefor optimizing solid oxide fuel cell- (SOFC-) gas turbinehybrid cycle coupled with an MSF desalination unit Exergyefficiency total cost and environmental pollutants wereincluded in their objective function The technique wasused by Shahandeh et al [7] to optimize a heat-integrateddistillation column and was also applied by JanghorbanEsfahani and Yoo [8] to enhance efficiency of a cogenerationplant Ansari et al [9] used the technique to minimize waterand power production cost In a similar study Sayyaadi
Hindawi Publishing CorporationJournal of Solar EnergyVolume 2014 Article ID 892348 13 pageshttpdxdoiorg1011552014892348
2 Journal of Solar Energy
Solar filed Stea
m g
ener
ator
MED unit
Inlet sea water
Return sea water
Rejected brine
Desalinated water
Figure 1 Schematic diagram of the solar desalination plant
et al [10] investigated the optimum parameters of an MED-TVC unit using a hybrid metaheuristic optimization toolKhoshgoftar Manesh et al [11] tried to find optimal couplingof MED-RO desalination plant using genetic algorithm andexergoeconomic optimization
In the case of solar applications there are some studiesthat use genetic algorithm to find optimal solutions whichinclude the study performed by Silva et al [12] for optimizinga solar field with parabolic collectors
It is important to note that there are various types ofdesalination technologies including [13]
(i) multistage flash (MSF)(ii) multiple effect boiling (MEB) or multieffect desalina-
tion (MED)(iii) vapor compression (VC)(iv) freezing(v) humidification-dehumidification (HD)(vi) solar stills(vii) membrane processes
Industrial desalination technologies either use phasechange or involve semipermeable membranes to separate thesolvent or some solutes Therefore desalination techniquesmay be classified into the following categories phase changeor thermal processes and membrane or single-phase pro-cesses
In the phase change or thermal processes distillation ofseawater is achieved by utilizing a thermal energy sourceThermal energy may be obtained from a conventional fossilfuel source nuclear energy nonconventional solar energysource or geothermal energy In the membrane processeselectricity is used for either driving high-pressure pumps orionizing salts contained in the seawater
Some researchers have focused on ldquohumidification-dehumidification (HD)rdquo technologies for solar desalinationFor example Kabeel and El-Said [14 15] investigated a hybridsolar desalination system of air humidification dehumidi-fication and water flashing evaporation by both numericaland experimental techniques Chang et al [16] studiedthe effect of sea water flow rate on the performance ofa solar desalination plant using porous balls technique Liet al [17] built a small-scale humidification-dehumidification
desalination unit to test the effect of various parameters onthe unit performanceTheir results showed that different inletsprayed water temperatures in the pad humidifier from 9 to27∘C can effectively improve relative humidity of outlet moistair from 89 to 97 and the outlet air temperature from 35 to42∘C Other researchers (eg [18ndash22]) have investigated HDtechnologies to produce potable water at small-scale unitswhich is applicable for small-scale users
Some others have studied solar stills for example Ranjanand Kaushik [23] performed an energy and exergy analysison a solar pool desalination plant
However commercial desalination processes based onthermal energy are multistage flash (MSF) distillationmultiple-effect desalination (MED) and vapor compression(VC) which could be thermal (TVC) or mechanical (MVC)vapor compression
On the other hand according to a survey conductedunder a European research project [24] the most promisingand applicable solar desalination technologies were MSF andMED A list of installed desalination plants operated withrenewable energy sources up to 2003 was presented by Tzenand Morris [2] Hu and Chen [25] designed a small-scalesolar multieffect desalination unit using parabolic collectorsto evaporate the sea water
At the present study solar MED-TVC technology as thecombination of multiple-effect desalination (MED) and ther-mal vapor compression (TVC) was investigated The plantwas designed for a moderate town with demand of 2000ndash5000m3day Multiobjective genetic algorithm optimizationtechnique was used to find optimum parameters of a solardesalination plant which is schematically shown in Figure 1A heat transfer fluid (HTF) is heated and circulates in a closedsystem of parabolic collectors and transfers the absorbedsolar energy to heating water in the steam generator Theproduced steam is condensed at the first effect of the MEDunit and causes the sea water to evaporate The vapor isthen condensed into desalinated water (product water) at thenext effect by another sea water stream The plant is locatedin the city of Ahwaz in the southeastern part of Iran Themain objectives and contribution of this paper include thefollowing items
(i) multiobjective optimization of a solar desalinationplant using genetic algorithm
Journal of Solar Energy 3
(ii) considering maximum water production and min-imum costs as the multiobjective function for theoptimization
(iii) investigating the effect of different thermal oils on theplant efficiency and water production rates
(iv) performance of solar desalination plant have beenanalyzed at four characteristics days of the yearincluding spring equinox summer solstice fallequinox and winter solstice
(v) sensitivity analysis on solar collector acceptanceangle
(vi) plotting Pareto curve finding the optimum parame-ters and comparing themwith the design parameters
(vii) exact calculation of radiative heat loss for theparabolic collector
2 Mathematical Modeling
21 Solar Collector Heat Transfer Equations Mathematicalmodeling of solar parabolic collectors has been performedby many researchers (eg [26 27]) One-dimensional energybalance model developed by Tao and He [26] was adaptedhere For short receivers (lt100m) a one-dimensional energybalance provides reasonable results for longer receivers atwo-dimensional energy balance is necessary The modeldetermines the performance of a parabolic trough solarcollectorrsquos linear receiver also called a heat collector element(HCE) Inputs of themodel include collector andHCE geom-etry optical properties heat transfer fluid (HTF) propertiesHTF inlet temperature and flow rate solar insulation windspeed and ambient temperature Outputs include collectorefficiency outlet HTF temperature heat gain and heatand optical losses Modeling assumptions and limitationswere also discussed along with recommendations for modelimprovement
Figure 2 shows the one-dimensional steady-state energybalance for a cross-section of an HCE without the glassenvelope intact The optical losses are due to imperfectionsin the collector mirrors tracking errors shading and mirrorand HCE cleanliness
The effective incoming solar energy (solar energy minusoptical losses) is absorbed by the absorber selective coating1199021015840
3SolAbs Some energy that is absorbed into the selectivecoating is conducted through the absorber ( 1199021015840
23cond) andtransferred to the HTF by convection ( 1199021015840
12conv) the remainingenergy is transmitted back to (is lost) to the environment byconvection ( 1199021015840
36conv) and radiation ( 119902101584037rad) and through the
HCE support bracket through conduction ( 1199021015840cond bracket) Themodel assumes that all temperatures heat fluxes and thermo-dynamic properties are uniform around the circumferenceof the HCE Also all flux directions shown in Figure 2 arepositive Consider
1199021015840
12conv = 1199021015840
23cond
1199021015840
3SolAbs = 1199021015840
36conv + 1199021015840
37rad + 1199021015840
23cond + 1199021015840
cond bracket
1199021015840
HeatLoss = 1199021015840
36conv + 1199021015840
37rad + 1199021015840
cond bracket
(1)
Figure 2 One-dimensional steady-state energy balance and for across-section of an HCE
From Newtonrsquos law of cooling the convection heat transferfrom the inside surface of the absorber pipe to the HTF perunit length of the pipe is
1199021015840
12conv = ℎHTF1198631120587 (1198792 minus 1198791)
ℎHTF = Nu1198632
1198961
1198632
(2)
To model the convective heat transfer from the absorberto the HTF for turbulent and transitional cases (Reynoldsnumber gt 2300) the following Nusselt number correlationdeveloped by Gnielinski [28] is used
Nu1198632=
(1198918) (Reminus1000)Pr11 + 127radic1198918 (Pr23
1minus 1)
(
Pr1
Pr2
)
011
119891 = [182 log10(Re1198632) minus 164]
minus2
(3)
in which 119891 is the friction factor for the inner surface ofthe absorber pipe and Pr
1and Pr
2are Prandtl number
evaluated at the HTF temperature 1198791 and the inner surface
temperature 1198792 respectively
Fourierrsquos law of conduction through a hollow cylinderdescribes the conduction heat transfer through the absorberwall [29]
1199021015840
23cond =2120587119896 (119879
2minus 1198791)
ln (11986311198632)
(4)
The conduction coefficient depends on the absorber materialtype In this research the HCE performance model includesthree stainless steels 304L 316L and 321H and one copper
If there is a wind the convection heat transfer fromthe glass envelope to the environment will be forced con-vection The Nusselt number in this case is estimated with
4 Journal of Solar Energy
Biminus1 Ximinus1 Timinus1
Diminus1 Tciminus1
d998400i T
998400i
Di Ti
d998400998400i T
998400998400i
d998400i + d
998400998400i = Tci
Mf ti Xcw
Mf timinus1 Xcw
Di Tc119894minus1
sum nminus2
i=1Di +sum
nminus2
i=2d998400i = Tc119894minus1 sum nminus1
i=1Di +sum
nminus1
i=2d998400i = Tc119894
Figure 3 Heat and mass balance diagram for 119894th effect [33]
Zhukauskasrsquo correlation for external forced convection flownormal to an isothermal cylinder [29]
Nu1198633= 119862Re119898
1198633Pr1198994(
Pr4
Pr3
)
14
(5)
The net radiation transfer between the absorber pipe and skybecomes [29]
1199021015840
37rad = 1198601119865sur (1198691 minus 119869sur)
1198691= 1198641198871minus 119902
(1 minus 1205761)
1205761120587119863
119869sur = 1205901198794
Sky
119865sur =120579
360
(6)
in which 120590 is the Stefan-Boltzmann constant 120576 is the emissiv-ity of the pipe outer surface 119863 is the pipe outside diameterand 120579 is the collector angle with the sky Sky temperature119879skyis calculated using Ouagued et al [30] correlation
Other terms in (1) can be calculated using models andequations of other references (eg [31 32]) and are notmentioned here to prevent elongation of the paper
22 MED Design Model and Equations An MED unitincludes multiple effects which are similar to each other interms of energy andmass balance Figure 3 shows a schematicbalance diagram for 119894th effect [33] To simulate the MEDprocess it is necessary to solve equations of water massbalance salt mass balance and energy balance in each singleeffect and in the MED unit overall
Water Mass Balance
Consider
119865119894+ 119861119894minus1= 119863119894+ 119861119894 (7)
where 119865 119861 and 119863 are feed water flow rate brine flow rateand desalinated water flow rate respectively and 119894 is the 119894theffect no
Salt Mass BalanceConsider
119865119894119883119865119894+ 119883119861119894minus1119861119894minus1= 119883119861119894119861119894 (8)
where119883119861is the outlet brine concentration (in ppm) with the
maximum of 70000 ppm [33]
Energy Balance EquationConsider
119863119894minus1120582119894minus1+ 119889119894minus1120582119894minus1+ 1198891015840
119894minus11205821015840
119894minus1= 119865119894119862119901(119879119894minus 119879119891) + 119863119894120582119894
(9)
where 120582119894is the latent heat of vaporization in 119894th effect 119889
119894minus1
is the amount of vapor formed by brine flashing in effect 119894 minus1 and 1198891015840
119894minus1is the amount of vapor formed by flashing in the
flashing boxesThe main objective of MED simulation is to calculate
desalinated water flow rates 119863119894and 1198891015840
119894in each effect and
then summarize them to calculate total desalinated waterTo do this a detail physical and mathematical modeling ofheat transfer inside and outside the tubes in each effect andalso in condenser and thermocompressor is required Themathematical modeling of El-Dessouky et al [33] is adaptedhere and is ignored for abbreviation
Journal of Solar Energy 5
The formula presented byHan and Fletcher [34] is used inthis model for evaluation of the falling film evaporation heattransfer coefficient over horizontal tubes
ℎ119900(
1205832
sw1205882
sw1198921198963
sw)
13
= 00004Re02Pr065(11990210158401015840)04
(10)
where
Re =4 times
119891
2 times 120583sw119871effectradic119873 (11)
For condensation inside the tubes of the effects the formulapresented by Xu et al [35] is used
ℎ119894= 119896+(
119892120588119871(120588119871minus 120588V) 119896
3
119871ℎ1015840
119891119892
120583119871119889119894(119879sat minus 119879wallin)
)
14
(12)
where
119896+= 03508(
119871
119889119894
)
minus01929
sdot Re00643
Re =119889119894119881V120588119871
120583119871
(13)
Heat transfer coefficients inside and outside of the condenserstubes are calculated using equations given byWangnick [36]
ℎ119894119888= (32935 + 119879 (8424 minus 01714119879)
minus119883 (8471 + 01161119883 + 02716119879))
times ((
119889119894119888
017272
)
02
(0656119881)08(
119889119894119888
119889119900119888
))
minus1
ℎ119900119888= 0728(
119892120588119871(120588119871minus 120588V) 119896
3
119871ℎ1015840
119891119892
119873119888120583119871119889119900119888(119879sat minus 119879wallout)
)
14
(14)
where
ℎ1015840
119891119892= ℎ119891119892+
3
8
119862119901119897(119879V119894 minus 119879wallin) (15)
3 Economic Analysis
Total capital investment (TCI) is the sum of fixed capi-tal investment (FCI) and other outlays including start-upcost (SUC) working cost (WC) cost of licensing researchdevelopment (LRD) and allowance for funds used duringconstruction (AFUDC) [37 38]
In addition to equipment case other installation costs likepiping should be considered The cost for piping includes thematerial and labor costs of all items required to complete theerection of all the piping used directly in the system Thiscost represents 10ndash70 of the purchased-equipment costThefollowing relation can be supposed to calculate piping cost[38]
TCI = FCI + SUC +WC + LRD + AFUDC (16)
In addition to equipment case other installation costs likepiping should be considered The cost for piping includes thematerial and labor costs of all items required to complete theerection of all the piping used directly in the system Thiscost represents 10ndash70 of the purchased-equipment costThefollowing relation can be supposed to calculate piping cost[38]
119885pipe = PEC119908(
119883119910
119883119908
)
120572
(17)
Using this equation pipe cost can be estimated for a desireddiameter 119883
119910knowing pipe cost for a specific pipe diameter
119883119908 In the above equation 119883
119910is greater than 119883
119908and power
factor 120572 is usually less than unity and can be considered as095
Collector cost estimation was performed using correla-tions in [31] For other pieces of equipment including MEDsolar collectors and steam generator the cost estimationformulas used in [28ndash31] were ignored here for shortening
Considering plant lifetime 119899 and interest rate 119894 capitalrecovery factor (CRF) was calculated by
CRF = 119894(1 + 119894)119899
(1 + 119894)119899minus 1
(18)
Knowing all equipment piping and onsite costs total costinvestment (TCI) could be calculatedThen cost of producedwater per unit of mass flow rate was calculated using thefollowing equation
Cost =TCIdes
(19)
There are different methods to express total investment costas a function of designed parametersThemethod used in thispaper is based on calculation of total cost per unit of time [39]
119870=
TCI times CRF times 120593119873 times 3600
(20)
in which119870 represents the equipment component or system119873 is number of operational hours per year and 120593 is theoperation and maintenance (OampM) coefficient which isselected as 106 (according to [40 41])
4 Objective Function
Maximum desalinated water production rates as well asminimum total capital investment were the main items of theobjective function in the present study Thus the objectivefunction could be formulated by a combination of desalinatedwater mass flow rate and desalinated water cost
Cost = sum(TCI) (21)
des =119899
sum
119894=1
(119863119894+ 119889119894) (22)
6 Journal of Solar Energy
Table 1 Lower and upper bounds of decision variables
Decision variable Lower bound Upper bound119879pp (∘C) 5 50
119879ap (∘C) 5 50
119889119894119890(mm) 20 80
119867119862(m) 1 5
119871co (m) 1 5119882119862(m) 1 5
No effect (mdash) 3 10119871119890(m) 1 8
119873119905119888
10 50119873119905119890
10 50119889119900119888
(mm) 20 80119875 (bar) 8 15119879sH (∘C) 200 4001198632(mm) 20 80
Thickness (mm) 10 25119882Collector (m) 35 8119881pipe 1 35
As mentioned in Table 1 17 variables including ther-modynamic and geometric parameters for steam generatorMED and solar field were considered the decision vari-ables Although the decision variables might vary in theoptimization procedure each was normally required to bewithin a reasonable range The upper and lower bands ofthese parameters were selected based on the previous studies[8 39 42 43]
5 Validation of Calculations and Results
51 Solar Collector Validation Validation of the developedcode was proved by comparison of the obtained results withthe reported data of Dudley et al [31] as shown in Figure 4In this figure thermal efficiency of the collector as a functionof HTF average temperature is compared with the measureddata and the maximum of 5 discrepancy is investigatedThe model well predicted the collector behavior that is byincreasing HTF temperature heat losses increased which inturn led to decrease in the collector thermal efficiency
52MEDDesignValidation To validate the code the simula-tion results for aMEDunit including 7 effects were comparedwith the operational data of Kamali and Mohebinia [4]Table 2 indicates the essential parameters of the unit and acomparison between the simulated results and reported dataAs is shown in the case of desalinated water flow rate therewas only 135 discrepancy between the measured data andsimulated results
6 Results and Discussions
61 Assumptions Mathematical models were used for adesalination plant located in city of Ahwaz in the southeast-ern part of Iran Table 3 shows the environmental conditionsand constant parameters used in this simulation
100 150 200 250 300 350 40060
62
64
66
68
70
72
74
76
HTF average temperature (∘C)
Effici
ency
()
Measurement resultSimulation result
Figure 4 Effect of HTF average temperature on collector efficiencyin compaction with measured data of Dudley et al [31]
Properties of different thermal oils are mentioned in theAppendix It is important to note that there is a higher limitof temperature for different oils to prevent oxidation Theselimits are also presented in the Appendix These temperaturelimits would affect themaximum collector pipe length as willbe discussed in the following sections
62 Solar Field Simulation Results To reach proper accuracytotal pipe lengthwas divided into 4000 small distances As thefirst comparison criterion different maximum temperaturelimits were considered for different oils (according to theAppendix) therefore different pipe lengths were consideredfor different oils as shown in Table 4 Pipe pressure dropversus pipe segment is represented in Figure 5 From thebeginning of the pipe up to 1000 segments oil density andviscosity are decreased because of temperature rise thereforepressure drop is decreased Since the mass flow rate isconstant after about 1500 segments decreasing density leadsto increase in volume flow rate and HTF velocity This effectovercomes the viscosity effect and increases pressure dropIt is important to note that THERMINOL 66 has minimumpressure drop among different oils However to minimizethe operational cost the intention is to find the HTF withminimum pumping power
Total pumping power is calculated from the followingequation
119901=
sum4000
eleman=1 (Δ119875(bar119898)eleman times 119871eleman)
120578119901120588
(23)
inwhich119871Δ119875 120578119901 and120588 are element length element pressure
drop pump efficiency and oil density respectivelyTherefore pumping power is proportional to both pres-
sure drop and total pipe length As seen from Figure 5THERMINOL66has theminimumpressure drop in one pipesegment If a unique total pipe length was considered for alloils THERMINOL 66 would have the minimum pumpingpower But in this research the considered limit formaximumallowable temperature led to different pipe length for differentoils Since THERMINOL 59 has the minimum pipe length
Journal of Solar Energy 7
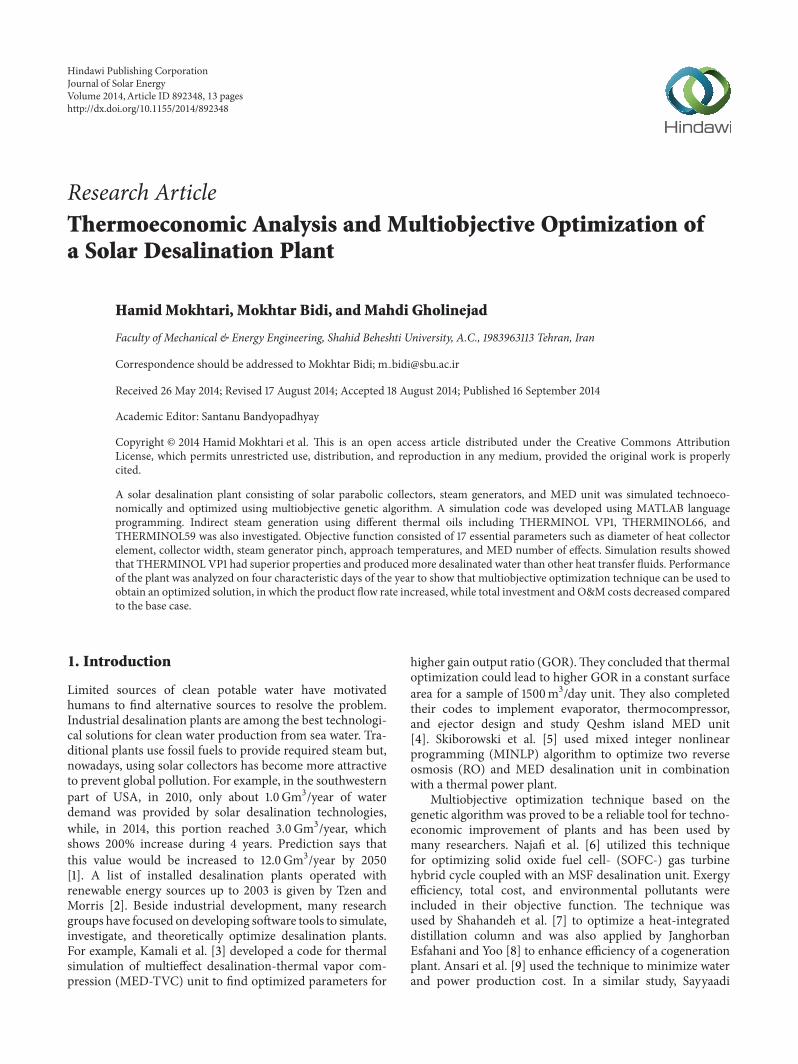
Table 2 Data validation for MED simulation
Parameter Unit Operational data [4] Simulated results Difference ()Number of effects mdash 7 7 AssumptionLength of tubes M 41 41 AssumptionMotive steam pressure Barg 10 10 AssumptionMotive steam temperature ∘C 170 170 AssumptionMotive steam mass flow rate tonsh 8 8 AssumptionNumber of tubes in each effect mdash 1996 1973 minus117Sea water flow rate tonsh 420 429 210Desalinated water flow rate (tonsd) tonsd 1536 1557 135
Table 3 Environmental conditions and constant parameters forsimulation
Constant Parameter Unit ValueLatitude ∘ 3130Elevation from sea level m 1700Average relative humidity 6000Average ambient temperature ∘C 1500Mirrorrsquos Clearness efficiency 094Reflection efficiency 093Solar absorber pipe inside diameter mm 6500Solar absorber pipe outside diameter mm 7500Pipe material mdash steel 321HCollector width m 576Collector acceptance angle ∘ 135
Table 4 Comparison of solar field parameters for different thermaloils considering maximum temperature limit for different oils
VP1 THERMINOL 66 THERMINOL 59Length (m) 245550 138100 110750119879out (∘C) 39902 34404 31404
119882pump (KW) 4560 2315 1897DpTotal (bar) 4655 2427 1946
(Table 4) therefore it has the minimum pumping poweramong the different oils
Considering both pipe length and pressure drop fromdata of Table 4 it can be concluded that pumping power isminimum for THERMINOL 59 while THERMINOL VP1has maximum outlet temperature maximum pipe length(maximum pipe cost) and maximum pumping power (max-imum pump cost) On the other hand this oil could producemore live steam which in turn causes production of moredesalinated water and could be verified by Figure 6 thatindicates the mass flow rate of desalinated water during theautumnal equinox It can be concluded that at the solar noonwater production rate for THERMINOL VP1 is 71 morethan that for THERMINOL 59
As the second comparison criterion outlet temperaturewas considered 314∘C for all oils which corresponded tothe maximum acceptable temperature of THERMINOL 59With this assumption simulation results are summarized in
0 1000 2000 3000 4000 5000 6000 700000085
0009
00095
001
00105
0011
00115
Pipe segment
Pres
sure
dro
p (b
ar)
THERMINOL 59
THERMINOL 66
THERMINOL VP1
Figure 5 Pressure drop versus pipe segments for different thermaloils
7 8 9 10 11 12 13 14 15 16 170
100
200
300
400
500
600
700
800
Time (h)
Fres
h w
ater
pro
duct
ion
(m3
day)
THERMINOL 59
THERMINOL 66
THERMINOL VP1
Figure 6 Variation of fresh desalinated water flow rate during theautumnal equinox for different thermal oils
Table 5 In this case THERMINOL 66 has minimum pipelength and minimum pumping power
Bracket radiative and convective heat losses at the pipeinlet and outlet are indicated in Figure 7 for different oilsIn the pipe inlet section the surface temperature is lowtherefore the convective heat loss is more important than theradiative one In contrast in pipe outlet section surface tem-perature is higher therefore the radiative heat loss becomesdominant It can be verified fromFigure 8 that going through
8 Journal of Solar Energy
Table 5 Comparison of solar field parameters for different thermaloils considering outlet temperature of 315∘C for all the oils
VP1 THERMINOL 66 THERMINOL 59Length (m) 1255 11070 110750119879out (∘C) 31400 31400 31404
119882pump (KW) 2181 1849 1897DpTotal (bar) 2227 1938 1946
Bracket Radiation Convection0
10
20
30
40
50
60
70
Hea
t los
s (
)
InletOutlet
Figure 7 Heat loss mechanism at inlet and outlet of the collectorpipe
0 500 1000 1500 2000 2500 3000 3500 40000
500
1000
1500
2000
2500
3000
Pipe segment
hi
(Wm
2middot
C)
THERMINOL 59
THERMINOL 66
THERMINOL VP1
Figure 8 Inside heat transfer coefficient versus pipe segment fordifferent thermal oils
the pipe inlet to the pipe outlet segments inside convectiveheat transfer coefficient increases therefore pipe surfacetemperature would be closer to the HTF higher temperature
Sum of heat losses during pipe segments is shown inFigure 9 for different oils THERMINOL VP1 has maximumheat loss compared to others
Since the intention is to gain maximum solar energy itis a good idea to use the oil with maximum temperaturelimit THERMINOL VP1 Although it involves the greatestheat losses andmaximumpumping power its performance inproducing higher desalinated flow rates is more attractive intechnical and economic termsTherefore this oil was selectedfor the rest of calculations
0 500 1000 1500 2000 2500 3000 3500 4000200
400
600
800
1000
1200
1400
1600
1800
Pipe segment
Hea
t los
s (W
)
THERMINOL 59
THERMINOL 66THERMINOL VP1
Figure 9 Total heat loss versus pipe segments for different thermaloils
0 1 2 3 4 5 6 7280
300
320
340
360
380
400
Wind velocity (ms)
Tou
t(∘
C)
Figure 10 Variation of outlet HTF (selected THERMINO VP1)temperature versus wind velocity
Figure 10 shows THERMINO VP1 outlet temperature asa function of wind velocity It is clear that with increasingwind velocity convective heat losses increase and the outlettemperature decreases which in turn leads to decreasingsteam and water production rates Therefore it is recom-mended to use glass covers to reduce convective losses If glasscovers were used energy balance equations would be slightlydifferent from those established here
63 MED Simulation Results It is a general rule for MEDunits that up to a specific limit using more number of effectswhich means more heat transfer areas and more capital costsleads to producing more desalinated water with the samesteam flow rate This comment is verified by Figure 11
64 Optimization by Multi Objective Genetic Algorithm Asstated previously the intention was to optimize the solarMED plant using genetic algorithm (GA) with 17 decisionvariables (Table 1) The main objective function was to max-imize desalinated water flow rate and minimize total capitalinvestments (recall (20) and (21)) For simulating the plant aMATLAB code was developed and for its optimization themultiobjective GA toolbox of this software was establishedPrior to finding the optimized state of the plant the decision
Journal of Solar Energy 9
Table 6 Values of decision variables for the design and optimizedcase
Decision variable Design case value Optimized case value119879pp (∘C) 20 941
119879ap (∘C) 20 1114
119889119894119890(mm) 2875 4817
119867119862(m) 1 257
119871co (m) 3 231119882119862(m) 42 316
No effect (mdash) 4 1000119871119890(m) 41 242
119873119905119888
16 2339119873119905119890
35 2900119889119900119888
(mm) 20 5608119875 (bar) 9 849119879sH (∘C) 200 210371198632(mm) 65 5707
Thickness (mm) 15 1421119882Collector (m) 576 753119881pipe 2 321
2000
2500
3000
3500
4000
Number of effects4 42 44 46 48 5 52 54 56 58 6
600
800
1000
1200
1400
Des
alin
atio
n (m
3 da
y)
Desalination (m3d)
A(m
2)
A (m2)
Figure 11 Variation of heat transfer area and desalinated water flowrate versus number of effects
variables for THERMINOL VP1 were considered (accordingto Table 6) the base case (design case)
The optimization results are shown in Figure 12 as threePareto curves for the three oils According to this figureTHERMINOL VP1 shows a better behavior in terms ofthe specified objective function (minimize cost versus waterproduction rate)
Using these Pareto curves the absolute optimum point ofthe operation can be determined In this case a special codewas used to determine the optimum point Values of decisionparameters for optimized case are presented in Table 6 forTHERMINOL VP1 Comparison of these values with theoriginal values of design case mentioned in Table 6 showshow this optimization differs from the base case
To better understand the differences between the opti-mized case and the base case four characteristic days ofthe year (ie spring equinox summer solstice fall equinoxand the winter solstice) were studied Rates of solar flux on
0 2000 4000 6000 8000 10000 12000 140000
001
002
003
004
005
006
Fresh water production (m3day)
Cos
t ($
s)
THERMINOL 59
THERMINOL 66
THERMINOL VP1
Figure 12 Pareto curves for different HTFs with objective functionof water production and total capital investment
7 8 9 10 11 12 13 14 15 16 170
500
1000
1500
2000
2500
3000
3500
4000
4500
Time (h)
Design resultOptimized result
Fres
h w
ater
pro
duct
ion
(m3
day)
Figure 13 Comparison between design and optimized case in termsof fresh water production during spring equinox
a horizontal surface for these characteristic days were 10101200 820 and 680Wm2 respectively Figures 13 14 15 and16 show that as solar flux decreases rate of the produced wateralso decreases but there is a sensible difference between thebase case and optimized case on all characteristic days
For further analysis both the design case and optimizedcase are compared in Figures 17 and 18 in terms of freshdesalinated water flow rate and total capital investment dur-ing autumnal equinox As can be concluded from Figure 17there is a considerable difference in water production ratebetween the two cases especially at solar noon On the otherhand total investment cost per cubicmeter of producedwateris also less in the optimized case according to Figure 18It is important to note that during morning hours oiltemperature is less than the minimum desired value forsteam generation therefore oil is bypassed from the steamgenerator and MED unit and circulated in a close loop ofsolar field During this period of time pumping costs areconsidered OampM costs
Therefore it can be concluded that the genetic algorithmis a powerful tool for optimization of a solar desalinationplant in terms of technical and economical items
10 Journal of Solar Energy
7 8 9 10 11 12 13 14 15 16 17
Time (h)
Design resultOptimized result
Fres
h w
ater
pro
duct
ion
(m3
day)
0
1000
2000
3000
4000
5000
6000
Figure 14 Comparison between design and optimized case in termsof fresh water production during summer solstice
7 8 9 10 11 12 13 14 15 16 17
Time (h)
Design resultOptimized result
Fres
h w
ater
pro
duct
ion
(m3
day)
0
1000
2000
3000
4000
5000
6000
Figure 15 Comparison between design and optimized case in termsof fresh water production during autumnal equinox
65 Sensitivity Analysis To perform a sensitivity analysissolar collector acceptance angle was reduced from 135 (designcase) to 125 degrees and Pareto curves of both cases areplotted in Figure 18 It can be seen that for a definite cost valueof 00153 $s the daily water production in the acceptanceangle of 135 degrees is 352 cubic meters more than the casewith 125 degrees of acceptance angle while this differencedecreases to 17 cubic meters per day for the cost of 0005 $s
Decreasing the collector acceptance angle from 135 to125 degrees leads to considerable increase in cost A slightvariation in solar field parameters indicates that geneticalgorithm changes the MED and steam generator designparameters simultaneously to reach the new optimized case
7 Conclusion
The simulation results showed that among three differentthermal oils THERMINOL VP1 needed greater pipe lengththan others considering the same outlet HTF temperatureand produced more desalinated water while total capitalinvestments were of the same order
7 8 9 10 11 12 13 14 15 16 17
Time (h)
Design resultOptimized result
Fres
h w
ater
pro
duct
ion
(m3
day)
0
100
200
300
400
500
600
700
800
900
1000
Figure 16 Comparison between the design and the optimized casein terms of fresh water production winter solstice
8 9 10 11 12 13 14 15 160
4
8
12
16
20
Time (h)
OptDesign
Cos
t ($
s)
Figure 17 Comparison between design and optimized case in termsof cost of one cubic meter of produced fresh water during autumnalequinox
Increasing wind velocity considerably decreased solarfiled efficiency On the other hand increasing wind velocityfrom 05 to 20ms led to 10 increase in heat losses
Using genetic algorithm for the plant optimizationresulted in determining an optimized case which producedmore desalinated water meanwhile its total investment costwas reduced Pareto curves also indicated that THERMINOLVP1 had less price and higher water flow rates than other oilswhich showed that GA well predicted the proper oil as wasexpected from the previous analysis and knowledge
Reduction of solar collector acceptance angle from 135to 125 degrees caused increasing the total cost in high waterflow rates while there was a small effect at low flow ratesindicating that GA led to change in design parameters of the
Journal of Solar Energy 11
0 2000 4000 6000 8000 10000 12000 140000
0005
001
0015
002
0025
003
Fresh water production (m3day)
Cos
t ($
s)
125 deg135 deg
Figure 18 Sensitivity analysis on solar collector acceptance angle
MED unit and steam generator as well as those of solar fieldsimultaneously in order to determine the optimized case
Appendix
Thermal Oil Properties
Property Equations for Various Thermal Oils (see [44])THERMINOL VP1
Consider
120588 = minus090119879 + 0000781198792minus 236 times 10
minus61198793+ 108325
119870 = minus 819 times 10minus6119879 minus 192 times 10
minus71198792+ 25 times 10
minus111198793
minus 729 times 10minus151198794+ 0178
120583 = 01794 times 119879minus1167
119862119901= 00024119879 + 595 times 10
minus61198792minus 298 times 10
minus91198793
+ 441 times 10minus111198794+ 15
119879max (∘C) = 400
(A1)
THERMINOL 66Consider
120588 = minus0614119879 minus 0000321198792+ 102062
119870 = minus33 times 10minus4119879 minus 15 times 10
minus71198792+ 0118294
120583 = 10minus6times 120588 exp( 386375
119879 + 625
minus 22809)
119862119901= 00033119879 + 89 times 10
minus71198792+ 149
119879max (∘C) = 345
(A2)
THERMINOL 59Consider
120588 = minus0692119879 minus 000301198792+ 198906
119870 = minus64 times 10minus5119879 minus 13 times 10
minus71198792+ 01226
120583 = 10minus6times 120588 exp(503471
119879 + 100
minus 225076)
119862119901= 00031119879 + 54 times 10
minus71198792+ 161
119879max (∘C) = 315
(A3)
Nomenclature
119861 Parameter for estimation of BPE (∘C)119862 Parameter for estimation of BPE (∘C)119862119901 Heat capacity (kjkgsdotK)
BPE Boiling point elevation (∘C)1198632 Inlet diameter tube of absorber
119863119894119890 Inlet diameter tube of effect
119863119894119888 Inlet diameter tube of condenser
119889119879 Effects temperature difference (∘C)119866 Mass flux kg(m2sdots)119892 Gravitational constant 981 ms2119867119888 Height of condenser Shell
119870119898 Heat transfer coefficient of tube wall (KWkg∘C)
119871 Tube length (m)119871119890 Evaporator length (m)
119873119905119890 Number of tubes on one line for effect
119873119905119888 Number of tubes on one line for
condenser119873119908 Number of rows wide
119873119903 Number of tubes rows deep
Nu Nusselt numberPP Pinch point (C or K)119875main Maine steam pressureRe Reynolds number119905 Tube of absorber thickness (mm)119881 Velocity (ms)V119891 Specific volume of fluid (m3kg)
119882119888 Width of condenser Shell
Z Capital cost rate ($s)119885119870 Component purchase cost ($)
Greek Symbols
120574 Specific heat ratio120588 Density (kgm3)120601 Maintenance factor120583 Dynamic viscosity kg(ssdotm)120590 Surface tension kgs2
12 Journal of Solar Energy
Subscripts
1 Heat transfer fluid2 Inner absorber pipe surface3 Outer absorber pipe surface4 Ambient5 SkyB BrineCon CondenserCond ConductionConv ConvectionCRF Capital recovery factorEva EvaporationF Feed seawaterO Out119868 Interest rateIn Inlet condition119870 Component119875 Tube pinch (mm)Sat Saturated conditionsSH Steam high pressureSW SeawaterV Vapor phase
Conflict of Interests
The authors declare that there is no conflict of interestsregarding the publication of this paper
References
[1] M Stroud Solar Desalination in the Southwest United StatesDepartment of Hydrology andWater ResourcesTheUniversityof Arizona Tucson Ariz USA 2014
[2] E Tzen and R Morris ldquoRenewable energy sources for desalina-tionrdquo Solar Energy vol 75 no 5 pp 375ndash379 2003
[3] R K Kamali A Abbassi S A S Vanini and M S AvvalldquoThermodynamic design and parametric study of MED-TVCrdquoDesalination vol 222 no 1ndash3 pp 596ndash604 2008
[4] R K Kamali and S Mohebinia ldquoExperience of design andoptimization of multi-effects desalination systems in IranrdquoDesalination vol 222 no 1ndash3 pp 639ndash645 2008
[5] M Skiborowski A Mhamdi K Kraemer and W MarquardtldquoModel-based structural optimization of seawater desalinationplantsrdquo Desalination vol 292 pp 30ndash44 2012
[6] B Najafi A Shirazi M Amin Yavari F Rinaldi and R ATaylor ldquoExergetic economic and environmental analyses andmulti objective optimization of an SOFC-gas turbine hybridcycle coupled with an MSF desalination systemrdquo Desalinationvol 334 pp 46ndash59 2014
[7] H Shahandeh J Ivakpour andN Kasiri ldquoInternal and externalHIDiCs (heat-integrated distillation columns) optimization bygenetic algorithmrdquo Energy vol 64 pp 875ndash886 2014
[8] I Janghorban Esfahani and C K Yoo ldquoFeasibility study andperformance assessment for the integration of a steam-injectedgas turbine and thermal desalination systemrdquoDesalination vol332 pp 18ndash32 2014
[9] K Ansari H Sayyaadi and M Amidpour ldquoThermoeconomicoptimization of a hybrid pressurized water reactor (PWR)power plant coupled to a multi effect distillation desalination
system with thermo-vapor compressor (MED-TVC)rdquo Energyvol 35 no 5 pp 1981ndash1996 2010
[10] H Sayyaadi A Saffari and A Mahmoodian ldquoVariousapproaches in optimization ofmulti effects distillation desalina-tion systems using a hybrid meta-heuristic optimization toolrdquoDesalination vol 254 no 1ndash3 pp 138ndash148 2010
[11] M H Khoshgoftar Manesh H Ghalami M Amidpour andM H Hamedi ldquoOptimal coupling of site utility steam networkwith MED-RO desalination through total site analysis andexergoeconomic optimizationrdquo Desalination vol 316 pp 42ndash52 2013
[12] R Silva M Berenguel M Perez and A Fernandez-GarcialdquoThermo-economic design optimization of parabolic troughsolar plants for industrial process heat applications withmemetic algorithmsrdquoApplied Energy vol 113 pp 603ndash614 2014
[13] S Kalogirou Solar Energy Engineering Processes and SystemsElsevier New York NY USA 1st edition 2009
[14] A E Kabeel and E M S El-Said ldquoA hybrid solar desalinationsystem of air humidification-dehumidification and water flash-ing evaporation Part I A numerical investigationrdquo Desalina-tion vol 320 pp 56ndash72 2013
[15] A E Kabeel and E M S El-Said ldquoA hybrid solar desali-nation system of air humidification dehumidification andwater flashing evaporation part II Experimental investigationrdquoDesalination vol 341 pp 50ndash60 2014
[16] Z Chang H Zheng Y Yang Y Su and Z Duan ldquoExperimentalinvestigation of a novel multi-effect solar desalination systembased on humidificationdehumidification processrdquo RenewableEnergy vol 69 pp 253ndash259 2014
[17] X Li G Yuana Z Wanga H Lib and Z Xub ldquoExperimentalstudy on a humidification and dehumidification desalinationsystem of solar air heater with evacuated tubesrdquo Desalinationvol 351 pp 1ndash8 2014
[18] G Franchini and A Perdichizzi ldquo Modeling of a solar drivenHD (humidification-dehumidification) desalination systemrdquoEnergy Procedia vol 45 pp 588ndash597 2014
[19] O Ansari M Asbik A Bah A Arbaoui and A KhmouldquoDesalination of the brackish water using a passive solar stillwith a heat energy storage systemrdquo Desalination vol 324 pp10ndash20 2013
[20] M Zamena S M Soufaria S AbbasianVahdata et al ldquoExper-imental investigation of a two-stage solar humidification-dehumidification desalination processrdquo Desalination vol 332no 1 pp 1ndash6 2014
[21] F Nematollahi A Rahimi and T T Gheinani ldquoExperimentaland theoretical energy and exergy analysis for a solar desalina-tion systemrdquo Desalination vol 317 pp 23ndash31 2013
[22] H BenBacha ldquoDynamicmodeling and experimental validationof a water desalination prototype by solar energy using humid-ification dehumidification processrdquo Desalination vol 322 pp182ndash208 2013
[23] K R Ranjan and S C Kaushik ldquoExergy analysis of the activesolar distillation systems integrated with solar pondsrdquo CleanTechnologies and Environmental Policy vol 16 no 5 pp 791ndash805 2014
[24] THERMIE ProgramDesalination Guide Using Renewable Ener-gies CRES Athens Greece 1998
[25] R Z Hu and X Chen ldquoA novel integrated solar desalinationsystem with multi-stage evaporationheat recovery processesrdquoRenewable Energy vol 64 pp 26ndash33 2014
Journal of Solar Energy 13
[26] Y B Tao and Y L He ldquoNumerical study on coupled fluid flowand heat transfer process in parabolic trough solar collectortuberdquo Solar Energy vol 84 no 10 pp 1863ndash1872 2010
[27] A Farouk Kothdiwala B Norton and P C Eames ldquoThe effectof variation of angle of inclination on the performance of low-concentration-ratio compound parabolic concentrating solarcollectorsrdquo Solar Energy vol 55 no 4 pp 301ndash309 1995
[28] V Gnielinski ldquoNew equations for heat and mass transferin turbulent pipe and channel flowrdquo International ChemicalEngineering vol 16 no 2 pp 359ndash363 1976
[29] F Incropera and D DeWitt Fundamentals of Heat and MassTransfer John Wiley amp Sons New York NY USA 3rd edition1990
[30] M Ouagued A Khellaf and L Loukarfi ldquoEstimation of thetemperature heat gain and heat loss by solar parabolic troughcollector under Algerian climate using different thermal oilsrdquoEnergy Conversion and Management vol 75 pp 191ndash201 2013
[31] V E Dudley G J Kolb and A R Mahoney ldquoTest resultsSEGS LS-2 solar collectorrdquo Tech Rep SAND94-1884 SANDIANational Laboratories Albuquerque NM USA 1994
[32] Y S Touloukian and D P DeWitt Radiative Properties Non-metallic Solids vol 8 of Thermophysical Properties of MatterPlenum Press New York NY USA 1972
[33] H T El-Dessouky H M Ettouney and F Mandani ldquoPerfor-mance of parallel feed multiple effect evaporation system forseawater desalinationrdquoAppliedThermal Engineering vol 20 no17 pp 1679ndash1706 2000
[34] J-C Han and L S Fletcher ldquoFalling film evaporation andboiling in circumferential and axial grooves on horizontaltubesrdquo Industrial amp Engineering Chemistry Process Design andDevelopment vol 24 no 3 pp 570ndash575 1985
[35] L Xu M Ge S Wang and Y Wang ldquoHeat-transfer film coeffi-cients of falling film horizontal tube evaporatorsrdquo Desalinationvol 166 no 1-3 pp 223ndash230 2004
[36] K Wangnick ldquoHow incorrectly determined physical and con-structional properties in the seawater and brine regimes influ-ence the design and size of an MSF desalination plant-stimulusfor further thoughtsrdquo in Proceedings of the IDAWorld Congresson Desalination and Water Science pp 201ndash218 Abu DhabiUAE 1995
[37] A Bejan G Tsatsaronis and M Moran Thermal Design andOptimization John Wiley amp Sons New York NY USA 1996
[38] M A Rosen and I Dincer ldquoExergoeconomic analysis of powerplants operating on various fuelsrdquoAppliedThermal Engineeringvol 23 no 6 pp 643ndash658 2003
[39] A Esmaieli M P Keshavarz S E Shakib and M AmidpourldquoApplying different optimization approaches to achieve optimalconfiguration of a dual pressure heat recovery steam generatorrdquoInternational Journal of EnergyResearch vol 37 no 12 pp 1440ndash1452 2012
[40] S R Hosseini M Amidpour and S E Shakib ldquoCost optimiza-tion of a combined power and water desalination plant withexergetic environment and reliability considerationrdquoDesalina-tion vol 285 pp 123ndash130 2012
[41] A G Kaviri M N M Jaafar and T M Lazim ldquoModeling andmulti-objective exergy based optimization of a combined cyclepower plant using a genetic algorithmrdquo Energy Conversion andManagement vol 58 pp 94ndash103 2012
[42] A Baghernejad and M Yaghoubi ldquoExergoeconomic analysisand optimization of an Integrated Solar Combined CycleSystem (ISCCS) using genetic algorithmrdquo Energy Conversionand Management vol 52 no 5 pp 2193ndash2203 2011
[43] M Hosseini I Dincer P Ahmadi H B Avval and MZiaasharhagh ldquoThermodynamic modelling of an integratedsolid oxide fuel cell and micro gas turbine system for desalina-tion purposesrdquo International Journal of Energy Research vol 37no 5 pp 426ndash434 2013
[44] ldquoEastman Chemical Companyrdquo 2014 httpwwwtherminolcom
TribologyAdvances in
Hindawi Publishing Corporationhttpwwwhindawicom Volume 2014
International Journal of
AerospaceEngineeringHindawi Publishing Corporationhttpwwwhindawicom Volume 2014
FuelsJournal of
Hindawi Publishing Corporationhttpwwwhindawicom Volume 2014
Journal ofPetroleum Engineering
Hindawi Publishing Corporationhttpwwwhindawicom Volume 2014
Industrial EngineeringJournal of
Hindawi Publishing Corporationhttpwwwhindawicom Volume 2014
Power ElectronicsHindawi Publishing Corporationhttpwwwhindawicom Volume 2014
Advances in
CombustionJournal of
Hindawi Publishing Corporationhttpwwwhindawicom Volume 2014
Journal of
Hindawi Publishing Corporationhttpwwwhindawicom Volume 2014
Renewable Energy
Submit your manuscripts athttpwwwhindawicom
Hindawi Publishing Corporationhttpwwwhindawicom Volume 2014
StructuresJournal of
International Journal of
RotatingMachinery
Hindawi Publishing Corporationhttpwwwhindawicom Volume 2014
EnergyJournal of
Hindawi Publishing Corporationhttpwwwhindawicom Volume 2014
Hindawi Publishing Corporation httpwwwhindawicom
Journal ofEngineeringVolume 2014
Hindawi Publishing Corporation httpwwwhindawicom Volume 2014
International Journal ofPhotoenergy
Hindawi Publishing Corporationhttpwwwhindawicom Volume 2014
Nuclear InstallationsScience and Technology of
Hindawi Publishing Corporationhttpwwwhindawicom Volume 2014
Solar EnergyJournal of
Hindawi Publishing Corporationhttpwwwhindawicom Volume 2014
Wind EnergyJournal of
Hindawi Publishing Corporationhttpwwwhindawicom Volume 2014
Nuclear EnergyInternational Journal of
Hindawi Publishing Corporationhttpwwwhindawicom Volume 2014
High Energy PhysicsAdvances in
The Scientific World JournalHindawi Publishing Corporation httpwwwhindawicom Volume 2014

2 Journal of Solar Energy
Solar filed Stea
m g
ener
ator
MED unit
Inlet sea water
Return sea water
Rejected brine
Desalinated water
Figure 1 Schematic diagram of the solar desalination plant
et al [10] investigated the optimum parameters of an MED-TVC unit using a hybrid metaheuristic optimization toolKhoshgoftar Manesh et al [11] tried to find optimal couplingof MED-RO desalination plant using genetic algorithm andexergoeconomic optimization
In the case of solar applications there are some studiesthat use genetic algorithm to find optimal solutions whichinclude the study performed by Silva et al [12] for optimizinga solar field with parabolic collectors
It is important to note that there are various types ofdesalination technologies including [13]
(i) multistage flash (MSF)(ii) multiple effect boiling (MEB) or multieffect desalina-
tion (MED)(iii) vapor compression (VC)(iv) freezing(v) humidification-dehumidification (HD)(vi) solar stills(vii) membrane processes
Industrial desalination technologies either use phasechange or involve semipermeable membranes to separate thesolvent or some solutes Therefore desalination techniquesmay be classified into the following categories phase changeor thermal processes and membrane or single-phase pro-cesses
In the phase change or thermal processes distillation ofseawater is achieved by utilizing a thermal energy sourceThermal energy may be obtained from a conventional fossilfuel source nuclear energy nonconventional solar energysource or geothermal energy In the membrane processeselectricity is used for either driving high-pressure pumps orionizing salts contained in the seawater
Some researchers have focused on ldquohumidification-dehumidification (HD)rdquo technologies for solar desalinationFor example Kabeel and El-Said [14 15] investigated a hybridsolar desalination system of air humidification dehumidi-fication and water flashing evaporation by both numericaland experimental techniques Chang et al [16] studiedthe effect of sea water flow rate on the performance ofa solar desalination plant using porous balls technique Liet al [17] built a small-scale humidification-dehumidification
desalination unit to test the effect of various parameters onthe unit performanceTheir results showed that different inletsprayed water temperatures in the pad humidifier from 9 to27∘C can effectively improve relative humidity of outlet moistair from 89 to 97 and the outlet air temperature from 35 to42∘C Other researchers (eg [18ndash22]) have investigated HDtechnologies to produce potable water at small-scale unitswhich is applicable for small-scale users
Some others have studied solar stills for example Ranjanand Kaushik [23] performed an energy and exergy analysison a solar pool desalination plant
However commercial desalination processes based onthermal energy are multistage flash (MSF) distillationmultiple-effect desalination (MED) and vapor compression(VC) which could be thermal (TVC) or mechanical (MVC)vapor compression
On the other hand according to a survey conductedunder a European research project [24] the most promisingand applicable solar desalination technologies were MSF andMED A list of installed desalination plants operated withrenewable energy sources up to 2003 was presented by Tzenand Morris [2] Hu and Chen [25] designed a small-scalesolar multieffect desalination unit using parabolic collectorsto evaporate the sea water
At the present study solar MED-TVC technology as thecombination of multiple-effect desalination (MED) and ther-mal vapor compression (TVC) was investigated The plantwas designed for a moderate town with demand of 2000ndash5000m3day Multiobjective genetic algorithm optimizationtechnique was used to find optimum parameters of a solardesalination plant which is schematically shown in Figure 1A heat transfer fluid (HTF) is heated and circulates in a closedsystem of parabolic collectors and transfers the absorbedsolar energy to heating water in the steam generator Theproduced steam is condensed at the first effect of the MEDunit and causes the sea water to evaporate The vapor isthen condensed into desalinated water (product water) at thenext effect by another sea water stream The plant is locatedin the city of Ahwaz in the southeastern part of Iran Themain objectives and contribution of this paper include thefollowing items
(i) multiobjective optimization of a solar desalinationplant using genetic algorithm
Journal of Solar Energy 3
(ii) considering maximum water production and min-imum costs as the multiobjective function for theoptimization
(iii) investigating the effect of different thermal oils on theplant efficiency and water production rates
(iv) performance of solar desalination plant have beenanalyzed at four characteristics days of the yearincluding spring equinox summer solstice fallequinox and winter solstice
(v) sensitivity analysis on solar collector acceptanceangle
(vi) plotting Pareto curve finding the optimum parame-ters and comparing themwith the design parameters
(vii) exact calculation of radiative heat loss for theparabolic collector
2 Mathematical Modeling
21 Solar Collector Heat Transfer Equations Mathematicalmodeling of solar parabolic collectors has been performedby many researchers (eg [26 27]) One-dimensional energybalance model developed by Tao and He [26] was adaptedhere For short receivers (lt100m) a one-dimensional energybalance provides reasonable results for longer receivers atwo-dimensional energy balance is necessary The modeldetermines the performance of a parabolic trough solarcollectorrsquos linear receiver also called a heat collector element(HCE) Inputs of themodel include collector andHCE geom-etry optical properties heat transfer fluid (HTF) propertiesHTF inlet temperature and flow rate solar insulation windspeed and ambient temperature Outputs include collectorefficiency outlet HTF temperature heat gain and heatand optical losses Modeling assumptions and limitationswere also discussed along with recommendations for modelimprovement
Figure 2 shows the one-dimensional steady-state energybalance for a cross-section of an HCE without the glassenvelope intact The optical losses are due to imperfectionsin the collector mirrors tracking errors shading and mirrorand HCE cleanliness
The effective incoming solar energy (solar energy minusoptical losses) is absorbed by the absorber selective coating1199021015840
3SolAbs Some energy that is absorbed into the selectivecoating is conducted through the absorber ( 1199021015840
23cond) andtransferred to the HTF by convection ( 1199021015840
12conv) the remainingenergy is transmitted back to (is lost) to the environment byconvection ( 1199021015840
36conv) and radiation ( 119902101584037rad) and through the
HCE support bracket through conduction ( 1199021015840cond bracket) Themodel assumes that all temperatures heat fluxes and thermo-dynamic properties are uniform around the circumferenceof the HCE Also all flux directions shown in Figure 2 arepositive Consider
1199021015840
12conv = 1199021015840
23cond
1199021015840
3SolAbs = 1199021015840
36conv + 1199021015840
37rad + 1199021015840
23cond + 1199021015840
cond bracket
1199021015840
HeatLoss = 1199021015840
36conv + 1199021015840
37rad + 1199021015840
cond bracket
(1)
Figure 2 One-dimensional steady-state energy balance and for across-section of an HCE
From Newtonrsquos law of cooling the convection heat transferfrom the inside surface of the absorber pipe to the HTF perunit length of the pipe is
1199021015840
12conv = ℎHTF1198631120587 (1198792 minus 1198791)
ℎHTF = Nu1198632
1198961
1198632
(2)
To model the convective heat transfer from the absorberto the HTF for turbulent and transitional cases (Reynoldsnumber gt 2300) the following Nusselt number correlationdeveloped by Gnielinski [28] is used
Nu1198632=
(1198918) (Reminus1000)Pr11 + 127radic1198918 (Pr23
1minus 1)
(
Pr1
Pr2
)
011
119891 = [182 log10(Re1198632) minus 164]
minus2
(3)
in which 119891 is the friction factor for the inner surface ofthe absorber pipe and Pr
1and Pr
2are Prandtl number
evaluated at the HTF temperature 1198791 and the inner surface
temperature 1198792 respectively
Fourierrsquos law of conduction through a hollow cylinderdescribes the conduction heat transfer through the absorberwall [29]
1199021015840
23cond =2120587119896 (119879
2minus 1198791)
ln (11986311198632)
(4)
The conduction coefficient depends on the absorber materialtype In this research the HCE performance model includesthree stainless steels 304L 316L and 321H and one copper
If there is a wind the convection heat transfer fromthe glass envelope to the environment will be forced con-vection The Nusselt number in this case is estimated with
4 Journal of Solar Energy
Biminus1 Ximinus1 Timinus1
Diminus1 Tciminus1
d998400i T
998400i
Di Ti
d998400998400i T
998400998400i
d998400i + d
998400998400i = Tci
Mf ti Xcw
Mf timinus1 Xcw
Di Tc119894minus1
sum nminus2
i=1Di +sum
nminus2
i=2d998400i = Tc119894minus1 sum nminus1
i=1Di +sum
nminus1
i=2d998400i = Tc119894
Figure 3 Heat and mass balance diagram for 119894th effect [33]
Zhukauskasrsquo correlation for external forced convection flownormal to an isothermal cylinder [29]
Nu1198633= 119862Re119898
1198633Pr1198994(
Pr4
Pr3
)
14
(5)
The net radiation transfer between the absorber pipe and skybecomes [29]
1199021015840
37rad = 1198601119865sur (1198691 minus 119869sur)
1198691= 1198641198871minus 119902
(1 minus 1205761)
1205761120587119863
119869sur = 1205901198794
Sky
119865sur =120579
360
(6)
in which 120590 is the Stefan-Boltzmann constant 120576 is the emissiv-ity of the pipe outer surface 119863 is the pipe outside diameterand 120579 is the collector angle with the sky Sky temperature119879skyis calculated using Ouagued et al [30] correlation
Other terms in (1) can be calculated using models andequations of other references (eg [31 32]) and are notmentioned here to prevent elongation of the paper
22 MED Design Model and Equations An MED unitincludes multiple effects which are similar to each other interms of energy andmass balance Figure 3 shows a schematicbalance diagram for 119894th effect [33] To simulate the MEDprocess it is necessary to solve equations of water massbalance salt mass balance and energy balance in each singleeffect and in the MED unit overall
Water Mass Balance
Consider
119865119894+ 119861119894minus1= 119863119894+ 119861119894 (7)
where 119865 119861 and 119863 are feed water flow rate brine flow rateand desalinated water flow rate respectively and 119894 is the 119894theffect no
Salt Mass BalanceConsider
119865119894119883119865119894+ 119883119861119894minus1119861119894minus1= 119883119861119894119861119894 (8)
where119883119861is the outlet brine concentration (in ppm) with the
maximum of 70000 ppm [33]
Energy Balance EquationConsider
119863119894minus1120582119894minus1+ 119889119894minus1120582119894minus1+ 1198891015840
119894minus11205821015840
119894minus1= 119865119894119862119901(119879119894minus 119879119891) + 119863119894120582119894
(9)
where 120582119894is the latent heat of vaporization in 119894th effect 119889
119894minus1
is the amount of vapor formed by brine flashing in effect 119894 minus1 and 1198891015840
119894minus1is the amount of vapor formed by flashing in the
flashing boxesThe main objective of MED simulation is to calculate
desalinated water flow rates 119863119894and 1198891015840
119894in each effect and
then summarize them to calculate total desalinated waterTo do this a detail physical and mathematical modeling ofheat transfer inside and outside the tubes in each effect andalso in condenser and thermocompressor is required Themathematical modeling of El-Dessouky et al [33] is adaptedhere and is ignored for abbreviation
Journal of Solar Energy 5
The formula presented byHan and Fletcher [34] is used inthis model for evaluation of the falling film evaporation heattransfer coefficient over horizontal tubes
ℎ119900(
1205832
sw1205882
sw1198921198963
sw)
13
= 00004Re02Pr065(11990210158401015840)04
(10)
where
Re =4 times
119891
2 times 120583sw119871effectradic119873 (11)
For condensation inside the tubes of the effects the formulapresented by Xu et al [35] is used
ℎ119894= 119896+(
119892120588119871(120588119871minus 120588V) 119896
3
119871ℎ1015840
119891119892
120583119871119889119894(119879sat minus 119879wallin)
)
14
(12)
where
119896+= 03508(
119871
119889119894
)
minus01929
sdot Re00643
Re =119889119894119881V120588119871
120583119871
(13)
Heat transfer coefficients inside and outside of the condenserstubes are calculated using equations given byWangnick [36]
ℎ119894119888= (32935 + 119879 (8424 minus 01714119879)
minus119883 (8471 + 01161119883 + 02716119879))
times ((
119889119894119888
017272
)
02
(0656119881)08(
119889119894119888
119889119900119888
))
minus1
ℎ119900119888= 0728(
119892120588119871(120588119871minus 120588V) 119896
3
119871ℎ1015840
119891119892
119873119888120583119871119889119900119888(119879sat minus 119879wallout)
)
14
(14)
where
ℎ1015840
119891119892= ℎ119891119892+
3
8
119862119901119897(119879V119894 minus 119879wallin) (15)
3 Economic Analysis
Total capital investment (TCI) is the sum of fixed capi-tal investment (FCI) and other outlays including start-upcost (SUC) working cost (WC) cost of licensing researchdevelopment (LRD) and allowance for funds used duringconstruction (AFUDC) [37 38]
In addition to equipment case other installation costs likepiping should be considered The cost for piping includes thematerial and labor costs of all items required to complete theerection of all the piping used directly in the system Thiscost represents 10ndash70 of the purchased-equipment costThefollowing relation can be supposed to calculate piping cost[38]
TCI = FCI + SUC +WC + LRD + AFUDC (16)
In addition to equipment case other installation costs likepiping should be considered The cost for piping includes thematerial and labor costs of all items required to complete theerection of all the piping used directly in the system Thiscost represents 10ndash70 of the purchased-equipment costThefollowing relation can be supposed to calculate piping cost[38]
119885pipe = PEC119908(
119883119910
119883119908
)
120572
(17)
Using this equation pipe cost can be estimated for a desireddiameter 119883
119910knowing pipe cost for a specific pipe diameter
119883119908 In the above equation 119883
119910is greater than 119883
119908and power
factor 120572 is usually less than unity and can be considered as095
Collector cost estimation was performed using correla-tions in [31] For other pieces of equipment including MEDsolar collectors and steam generator the cost estimationformulas used in [28ndash31] were ignored here for shortening
Considering plant lifetime 119899 and interest rate 119894 capitalrecovery factor (CRF) was calculated by
CRF = 119894(1 + 119894)119899
(1 + 119894)119899minus 1
(18)
Knowing all equipment piping and onsite costs total costinvestment (TCI) could be calculatedThen cost of producedwater per unit of mass flow rate was calculated using thefollowing equation
Cost =TCIdes
(19)
There are different methods to express total investment costas a function of designed parametersThemethod used in thispaper is based on calculation of total cost per unit of time [39]
119870=
TCI times CRF times 120593119873 times 3600
(20)
in which119870 represents the equipment component or system119873 is number of operational hours per year and 120593 is theoperation and maintenance (OampM) coefficient which isselected as 106 (according to [40 41])
4 Objective Function
Maximum desalinated water production rates as well asminimum total capital investment were the main items of theobjective function in the present study Thus the objectivefunction could be formulated by a combination of desalinatedwater mass flow rate and desalinated water cost
Cost = sum(TCI) (21)
des =119899
sum
119894=1
(119863119894+ 119889119894) (22)
6 Journal of Solar Energy
Table 1 Lower and upper bounds of decision variables
Decision variable Lower bound Upper bound119879pp (∘C) 5 50
119879ap (∘C) 5 50
119889119894119890(mm) 20 80
119867119862(m) 1 5
119871co (m) 1 5119882119862(m) 1 5
No effect (mdash) 3 10119871119890(m) 1 8
119873119905119888
10 50119873119905119890
10 50119889119900119888
(mm) 20 80119875 (bar) 8 15119879sH (∘C) 200 4001198632(mm) 20 80
Thickness (mm) 10 25119882Collector (m) 35 8119881pipe 1 35
As mentioned in Table 1 17 variables including ther-modynamic and geometric parameters for steam generatorMED and solar field were considered the decision vari-ables Although the decision variables might vary in theoptimization procedure each was normally required to bewithin a reasonable range The upper and lower bands ofthese parameters were selected based on the previous studies[8 39 42 43]
5 Validation of Calculations and Results
51 Solar Collector Validation Validation of the developedcode was proved by comparison of the obtained results withthe reported data of Dudley et al [31] as shown in Figure 4In this figure thermal efficiency of the collector as a functionof HTF average temperature is compared with the measureddata and the maximum of 5 discrepancy is investigatedThe model well predicted the collector behavior that is byincreasing HTF temperature heat losses increased which inturn led to decrease in the collector thermal efficiency
52MEDDesignValidation To validate the code the simula-tion results for aMEDunit including 7 effects were comparedwith the operational data of Kamali and Mohebinia [4]Table 2 indicates the essential parameters of the unit and acomparison between the simulated results and reported dataAs is shown in the case of desalinated water flow rate therewas only 135 discrepancy between the measured data andsimulated results
6 Results and Discussions
61 Assumptions Mathematical models were used for adesalination plant located in city of Ahwaz in the southeast-ern part of Iran Table 3 shows the environmental conditionsand constant parameters used in this simulation
100 150 200 250 300 350 40060
62
64
66
68
70
72
74
76
HTF average temperature (∘C)
Effici
ency
()
Measurement resultSimulation result
Figure 4 Effect of HTF average temperature on collector efficiencyin compaction with measured data of Dudley et al [31]
Properties of different thermal oils are mentioned in theAppendix It is important to note that there is a higher limitof temperature for different oils to prevent oxidation Theselimits are also presented in the Appendix These temperaturelimits would affect themaximum collector pipe length as willbe discussed in the following sections
62 Solar Field Simulation Results To reach proper accuracytotal pipe lengthwas divided into 4000 small distances As thefirst comparison criterion different maximum temperaturelimits were considered for different oils (according to theAppendix) therefore different pipe lengths were consideredfor different oils as shown in Table 4 Pipe pressure dropversus pipe segment is represented in Figure 5 From thebeginning of the pipe up to 1000 segments oil density andviscosity are decreased because of temperature rise thereforepressure drop is decreased Since the mass flow rate isconstant after about 1500 segments decreasing density leadsto increase in volume flow rate and HTF velocity This effectovercomes the viscosity effect and increases pressure dropIt is important to note that THERMINOL 66 has minimumpressure drop among different oils However to minimizethe operational cost the intention is to find the HTF withminimum pumping power
Total pumping power is calculated from the followingequation
119901=
sum4000
eleman=1 (Δ119875(bar119898)eleman times 119871eleman)
120578119901120588
(23)
inwhich119871Δ119875 120578119901 and120588 are element length element pressure
drop pump efficiency and oil density respectivelyTherefore pumping power is proportional to both pres-
sure drop and total pipe length As seen from Figure 5THERMINOL66has theminimumpressure drop in one pipesegment If a unique total pipe length was considered for alloils THERMINOL 66 would have the minimum pumpingpower But in this research the considered limit formaximumallowable temperature led to different pipe length for differentoils Since THERMINOL 59 has the minimum pipe length
Journal of Solar Energy 7
Table 2 Data validation for MED simulation
Parameter Unit Operational data [4] Simulated results Difference ()Number of effects mdash 7 7 AssumptionLength of tubes M 41 41 AssumptionMotive steam pressure Barg 10 10 AssumptionMotive steam temperature ∘C 170 170 AssumptionMotive steam mass flow rate tonsh 8 8 AssumptionNumber of tubes in each effect mdash 1996 1973 minus117Sea water flow rate tonsh 420 429 210Desalinated water flow rate (tonsd) tonsd 1536 1557 135
Table 3 Environmental conditions and constant parameters forsimulation
Constant Parameter Unit ValueLatitude ∘ 3130Elevation from sea level m 1700Average relative humidity 6000Average ambient temperature ∘C 1500Mirrorrsquos Clearness efficiency 094Reflection efficiency 093Solar absorber pipe inside diameter mm 6500Solar absorber pipe outside diameter mm 7500Pipe material mdash steel 321HCollector width m 576Collector acceptance angle ∘ 135
Table 4 Comparison of solar field parameters for different thermaloils considering maximum temperature limit for different oils
VP1 THERMINOL 66 THERMINOL 59Length (m) 245550 138100 110750119879out (∘C) 39902 34404 31404
119882pump (KW) 4560 2315 1897DpTotal (bar) 4655 2427 1946
(Table 4) therefore it has the minimum pumping poweramong the different oils
Considering both pipe length and pressure drop fromdata of Table 4 it can be concluded that pumping power isminimum for THERMINOL 59 while THERMINOL VP1has maximum outlet temperature maximum pipe length(maximum pipe cost) and maximum pumping power (max-imum pump cost) On the other hand this oil could producemore live steam which in turn causes production of moredesalinated water and could be verified by Figure 6 thatindicates the mass flow rate of desalinated water during theautumnal equinox It can be concluded that at the solar noonwater production rate for THERMINOL VP1 is 71 morethan that for THERMINOL 59
As the second comparison criterion outlet temperaturewas considered 314∘C for all oils which corresponded tothe maximum acceptable temperature of THERMINOL 59With this assumption simulation results are summarized in
0 1000 2000 3000 4000 5000 6000 700000085
0009
00095
001
00105
0011
00115
Pipe segment
Pres
sure
dro
p (b
ar)
THERMINOL 59
THERMINOL 66
THERMINOL VP1
Figure 5 Pressure drop versus pipe segments for different thermaloils
7 8 9 10 11 12 13 14 15 16 170
100
200
300
400
500
600
700
800
Time (h)
Fres
h w
ater
pro
duct
ion
(m3
day)
THERMINOL 59
THERMINOL 66
THERMINOL VP1
Figure 6 Variation of fresh desalinated water flow rate during theautumnal equinox for different thermal oils
Table 5 In this case THERMINOL 66 has minimum pipelength and minimum pumping power
Bracket radiative and convective heat losses at the pipeinlet and outlet are indicated in Figure 7 for different oilsIn the pipe inlet section the surface temperature is lowtherefore the convective heat loss is more important than theradiative one In contrast in pipe outlet section surface tem-perature is higher therefore the radiative heat loss becomesdominant It can be verified fromFigure 8 that going through
8 Journal of Solar Energy
Table 5 Comparison of solar field parameters for different thermaloils considering outlet temperature of 315∘C for all the oils
VP1 THERMINOL 66 THERMINOL 59Length (m) 1255 11070 110750119879out (∘C) 31400 31400 31404
119882pump (KW) 2181 1849 1897DpTotal (bar) 2227 1938 1946
Bracket Radiation Convection0
10
20
30
40
50
60
70
Hea
t los
s (
)
InletOutlet
Figure 7 Heat loss mechanism at inlet and outlet of the collectorpipe
0 500 1000 1500 2000 2500 3000 3500 40000
500
1000
1500
2000
2500
3000
Pipe segment
hi
(Wm
2middot
C)
THERMINOL 59
THERMINOL 66
THERMINOL VP1
Figure 8 Inside heat transfer coefficient versus pipe segment fordifferent thermal oils
the pipe inlet to the pipe outlet segments inside convectiveheat transfer coefficient increases therefore pipe surfacetemperature would be closer to the HTF higher temperature
Sum of heat losses during pipe segments is shown inFigure 9 for different oils THERMINOL VP1 has maximumheat loss compared to others
Since the intention is to gain maximum solar energy itis a good idea to use the oil with maximum temperaturelimit THERMINOL VP1 Although it involves the greatestheat losses andmaximumpumping power its performance inproducing higher desalinated flow rates is more attractive intechnical and economic termsTherefore this oil was selectedfor the rest of calculations
0 500 1000 1500 2000 2500 3000 3500 4000200
400
600
800
1000
1200
1400
1600
1800
Pipe segment
Hea
t los
s (W
)
THERMINOL 59
THERMINOL 66THERMINOL VP1
Figure 9 Total heat loss versus pipe segments for different thermaloils
0 1 2 3 4 5 6 7280
300
320
340
360
380
400
Wind velocity (ms)
Tou
t(∘
C)
Figure 10 Variation of outlet HTF (selected THERMINO VP1)temperature versus wind velocity
Figure 10 shows THERMINO VP1 outlet temperature asa function of wind velocity It is clear that with increasingwind velocity convective heat losses increase and the outlettemperature decreases which in turn leads to decreasingsteam and water production rates Therefore it is recom-mended to use glass covers to reduce convective losses If glasscovers were used energy balance equations would be slightlydifferent from those established here
63 MED Simulation Results It is a general rule for MEDunits that up to a specific limit using more number of effectswhich means more heat transfer areas and more capital costsleads to producing more desalinated water with the samesteam flow rate This comment is verified by Figure 11
64 Optimization by Multi Objective Genetic Algorithm Asstated previously the intention was to optimize the solarMED plant using genetic algorithm (GA) with 17 decisionvariables (Table 1) The main objective function was to max-imize desalinated water flow rate and minimize total capitalinvestments (recall (20) and (21)) For simulating the plant aMATLAB code was developed and for its optimization themultiobjective GA toolbox of this software was establishedPrior to finding the optimized state of the plant the decision
Journal of Solar Energy 9
Table 6 Values of decision variables for the design and optimizedcase
Decision variable Design case value Optimized case value119879pp (∘C) 20 941
119879ap (∘C) 20 1114
119889119894119890(mm) 2875 4817
119867119862(m) 1 257
119871co (m) 3 231119882119862(m) 42 316
No effect (mdash) 4 1000119871119890(m) 41 242
119873119905119888
16 2339119873119905119890
35 2900119889119900119888
(mm) 20 5608119875 (bar) 9 849119879sH (∘C) 200 210371198632(mm) 65 5707
Thickness (mm) 15 1421119882Collector (m) 576 753119881pipe 2 321
2000
2500
3000
3500
4000
Number of effects4 42 44 46 48 5 52 54 56 58 6
600
800
1000
1200
1400
Des
alin
atio
n (m
3 da
y)
Desalination (m3d)
A(m
2)
A (m2)
Figure 11 Variation of heat transfer area and desalinated water flowrate versus number of effects
variables for THERMINOL VP1 were considered (accordingto Table 6) the base case (design case)
The optimization results are shown in Figure 12 as threePareto curves for the three oils According to this figureTHERMINOL VP1 shows a better behavior in terms ofthe specified objective function (minimize cost versus waterproduction rate)
Using these Pareto curves the absolute optimum point ofthe operation can be determined In this case a special codewas used to determine the optimum point Values of decisionparameters for optimized case are presented in Table 6 forTHERMINOL VP1 Comparison of these values with theoriginal values of design case mentioned in Table 6 showshow this optimization differs from the base case
To better understand the differences between the opti-mized case and the base case four characteristic days ofthe year (ie spring equinox summer solstice fall equinoxand the winter solstice) were studied Rates of solar flux on
0 2000 4000 6000 8000 10000 12000 140000
001
002
003
004
005
006
Fresh water production (m3day)
Cos
t ($
s)
THERMINOL 59
THERMINOL 66
THERMINOL VP1
Figure 12 Pareto curves for different HTFs with objective functionof water production and total capital investment
7 8 9 10 11 12 13 14 15 16 170
500
1000
1500
2000
2500
3000
3500
4000
4500
Time (h)
Design resultOptimized result
Fres
h w
ater
pro
duct
ion
(m3
day)
Figure 13 Comparison between design and optimized case in termsof fresh water production during spring equinox
a horizontal surface for these characteristic days were 10101200 820 and 680Wm2 respectively Figures 13 14 15 and16 show that as solar flux decreases rate of the produced wateralso decreases but there is a sensible difference between thebase case and optimized case on all characteristic days
For further analysis both the design case and optimizedcase are compared in Figures 17 and 18 in terms of freshdesalinated water flow rate and total capital investment dur-ing autumnal equinox As can be concluded from Figure 17there is a considerable difference in water production ratebetween the two cases especially at solar noon On the otherhand total investment cost per cubicmeter of producedwateris also less in the optimized case according to Figure 18It is important to note that during morning hours oiltemperature is less than the minimum desired value forsteam generation therefore oil is bypassed from the steamgenerator and MED unit and circulated in a close loop ofsolar field During this period of time pumping costs areconsidered OampM costs
Therefore it can be concluded that the genetic algorithmis a powerful tool for optimization of a solar desalinationplant in terms of technical and economical items
10 Journal of Solar Energy
7 8 9 10 11 12 13 14 15 16 17
Time (h)
Design resultOptimized result
Fres
h w
ater
pro
duct
ion
(m3
day)
0
1000
2000
3000
4000
5000
6000
Figure 14 Comparison between design and optimized case in termsof fresh water production during summer solstice
7 8 9 10 11 12 13 14 15 16 17
Time (h)
Design resultOptimized result
Fres
h w
ater
pro
duct
ion
(m3
day)
0
1000
2000
3000
4000
5000
6000
Figure 15 Comparison between design and optimized case in termsof fresh water production during autumnal equinox
65 Sensitivity Analysis To perform a sensitivity analysissolar collector acceptance angle was reduced from 135 (designcase) to 125 degrees and Pareto curves of both cases areplotted in Figure 18 It can be seen that for a definite cost valueof 00153 $s the daily water production in the acceptanceangle of 135 degrees is 352 cubic meters more than the casewith 125 degrees of acceptance angle while this differencedecreases to 17 cubic meters per day for the cost of 0005 $s
Decreasing the collector acceptance angle from 135 to125 degrees leads to considerable increase in cost A slightvariation in solar field parameters indicates that geneticalgorithm changes the MED and steam generator designparameters simultaneously to reach the new optimized case
7 Conclusion
The simulation results showed that among three differentthermal oils THERMINOL VP1 needed greater pipe lengththan others considering the same outlet HTF temperatureand produced more desalinated water while total capitalinvestments were of the same order
7 8 9 10 11 12 13 14 15 16 17
Time (h)
Design resultOptimized result
Fres
h w
ater
pro
duct
ion
(m3
day)
0
100
200
300
400
500
600
700
800
900
1000
Figure 16 Comparison between the design and the optimized casein terms of fresh water production winter solstice
8 9 10 11 12 13 14 15 160
4
8
12
16
20
Time (h)
OptDesign
Cos
t ($
s)
Figure 17 Comparison between design and optimized case in termsof cost of one cubic meter of produced fresh water during autumnalequinox
Increasing wind velocity considerably decreased solarfiled efficiency On the other hand increasing wind velocityfrom 05 to 20ms led to 10 increase in heat losses
Using genetic algorithm for the plant optimizationresulted in determining an optimized case which producedmore desalinated water meanwhile its total investment costwas reduced Pareto curves also indicated that THERMINOLVP1 had less price and higher water flow rates than other oilswhich showed that GA well predicted the proper oil as wasexpected from the previous analysis and knowledge
Reduction of solar collector acceptance angle from 135to 125 degrees caused increasing the total cost in high waterflow rates while there was a small effect at low flow ratesindicating that GA led to change in design parameters of the
Journal of Solar Energy 11
0 2000 4000 6000 8000 10000 12000 140000
0005
001
0015
002
0025
003
Fresh water production (m3day)
Cos
t ($
s)
125 deg135 deg
Figure 18 Sensitivity analysis on solar collector acceptance angle
MED unit and steam generator as well as those of solar fieldsimultaneously in order to determine the optimized case
Appendix
Thermal Oil Properties
Property Equations for Various Thermal Oils (see [44])THERMINOL VP1
Consider
120588 = minus090119879 + 0000781198792minus 236 times 10
minus61198793+ 108325
119870 = minus 819 times 10minus6119879 minus 192 times 10
minus71198792+ 25 times 10
minus111198793
minus 729 times 10minus151198794+ 0178
120583 = 01794 times 119879minus1167
119862119901= 00024119879 + 595 times 10
minus61198792minus 298 times 10
minus91198793
+ 441 times 10minus111198794+ 15
119879max (∘C) = 400
(A1)
THERMINOL 66Consider
120588 = minus0614119879 minus 0000321198792+ 102062
119870 = minus33 times 10minus4119879 minus 15 times 10
minus71198792+ 0118294
120583 = 10minus6times 120588 exp( 386375
119879 + 625
minus 22809)
119862119901= 00033119879 + 89 times 10
minus71198792+ 149
119879max (∘C) = 345
(A2)
THERMINOL 59Consider
120588 = minus0692119879 minus 000301198792+ 198906
119870 = minus64 times 10minus5119879 minus 13 times 10
minus71198792+ 01226
120583 = 10minus6times 120588 exp(503471
119879 + 100
minus 225076)
119862119901= 00031119879 + 54 times 10
minus71198792+ 161
119879max (∘C) = 315
(A3)
Nomenclature
119861 Parameter for estimation of BPE (∘C)119862 Parameter for estimation of BPE (∘C)119862119901 Heat capacity (kjkgsdotK)
BPE Boiling point elevation (∘C)1198632 Inlet diameter tube of absorber
119863119894119890 Inlet diameter tube of effect
119863119894119888 Inlet diameter tube of condenser
119889119879 Effects temperature difference (∘C)119866 Mass flux kg(m2sdots)119892 Gravitational constant 981 ms2119867119888 Height of condenser Shell
119870119898 Heat transfer coefficient of tube wall (KWkg∘C)
119871 Tube length (m)119871119890 Evaporator length (m)
119873119905119890 Number of tubes on one line for effect
119873119905119888 Number of tubes on one line for
condenser119873119908 Number of rows wide
119873119903 Number of tubes rows deep
Nu Nusselt numberPP Pinch point (C or K)119875main Maine steam pressureRe Reynolds number119905 Tube of absorber thickness (mm)119881 Velocity (ms)V119891 Specific volume of fluid (m3kg)
119882119888 Width of condenser Shell
Z Capital cost rate ($s)119885119870 Component purchase cost ($)
Greek Symbols
120574 Specific heat ratio120588 Density (kgm3)120601 Maintenance factor120583 Dynamic viscosity kg(ssdotm)120590 Surface tension kgs2
12 Journal of Solar Energy
Subscripts
1 Heat transfer fluid2 Inner absorber pipe surface3 Outer absorber pipe surface4 Ambient5 SkyB BrineCon CondenserCond ConductionConv ConvectionCRF Capital recovery factorEva EvaporationF Feed seawaterO Out119868 Interest rateIn Inlet condition119870 Component119875 Tube pinch (mm)Sat Saturated conditionsSH Steam high pressureSW SeawaterV Vapor phase
Conflict of Interests
The authors declare that there is no conflict of interestsregarding the publication of this paper
References
[1] M Stroud Solar Desalination in the Southwest United StatesDepartment of Hydrology andWater ResourcesTheUniversityof Arizona Tucson Ariz USA 2014
[2] E Tzen and R Morris ldquoRenewable energy sources for desalina-tionrdquo Solar Energy vol 75 no 5 pp 375ndash379 2003
[3] R K Kamali A Abbassi S A S Vanini and M S AvvalldquoThermodynamic design and parametric study of MED-TVCrdquoDesalination vol 222 no 1ndash3 pp 596ndash604 2008
[4] R K Kamali and S Mohebinia ldquoExperience of design andoptimization of multi-effects desalination systems in IranrdquoDesalination vol 222 no 1ndash3 pp 639ndash645 2008
[5] M Skiborowski A Mhamdi K Kraemer and W MarquardtldquoModel-based structural optimization of seawater desalinationplantsrdquo Desalination vol 292 pp 30ndash44 2012
[6] B Najafi A Shirazi M Amin Yavari F Rinaldi and R ATaylor ldquoExergetic economic and environmental analyses andmulti objective optimization of an SOFC-gas turbine hybridcycle coupled with an MSF desalination systemrdquo Desalinationvol 334 pp 46ndash59 2014
[7] H Shahandeh J Ivakpour andN Kasiri ldquoInternal and externalHIDiCs (heat-integrated distillation columns) optimization bygenetic algorithmrdquo Energy vol 64 pp 875ndash886 2014
[8] I Janghorban Esfahani and C K Yoo ldquoFeasibility study andperformance assessment for the integration of a steam-injectedgas turbine and thermal desalination systemrdquoDesalination vol332 pp 18ndash32 2014
[9] K Ansari H Sayyaadi and M Amidpour ldquoThermoeconomicoptimization of a hybrid pressurized water reactor (PWR)power plant coupled to a multi effect distillation desalination
system with thermo-vapor compressor (MED-TVC)rdquo Energyvol 35 no 5 pp 1981ndash1996 2010
[10] H Sayyaadi A Saffari and A Mahmoodian ldquoVariousapproaches in optimization ofmulti effects distillation desalina-tion systems using a hybrid meta-heuristic optimization toolrdquoDesalination vol 254 no 1ndash3 pp 138ndash148 2010
[11] M H Khoshgoftar Manesh H Ghalami M Amidpour andM H Hamedi ldquoOptimal coupling of site utility steam networkwith MED-RO desalination through total site analysis andexergoeconomic optimizationrdquo Desalination vol 316 pp 42ndash52 2013
[12] R Silva M Berenguel M Perez and A Fernandez-GarcialdquoThermo-economic design optimization of parabolic troughsolar plants for industrial process heat applications withmemetic algorithmsrdquoApplied Energy vol 113 pp 603ndash614 2014
[13] S Kalogirou Solar Energy Engineering Processes and SystemsElsevier New York NY USA 1st edition 2009
[14] A E Kabeel and E M S El-Said ldquoA hybrid solar desalinationsystem of air humidification-dehumidification and water flash-ing evaporation Part I A numerical investigationrdquo Desalina-tion vol 320 pp 56ndash72 2013
[15] A E Kabeel and E M S El-Said ldquoA hybrid solar desali-nation system of air humidification dehumidification andwater flashing evaporation part II Experimental investigationrdquoDesalination vol 341 pp 50ndash60 2014
[16] Z Chang H Zheng Y Yang Y Su and Z Duan ldquoExperimentalinvestigation of a novel multi-effect solar desalination systembased on humidificationdehumidification processrdquo RenewableEnergy vol 69 pp 253ndash259 2014
[17] X Li G Yuana Z Wanga H Lib and Z Xub ldquoExperimentalstudy on a humidification and dehumidification desalinationsystem of solar air heater with evacuated tubesrdquo Desalinationvol 351 pp 1ndash8 2014
[18] G Franchini and A Perdichizzi ldquo Modeling of a solar drivenHD (humidification-dehumidification) desalination systemrdquoEnergy Procedia vol 45 pp 588ndash597 2014
[19] O Ansari M Asbik A Bah A Arbaoui and A KhmouldquoDesalination of the brackish water using a passive solar stillwith a heat energy storage systemrdquo Desalination vol 324 pp10ndash20 2013
[20] M Zamena S M Soufaria S AbbasianVahdata et al ldquoExper-imental investigation of a two-stage solar humidification-dehumidification desalination processrdquo Desalination vol 332no 1 pp 1ndash6 2014
[21] F Nematollahi A Rahimi and T T Gheinani ldquoExperimentaland theoretical energy and exergy analysis for a solar desalina-tion systemrdquo Desalination vol 317 pp 23ndash31 2013
[22] H BenBacha ldquoDynamicmodeling and experimental validationof a water desalination prototype by solar energy using humid-ification dehumidification processrdquo Desalination vol 322 pp182ndash208 2013
[23] K R Ranjan and S C Kaushik ldquoExergy analysis of the activesolar distillation systems integrated with solar pondsrdquo CleanTechnologies and Environmental Policy vol 16 no 5 pp 791ndash805 2014
[24] THERMIE ProgramDesalination Guide Using Renewable Ener-gies CRES Athens Greece 1998
[25] R Z Hu and X Chen ldquoA novel integrated solar desalinationsystem with multi-stage evaporationheat recovery processesrdquoRenewable Energy vol 64 pp 26ndash33 2014
Journal of Solar Energy 13
[26] Y B Tao and Y L He ldquoNumerical study on coupled fluid flowand heat transfer process in parabolic trough solar collectortuberdquo Solar Energy vol 84 no 10 pp 1863ndash1872 2010
[27] A Farouk Kothdiwala B Norton and P C Eames ldquoThe effectof variation of angle of inclination on the performance of low-concentration-ratio compound parabolic concentrating solarcollectorsrdquo Solar Energy vol 55 no 4 pp 301ndash309 1995
[28] V Gnielinski ldquoNew equations for heat and mass transferin turbulent pipe and channel flowrdquo International ChemicalEngineering vol 16 no 2 pp 359ndash363 1976
[29] F Incropera and D DeWitt Fundamentals of Heat and MassTransfer John Wiley amp Sons New York NY USA 3rd edition1990
[30] M Ouagued A Khellaf and L Loukarfi ldquoEstimation of thetemperature heat gain and heat loss by solar parabolic troughcollector under Algerian climate using different thermal oilsrdquoEnergy Conversion and Management vol 75 pp 191ndash201 2013
[31] V E Dudley G J Kolb and A R Mahoney ldquoTest resultsSEGS LS-2 solar collectorrdquo Tech Rep SAND94-1884 SANDIANational Laboratories Albuquerque NM USA 1994
[32] Y S Touloukian and D P DeWitt Radiative Properties Non-metallic Solids vol 8 of Thermophysical Properties of MatterPlenum Press New York NY USA 1972
[33] H T El-Dessouky H M Ettouney and F Mandani ldquoPerfor-mance of parallel feed multiple effect evaporation system forseawater desalinationrdquoAppliedThermal Engineering vol 20 no17 pp 1679ndash1706 2000
[34] J-C Han and L S Fletcher ldquoFalling film evaporation andboiling in circumferential and axial grooves on horizontaltubesrdquo Industrial amp Engineering Chemistry Process Design andDevelopment vol 24 no 3 pp 570ndash575 1985
[35] L Xu M Ge S Wang and Y Wang ldquoHeat-transfer film coeffi-cients of falling film horizontal tube evaporatorsrdquo Desalinationvol 166 no 1-3 pp 223ndash230 2004
[36] K Wangnick ldquoHow incorrectly determined physical and con-structional properties in the seawater and brine regimes influ-ence the design and size of an MSF desalination plant-stimulusfor further thoughtsrdquo in Proceedings of the IDAWorld Congresson Desalination and Water Science pp 201ndash218 Abu DhabiUAE 1995
[37] A Bejan G Tsatsaronis and M Moran Thermal Design andOptimization John Wiley amp Sons New York NY USA 1996
[38] M A Rosen and I Dincer ldquoExergoeconomic analysis of powerplants operating on various fuelsrdquoAppliedThermal Engineeringvol 23 no 6 pp 643ndash658 2003
[39] A Esmaieli M P Keshavarz S E Shakib and M AmidpourldquoApplying different optimization approaches to achieve optimalconfiguration of a dual pressure heat recovery steam generatorrdquoInternational Journal of EnergyResearch vol 37 no 12 pp 1440ndash1452 2012
[40] S R Hosseini M Amidpour and S E Shakib ldquoCost optimiza-tion of a combined power and water desalination plant withexergetic environment and reliability considerationrdquoDesalina-tion vol 285 pp 123ndash130 2012
[41] A G Kaviri M N M Jaafar and T M Lazim ldquoModeling andmulti-objective exergy based optimization of a combined cyclepower plant using a genetic algorithmrdquo Energy Conversion andManagement vol 58 pp 94ndash103 2012
[42] A Baghernejad and M Yaghoubi ldquoExergoeconomic analysisand optimization of an Integrated Solar Combined CycleSystem (ISCCS) using genetic algorithmrdquo Energy Conversionand Management vol 52 no 5 pp 2193ndash2203 2011
[43] M Hosseini I Dincer P Ahmadi H B Avval and MZiaasharhagh ldquoThermodynamic modelling of an integratedsolid oxide fuel cell and micro gas turbine system for desalina-tion purposesrdquo International Journal of Energy Research vol 37no 5 pp 426ndash434 2013
[44] ldquoEastman Chemical Companyrdquo 2014 httpwwwtherminolcom
TribologyAdvances in
Hindawi Publishing Corporationhttpwwwhindawicom Volume 2014
International Journal of
AerospaceEngineeringHindawi Publishing Corporationhttpwwwhindawicom Volume 2014
FuelsJournal of
Hindawi Publishing Corporationhttpwwwhindawicom Volume 2014
Journal ofPetroleum Engineering
Hindawi Publishing Corporationhttpwwwhindawicom Volume 2014
Industrial EngineeringJournal of
Hindawi Publishing Corporationhttpwwwhindawicom Volume 2014
Power ElectronicsHindawi Publishing Corporationhttpwwwhindawicom Volume 2014
Advances in
CombustionJournal of
Hindawi Publishing Corporationhttpwwwhindawicom Volume 2014
Journal of
Hindawi Publishing Corporationhttpwwwhindawicom Volume 2014
Renewable Energy
Submit your manuscripts athttpwwwhindawicom
Hindawi Publishing Corporationhttpwwwhindawicom Volume 2014
StructuresJournal of
International Journal of
RotatingMachinery
Hindawi Publishing Corporationhttpwwwhindawicom Volume 2014
EnergyJournal of
Hindawi Publishing Corporationhttpwwwhindawicom Volume 2014
Hindawi Publishing Corporation httpwwwhindawicom
Journal ofEngineeringVolume 2014
Hindawi Publishing Corporation httpwwwhindawicom Volume 2014
International Journal ofPhotoenergy
Hindawi Publishing Corporationhttpwwwhindawicom Volume 2014
Nuclear InstallationsScience and Technology of
Hindawi Publishing Corporationhttpwwwhindawicom Volume 2014
Solar EnergyJournal of
Hindawi Publishing Corporationhttpwwwhindawicom Volume 2014
Wind EnergyJournal of
Hindawi Publishing Corporationhttpwwwhindawicom Volume 2014
Nuclear EnergyInternational Journal of
Hindawi Publishing Corporationhttpwwwhindawicom Volume 2014
High Energy PhysicsAdvances in
The Scientific World JournalHindawi Publishing Corporation httpwwwhindawicom Volume 2014
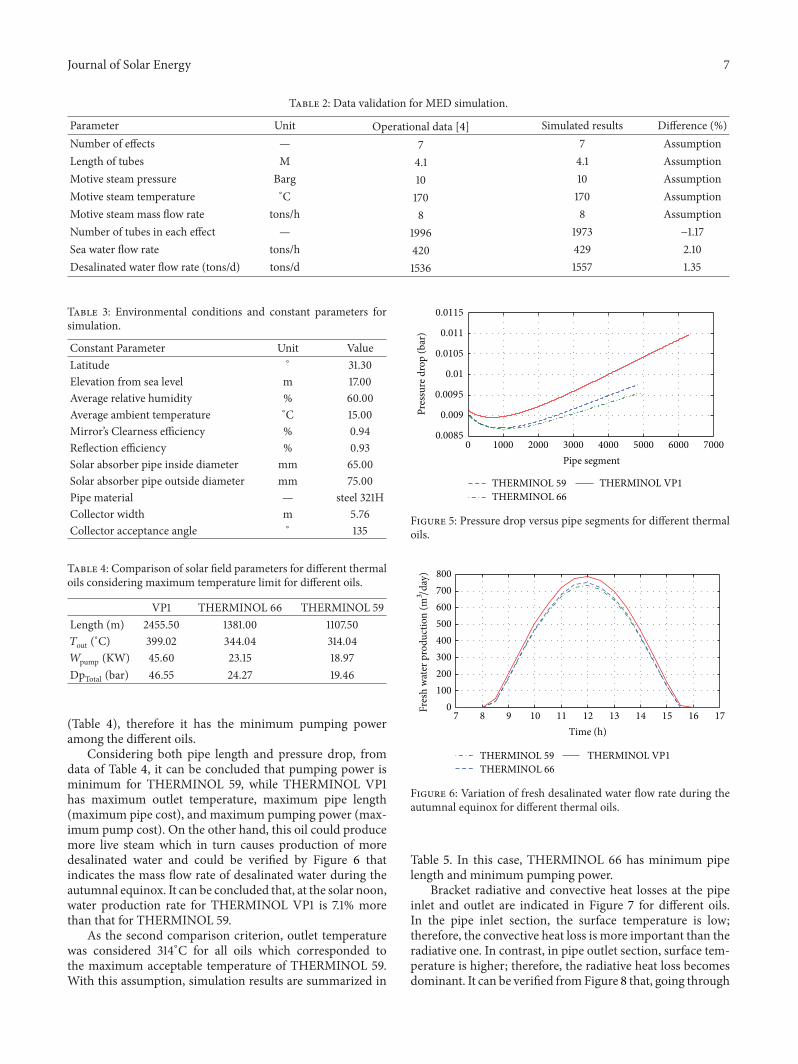