(research note) - arxiv.org · astronomy&astrophysicsmanuscript no. non_detect_v6.3.1_arxiv c...
TRANSCRIPT
arX
iv:1
603.
0461
6v1
[ast
ro-p
h.S
R]
15 M
ar 2
016
Astronomy& Astrophysicsmanuscript no. non_detect_v6.3.1_arXiv c©ESO 2018May 19, 2018
A coronagraphic search for wide sub-stellar companions amo ngmembers of the Ursa Major moving group ⋆
(Research Note)M. Ammler - von Eiff1,2, 3, 4, 5, 6, A. Bedalov3, 7, C. Kranhold2, M. Mugrauer3, T.O.B. Schmidt3, 8, R. Neuhäuser3, and
R. Errmann3, 9
1 Max-Planck-Institut für Sonnensystemforschung, Justus-von-Liebig-Weg 3, 37077 Göttingen, Germany, e-mail:[email protected]
2 Thüringer Landessternwarte, Sternwarte 5, 07778 Tautenburg, Germany3 Astrophysikalisches Institut und Universitäts-Sternwarte Jena, Schillergäßchen 2-3, 07745 Jena, Germany4 Centro de Astronomia e Astrofísica da Universidade de Lisboa, Observatório Astronómico de Lisboa, Tapada da Ajuda, 1349-018
Lisboa, Portugal5 Centro de Astrofísica da Universidade do Porto, Rua das Estrelas, 4150-762 Porto, Portugal6 Georg-August-Universität, Institut für Astrophysik. Friedrich-Hund-Platz 1, 37077 Göttingen, Germany7 Faculty of Natural Sciences, University of Split, Teslina 12. 21000 Split, Croatia8 Hamburger Sternwarte, Gojenbergsweg 112, 21029 Hamburg, Germany9 Abbe Center of Photonics, Friedrich-Schiller-Universität Jena, Max-Wien-Platz 1, 07743 Jena, Germany
ABSTRACT
Context. We present the results of a survey to detect low-mass companions of UMa group members, carried out in 2003-2006 withNACO at the ESO VLT. While many extra-solar planets and planetary candidates have been found in close orbits around starsbythe radial velocity and the transit method, direct detections at wider orbits are rare. The Ursa Major (UMa) group, a young stellarassociation at an age of about 200-600 Myr and an average distance of 25 pc, has not yet been addressed as a whole although itsmembers represent a very interesting sample to search for and characterize sub-stellar companions by direct imaging.Aims. Our goal was to find or to provide detection limits on wide sub-stellar companions around nearby UMa group members usinghigh-resolution imaging.Methods. We searched for faint companions around 20 UMa group memberswithin 30 pc. The primaries were placed below a semi-transparent coronagraph, a rather rarely used mode of NACO,to increase the dynamic range of the images. In most cases, secondepoch images of companion candidates were taken to check whether they share common proper motion with the primary.Results. Our coronagraphic images rule out sub-stellar companions around the stars of the sample. A dynamical range of typically13-15 mag in theKs band was achieved at separations beyond 3" from the star. Candidates as faint asKs ≈ 20 were securely identifiedand measured. The survey is most sensitive between separations of 100 and 200 au but only on average because of the very differenttarget distance. Field coverage reaches about 650 au for themost distant targets. Most of the 200 candidates are visiblein two epochs.All of those were rejected being distant background objects.
Key words. Stars: binaries: visual – Stars: imaging – Stars: brown dwarfs – Galaxy: open clusters and associations: individual: UMagroup – Galaxy: solar neighborhood
1. Introduction
By now almost 1,300 brown dwarfs have been found, classifiedwith spectral types L, T, and Y (Kirkpatrick 2008; Cushing etal.2011)1. This number has been surpassed by indirect detections inthe planetary regime – by now more than 600 by radial velocityvariations and more than 1,200 by the transit method.2
While indirect methods are most sensitive to objects in veryclose orbits around the targets, direct imaging detects objects inwider orbits and thus is complementary. Ideally, direct imag-ing is combined with simultaneous measurement of the radial
Send offprint requests to: M. Ammler - von Eiff⋆ Based on observations collected at the European Southern Obser-
vatory, Chile, in programmes 72.C-0485, 73.C-0225, 76.C-0777, 77.C-0268, 384.C-0245A1 See http://www.DwarfArchives.org for a full account.2 See http://www.exoplanet.eu for further details and updates.
velocity variation (Guenther et al. 2005). Young sub-stellar ob-jects still contract and are self-luminous (Burrows et al. 1997)so that their direct detection is less difficult up to ages of afew hundred Myr (Malkov et al. 1998; Neuhäuser & Schmidt2012). In contrast to high-resolution imaging in space (e.g.Marengo et al. 2006), ground-based observations need to en-compass the seeing which can be done with adaptive optics (e.g.Neuhäuser et al. 2003; Duchêne et al. 2007). Coronagraphy withintransparent (e.g. McCarthy & Zuckerman 2004, Chauvin et al.2005) or semi-transparent coronagraphs (e.g. Biller et al.2010;Boccaletti et al. 2013, Guenther et al. 2005; Itoh et al. 2006,2008a; Neuhäuser et al. 2007, Wahhaj et al. 2011) shade thebright star so that the exposure time and thus the sensitivityof the images can be increased. A number of very sophisti-cated techniques have been developed recently (see the reviewby Fischer et al. 2014).
Article number, page 1 of 25
A&A proofs:manuscript no. non_detect_v6.3.1_arXiv
The frequency of low-mass companions to stars gives impor-tant clues regarding our understanding of the formation of browndwarfs and planets (Ida & Lin 2004; Alibert et al. 2005; Broeg2007). At wide orbits, where direct imaging surveys are sensi-tive, the frequency of brown dwarfs is of the order of severalper-cent for host stars with spectral types A-M and is less constrainedfor giant planets (Rameau et al. 2013; Bowler et al. 2015). Inyoung nearby associations Neuhäuser & Guenther (2004) mea-sure a frequency of 6± 4 % of sub-stellar companions which isnot very different from the value of 1± 1 % obtained for isolatedlate-type stars (McCarthy & Zuckerman 2004). The frequencyof brown dwarfs around Hyades members does not turn out verydifferent from the latter (Guenther et al. 2005; Bouvier et al.2008, Lodieu et al. 2014) although the Hyades are still youngwith an age of≈600 Myr. In the younger Pleiades (125 Myr),Yamamoto et al. (2013) confirmed two brown dwarf companionsin a sample of 20 stars.
Young moving groups of an age intermediate between thePleiades and the Hyades offer interesting opportunities to studyhomogeneous samples of common age and origin. No sub-stellar companions have been found in the Her-Lyr assioci-ation (Eisenbeiss et al. 2007, Biller et al. 2013) which has anage of≈250 Myr, similar to the UMa group (Eisenbeiss et al.2013). Although a systematic survey of the UMa groupat high resolution has been missing, low-mass companionshave been detected: GJ 569 Ba, Bb (Martín et al. 2000;Zapatero Osorio et al. 2004), HD 130948B & C, (Potter et al.2002), andχ1 Ori B (König et al. 2002)3. The only knownplanet around a probable UMa group member,ǫ Eri, was foundby radial velocity variations (Hatzes et al. 2000; Benedictet al.2006). Although there are still doubts about its existence(Zechmeister et al. 2013), there are even suspections of a secondplanet (Quillen & Thorndike 2002; Deller & Maddison 2005).The planet(s) ofǫ Eri have been subject to many, yet unsuccess-ful, attempts of direct detection (Itoh et al. 2006; Janson et al.2007; Marengo et al. 2006; Neuhäuser & Schmidt 2012, and thepresent work).
The goal of the present work is to find additional sub-stellarcompanions in the UMa group by direct imaging. The search forclose and faint companions in the UMa group benefits from a rel-atively young age of 200-600Myrs4, the small distance of mem-bers (≈50 pc on average; Fig. 1), and thus the availability of pre-cise Hipparcos astrometry (Perryman et al. 1997; van Leeuwen2007). Furthermore, the proper motion of UMa group mem-bers is high on average (≈50 mas/yr) because of their proximity(Fig. 1) and their peculiar space motion (Ammler 2006). Hence,co-moving companions can be identified already after a shortepoch difference. Preliminary results of the present study havebeen published earlier (Ammler-von Eiff et al. 2009).
2. Coronagraphic observations and data reduction
As the definition of the UMa group and the list of members iscontroversial, we compiled the targets in the following wayto
3 It is worth noting that Bannister & Jameson (2007) identifiedone Tdwarf and three L dwarfs in the UMa group using the moving clustermethod.4 The Ursa Major (UMa) has been studied extensively under vari-ous aspects (e.g. Eggen 1994; Montes et al. 2001; King et al. 2003;Fuhrmann 2004; Ammler 2006) but the precise age and the list ofmembers are still a matter of debate. Age estimates range from 200to 600 Myrs (König et al. 2002; King et al. 2003; Fuhrmann 2004;King & Schuler 2005; Brandt & Huang 2015).
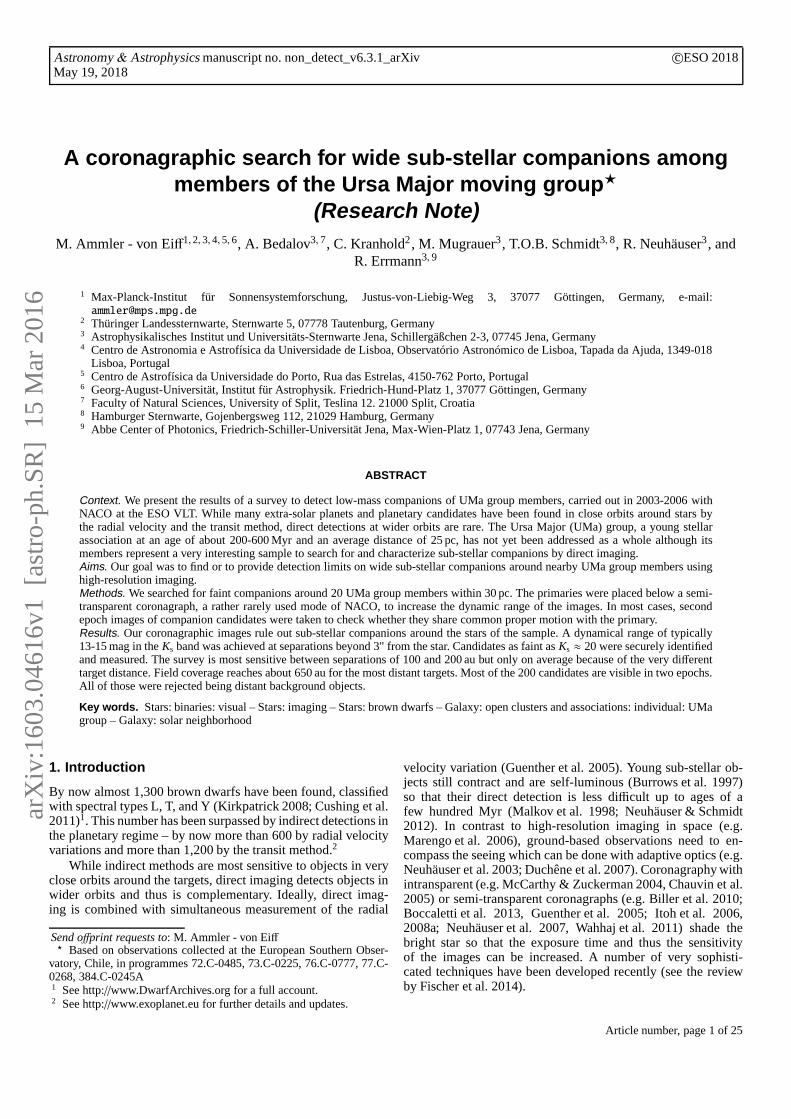
Fig. 1. Left: distribution of distance and proper motion. The majorcon-centration of the UMa group is the UMa open cluster in the Big Dipperconstellation at distances of about 25 pc. All known membersand can-didates (see references in the text) are included in the histogram (solidline; distances mostly from Montes et al. 2001 and van Leeuwen 2007).We add the distribution of the southern stars within 30 pc addressed inthe present work (hatched; distances from van Leeuwen 2007). Right:an image of the coronagraphic mask with the four coronagraphs (blackfilled circles) taken with the S27 camera. Each of the coronagraphs hasan angular diameter of 0.′′7. We placed the star below the lower left(south-eastern) coronagraph, so that a field with a radius of≈9" is com-pletely covered outside the coronagraph (hatched circle).Incompletecoverage is achieved up to separations of≈25" (arrow).
get a meaningful number of reliable UMa group members closerthan 30 pc and observable with NACO at the ESO VLT:
– stars found by Montes et al. (2001) to fulfil at least one ofEggen’s kinematic criteria (Eggen 1995).
– certain or probable members compiled by King et al. (2003)based on photometric, kinematic, and spectroscopic criteria.
– HD 135599 which is an UMa group member according toFuhrmann (2004).
One system, GJ 569 (=HIP 72944), we did not observe sinceit has been extensively studied before (e.g. Simon et al. 2006).Some objects were excluded because of known bright secon-daries in the field of view (HD 24916, HD 29875, HD 98712, andHD 134083). HIP 104383A is a close binary, too, but fully fitsbelow the coronagraph so that we did observe it (Fig. D.1), i.e.20 targets in total (Tables A.1 and A.2).
The targets have been observed with NACO, the adap-tive optics imager at the Nasmyth platform of the ESO VLTUT4 (Yepun)5. The stars themselves were used as adaptive op-tics reference stars for the visual wavefront sensor of NAOS(VIS). First epoch images were taken in 2003/2004 (programmes072.C-0485, 073.C-0225) and second epoch imaging followedin 2005/2006 (programmes 076.C-777, 077.C-0268) for thosestars with faint companion candidates identified.
The semi-transparent coronagraph is a rarely used NACOmode. It has a diameter of 0.′′7 and dims the incoming stellarlight by about 6 magnitudes in theK band (see Fig. 1). Hence,it blocks most light of the star but still allows one to do preciseastrometry with the stellar point spread function (PSF).
The observations have been obtained in theKs band(Persson et al. 1998; Tokunaga et al. 2002) further reducingthebrightness difference of stars and any low-mass companions. Thesensitivity of the observations has been further improved by notusing the S13 camera with the smallest pixel scale but insteadobserving with the S27 camera (27.15 mas/pix, FOV 28"x28").
5 NACO consists of the adaptive optics system NAOS (Lenzen et al.2003) and the camera CONICA (Rousset et al. 2003). The instrumentwas decommissioned in August 2013 and recommissioned on UT1inJanuary 2015.
Article number, page 2 of 25

Ammler-von Eiff et al.: Multiplicity of UMa group members(RN)
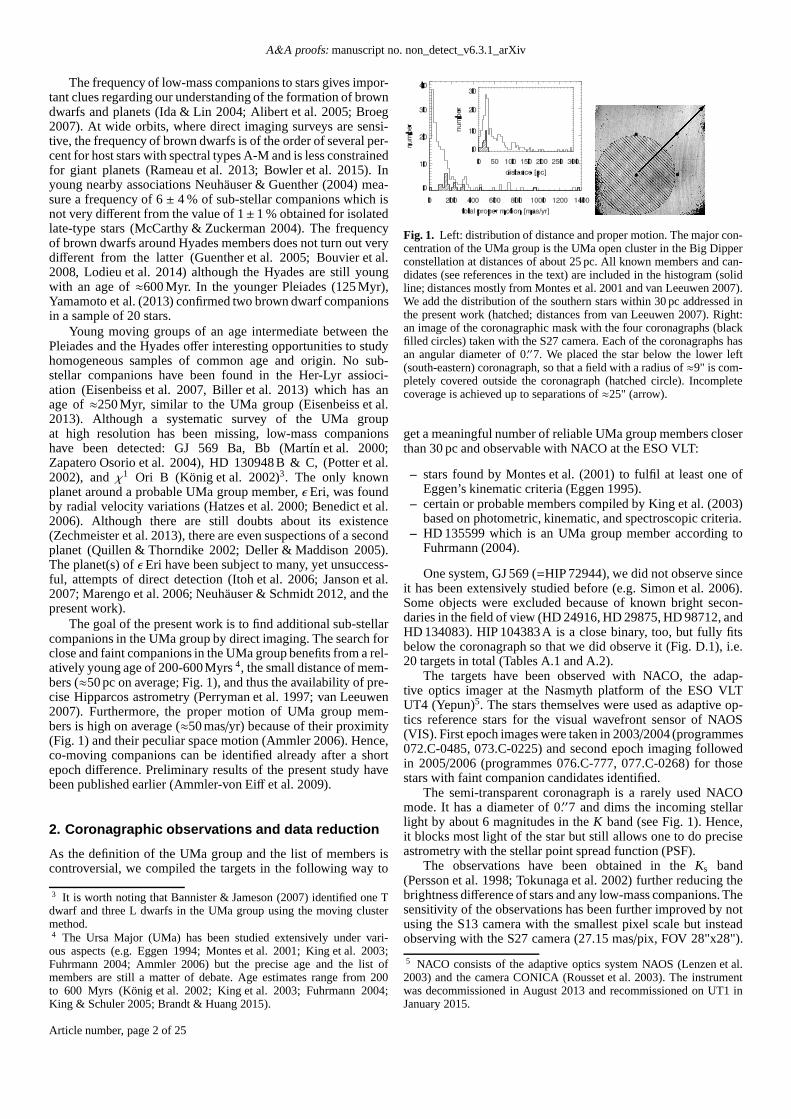
Fig. 2. Left: based on Hipparcos data (cf. Tables E.2, A.1, and A.2),thisexample of HD 22049 shows how the relative motion of non-movingbackground stars in right ascension (solid lines) and declination (dashedlines) will differ from a comoving companion (respective horizontallines). The lines encompass the Hipparcos uncertainty, scaled by a fac-tor of 100 for visibility. Possible orbital motion of a hypothetical com-panion has been neglected. The vertical dotted lines highlight the datesof the 1st and 2nd epoch exposures, respectively. Obviously, the two can-didates found are background objects (circles for right ascension andsquares for declination, resp.; see Table D.2 and Fig. C.1).Right: dy-namic range curves for a 10σ detection as a function of angular sepa-ration for all exposures of the survey.
This way, a larger field is covered (Fig. 1) and more light is col-lected in a single pixel. The astrometric precision using the S27camera is sufficient since the average proper motion of the UMagroup of 150 mas (Fig. 1) per year corresponds to 5.5 pixels onthe detector.
The data reduction follows the usual steps of sky subtraction,flat-field correction, bad pixel correction, shift and add6. The skyhas been subtracted using jittered exposures of nearby sky posi-tions free of bright stars. The flat-field correction is basedoncoronagraphic night-time flat-field exposures to correct for thevariable transmittance of the coronagraphic substrate andstan-dard day-time exposures to correct for pixel-to-pixel variationsof the detector below the coronagraph used. Bad pixel frameshave been taken from standard calibrations or derived individu-ally with ESO tools and standard twilight flat-field exposures.
3. Identification and characterisation of candidates
The stellar PSF has been subtracted in a box of 500x500 pixelscentred on the star to facilitate the visual identification of faintcompanion candidates. The PSF has been derived by calculat-ing the average of a set of rotated frames (in steps of 2◦) andusing sigma-clipping to get rid of bright features, in particularthe diffraction spikes. A smoothed image has been subtracted tofurther facilitate detection (Figs C.1-C.5)7.
We noticed that artefacts due to dust particles on the coro-nagraphic substrate can be mistaken for companion candidates.The flat-field correction fails in removing those since occasionaldisplacements of the coronagraphic substrate can occur betweencalibration and target exposures. We removed those artefactsfrom the list of companion candidates guided by a visual cross-match of the scientific exposures with the flat-field exposures. Inthe most extreme cases (exposures of HD 11171 and HD 22049),several tens of artefacts had to be removed.
6 using own scripts and tools provided by ESO, includingESO-eclipsev5.0.0, thejitter recipe (Devillard 1997, 2011), andesorexusing therecipenaco_img_twflatto derive bad pixel frames.7 Smoothing has been done by the application of a Gaussian filter(FILTER/GAUSS in ESO MIDAS version 13SEP; Banse et al. 1983;Warmels 1992) using all adjacent pixels within a radius of 18pixelsweighted by a Gaussian with a width ofσ = 3 pixels.
A wide comoving companion will not change its positionrelative to the star while a distant and thus non-moving back-ground object will reflect the stellar parallactic and proper mo-tion (Fig. 2). Our assessment of astrometric measurement uncer-tainties is based on Chauvin et al. (2010) who give a long-termaverage of the S27 pixel scale of 27.012± 0.004mas/pix andof the detector position angle (true North) of−0.◦04± 0.◦14. Inthe present work, we corrected the position angles of all candi-dates for the mean deviation of−0.◦04 from the true North. Fromthe measurements obtained by Chauvin et al. (2010), we expectuncertainties of 0.016 mas/pix on separation and 0.◦15 on posi-tion angle. We neglected the errors in fitting Gaussian profiles tomeasure the positions of the stars and the candidates. It is as pre-cise as a few milliarcseconds and of the order of theHipparcoserrors (Table E.2).
The instrumental magnitudes of the target stars and the can-didates have all been measured in apertures of 13 pixels acrosswhich is more than double the typical FWHM of the PSF. Then,theKs band magnitude of the candidates has been derived fromthe measured flux ratios taking into account the brightness of thetarget star (Table A.2) and the attenuation of the coronagraph.While the brightness of the star has been measured in the reducedframes, the brightness of the candidates has been measured in thePSF-subtracted frames constructed in the way described above.
To calibrate the transmission of the coronagraph, a standardstar (HD 1274) was taken during the programme 384.C-0245A,once outside and once below the coronagraph, and reduced inthe same way as the exposures of the science targets. The fluxvalues have been integrated within apertures of 19 pixels radiuswhich fits well inside the coronagraph. Relating the measure-ments inside and outside the coronagraph gives a transmissionof 0.47± 0.03 % in theKs band which translates to a dimmingof 5.83± 0.06 mag. The error bar accounts for uncertainties in-volved in the aperture photometry but not for other systematicslike cross-talk, light-leaks, temporal variation of the PSF, im-proper/variable placement of the star below the coronagraph, orvariable residual absorption by the transparent substratewhichcarries the coronagraphs. The new measurement gives a dim-ming weaker by half a magnitude than the value given in theNACO manual (Ks = 6.3 ± 0.1 mag). The latter measurementwas done in a way similar to the present work but using framesreduced in a different way and using peak counts instead of aper-ture photometry (ESO, priv. comm.). A conservative estimate of6.1±0.3 has been adopted in the present work since the discrep-ancy cannot be explained with the data available.
For each one of the companion candidates, the average mag-nitude of two epochs has been adopted and the uncertainty isgiven by half their difference plus the square-added error barof 0.3 mag of the transmissivity of the coronagraph. For single-epoch images, the transmissivity is the only well-known domi-nant source of error.
4. Assessment of field coverage and detectionlimits
We could not take advantage of the full field of view of theNACO mode applied (28”x28”) since the corners are affectedby obstructions. Furthermore, the coronagraphs themselves areinsensitive patches in the field of view.
The field of view is covered completely between angularseparations of 0.′′35 (coronagraphic radius) and 9.′′0 which cor-respond to different linear scales depending on the distance ofthe star. The parallaxes of the sample stars vary from 37 mas
Article number, page 3 of 25
A&A proofs:manuscript no. non_detect_v6.3.1_arXiv
(HIP 104383) to 311 mas (HD 22049) so that the field of viewcovers very different parts of the stellar environments, e.g. theclosest view in the case ofǫ Eri (=HD 22049; 1.1 − 29 au) andthe farthest view for HIP 104383 (9.2−237AU) (Table B.1). Theexpected widest bound orbit of low-mass companions has beenestimated based on the linear law given in Close et al. 2003 giventhe central mass of the target systems.
Although the field of view is complete only up to separationsof ∼9”, it samples separations of up to∼25” corresponding to asmuch as∼650 au in the case of HD 125451 and HIP 104383. Stillthe field of view never reaches the widest possible bound orbit inthe present sample. We note, however, that inclination is a freeparameter in this whole consideration and that measured separa-tions are projected separations. Stars with exoplanets areknownfor which very wide (up to one third of a parsec) companionswith common proper motion have been detected (Mugrauer et al.2014).
To understand the detection limits in the wings of the PSF,we built noise maps from the reduced and PSF-subtracted im-ages. We measured the standard deviation at each pixel using7x7adjacent pixels. This value has been multiplied by the square rootof the number of pixels in an aperture of 13 pixels across in or-der to compare to the photometric flux measurements describedabove.
Based on the noise analysis, the limiting magnitudes havebeen derived relative to the magnitude of the primary star inthesame way as by Brandeker et al. (2006). We found that a sourcecan be detected at a given location if the flux measured is largerthan a detection limit of 5− 10σ of the local noise level andadopted the conservative and common value of 10σ. The limitsderived have been corrected for the coronagraphic attenuationof 6.1mag inferred above. For each exposure, the right panel ofFig. 2 shows the average value of pixels at same angular distance.
When it comes to the determination of the mass of a com-panion that is still detectable, uncertain age is the largest con-tribution to the error budget. Using the stellarKs band magni-tude and the measured dynamic range, we calculated theKs bandmagnitude of faint objects which could still have been detectedat a given separation. The magnitudes have been interpolatedin evolutionary models to obtain a mass estimate. We used theCOND03 models (Baraffe et al. 2003) for effective temperatureslower than 1,300K8 and DUSTY00 (Chabrier et al. 2000) mod-els for temperatures higher than 1,300K. For ages of 100 Myr,500 Myr, and 1 Gyr, this temperature corresponds to a mass of10, 31, and 42MJup, respectively, and is accessible to the presentsurvey. In this range of mass, the difference inK band magnitudebetween 100 Myr and 1 Gyr varies from 4 at the high-mass endto 8 at the low-mass end. Even if we avoid interpolating the trueage range of the UMa group in the evolutionary models, we canassess that the age uncertainty of the UMa group implies an errorof severalK band magnitudes which is the dominant source oferror in the present study.
5. Results and Discussion
The noise level is observed to decrease strongly with increas-ing separation from the primary star (Fig. 2). The longest on-target exposure time was spent on the brightest target, HD 22049,resulting in the highest dynamic range of the present work
8 According to Baraffe et al. (2003), the COND03 models are more ap-propriate below 1300 K to predict infrared colours, for methane dwarfsand extrasolar giant planets at large orbital separation. The differencebetween theKs and theK band has been neglected in the present study.
Fig. 3. Left: Ks magnitude distribution of candidates. Based on Ta-ble D.2. Errors in magnitude have not been considered. Right: resid-ual motion of candidates. For all candidates detected in twoepochs, thefigure shows the residual shifts in right ascension and declination overthe time elapsed between the epochs (Table D.2) after correcting for theproper and parallactic motion of the central stars (Table E.2). The sym-bols discern the candidates according to their central stars. Error barshave been omitted for clarity.
(&17 mag for a 10σ detection). Typically, the dynamic rangefor a 10σ detection limit ranges between∆Ks = 13 and 15 ata separation beyond 3" (Figs. 1, E.1, E.2, and E.3). Given theK band magnitude of the central star, this corresponds to about12−20MJupprovided an age of 500 Myr (Figs. E.4 and E.5). Ob-jects with 12MJup and younger than 1 Gyr could have been de-tected at separations of less than 10 au in the case of HIP 57548with the deepest exposure of the present work, and objects with20MJup closer than 3 au (Table E.1).
More than 200 candidates have been identified (Figs. C.1-C.5, Table D.2). While in some fields, not a single object hasbeen detected around the star (HD 11171, HD 26923, HD 38393,HD 63433, HIP 57548, HD 95650, HD 125451, HD 139006, andHD 217813), some 160 have been found around HD 165185which is located in the galactic plane. A number of additionalcandidates have been found close to HD 11131, HD 22049,HD 26913, HD 41593, HD 60491, HD 61606A, HD 135599,HD 147584, HD 175742, and HIP 104383A9.
The relative shift of a companion w.r.t. the star has been mea-sured when a second epoch was available (Table D.2). All thosecases are non-moving background stars when comparing to thepredicted shift due to the stellar parallactic and proper motion(Table E.2 and Fig. 3)10. The deviation from these expectationsis less than 0.′′1 in all cases and of the order of the astrometricerror bars (Table D.2). This shows that the true astrometricun-certainties agree with the assessments by Chauvin et al. (2010)implemented here (Sect. 3).
The detection limits can be compared to the brightness offaint background objects detected in the field of view. The uncer-tainties of the photometric measurements are below 1 mag in al-most all cases. Usually, they are close to 0.5 mag and increasingtowards the detection limit while the photometric measurementsdeviate by less than a magnitude from epoch to epoch. Enhancederror bars can be ascribed to smearing, noise, flux missed by the
9 HIP 104383 A is a special case since it appears as a visual binarybelow the coronagraph (Fig. D.1). According to Balega et al.(2004),it is a binary with a separation of 0.′′3 and a magnitude difference of1.67 in theR′ band. In theKs band we measured a magnitude differenceof 0.45. The astrometric measurements presented here have been donew.r.t. the brighter component while the co-added signal hasbeen usedfor photometric measurements.10 The parallactic motion has been calculated assuming a valueof theobliquity of the ecliptic plane of 23.◦4 and expressing the solar longitudeby L = 279.◦697+ 36, 000.◦770T with the timeT given by Julian cen-turies since 1900, January 0, 12 h (Kovalevsky 1995). The eccentricityof Earth’s orbit has been neglected.
Article number, page 4 of 25

Ammler-von Eiff et al.: Multiplicity of UMa group members(RN)
Table 1. Identification of candidates with previous detections.
target/cand. epoch/position reference/magnitude/IDHD 22049 2002-08-20 (1)ID0001 4.′′5 17.′′0 K′ = 17.3 2ID0002 −9.′′6 14.′′2 K′ = 17.3 1HD 41593 2002-2004 (2)ID0002 11.′′10 328.◦40 H = 15.88 cc1HD 175742 2004-06-28 (3)ID0001 9.′′45 308.◦5 Ks = 16.99± 0.09 3ID0003 7.′′57 335.◦5 Ks = 19.13± 0.23 4ID0004 2.′′64 89◦ Ks = 16.88± 0.09 1ID0006 9.′′36 199◦ Ks = 17.34± 0.09 2HD 175742 2011-05-23 (4)ID0004 1.′′72 1.′′97 ... ...
Notes.For each target with previous imaging, the candidates recoveredare listed and the corresponding previous astrometric and photometricmeasurements are given together with the reference ID assigned in theprevious work. Relative positions in right ascension and declination aregiven for Macintosh et al. (2003) (1) and Janson et al. (2013)(4) whiletotal separation and position angle are given for Itoh et al.(2008b) (2)and Metchev & Hillenbrand (2009) (3).
aperture photometry at the edges of the frame, or backgroundfeatures like diffraction spikes, ghosts, and reflections (indicatedin Table D.2).
The faintest object identified (HD 165185, ID0101) advo-cates an empirical detection limit ofKs≈22 for HD 165185.However, the aperture photometry of this object is affected byinsufficient background correction so that it must be somewhatbrighter (Fig. C.3). Moreover, the lower envelope to the distribu-tion of most candidates (Fig. E.2) is a bit higher as is also indi-cated by the brightness distribution of all candidates (cf.Fig. 3).It covers magnitudes in the rangeKs = 13 − 23 with a sin-gle brighter object next to HD 11131. As can be expected fora distribution of field stars, there are a few bright objects and alarger number of faint objects. The number of objects decreasesrapidly at a brightness level fainter thanKs = 20 indicating thatthe census is complete down to this value. Since the distributionis almost entirely constituted of objects next to HD 165185,thiscompleteness limit is certainly valid for this subset.
We compared our candidates with previous work for tar-gets in common with other surveys which have not necessar-ily been dedicated to the UMa group (Macintosh et al. 2003;Itoh et al. 2008b; Metchev & Hillenbrand 2009).We recoveredall of the previously known candidates (Table 1) at the posi-tions expected as far as they are covered by our field of view.Photometric measurements agree well within the error bars aslong as they have been measured in the same or a similar pho-tometric band. The single exception is ID 4 next to HD 175742(Metchev & Hillenbrand 2009, object 1). Most certainly, thedif-ference of oneKs magnitude can be explained by the location ofID 4 in the PSF of HD 175742 where the photometric measure-ment is very sensitive to imperfections of the PSF subtraction.The same object was found by Janson et al. (2013) but no pho-tometric measurement is given there. The southern componentof HD 165185 listed by Mason et al. (2014) is out of the field ofview of the present work but displayed in Table B.1.
The deepest exposure has been chosen for each target to de-rive a survey upper limit on the frequency of stars with a com-panion of given mass and age. This has been done in a basic waysimilar to Lafrenière et al. (2007) without assuming any priorknowledge on the mass-period distribution of companions.
Fig. 4. Mean survey detection probability for companions of 12, 20,and 35MJup as a function of separation and for different age of 100 Myr,500 Myr, and 1 Gyr as indicated in the legend. The solid line gives thelimiting case of a detection probability of 1 in each frame.
For this purpose, maps of 10σ detection probability havebeen derived from the maps of limiting magnitude presentedin Sect. 4 by comparing them to the signal of a 12, 20, and35MJup companion at different ages of 100 Myr, 500 Myr, and1 Gyr (using the evolutionary models described in Sect. 4)11. Themean survey detection probability has been assessed by center-ing, rescaling, and averaging those probability maps (Fig.4).In the limiting case, where the detection probability equals 1throughout each frame, the average detection probability is onlylimited by the respective field of view and approaches zero atseparations beyond∼500 au which are not covered by any ex-posure of the survey. The age range considered has a strongereffect than the mass range. On average, the survey is most sensi-tive at separations between 100 and 200 au since the distanceofthe targets and thus the field of view covered is very different.
We derived the upper limit on the frequency of starswith a companion where the mean 10σ detection probabil-ity is high. We followed the Bayesian approach described byLafrenière et al. (2007) using the Poisson approximation and aconfidence level of 95 %. In the most sensitive range between100 and 200 au, we can place an upper limit of∼25 % on thefrequency of UMa group members with low-mass companionsmore massive than 35MJup if the age of the UMa group is closeto 500 Myr or younger. The limit is never below 15 %, definedby the number of stars, the confidence level, and the case of adetection probability of one everywhere (solid line in Fig.4).
When interpreting the outcome of the present study one hasto be aware of specific formation environments represented bythe significant fraction of targets with stellar companions(cf.Tables A.2 and B.1). In addition we note that the known com-panions of GJ 569 have not been considered for the frequencyestimate since they are closer to the star than the field coveredby the present work and we did not account for the companionsof HD 130948 since they have masses close to the Deuteriumburning limit of 12− 13MJup which we are not sensitive to onaverage. Although the results are not at variance with previouswork, it is obvious that the study of the UMa group would benefitfrom a larger sample size. So far, northern UMa group membershave not been studied systematically. Those actually comprisethe largest part of the UMa group. Although its densest part onthe northern hemisphere is within 30 pc, the group extends farbeyond.
11 The probability has been computed that a signal exceeds the 10σdetection threshold in the presence of noise, assuming a normal distri-bution.
Article number, page 5 of 25
A&A proofs:manuscript no. non_detect_v6.3.1_arXiv
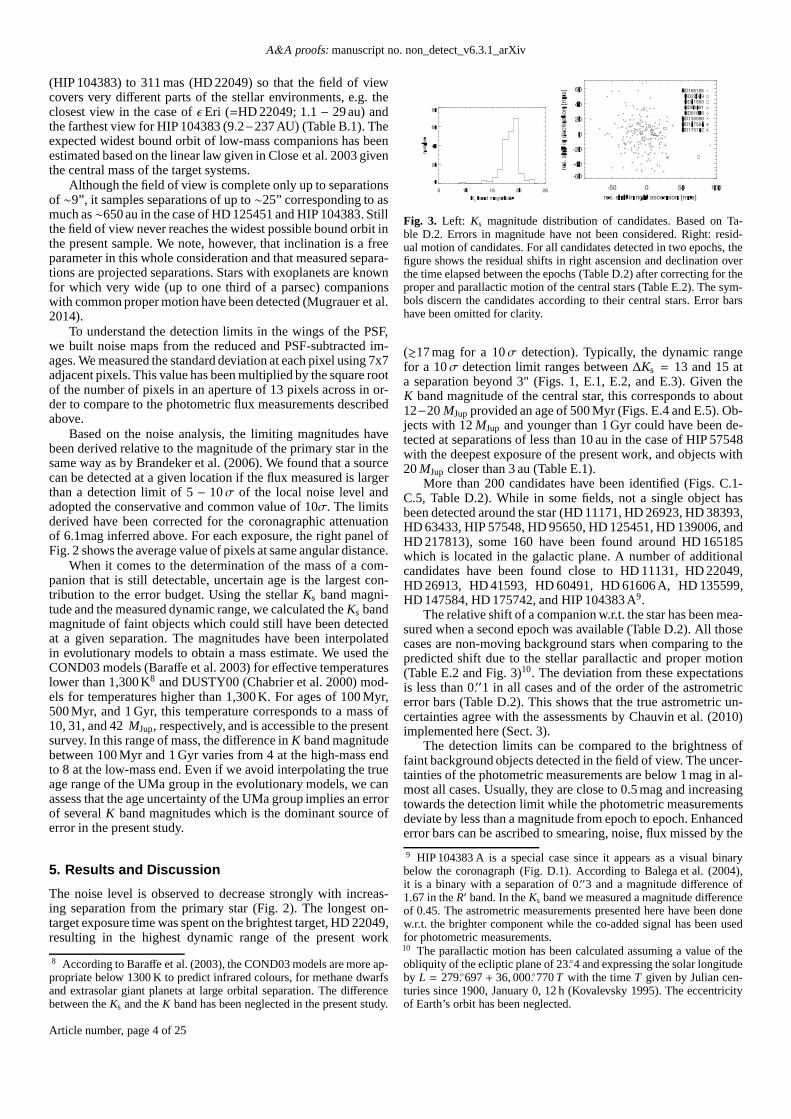
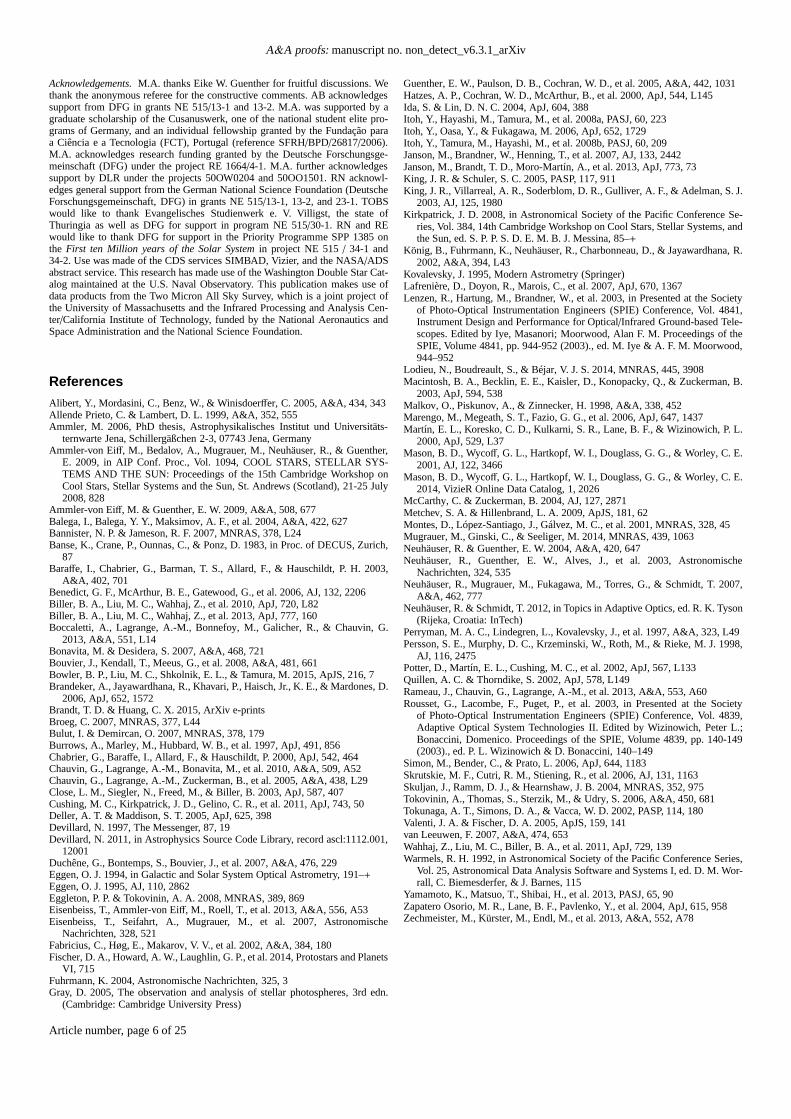
Acknowledgements. M.A. thanks Eike W. Guenther for fruitful discussions. Wethank the anonymous referee for the constructive comments.AB acknowledgessupport from DFG in grants NE 515/13-1 and 13-2. M.A. was supported by agraduate scholarship of the Cusanuswerk, one of the national student elite pro-grams of Germany, and an individual fellowship granted by the Fundação paraa Ciência e a Tecnologia (FCT), Portugal (reference SFRH/BPD/26817/2006).M.A. acknowledges research funding granted by the DeutscheForschungsge-meinschaft (DFG) under the project RE 1664/4-1. M.A. further acknowledgessupport by DLR under the projects 50OW0204 and 50OO1501. RN acknowl-edges general support from the German National Science Foundation (DeutscheForschungsgemeinschaft, DFG) in grants NE 515/13-1, 13-2, and 23-1. TOBSwould like to thank Evangelisches Studienwerk e. V. Villigst, the state ofThuringia as well as DFG for support in program NE 515/30-1. RN and REwould like to thank DFG for support in the Priority ProgrammeSPP 1385 onthe First ten Million years of the Solar System in project NE 515/ 34-1 and34-2. Use was made of the CDS services SIMBAD, Vizier, and theNASA/ADSabstract service. This research has made use of the Washington Double Star Cat-alog maintained at the U.S. Naval Observatory. This publication makes use ofdata products from the Two Micron All Sky Survey, which is a joint project ofthe University of Massachusetts and the Infrared Processing and Analysis Cen-ter/California Institute of Technology, funded by the NationalAeronautics andSpace Administration and the National Science Foundation.
ReferencesAlibert, Y., Mordasini, C., Benz, W., & Winisdoerffer, C. 2005, A&A, 434, 343Allende Prieto, C. & Lambert, D. L. 1999, A&A, 352, 555Ammler, M. 2006, PhD thesis, Astrophysikalisches Institutund Universitäts-
ternwarte Jena, Schillergäßchen 2-3, 07743 Jena, GermanyAmmler-von Eiff, M., Bedalov, A., Mugrauer, M., Neuhäuser, R., & Guenther,
E. 2009, in AIP Conf. Proc., Vol. 1094, COOL STARS, STELLAR SYS-TEMS AND THE SUN: Proceedings of the 15th Cambridge WorkshoponCool Stars, Stellar Systems and the Sun, St. Andrews (Scotland), 21-25 July2008, 828
Ammler-von Eiff, M. & Guenther, E. W. 2009, A&A, 508, 677Balega, I., Balega, Y. Y., Maksimov, A. F., et al. 2004, A&A, 422, 627Bannister, N. P. & Jameson, R. F. 2007, MNRAS, 378, L24Banse, K., Crane, P., Ounnas, C., & Ponz, D. 1983, in Proc. of DECUS, Zurich,
87Baraffe, I., Chabrier, G., Barman, T. S., Allard, F., & Hauschildt,P. H. 2003,
A&A, 402, 701Benedict, G. F., McArthur, B. E., Gatewood, G., et al. 2006, AJ, 132, 2206Biller, B. A., Liu, M. C., Wahhaj, Z., et al. 2010, ApJ, 720, L82Biller, B. A., Liu, M. C., Wahhaj, Z., et al. 2013, ApJ, 777, 160Boccaletti, A., Lagrange, A.-M., Bonnefoy, M., Galicher, R., & Chauvin, G.
2013, A&A, 551, L14Bonavita, M. & Desidera, S. 2007, A&A, 468, 721Bouvier, J., Kendall, T., Meeus, G., et al. 2008, A&A, 481, 661Bowler, B. P., Liu, M. C., Shkolnik, E. L., & Tamura, M. 2015, ApJS, 216, 7Brandeker, A., Jayawardhana, R., Khavari, P., Haisch, Jr.,K. E., & Mardones, D.
2006, ApJ, 652, 1572Brandt, T. D. & Huang, C. X. 2015, ArXiv e-printsBroeg, C. 2007, MNRAS, 377, L44Bulut, I. & Demircan, O. 2007, MNRAS, 378, 179Burrows, A., Marley, M., Hubbard, W. B., et al. 1997, ApJ, 491, 856Chabrier, G., Baraffe, I., Allard, F., & Hauschildt, P. 2000, ApJ, 542, 464Chauvin, G., Lagrange, A.-M., Bonavita, M., et al. 2010, A&A, 509, A52Chauvin, G., Lagrange, A.-M., Zuckerman, B., et al. 2005, A&A, 438, L29Close, L. M., Siegler, N., Freed, M., & Biller, B. 2003, ApJ, 587, 407Cushing, M. C., Kirkpatrick, J. D., Gelino, C. R., et al. 2011, ApJ, 743, 50Deller, A. T. & Maddison, S. T. 2005, ApJ, 625, 398Devillard, N. 1997, The Messenger, 87, 19Devillard, N. 2011, in Astrophysics Source Code Library, record ascl:1112.001,
12001Duchêne, G., Bontemps, S., Bouvier, J., et al. 2007, A&A, 476, 229Eggen, O. J. 1994, in Galactic and Solar System Optical Astrometry, 191–+Eggen, O. J. 1995, AJ, 110, 2862Eggleton, P. P. & Tokovinin, A. A. 2008, MNRAS, 389, 869Eisenbeiss, T., Ammler-von Eiff, M., Roell, T., et al. 2013, A&A, 556, A53Eisenbeiss, T., Seifahrt, A., Mugrauer, M., et al. 2007, Astronomische
Nachrichten, 328, 521Fabricius, C., Høg, E., Makarov, V. V., et al. 2002, A&A, 384,180Fischer, D. A., Howard, A. W., Laughlin, G. P., et al. 2014, Protostars and Planets
VI, 715Fuhrmann, K. 2004, Astronomische Nachrichten, 325, 3Gray, D. 2005, The observation and analysis of stellar photospheres, 3rd edn.
(Cambridge: Cambridge University Press)
Guenther, E. W., Paulson, D. B., Cochran, W. D., et al. 2005, A&A, 442, 1031Hatzes, A. P., Cochran, W. D., McArthur, B., et al. 2000, ApJ,544, L145Ida, S. & Lin, D. N. C. 2004, ApJ, 604, 388Itoh, Y., Hayashi, M., Tamura, M., et al. 2008a, PASJ, 60, 223Itoh, Y., Oasa, Y., & Fukagawa, M. 2006, ApJ, 652, 1729Itoh, Y., Tamura, M., Hayashi, M., et al. 2008b, PASJ, 60, 209Janson, M., Brandner, W., Henning, T., et al. 2007, AJ, 133, 2442Janson, M., Brandt, T. D., Moro-Martín, A., et al. 2013, ApJ,773, 73King, J. R. & Schuler, S. C. 2005, PASP, 117, 911King, J. R., Villarreal, A. R., Soderblom, D. R., Gulliver, A. F., & Adelman, S. J.
2003, AJ, 125, 1980Kirkpatrick, J. D. 2008, in Astronomical Society of the Pacific Conference Se-
ries, Vol. 384, 14th Cambridge Workshop on Cool Stars, Stellar Systems, andthe Sun, ed. S. P. P. S. D. E. M. B. J. Messina, 85–+
König, B., Fuhrmann, K., Neuhäuser, R., Charbonneau, D., & Jayawardhana, R.2002, A&A, 394, L43
Kovalevsky, J. 1995, Modern Astrometry (Springer)Lafrenière, D., Doyon, R., Marois, C., et al. 2007, ApJ, 670,1367Lenzen, R., Hartung, M., Brandner, W., et al. 2003, in Presented at the Society
of Photo-Optical Instrumentation Engineers (SPIE) Conference, Vol. 4841,Instrument Design and Performance for Optical/Infrared Ground-based Tele-scopes. Edited by Iye, Masanori; Moorwood, Alan F. M. Proceedings of theSPIE, Volume 4841, pp. 944-952 (2003)., ed. M. Iye & A. F. M. Moorwood,944–952
Lodieu, N., Boudreault, S., & Béjar, V. J. S. 2014, MNRAS, 445, 3908Macintosh, B. A., Becklin, E. E., Kaisler, D., Konopacky, Q., & Zuckerman, B.
2003, ApJ, 594, 538Malkov, O., Piskunov, A., & Zinnecker, H. 1998, A&A, 338, 452Marengo, M., Megeath, S. T., Fazio, G. G., et al. 2006, ApJ, 647, 1437Martín, E. L., Koresko, C. D., Kulkarni, S. R., Lane, B. F., & Wizinowich, P. L.
2000, ApJ, 529, L37Mason, B. D., Wycoff, G. L., Hartkopf, W. I., Douglass, G. G., & Worley, C. E.
2001, AJ, 122, 3466Mason, B. D., Wycoff, G. L., Hartkopf, W. I., Douglass, G. G., & Worley, C. E.
2014, VizieR Online Data Catalog, 1, 2026McCarthy, C. & Zuckerman, B. 2004, AJ, 127, 2871Metchev, S. A. & Hillenbrand, L. A. 2009, ApJS, 181, 62Montes, D., López-Santiago, J., Gálvez, M. C., et al. 2001, MNRAS, 328, 45Mugrauer, M., Ginski, C., & Seeliger, M. 2014, MNRAS, 439, 1063Neuhäuser, R. & Guenther, E. W. 2004, A&A, 420, 647Neuhäuser, R., Guenther, E. W., Alves, J., et al. 2003, Astronomische
Nachrichten, 324, 535Neuhäuser, R., Mugrauer, M., Fukagawa, M., Torres, G., & Schmidt, T. 2007,
A&A, 462, 777Neuhäuser, R. & Schmidt, T. 2012, in Topics in Adaptive Optics, ed. R. K. Tyson
(Rijeka, Croatia: InTech)Perryman, M. A. C., Lindegren, L., Kovalevsky, J., et al. 1997, A&A, 323, L49Persson, S. E., Murphy, D. C., Krzeminski, W., Roth, M., & Rieke, M. J. 1998,
AJ, 116, 2475Potter, D., Martín, E. L., Cushing, M. C., et al. 2002, ApJ, 567, L133Quillen, A. C. & Thorndike, S. 2002, ApJ, 578, L149Rameau, J., Chauvin, G., Lagrange, A.-M., et al. 2013, A&A, 553, A60Rousset, G., Lacombe, F., Puget, P., et al. 2003, in Presented at the Society
of Photo-Optical Instrumentation Engineers (SPIE) Conference, Vol. 4839,Adaptive Optical System Technologies II. Edited by Wizinowich, Peter L.;Bonaccini, Domenico. Proceedings of the SPIE, Volume 4839,pp. 140-149(2003)., ed. P. L. Wizinowich & D. Bonaccini, 140–149
Simon, M., Bender, C., & Prato, L. 2006, ApJ, 644, 1183Skrutskie, M. F., Cutri, R. M., Stiening, R., et al. 2006, AJ,131, 1163Skuljan, J., Ramm, D. J., & Hearnshaw, J. B. 2004, MNRAS, 352,975Tokovinin, A., Thomas, S., Sterzik, M., & Udry, S. 2006, A&A,450, 681Tokunaga, A. T., Simons, D. A., & Vacca, W. D. 2002, PASP, 114,180Valenti, J. A. & Fischer, D. A. 2005, ApJS, 159, 141van Leeuwen, F. 2007, A&A, 474, 653Wahhaj, Z., Liu, M. C., Biller, B. A., et al. 2011, ApJ, 729, 139Warmels, R. H. 1992, in Astronomical Society of the Pacific Conference Series,
Vol. 25, Astronomical Data Analysis Software and Systems I,ed. D. M. Wor-rall, C. Biemesderfer, & J. Barnes, 115
Yamamoto, K., Matsuo, T., Shibai, H., et al. 2013, PASJ, 65, 90Zapatero Osorio, M. R., Lane, B. F., Pavlenko, Y., et al. 2004, ApJ, 615, 958Zechmeister, M., Kürster, M., Endl, M., et al. 2013, A&A, 552, A78
Article number, page 6 of 25

A&A–non_detect_v6.3.1_arXiv,Online Material p 7
Appendix A: Sample
Appendix B: Field of view and nearby visualcompanions
Appendix C: Images with candidates
Appendix D: List of candidates

A&A–non_detect_v6.3.1_arXiv,Online Material p 8
Fig. C.1. Candidates for stars with images in two epochs: HD 22049, HD 26913, and HD 41593. The images display the central star underthecoronagraph. Faint companion candidates in the field of vieware indicated by circles and are enumerated (cf. Table. D.2). The scale is indicatedin the image. North is at the top and East is to the left. The PSFof the central star has been removed in a rectangular area centred on the star and asmoothed image has been subtracted. The residual speckle pattern and the diffraction spikes of the mount of the secondary mirror remain visible(several of those due to the addition of several exposures).In addition, there are reflections, ghosts, a vignetted region to the lower left, and theshadows of the other three coronagraphs.

A&A–non_detect_v6.3.1_arXiv,Online Material p 9
Fig. C.2. Candidates for stars with images in two epochs: HD 60491, HD 61606, and HD 135599. The layout is the same as in Fig. C.1.

A&A–non_detect_v6.3.1_arXiv,Online Material p 10
Fig. C.3. Candidates for stars with images in two epochs: HD 147584, HD165185, and HD 175742. The layout is the same as in Fig. C.1. Stellarresiduals are present in the second epochs since jittering of the sky exposures did not work in those cases.
A&A–non_detect_v6.3.1_arXiv,Online Material p 11
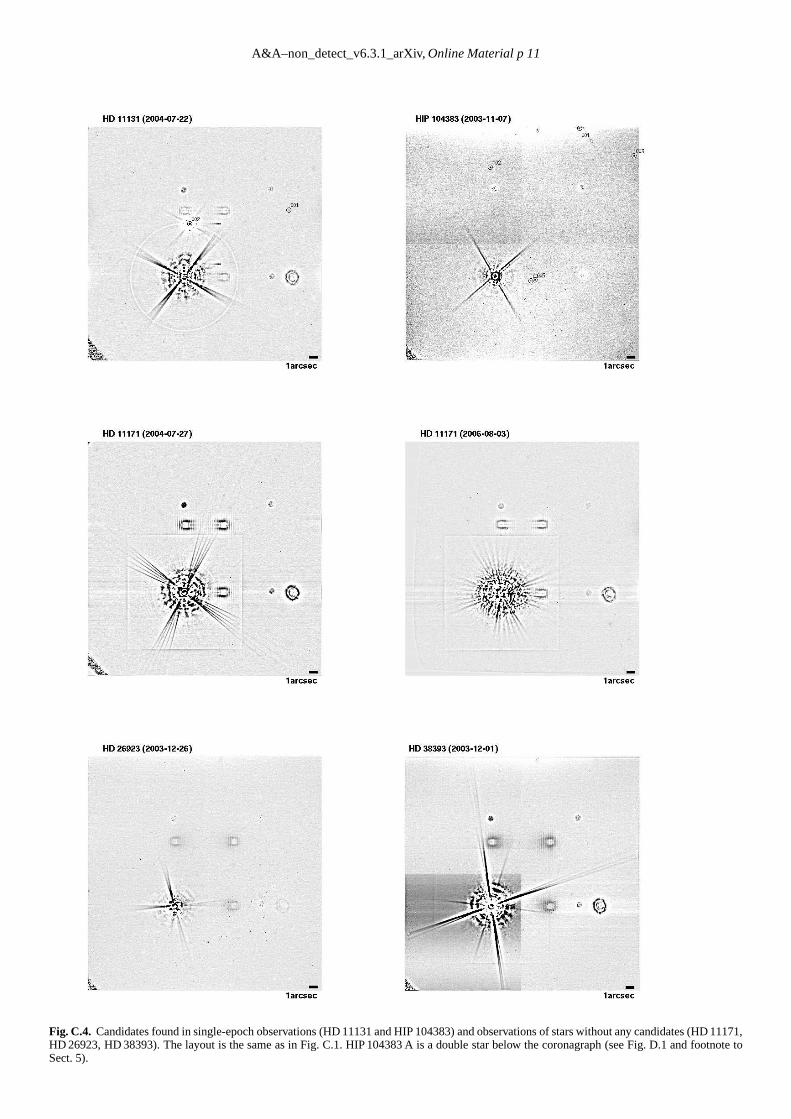
Fig. C.4. Candidates found in single-epoch observations (HD 11131 and HIP 104383) and observations of stars without any candidates (HD 11171,HD 26923, HD 38393). The layout is the same as in Fig. C.1. HIP 104383 A is a double star below the coronagraph (see Fig. D.1 and footnote toSect. 5).

A&A–non_detect_v6.3.1_arXiv,Online Material p 12
Fig. C.5. Observations of stars without any candidates: HD 63433, HD 95650, HIP 57548, HD 125451, HD 139006, and HD 217813. The layoutis the same as in Fig. C.1.
A&A–non_detect_v6.3.1_arXiv,Online Material p 13
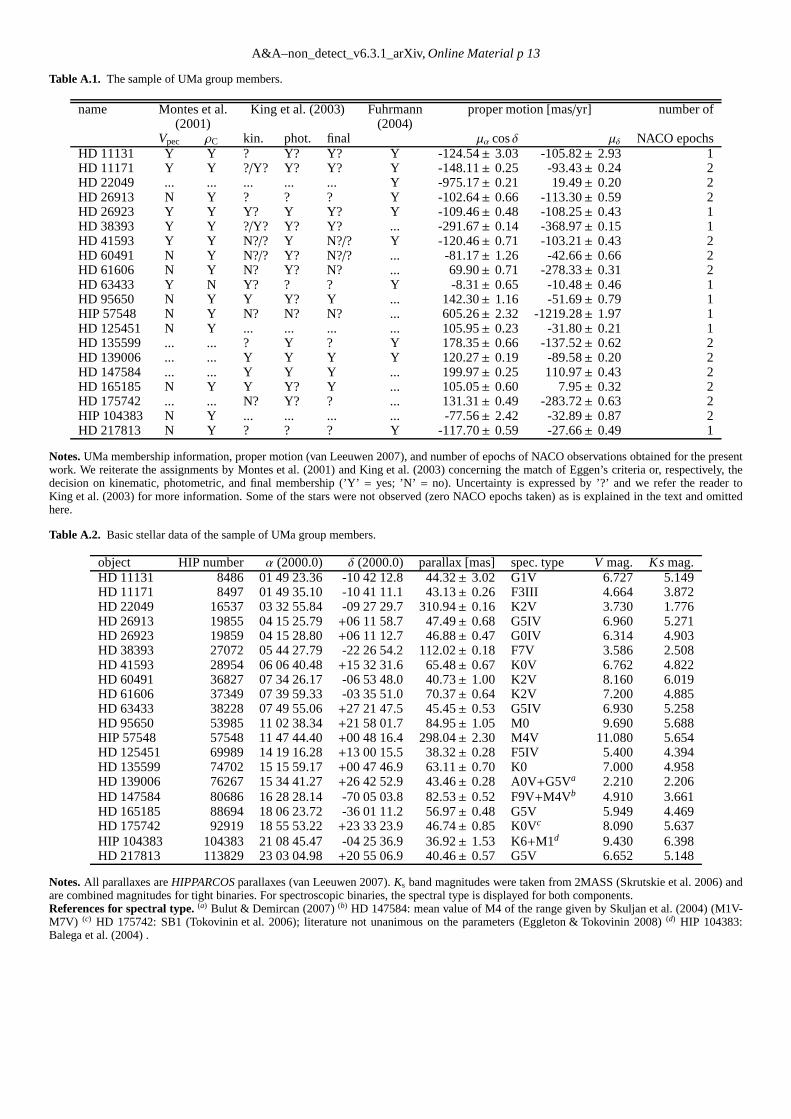
Table A.1. The sample of UMa group members.
name Montes et al. King et al. (2003) Fuhrmann proper motion [mas/yr] number of(2001) (2004)
Vpec ρC kin. phot. final µα cosδ µδ NACO epochsHD 11131 Y Y ? Y? Y? Y -124.54± 3.03 -105.82± 2.93 1HD 11171 Y Y ?/Y? Y? Y? Y -148.11± 0.25 -93.43± 0.24 2HD 22049 ... ... ... ... ... Y -975.17± 0.21 19.49± 0.20 2HD 26913 N Y ? ? ? Y -102.64± 0.66 -113.30± 0.59 2HD 26923 Y Y Y? Y Y? Y -109.46± 0.48 -108.25± 0.43 1HD 38393 Y Y ?/Y? Y? Y? ... -291.67± 0.14 -368.97± 0.15 1HD 41593 Y Y N?/? Y N?/? Y -120.46± 0.71 -103.21± 0.43 2HD 60491 N Y N?/? Y? N?/? ... -81.17± 1.26 -42.66± 0.66 2HD 61606 N Y N? Y? N? ... 69.90± 0.71 -278.33± 0.31 2HD 63433 Y N Y? ? ? Y -8.31± 0.65 -10.48± 0.46 1HD 95650 N Y Y Y? Y ... 142.30± 1.16 -51.69± 0.79 1HIP 57548 N Y N? N? N? ... 605.26± 2.32 -1219.28± 1.97 1HD 125451 N Y ... ... ... ... 105.95± 0.23 -31.80± 0.21 1HD 135599 ... ... ? Y ? Y 178.35± 0.66 -137.52± 0.62 2HD 139006 ... ... Y Y Y Y 120.27± 0.19 -89.58± 0.20 2HD 147584 ... ... Y Y Y ... 199.97± 0.25 110.97± 0.43 2HD 165185 N Y Y Y? Y ... 105.05± 0.60 7.95± 0.32 2HD 175742 ... ... N? Y? ? ... 131.31± 0.49 -283.72± 0.63 2HIP 104383 N Y ... ... ... ... -77.56± 2.42 -32.89± 0.87 2HD 217813 N Y ? ? ? Y -117.70± 0.59 -27.66± 0.49 1
Notes.UMa membership information, proper motion (van Leeuwen 2007), and number of epochs of NACO observations obtained for the presentwork. We reiterate the assignments by Montes et al. (2001) and King et al. (2003) concerning the match of Eggen’s criteriaor, respectively, thedecision on kinematic, photometric, and final membership (’Y’ = yes; ’N’ = no). Uncertainty is expressed by ’?’ and we refer the reader toKing et al. (2003) for more information. Some of the stars were not observed (zero NACO epochs taken) as is explained in thetext and omittedhere.
Table A.2. Basic stellar data of the sample of UMa group members.
object HIP number α (2000.0) δ (2000.0) parallax [mas] spec. type V mag. Ks mag.HD 11131 8486 01 49 23.36 -10 42 12.8 44.32± 3.02 G1V 6.727 5.149HD 11171 8497 01 49 35.10 -10 41 11.1 43.13± 0.26 F3III 4.664 3.872HD 22049 16537 03 32 55.84 -09 27 29.7 310.94± 0.16 K2V 3.730 1.776HD 26913 19855 04 15 25.79+06 11 58.7 47.49± 0.68 G5IV 6.960 5.271HD 26923 19859 04 15 28.80+06 11 12.7 46.88± 0.47 G0IV 6.314 4.903HD 38393 27072 05 44 27.79 -22 26 54.2 112.02± 0.18 F7V 3.586 2.508HD 41593 28954 06 06 40.48+15 32 31.6 65.48± 0.67 K0V 6.762 4.822HD 60491 36827 07 34 26.17 -06 53 48.0 40.73± 1.00 K2V 8.160 6.019HD 61606 37349 07 39 59.33 -03 35 51.0 70.37± 0.64 K2V 7.200 4.885HD 63433 38228 07 49 55.06+27 21 47.5 45.45± 0.53 G5IV 6.930 5.258HD 95650 53985 11 02 38.34+21 58 01.7 84.95± 1.05 M0 9.690 5.688HIP 57548 57548 11 47 44.40+00 48 16.4 298.04± 2.30 M4V 11.080 5.654HD 125451 69989 14 19 16.28+13 00 15.5 38.32± 0.28 F5IV 5.400 4.394HD 135599 74702 15 15 59.17+00 47 46.9 63.11± 0.70 K0 7.000 4.958HD 139006 76267 15 34 41.27+26 42 52.9 43.46± 0.28 A0V+G5Va 2.210 2.206HD 147584 80686 16 28 28.14 -70 05 03.8 82.53± 0.52 F9V+M4Vb 4.910 3.661HD 165185 88694 18 06 23.72 -36 01 11.2 56.97± 0.48 G5V 5.949 4.469HD 175742 92919 18 55 53.22+23 33 23.9 46.74± 0.85 K0Vc 8.090 5.637HIP 104383 104383 21 08 45.47 -04 25 36.9 36.92± 1.53 K6+M1d 9.430 6.398HD 217813 113829 23 03 04.98+20 55 06.9 40.46± 0.57 G5V 6.652 5.148
Notes.All parallaxes areHIPPARCOS parallaxes (van Leeuwen 2007).Ks band magnitudes were taken from 2MASS (Skrutskie et al. 2006) andare combined magnitudes for tight binaries. For spectroscopic binaries, the spectral type is displayed for both components.References for spectral type.(a) Bulut & Demircan (2007)(b) HD 147584: mean value of M4 of the range given by Skuljan et al.(2004) (M1V-M7V) (c) HD 175742: SB1 (Tokovinin et al. 2006); literature not unanimous on the parameters (Eggleton & Tokovinin 2008)(d) HIP 104383:Balega et al. (2004) .

A&A–non_detect_v6.3.1_arXiv,Online Material p 14
Table B.1.Characterisation of the NACO field of view according to Fig. 1.
name FOV max. nearby stellar companions central ref. expected approx.inner outer FOV #1 #2 ref. WDS entry mass widest bound[au] [au] [au] [au] [au] [M⊙] orbit [au]
HD 11131 8.3 213 590 4340 ... 1 01496-1041 1.00 6 5400HD 11171 8.3 213 590 4340 ... 1 01496-1041 1.52 3 8200HD 22049 1.1 29 80 ... ... .. ... 0.79 6 4300HD 26913 7.3 188 522 1350 ... 1 04155+0611 0.96 6 5200HD 26923 7.4 191 530 1360 ... 1 04155+0611 1.07 6 5800HD 38393 3.1 81 224 852 1250 2 05445-2227 1.23 4 6600HD 41593 5.4 139 386 ... ... .. ... 0.89 6 4800HD 60491 8.7 223 620 ... ... .. ... 0.86 10 4600HD 61606 5.0 128 355 822 ... 1 07400-0336 1.43 5 7700HD 63433 7.6 196 545 ... ... .. ... 0.99 6 5400HIP 57548 1.2 30 83 ... ... .. ... 0.30 12 1600HD 95650 4.1 105 292 ... ... .. ... 0.50 12 2700HD 125451 9.1 235 652 4280 ... 2 14193+1300 1.40 3 7600HD 135599 5.5 140 389 ... ... .. ... 0.85 6 4600HD 139006 8.0 206 573 ... ... .. ... 3.50 11 18900HD 147584 4.2 109 303 ... ... .. ... 1.39 8 7500HD 165185 6.1 156 434 214 ... 2 18064-3601 1.10 12 5900HD 175742 7.5 193 536 ... ... .. ... 1.10 9 5900HD 217813 8.5 218 607 ... ... .. ... 1.05 6 5700HIP 104383 9.2 237 659 7 554 2 21088-0426 1.10 12 5900
Notes. (2, 3)Range of separations which are completely covered around the coronograph (from inner radius, i.e. outer bound of the coronagraphof 0.′′35 to the outer radius of 9′′ shown in Fig. 1). –(4) maximum (incomplete) field of view (25′′) – (5-8) separation of up to two knownnearby visual companions, reference, and WDS catalogue entry. – (9, 10) Mass of the central star/binary and reference –(11) Separation ofthe approximate widest expected bound orbit of very low-mass companions according to the approximation by Close et al. (2003) for massesgreater than 0.185M⊙. Very close (spectroscopic) components are not listed but accounted for in the central mass. Masses have been derivedseparately for the binary components of HIP 104383 (0.6 M⊙ and 0.5 M⊙, respectively) and then added up. HD 147584 is a spectroscopic binarywith components of 1.12M⊙ and 0.09− 0.45M⊙ (Skuljan et al. 2004, an average of 0.27M⊙ has been adopted for the secondary). HD 175742 is asingle-lined spectroscopic binary with a primary mass of 0.75M⊙ and a minimum mass of the secondary of 0.35M⊙ (Tokovinin et al. 2006). Themaximum expected orbital separation is thus a lower limit inthis particular case.
References.(1) Fabricius et al. (2002); (2) Mason et al. (2001, 2014); (3) Allende Prieto & Lambert (1999); (4) Ammler-von Eiff & Guenther(2009); (5) Bonavita & Desidera (2007); (6) Fuhrmann (2004); (7) Simon et al. (2006); (8) Skuljan et al. (2004); (9) Tokovinin et al. (2006);(10) Valenti & Fischer (2005); (11) Bulut & Demircan (2007);(12) based on spectral type (Table A.2) and Gray (2005, table1).

A&
A–
no
n_
detect_
v6.3
.1_arX
iv,OnlineM
aterialp15
Table D.2.Astrometry and photometry of candidates for each target andeach epoch of observation.
ID ∆α[”] ∆δ[”] ∆α[”] ∆δ[”] Ks [mag] δ∆α[mas] δ∆δ[mas]HD 11131 2004-07-22ID0001 -12.437 ± 0.022 7.981 ± 0.033 ... ... 18.8 ± 0.3 ... ...ID0002 -0.680 ± 0.017 6.335 ± 0.004 ... ... 9.5 ± 0.3 ... ...HD 22049 2004-09-03 2005-12-23ID0001 6.749 ± 0.044 16.607 ± 0.020 8.558 ± 0.044 16.731 ± 0.025 17.2 ± 0.5 1809 ± 62 124 ± 32ID0002 -7.215 ± 0.036 13.812 ± 0.021 -5.454 ± 0.037 13.974 ± 0.016 17.3 ± 0.4 1761 ± 52 162 ± 26HD 26913 2003-12-25 2005-12-06ID0001 ... ... 7.626 ± 0.006 -1.747 ± 0.020 18.3 ± 0.3 ... ...ID0002 ... ... 6.864 ± 0.016 -5.755 ± 0.018 18.6 ± 0.3 ... ...HD 41593 2003-12-17 2005-11-08ID0001 8.784 ± 0.027 10.313 ± 0.024 8.966 ± 0.028 10.507 ± 0.024 17.8 ± 0.4 182 ± 39 194 ± 34ID0002 -6.208 ± 0.025 9.453 ± 0.017 -6.023 ± 0.026 9.639 ± 0.017 15.4 ± 0.4 185 ± 36 186 ± 24ID0003 -16.149 ± 0.013 3.558 ± 0.042 -15.951 ± 0.014 3.755 ± 0.042 16.8 ± 0.5 198 ± 19 197 ± 59ID0004 8.700 ± 0.007 1.857 ± 0.023 8.894 ± 0.008 2.060 ± 0.023 17.6 ± 0.4 194 ± 11 203 ± 33ID0005 -16.878 ± 0.010 -0.197 ± 0.044 ... ... 16.2 ± 0.3 ... ...HD 60491 2003-12-26 2005-11-08ID0001 -15.721 ± 0.018 5.847 ± 0.041 -15.582 ± 0.018 5.918 ± 0.041 17.4 ± 0.3 139 ± 25 71 ± 58ID0002 -1.695 ± 0.045 17.052 ± 0.011 -1.567 ± 0.045 17.132 ± 0.011 15.6 ± 0.3 128 ± 64 80 ± 16ID0003 2.382 ± 0.015 -5.890 ± 0.007 2.522 ± 0.015 -5.818 ± 0.007 18.5 ± 0.3 140 ± 21 72 ± 10ID0004 ... ... 11.312 ± 0.013 -4.255 ± 0.030 18.5 ± 0.3 ... ...HD 61606 2004-01-10 2005-11-08ID0001 -1.114 ± 0.035 13.389 ± 0.008 -1.324 ± 0.036 13.898 ± 0.009 17.7 ± 0.3 -210 ± 50 509 ± 12ID0002 1.021 ± 0.017 6.328 ± 0.005 0.819 ± 0.018 6.831 ± 0.005 19.0 ± 0.9a -202 ± 25 503 ± 7ID0003 4.780 ± 0.004 1.135 ± 0.013 4.584 ± 0.005 1.648 ± 0.012 16.9 ± 0.3 -196 ± 6 513 ± 18ID0004 -1.017 ± 0.012 -4.491 ± 0.004 -1.204 ± 0.010 -3.987 ± 0.004 17.8 ± 0.9a -187 ± 16 504 ± 6ID0005 -11.218 ± 0.017 -5.886 ± 0.030 -11.398 ± 0.016 -5.403 ± 0.030 18.1 ± 0.3 -180 ± 23 483 ± 42ID0006 9.264 ± 0.026 -9.712 ± 0.025 9.075 ± 0.025 -9.179 ± 0.024 18.2 ± 0.3 -189 ± 36 533 ± 35HD 135599 2004-07-13 2006-04-06ID0001 7.610 ± 0.024 8.923 ± 0.021 7.238 ± 0.024 9.163 ± 0.020 17.1 ± 0.3 -372 ± 34 240 ± 29ID0002 -0.490 ± 0.030 11.476 ± 0.007 -0.851 ± 0.031 11.742 ± 0.007 17.9 ± 0.3 -361 ± 43 266 ± 10HD 147584 2004-02-10 2006-02-21ID0001 7.082 ± 0.038 14.442 ± 0.020 6.702 ± 0.037 14.197 ± 0.020 13.4 ± 0.8b -380 ± 53 -245 ± 28ID0002 ... ... 11.121 ± 0.041 15.617 ± 0.031 15.1 ± 0.3 ... ...ID0003 ... ... 5.645 ± 0.033 12.509 ± 0.017 17.7 ± 0.3 ... ...ID0004 ... ... 6.463 ± 0.030 11.456 ± 0.018 18.5 ± 0.3 ... ...ID0005 ... ... 3.956 ± 0.025 9.465 ± 0.012 19.5 ± 0.3 ... ...ID0006 ... ... 8.022 ± 0.018 6.592 ± 0.021 16.5 ± 0.3 ... ...ID0007 ... ... -6.014 ± 0.006 1.809 ± 0.016 17.7 ± 0.3 ... ...ID0008 ... ... -11.427 ± 0.009 2.109 ± 0.030 16.4 ± 0.3 ... ...ID0009 ... ... 6.303 ± 0.016 5.777 ± 0.017 19.2 ± 0.3 ... ...ID0010 ... ... -16.132 ± 0.011 2.120 ± 0.042 21.4 ± 0.3 ... ...HD 165185 2004-08-06 2006-06-27ID0001 -12.109 ± 0.014 4.500 ± 0.032 -12.367 ± 0.014 4.475 ± 0.032 16.7 ± 0.4 -258 ± 20 -25 ± 45ID0002 9.264 ± 0.047 17.735 ± 0.027 9.035 ± 0.047 17.770 ± 0.026 18.6 ± 0.6 -229 ± 66 35 ± 37ID0003 9.114 ± 0.045 17.253 ± 0.026 8.881 ± 0.045 17.264 ± 0.025 19.8 ± 0.9c -233 ± 64 11 ± 36ID0004 6.524 ± 0.047 17.879 ± 0.020 6.301 ± 0.047 17.840 ± 0.020 21.8 ± 2.1c -223 ± 66 -39 ± 28ID0005 5.351 ± 0.047 17.779 ± 0.018 5.110 ± 0.047 17.834 ± 0.017 17.0 ± 0.8c -241 ± 66 55 ± 25ID0006 4.259 ± 0.045 17.036 ± 0.015 4.019 ± 0.045 17.027 ± 0.015 19.9 ± 0.4 -240 ± 64 -9 ± 21

A&
A–
no
n_
detect_
v6.3
.1_arX
iv,OnlineM
aterialp16
Table D.2.continued.
ID ∆α[”] ∆δ[”] ∆α[”] ∆δ[”] Ks [mag] δ∆α[mas] δ∆δ[mas]ID0007 2.842 ± 0.046 17.473 ± 0.013 2.595 ± 0.046 17.429 ± 0.012 19.5 ± 0.6 -247 ± 65 -44 ± 18ID0008 0.875 ± 0.045 17.248 ± 0.010 0.610 ± 0.045 17.277 ± 0.010 19.4 ± 0.5 -265 ± 64 29 ± 14ID0009 2.753 ± 0.044 16.955 ± 0.012 2.534 ± 0.044 16.901 ± 0.012 22.3 ± 1.5d -219 ± 62 -54 ± 17ID0010 -2.224 ± 0.044 16.927 ± 0.012 -2.515 ± 0.044 16.964 ± 0.012 19.5 ± 0.3 -291 ± 62 37 ± 17ID0011 -3.699 ± 0.041 15.713 ± 0.013 -3.968 ± 0.041 15.710 ± 0.014 19.2 ± 0.5 -269 ± 58 -3 ± 19ID0012 -4.902 ± 0.040 15.352 ± 0.016 -5.177 ± 0.040 15.364 ± 0.016 20.7 ± 0.8d -275 ± 57 12 ± 23ID0013 -5.338 ± 0.042 15.915 ± 0.017 -5.481 ± 0.042 15.887 ± 0.017 19.1 ± 0.4 -143 ± 59 -28 ± 24ID0014 -5.415 ± 0.041 15.784 ± 0.017 -5.673 ± 0.041 15.790 ± 0.018 18.5 ± 0.6 -258 ± 58 6 ± 25ID0015 -6.450 ± 0.044 16.762 ± 0.020 -6.697 ± 0.044 16.764 ± 0.020 18.1 ± 0.4 -247 ± 62 2 ± 28ID0016 -5.497 ± 0.046 17.530 ± 0.018 -5.785 ± 0.046 17.517 ± 0.018 21.9 ± 1.9d -288 ± 65 -13 ± 25ID0017 -8.445 ± 0.046 17.338 ± 0.024 -8.713 ± 0.046 17.352 ± 0.025 16.9 ± 0.5 -268 ± 65 14 ± 35ID0018 -10.926 ± 0.041 15.457 ± 0.030 -11.194 ± 0.041 15.463 ± 0.031 17.8 ± 0.5 -268 ± 58 6 ± 43ID0019 -11.310 ± 0.040 15.103 ± 0.031 -11.551 ± 0.040 15.040 ± 0.031 19.9 ± 0.7 -241 ± 57 -63 ± 44ID0020 -10.113 ± 0.037 13.975 ± 0.028 -10.377 ± 0.037 13.970 ± 0.028 18.1 ± 0.5 -264 ± 52 -5 ± 40ID0021 -11.011 ± 0.037 13.883 ± 0.030 -11.253 ± 0.037 13.822 ± 0.031 20.0 ± 0.3 -242 ± 52 -61 ± 43ID0022 -8.846 ± 0.035 13.106 ± 0.024 -9.117 ± 0.035 13.102 ± 0.025 13.8 ± 0.5 -271 ± 49 -4 ± 35ID0023 7.949 ± 0.042 16.054 ± 0.023 7.695 ± 0.042 16.079 ± 0.022 18.9 ± 0.5 -254 ± 59 25 ± 32ID0024 8.492 ± 0.044 16.573 ± 0.024 8.262 ± 0.044 16.594 ± 0.024 20.5 ± 0.7 -230 ± 62 21 ± 34ID0025 5.126 ± 0.038 14.583 ± 0.016 4.881 ± 0.038 14.596 ± 0.015 17.5 ± 0.5 -245 ± 54 13 ± 22ID0026 4.724 ± 0.038 14.350 ± 0.015 4.477 ± 0.038 14.395 ± 0.015 19.7 ± 0.5 -247 ± 54 45 ± 21ID0027 3.015 ± 0.038 14.689 ± 0.012 2.762 ± 0.039 14.711 ± 0.011 18.1 ± 0.4 -253 ± 54 22 ± 16ID0028 2.606 ± 0.040 15.448 ± 0.011 2.364 ± 0.041 15.467 ± 0.011 17.6 ± 0.5 -242 ± 57 19 ± 16ID0029 0.896 ± 0.038 14.477 ± 0.009 0.648 ± 0.038 14.497 ± 0.009 18.5 ± 0.3 -248 ± 54 20 ± 13ID0030 2.528 ± 0.037 14.003 ± 0.011 2.284 ± 0.037 14.002 ± 0.010 19.5 ± 0.5 -244 ± 52 — ± 15ID0031 1.235 ± 0.035 13.261 ± 0.009 0.991 ± 0.035 13.267 ± 0.008 19.4 ± 0.5 -244 ± 49 6 ± 12ID0032 -2.163 ± 0.032 12.380 ± 0.009 -2.420 ± 0.032 12.377 ± 0.010 19.6 ± 0.4 -257 ± 45 -3 ± 13ID0033 -5.715 ± 0.034 12.750 ± 0.017 -5.990 ± 0.034 12.723 ± 0.017 18.9 ± 0.5 -275 ± 48 -27 ± 24ID0034 10.187 ± 0.034 12.688 ± 0.028 9.948 ± 0.034 12.707 ± 0.027 16.5 ± 0.5 -239 ± 48 19 ± 39ID0035 10.304 ± 0.035 13.084 ± 0.028 10.039 ± 0.035 13.088 ± 0.027 19.1 ± 0.3 -265 ± 49 4 ± 39ID0036 8.481 ± 0.034 12.975 ± 0.024 8.265 ± 0.034 12.919 ± 0.023 19.5 ± 0.3 -216 ± 48 -56 ± 33ID0037 8.773 ± 0.032 11.895 ± 0.024 8.539 ± 0.032 11.913 ± 0.023 18.5 ± 0.5 -234 ± 45 18 ± 33ID0038 11.459 ± 0.028 10.500 ± 0.031 11.254 ± 0.028 10.510 ± 0.030 17.4 ± 0.5 -205 ± 40 10 ± 43ID0039 6.865 ± 0.030 11.321 ± 0.019 6.626 ± 0.030 11.318 ± 0.019 17.9 ± 0.4 -239 ± 42 -3 ± 27ID0040 5.618 ± 0.033 12.429 ± 0.016 5.363 ± 0.033 12.441 ± 0.016 17.9 ± 0.4 -255 ± 47 12 ± 23ID0041 4.147 ± 0.032 12.160 ± 0.013 3.906 ± 0.032 12.163 ± 0.013 17.2 ± 0.4 -241 ± 45 3 ± 18ID0042 5.329 ± 0.030 11.286 ± 0.016 5.088 ± 0.030 11.269 ± 0.015 19.1 ± 0.5 -241 ± 42 -17 ± 22ID0043 2.489 ± 0.031 11.910 ± 0.010 2.237 ± 0.031 11.904 ± 0.009 19.4 ± 0.6 -252 ± 44 -6 ± 13ID0044 3.924 ± 0.028 10.574 ± 0.012 3.676 ± 0.028 10.575 ± 0.011 17.6 ± 0.4 -248 ± 40 1 ± 16ID0045 1.229 ± 0.030 11.519 ± 0.008 0.976 ± 0.030 11.525 ± 0.007 17.6 ± 0.4 -253 ± 42 6 ± 11ID0046 2.264 ± 0.025 9.561 ± 0.008 2.020 ± 0.025 9.555 ± 0.008 17.1 ± 0.4 -244 ± 35 -6 ± 11ID0047 2.615 ± 0.025 9.453 ± 0.009 2.372 ± 0.025 9.458 ± 0.008 19.5 ± 0.3 -243 ± 35 5 ± 12ID0048 3.465 ± 0.025 9.642 ± 0.011 3.222 ± 0.025 9.652 ± 0.010 19.2 ± 0.4 -243 ± 35 10 ± 15ID0049 -0.968 ± 0.027 10.156 ± 0.007 -1.226 ± 0.027 10.138 ± 0.007 18.8 ± 0.4 -258 ± 38 -18 ± 10ID0050 -1.061 ± 0.024 9.312 ± 0.006 -1.316 ± 0.024 9.311 ± 0.006 18.2 ± 0.4 -255 ± 34 — ± 8ID0051 -1.644 ± 0.024 8.968 ± 0.007 -1.897 ± 0.023 8.956 ± 0.007 18.6 ± 0.4 -253 ± 33 -12 ± 10ID0052 -5.516 ± 0.031 11.827 ± 0.016 -5.800 ± 0.031 11.769 ± 0.017 19.8 ± 0.7 -284 ± 44 -58 ± 23ID0053 -4.664 ± 0.030 11.306 ± 0.014 -4.940 ± 0.030 11.301 ± 0.015 19.5 ± 0.3 -276 ± 42 -5 ± 21ID0054 -8.807 ± 0.033 12.330 ± 0.024 -9.122 ± 0.033 12.337 ± 0.025 18.8 ± 0.5 -315 ± 47 7 ± 35ID0055 -12.998 ± 0.034 12.774 ± 0.035 -13.254 ± 0.034 12.739 ± 0.035 19.3 ± 0.6 -256 ± 48 -35 ± 49

A&
A–
no
n_
detect_
v6.3
.1_arX
iv,OnlineM
aterialp17
Table D.2.continued.
ID ∆α[”] ∆δ[”] ∆α[”] ∆δ[”] Ks [mag] δ∆α[mas] δ∆δ[mas]ID0056 -13.804 ± 0.033 12.147 ± 0.037 -14.088 ± 0.033 12.130 ± 0.038 18.4 ± 0.5 -284 ± 47 -17 ± 53ID0057 -14.100 ± 0.031 11.487 ± 0.038 -14.349 ± 0.031 11.426 ± 0.038 19.4 ± 0.6 -249 ± 44 -61 ± 54ID0058 -15.891 ± 0.024 8.285 ± 0.042 -16.159 ± 0.024 8.268 ± 0.043 15.2 ± 0.5 -268 ± 34 -17 ± 60ID0059 -7.046 ± 0.026 9.665 ± 0.019 -7.302 ± 0.026 9.656 ± 0.020 17.4 ± 0.4 -256 ± 37 -9 ± 28ID0060 -7.789 ± 0.029 10.781 ± 0.021 -8.055 ± 0.029 10.749 ± 0.022 19.6 ± 0.6 -266 ± 41 -32 ± 30ID0061 -8.341 ± 0.029 10.856 ± 0.023 -8.635 ± 0.029 10.842 ± 0.023 20.9 ± 0.5 -294 ± 41 -14 ± 33ID0062 -6.989 ± 0.023 8.738 ± 0.019 -7.252 ± 0.023 8.722 ± 0.020 20.0 ± 0.9d -263 ± 33 -16 ± 28ID0063 -6.684 ± 0.019 7.250 ± 0.018 -6.953 ± 0.019 7.229 ± 0.019 19.0 ± 0.4 -269 ± 27 -21 ± 26ID0064 -4.377 ± 0.018 6.647 ± 0.012 -4.627 ± 0.018 6.640 ± 0.013 17.9 ± 0.5 -250 ± 25 -7 ± 18ID0065 -4.525 ± 0.016 6.039 ± 0.012 -4.772 ± 0.016 6.032 ± 0.013 17.0 ± 0.4 -247 ± 23 -7 ± 18ID0066 -4.525 ± 0.016 6.039 ± 0.012 -4.772 ± 0.016 6.032 ± 0.013 17.0 ± 0.4 -247 ± 23 -7 ± 18ID0067 -1.017 ± 0.021 7.835 ± 0.005 -1.246 ± 0.020 7.816 ± 0.006 18.4 ± 1.5a -229 ± 29 -19 ± 8ID0068 -1.637 ± 0.019 7.295 ± 0.006 -1.880 ± 0.019 7.282 ± 0.007 18.6 ± 0.5 -243 ± 27 -13 ± 9ID0069 -1.399 ± 0.015 5.886 ± 0.005 -1.636 ± 0.015 5.869 ± 0.005 18.2 ± 0.4 -237 ± 21 -17 ± 7ID0070 0.403 ± 0.021 7.970 ± 0.005 0.159 ± 0.021 7.961 ± 0.005 17.0 ± 0.3 -244 ± 30 -9 ± 7ID0071 -12.492 ± 0.026 9.687 ± 0.033 -12.776 ± 0.027 9.731 ± 0.034 20.1 ± 0.4 -284 ± 37 44 ± 47ID0072 -11.868 ± 0.022 7.887 ± 0.031 -12.115 ± 0.022 7.863 ± 0.032 19.6 ± 0.4 -247 ± 31 -24 ± 45ID0073 -12.086 ± 0.018 6.158 ± 0.032 -12.353 ± 0.018 6.133 ± 0.033 17.9 ± 0.5 -267 ± 25 -25 ± 46ID0074 -12.515 ± 0.019 6.636 ± 0.033 -12.817 ± 0.019 6.630 ± 0.034 20.0 ± 0.8d -302 ± 27 -6 ± 47ID0075 -11.278 ± 0.018 6.521 ± 0.030 -11.558 ± 0.018 6.522 ± 0.030 19.1 ± 0.4 -280 ± 25 1 ± 42ID0076 -9.094 ± 0.020 7.428 ± 0.024 -9.368 ± 0.020 7.472 ± 0.025 19.5 ± 0.4 -274 ± 28 44 ± 35ID0077 -8.837 ± 0.019 7.130 ± 0.023 -9.111 ± 0.019 7.008 ± 0.024 19.7 ± 0.4 -274 ± 27 -122 ± 33ID0078 -13.843 ± 0.019 6.393 ± 0.036 -14.117 ± 0.019 6.363 ± 0.037 19.2 ± 0.7 -274 ± 27 -30 ± 52ID0079 -12.928 ± 0.013 4.072 ± 0.034 -13.151 ± 0.013 4.010 ± 0.035 20.0 ± 0.5 -223 ± 18 -62 ± 49ID0080 -13.304 ± 0.013 4.143 ± 0.035 -13.535 ± 0.013 4.117 ± 0.036 19.5 ± 0.4 -231 ± 18 -26 ± 50ID0081 -13.845 ± 0.014 4.111 ± 0.036 -14.116 ± 0.014 4.072 ± 0.037 18.9 ± 0.7 -271 ± 20 -39 ± 52ID0082 -3.875 ± 0.008 2.857 ± 0.010 -4.086 ± 0.008 2.951 ± 0.011 17.1 ± 0.4 -211 ± 11 94 ± 15ID0083 -4.401 ± 0.010 3.594 ± 0.012 -4.649 ± 0.010 3.580 ± 0.012 19.8 ± 0.7 -248 ± 14 -14 ± 17ID0084 -4.962 ± 0.010 3.546 ± 0.013 -5.218 ± 0.010 3.523 ± 0.014 18.1 ± 0.4 -256 ± 14 -23 ± 19ID0085 -5.102 ± 0.010 3.747 ± 0.014 -5.362 ± 0.010 3.724 ± 0.014 18.8 ± 0.5 -260 ± 14 -23 ± 20ID0086 -3.561 ± 0.012 4.340 ± 0.010 -3.809 ± 0.012 4.340 ± 0.010 19.5 ± 0.3 -248 ± 17 0 ± 14ID0087 -5.510 ± 0.013 4.835 ± 0.015 -5.763 ± 0.013 4.822 ± 0.015 18.5 ± 0.3 -253 ± 18 -13 ± 21ID0088 -10.682 ± 0.007 -1.022 ± 0.028 -10.935 ± 0.007 -1.060 ± 0.029 17.4 ± 0.5 -253 ± 10 -38 ± 40ID0089 -11.034 ± 0.007 -0.490 ± 0.029 -11.289 ± 0.007 -0.505 ± 0.030 19.5 ± 0.3 -255 ± 10 -15 ± 42ID0090 -7.401 ± 0.006 -1.589 ± 0.019 -7.647 ± 0.006 -1.620 ± 0.020 17.1 ± 0.4 -246 ± 8 -31 ± 28ID0091 -7.058 ± 0.007 -2.340 ± 0.019 -7.304 ± 0.008 -2.367 ± 0.019 17.2 ± 0.3 -246 ± 11 -27 ± 27ID0092 -8.906 ± 0.008 2.189 ± 0.023 -9.174 ± 0.008 2.131 ± 0.024 22.4 ± 1.8a,d -268 ± 11 -58 ± 33ID0093 -11.528 ± 0.009 2.211 ± 0.030 -11.819 ± 0.009 2.199 ± 0.031 19.5 ± 0.4 -291 ± 13 -12 ± 43ID0094 1.450 ± 0.015 5.663 ± 0.005 1.209 ± 0.015 5.651 ± 0.005 19.2 ± 0.7 -241 ± 21 -12 ± 7ID0095 1.188 ± 0.014 5.164 ± 0.004 0.925 ± 0.013 5.152 ± 0.004 18.4 ± 0.5 -263 ± 19 -12 ± 6ID0096 1.571 ± 0.013 5.052 ± 0.005 1.333 ± 0.013 5.030 ± 0.005 18.8 ± 0.3 -238 ± 18 -22 ± 7ID0097 1.897 ± 0.013 4.968 ± 0.006 1.655 ± 0.013 4.965 ± 0.005 17.9 ± 0.3 -242 ± 18 -3 ± 8ID0098 1.885 ± 0.012 4.628 ± 0.006 1.644 ± 0.012 4.631 ± 0.005 18.4 ± 0.4 -241 ± 17 3 ± 8ID0099 4.854 ± 0.024 9.288 ± 0.014 4.619 ± 0.024 9.288 ± 0.013 19.0 ± 0.5 -235 ± 34 0 ± 19ID0100 4.326 ± 0.021 7.897 ± 0.012 4.068 ± 0.021 7.903 ± 0.012 19.5 ± 0.5 -258 ± 30 6 ± 17ID0101 8.097 ± 0.024 8.856 ± 0.022 7.867 ± 0.023 8.808 ± 0.021 22.0 ± 0.7 -230 ± 33 -48 ± 30ID0102 10.651 ± 0.022 8.107 ± 0.028 10.427 ± 0.022 8.128 ± 0.028 18.1 ± 0.4 -224 ± 31 21 ± 40ID0103 7.372 ± 0.016 5.737 ± 0.020 7.136 ± 0.016 5.740 ± 0.019 14.0 ± 0.4 -236 ± 23 3 ± 28ID0104 6.457 ± 0.014 5.051 ± 0.017 6.228 ± 0.014 5.043 ± 0.017 17.9 ± 0.3 -229 ± 20 -8 ± 24

A&
A–
no
n_
detect_
v6.3
.1_arX
iv,OnlineM
aterialp18
Table D.2.continued.
ID ∆α[”] ∆δ[”] ∆α[”] ∆δ[”] Ks [mag] δ∆α[mas] δ∆δ[mas]ID0105 6.426 ± 0.012 4.379 ± 0.017 6.192 ± 0.012 4.389 ± 0.016 13.8 ± 0.3 -234 ± 17 10 ± 23ID0106 4.477 ± 0.011 4.009 ± 0.012 4.237 ± 0.011 4.006 ± 0.011 19.3 ± 0.4 -240 ± 16 -3 ± 16ID0107 8.397 ± 0.010 3.350 ± 0.022 8.181 ± 0.010 3.356 ± 0.022 19.0 ± 0.5 -216 ± 14 6 ± 31ID0108 8.364 ± 0.006 1.566 ± 0.022 8.141 ± 0.006 1.563 ± 0.021 18.5 ± 0.3 -223 ± 8 -3 ± 30ID0109 11.177 ± 0.008 1.725 ± 0.029 10.972 ± 0.008 1.729 ± 0.029 19.5 ± 1.2a -205 ± 11 4 ± 41ID0110 6.199 ± 0.005 1.517 ± 0.016 5.972 ± 0.005 1.458 ± 0.016 18.0 ± 0.6 -227 ± 7 -59 ± 23ID0111 7.798 ± 0.006 -1.437 ± 0.020 7.570 ± 0.006 -1.443 ± 0.020 16.6 ± 0.3 -228 ± 8 -6 ± 28ID0112 9.992 ± 0.007 -1.069 ± 0.026 9.774 ± 0.006 -1.074 ± 0.026 17.6 ± 0.4 -218 ± 9 -5 ± 37ID0113 10.644 ± 0.007 -1.060 ± 0.028 10.412 ± 0.007 -1.080 ± 0.027 19.4 ± 1.0a,d -232 ± 10 -20 ± 39ID0114 10.654 ± 0.007 -0.774 ± 0.028 10.433 ± 0.007 -0.780 ± 0.027 18.2 ± 0.3 -221 ± 10 -6 ± 39ID0115 4.980 ± 0.007 -2.438 ± 0.013 4.758 ± 0.007 -2.457 ± 0.013 19.0 ± 0.3 -222 ± 10 -19 ± 18ID0116 9.866 ± 0.010 -2.898 ± 0.026 9.640 ± 0.010 -2.901 ± 0.025 18.5 ± 0.3 -226 ± 14 -3 ± 36ID0117 9.696 ± 0.010 -3.045 ± 0.025 9.480 ± 0.010 -3.045 ± 0.025 17.4 ± 0.3 -216 ± 14 0 ± 35ID0118 8.358 ± 0.012 -4.031 ± 0.022 8.132 ± 0.012 -4.039 ± 0.021 16.5 ± 0.3 -226 ± 17 -8 ± 30ID0119 8.940 ± 0.013 -4.545 ± 0.024 8.720 ± 0.013 -4.560 ± 0.023 17.6 ± 0.4 -220 ± 18 -15 ± 33ID0120 9.528 ± 0.015 -5.240 ± 0.025 9.311 ± 0.015 -5.260 ± 0.025 19.5 ± 0.3 -217 ± 21 -20 ± 35ID0121 9.333 ± 0.014 -5.014 ± 0.025 9.121 ± 0.014 -5.029 ± 0.024 19.0 ± 0.3 -212 ± 20 -15 ± 35ID0122 10.977 ± 0.018 -6.303 ± 0.029 10.764 ± 0.018 -6.327 ± 0.028 18.0 ± 0.5 -213 ± 25 -24 ± 40ID0123 10.231 ± 0.018 -6.534 ± 0.027 10.012 ± 0.018 -6.550 ± 0.026 16.9 ± 0.4 -219 ± 25 -16 ± 37ID0124 10.000 ± 0.019 -6.989 ± 0.026 9.786 ± 0.019 -7.007 ± 0.026 17.3 ± 0.4 -214 ± 27 -18 ± 37ID0125 9.228 ± 0.017 -5.959 ± 0.024 9.011 ± 0.017 -5.974 ± 0.024 17.1 ± 0.3 -217 ± 24 -15 ± 34ID0126 7.641 ± 0.024 -9.017 ± 0.021 7.425 ± 0.024 -9.048 ± 0.020 17.9 ± 0.4 -216 ± 34 -31 ± 29ID0127 7.916 ± 0.022 -8.255 ± 0.021 7.704 ± 0.022 -8.274 ± 0.021 19.2 ± 0.3 -212 ± 31 -19 ± 30ID0128 7.315 ± 0.020 -7.610 ± 0.020 7.088 ± 0.020 -7.621 ± 0.019 19.2 ± 0.3 -227 ± 28 -11 ± 28ID0129 6.573 ± 0.025 -9.555 ± 0.018 6.357 ± 0.025 -9.580 ± 0.018 19.5 ± 0.4 -216 ± 35 -25 ± 25ID0130 5.174 ± 0.023 -8.561 ± 0.014 4.966 ± 0.023 -8.578 ± 0.014 19.3 ± 0.3 -208 ± 33 -17 ± 20ID0131 5.090 ± 0.022 -8.221 ± 0.014 4.863 ± 0.022 -8.240 ± 0.014 18.9 ± 0.3 -227 ± 31 -19 ± 20ID0132 4.854 ± 0.021 -7.864 ± 0.014 4.647 ± 0.021 -7.903 ± 0.013 19.8 ± 0.6 -207 ± 30 -39 ± 19ID0133 4.921 ± 0.019 -7.214 ± 0.014 4.691 ± 0.019 -7.216 ± 0.013 19.5 ± 0.3 -230 ± 27 -2 ± 19ID0134 6.189 ± 0.014 -5.245 ± 0.016 5.973 ± 0.014 -5.272 ± 0.016 18.9 ± 0.3 -216 ± 20 -27 ± 23ID0135 5.003 ± 0.003 -0.052 ± 0.013 4.759 ± 0.003 -0.075 ± 0.012 19.5 ± 0.4 -244 ± 4 -23 ± 18ID0136 1.442 ± 0.018 -6.727 ± 0.005 1.208 ± 0.018 -6.776 ± 0.005 19.1 ± 0.7 -234 ± 25 -49 ± 7ID0137 1.217 ± 0.017 -6.560 ± 0.005 0.982 ± 0.017 -6.580 ± 0.005 22.1 ± 2.1a,d -235 ± 24 -20 ± 7ID0138 0.147 ± 0.015 -5.920 ± 0.004 -0.079 ± 0.016 -5.950 ± 0.004 18.4 ± 0.5 -226 ± 22 -30 ± 6ID0139 -1.573 ± 0.019 -7.348 ± 0.006 -1.785 ± 0.019 -7.386 ± 0.006 19.0 ± 0.5 -212 ± 27 -38 ± 8ID0140 -2.515 ± 0.022 -8.293 ± 0.008 -2.743 ± 0.022 -8.327 ± 0.009 18.4 ± 0.3 -228 ± 31 -34 ± 12ID0141 -3.150 ± 0.024 -9.116 ± 0.010 -3.391 ± 0.024 -9.158 ± 0.010 19.0 ± 0.4 -241 ± 34 -42 ± 14ID0142 -2.760 ± 0.019 -7.169 ± 0.008 -2.989 ± 0.019 -7.207 ± 0.009 14.6 ± 0.3 -229 ± 27 -38 ± 12ID0143 -4.665 ± 0.017 -6.336 ± 0.013 -4.901 ± 0.017 -6.363 ± 0.013 18.7 ± 0.4 -236 ± 24 -27 ± 18ID0144 -3.964 ± 0.016 -6.069 ± 0.011 -4.186 ± 0.016 -6.067 ± 0.012 19.8 ± 0.3 -222 ± 23 2 ± 16ID0145 -5.291 ± 0.019 -7.130 ± 0.014 -5.520 ± 0.019 -7.151 ± 0.015 20.0 ± 0.3 -229 ± 27 -21 ± 21ID0146 -5.354 ± 0.015 -5.633 ± 0.014 -5.606 ± 0.015 -5.661 ± 0.015 17.2 ± 0.3 -252 ± 21 -28 ± 21ID0147 -5.459 ± 0.012 -4.415 ± 0.015 -5.702 ± 0.012 -4.441 ± 0.015 17.2 ± 0.3 -243 ± 17 -26 ± 21ID0148 -5.068 ± 0.011 -3.964 ± 0.013 -5.297 ± 0.011 -3.989 ± 0.014 19.7 ± 0.4 -229 ± 16 -25 ± 19ID0149 -6.688 ± 0.015 -5.706 ± 0.018 -6.925 ± 0.016 -5.743 ± 0.018 19.7 ± 0.8a,d -237 ± 22 -37 ± 25ID0150 -8.104 ± 0.015 -5.406 ± 0.021 -8.336 ± 0.015 -5.452 ± 0.022 18.8 ± 0.4 -232 ± 21 -46 ± 30ID0151 -10.863 ± 0.022 -7.955 ± 0.029 -11.105 ± 0.022 -8.008 ± 0.029 18.6 ± 0.4 -242 ± 31 -53 ± 41ID0152 -10.940 ± 0.018 -6.415 ± 0.029 -11.195 ± 0.018 -6.466 ± 0.030 19.4 ± 0.5 -255 ± 25 -51 ± 42ID0153 -10.961 ± 0.016 -5.556 ± 0.029 -11.207 ± 0.016 -5.595 ± 0.030 19.3 ± 0.3 -246 ± 23 -39 ± 42

A&
A–
no
n_
detect_
v6.3
.1_arX
iv,OnlineM
aterialp19
Table D.2.continued.
ID ∆α[”] ∆δ[”] ∆α[”] ∆δ[”] Ks [mag] δ∆α[mas] δ∆δ[mas]ID0154 -12.309 ± 0.014 -4.657 ± 0.032 -12.561 ± 0.014 -4.687 ± 0.033 18.6 ± 0.5 -252 ± 20 -30 ± 46ID0155 -13.460 ± 0.014 -4.197 ± 0.035 -13.710 ± 0.014 -4.235 ± 0.036 18.1 ± 0.5 -250 ± 20 -38 ± 50ID0156 -14.947 ± 0.014 -4.246 ± 0.039 -15.213 ± 0.014 -4.284 ± 0.040 19.5 ± 0.6 -266 ± 20 -38 ± 56ID0157 -14.638 ± 0.016 -4.995 ± 0.038 -14.886 ± 0.016 -5.029 ± 0.039 18.4 ± 0.4 -248 ± 23 -34 ± 54ID0158 -12.859 ± 0.012 -3.316 ± 0.034 -13.115 ± 0.012 -3.348 ± 0.034 18.2 ± 0.3 -256 ± 17 -32 ± 48ID0159 -10.131 ± 0.010 -2.930 ± 0.027 -10.395 ± 0.010 -2.905 ± 0.027 19.6 ± 0.3 -264 ± 14 25 ± 38ID0160 -3.122 ± 0.016 -5.979 ± 0.009 -3.332 ± 0.016 -6.042 ± 0.009 17.9 ± 0.5 -210 ± 23 -63 ± 13ID0161 9.903 ± 0.012 -3.896 ± 0.026 9.687 ± 0.012 -3.908 ± 0.025 19.0 ± 0.3 -216 ± 17 -12 ± 36ID0162 0.333 ± 0.009 -3.306 ± 0.002 ... ... 18.5 ± 0.3 ... ...ID0163 3.099 ± 0.003 -0.813 ± 0.008 ... ... 17.9 ± 0.3 ... ...HD 175742 2004-07-30 2006-06-27ID0001 -7.334 ± 0.016 5.982 ± 0.019 -7.641 ± 0.018 6.505 ± 0.020 16.5 ± 0.5 -307 ± 24 523 ± 28ID0003 -3.055 ± 0.018 6.934 ± 0.009 -3.358 ± 0.020 7.474 ± 0.010 18.9 ± 0.5 -303 ± 27 540 ± 13ID0004 2.678 ± 0.002 0.050 ± 0.007 2.409 ± 0.002 0.586 ± 0.006 15.9 ± 0.3 -269 ± 3 536 ± 9ID0005 9.109 ± 0.010 -3.397 ± 0.024 8.852 ± 0.009 -2.859 ± 0.023 18.9 ± 0.4 -257 ± 13 538 ± 33ID0006 -3.039 ± 0.023 -8.884 ± 0.010 -3.313 ± 0.022 -8.375 ± 0.010 16.8 ± 0.4 -274 ± 32 509 ± 14ID0007 ... ... 8.801 ± 0.046 17.394 ± 0.025 18.0 ± 0.3 ... ...ID0008 ... ... 3.383 ± 0.042 16.147 ± 0.013 18.5 ± 0.3 ... ...ID0009 ... ... -2.847 ± 0.021 7.972 ± 0.009 19.7 ± 0.3 ... ...ID0010 ... ... 3.063 ± 0.012 4.392 ± 0.008 18.9 ± 0.3 ... ...ID0011 ... ... 2.610 ± 0.024 9.054 ± 0.009 20.0 ± 0.3 ... ...ID0012 ... ... -8.037 ± 0.045 17.125 ± 0.023 19.9 ± 0.3 ... ...ID0013 ... ... -11.710 ± 0.010 -2.498 ± 0.031 19.5 ± 0.3 ... ...ID0014 ... ... -3.767 ± 0.019 -7.102 ± 0.011 19.4 ± 0.3 ... ...HIP 104383 2003-11-07ID0001 -10.192 ± 0.046 17.479 ± 0.029 ... ... 16.2 ± 0.3 ... ...ID0002 0.401 ± 0.034 12.871 ± 0.008 ... ... 17.5 ± 0.3 ... ...ID0003 -16.661 ± 0.039 14.241 ± 0.044 ... ... 16.5 ± 0.3 ... ...ID0004 -4.384 ± 0.003 -0.608 ± 0.011 ... ... 17.8 ± 0.3 ... ...ID0005 -4.876 ± 0.003 -0.504 ± 0.013 ... ... 15.7 ± 0.3 ... ...
Notes.A list of unique sequential identifiers (prefix ’ID’) has beenassigned to the candidates(1) (cf. Figs. C.1-C.5). For each candidate, theseparation from the central star in right ascension and declination is given for the first epoch(2, 3) and the second epoch when present(4, 5).Finally, apparentKs magnitude is given for all candidates(6) and - when two epochs are available - the change of separation(7,8). The changein separation reflects the stellar parallactic and proper motion since all candidates are background stars (see text andTable E.2). Large error barsin the magnitude measurement are ascribed to different causes. Those are indicated by letters to the column for error bars≥ 0.8: (a) affected bybackground features (like diffraction spikes, ghosts, reflections)(b) smeared in first epoch(c) aperture photometry misses flux at edge of frame(d) measurement affected by noise in first epoch.
A&A–non_detect_v6.3.1_arXiv,Online Material p 20
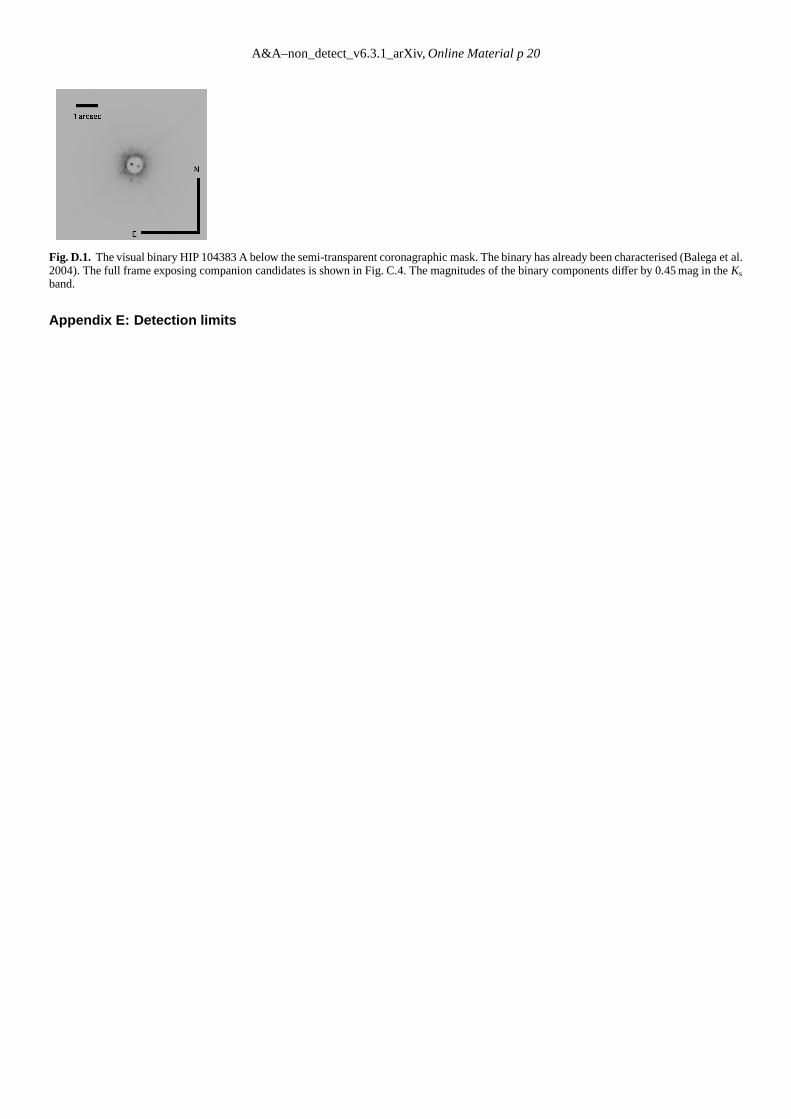
Fig. D.1. The visual binary HIP 104383 A below the semi-transparent coronagraphic mask. The binary has already been characterised (Balega et al.2004). The full frame exposing companion candidates is shown in Fig. C.4. The magnitudes of the binary components differ by 0.45 mag in theKs
band.
Appendix E: Detection limits

A&A–non_detect_v6.3.1_arXiv,Online Material p 21
0
5
10
15
200 5 10 15 20 25
magnitudedifference
(Ksband)
angular separation [arcsec]
(a) HD 22049
0
5
10
15
200 5 10 15 20 25
magnitudedifference
(Ksband)
angular separation [arcsec]
2004-09-032004-09-032005-12-232005-12-23both epochs
0
5
10
15
200 5 10 15 20 25
magnitudedifference
(Ksband)
angular separation [arcsec]
(b) HD 26913
0
5
10
15
200 5 10 15 20 25
magnitudedifference
(Ksband)
angular separation [arcsec]
2003-12-252003-12-252005-12-062005-12-06both epochs
0
5
10
15
200 5 10 15 20 25
magnitudedifference
(Ksband)
angular separation [arcsec]
(c) HD 41593
0
5
10
15
200 5 10 15 20 25
magnitudedifference
(Ksband)
angular separation [arcsec]
2003-12-172003-12-172005-11-082005-11-08both epochs
0
5
10
15
200 5 10 15 20 25
magnitudedifference
(Ksband)
angular separation [arcsec]
(d) HD 60491
0
5
10
15
200 5 10 15 20 25
magnitudedifference
(Ksband)
angular separation [arcsec]
2003-12-262003-12-262005-11-082005-11-08both epochs
0
5
10
15
200 5 10 15 20 25
magnitudedifference
(Ksband)
angular separation [arcsec]
(e) HD 61606
0
5
10
15
200 5 10 15 20 25
magnitudedifference
(Ksband)
angular separation [arcsec]
2004-01-102004-01-102005-11-082005-11-08both epochs
0
5
10
15
200 5 10 15 20 25
magnitudedifference
(Ksband)
angular separation [arcsec]
(f) HD 135599
0
5
10
15
200 5 10 15 20 25
magnitudedifference
(Ksband)
angular separation [arcsec]
2004-07-132004-07-132006-04-062006-04-06both epochs
Fig. E.1. Dynamic range curves are shown for stars with candidates andobservations in two epochs: HD 22049, HD 26913, HD 41593, HD60491, HD 61606, and HD 135599. The lines show the 10σ detection limits for the 1st and 2nd epoch as is indicated in the legend. The adoptionof a 5σ limit to describe the visual detection of candidates would lower the curves by 2.5 log2= 0.75 mag. Furthermore, the curves can vary by0.3 mag due to the uncertainty of the transmission of the coronagraph. Filled circles indicate candidates found in the 1st epoch, open circles thosein the 2nd epoch, and filled squares those seen in both epochs.
0
5
10
15
200 5 10 15 20 25
magnitudedifference
(Ksband)
angular separation [arcsec]
(a) HD 147584
0
5
10
15
200 5 10 15 20 25
magnitudedifference
(Ksband)
angular separation [arcsec]
2004-02-102004-02-102006-02-212006-02-21both epochs
0
5
10
15
200 5 10 15 20 25
magnitudedifference
(Ksband)
angular separation [arcsec]
(b) HD 165185
0
5
10
15
200 5 10 15 20 25
magnitudedifference
(Ksband)
angular separation [arcsec]
2004-08-062004-08-062006-06-272006-06-27both epochs
0
5
10
15
200 5 10 15 20 25
magnitudedifference
(Ksband)
angular separation [arcsec]
(c) HD 175742
0
5
10
15
200 5 10 15 20 25
magnitudedifference
(Ksband)
angular separation [arcsec]
2004-07-302004-07-302006-06-272006-06-27both epochs
Fig. E.2. Similar to Fig. E.1 for HD 147584, HD 165185, and HD 175742. Some data points are below the detection limits owing to unreliablemagnitude measurements (discussed in the text).

A&A–non_detect_v6.3.1_arXiv,Online Material p 22
0
5
10
15
200 5 10 15 20 25
magnitudedifference
(Ksband)
angular separation [arcsec]
0
5
10
15
200 5 10 15 20 25
magnitudedifference
(Ksband)
angular separation [arcsec]
HD 11131 (040722)
HD 11131 (040722)
HIP 104383 (031107)
HIP 104383 (031107)
(a)
0
5
10
15
200 5 10 15 20 25
magnitudedifference
(Ksband)
angular separation [arcsec]
(b)
0
5
10
15
200 5 10 15 20 25
HD 11171 (2004-07-27)
HD 11171 (2006-08-03)
HD 26923 (2003-12-26)
HD 38393 (2003-12-01)
0
5
10
15
200 5 10 15 20 25
magnitudedifference
(Ksband)
angular separation [arcsec]
(c)
0
5
10
15
200 5 10 15 20 25
HD 63433 (2004-01-15)
HIP 57548 (2004-01-11)
HD 95650 (2004-01-14)
0
5
10
15
200 5 10 15 20 25
magnitudedifference
(Ksband)
angular separation [arcsec]
(d)
0
5
10
15
200 5 10 15 20 25
HD 125451 (2004-01-29)
HD 139006 (2004-02-10)
HD 217813 (2003-10-06)
Fig. E.3.Dynamic range curves are shown for stars with candidates detected in a single epoch (HD 11131 and HIP 104383) and for all the otherstars without any candidates.
0
20
40
60
80
100
0 2 4 6 8 10
mass[M
Jup]
angular separation [arcsec]
HD 22049 (2004-09-03)
HD 22049 (2005-12-23)
HD 38393 (2003-12-01)
HIP 57548 (2004-01-11)
(a)
0
20
40
60
80
100
0 2 4 6 8 10
mass[M
Jup]
angular separation [arcsec]
HD 61606 (2004-01-10)
HD 61606 (2005-11-08)
HD 95650 (2004-01-14)
HD 147584 (2004-02-10)
HD 147584 (2006-02-21)
(b)
0
20
40
60
80
100
0 2 4 6 8 10
mass[M
Jup]
angular separation [arcsec]
HD 41593 (2003-12-17)
HD 41593 (2005-11-08)
HD 135599 (2004-07-13)
HD 135599 (2006-04-06)
HD 165185 (2004-08-06)
HD 165185 (2006-06-27)
(c)
0
20
40
60
80
100
0 20 40 60 80
mass[M
Jup]
separation [au]
HD 22049 (2004-09-03)
HD 22049 (2005-12-23)
HD 38393 (2003-12-01)
HIP 57548 (2004-01-11)
(d)
0
20
40
60
80
100
0 25 50 75 100 125 150
mass[M
Jup]
separation [au]
HD 61606 (2004-01-10)
HD 61606 (2005-11-08)
HD 95650 (2004-01-14)
HD 147584 (2004-02-10)
HD 147584 (2006-02-21)
(e)
0
20
40
60
80
100
0 50 100 150 200
mass[M
Jup]
separation [au]
HD 41593 (2003-12-17)
HD 41593 (2005-11-08)
HD 135599 (2004-07-13)
HD 135599 (2006-04-06)
HD 165185 (2004-08-06)
HD 165185 (2006-06-27)
(f)
Fig. E.4. Top row: detection limits on mass as a function of angular separation. Bottom row: the same as a function of separation in linearscale (bottom row). Based on the dynamic range curves presented in Figs. 2 and E.1-E.3 and on evolutionary models (DUSTY00 and COND03)assuming an age of 500 Myr. The layout follows Figs. E.3 b, c, and d.

A&A–non_detect_v6.3.1_arXiv,Online Material p 23
Table E.1. Detection limits derived from exposures of different epochs.
star epoch exp. time min. separation [au]on target 12MJup 20MJup 35MJup
[s] 100 Myr 500 Myr 1 Gyr 100 Myr 500 Myr 1 Gyr 100 Myr 500 Myr 1 GyrHD 11131 2004-07-22 720 20.8 86.7 ... 17.6 50.7 96.7 <3.2 22.3 34.8HD 11171 2004-07-27 495 27.0 182.1 ... 22.5 63.9 220.8 14.8 29.3 50.3HD 11171 2006-08-03 1680 27.7 247.7 ... 22.5 75.5 255.5 14.5 32.9 66.2HD 22049a 2004-09-03 2475 2.4 8.7 18.4 1.9 5.0 8.8 <0.4 2.6 3.8HD 22049 2005-12-23 720 <0.4 10.7 29.1 <0.4 7.2 10.8 <0.4 0.7 4.4HD 26913 2003-12-25 864 17.1 515.8 ... 13.8 40.4 516.3 <2.8 18.6 27.2HD 26913 2005-12-06 630 16.4 97.0 ... 12.3 45.5 112.0 <2.8 18.0 29.1HD 26923 2003-12-26 630 19.0 ... ... 16.0 52.1 ... <2.9 20.7 33.2HD 38393b 2003-12-01 1673 9.6 96.4 ... 7.5 31.1 97.8 <1.2 10.6 21.0HD 41593c 2003-12-17 1260 13.3 60.9 ... 10.2 30.2 65.5 3.1 14.7 20.7HD 41593 2005-11-08 630 11.4 53.8 ... 8.3 30.1 56.2 <2.1 12.6 20.0HD 60491d 2003-12-26 1855 23.0 ... ... 19.7 45.7 ... 10.1 24.5 32.0HD 60491 2005-11-08 560 16.5 ... ... 10.5 48.8 ... <3.3 18.8 29.7HD 61606 2004-01-10 560 11.0 345.3 ... 7.2 25.6 344.3 <1.9 12.2 18.0HD 61606 2005-11-08 630 9.1 45.6 ... 4.1 26.4 46.3 <1.9 10.5 16.9HD 63433 2004-01-15 980 21.4 ... ... 17.6 46.5 ... 11.1 23.2 33.2HIP 57548 2004-01-11 630 <0.5 2.9 8.2 <0.5 0.7 3.0 <0.5 <0.5 <0.5HD 95650 2004-01-14 630 7.9 30.9 ... 6.4 13.7 32.3 <1.6 8.6 11.8HD 125451 2004-01-29 630 31.7 ... ... 25.7 91.0 ... 10.4 35.8 63.7HD 135599e 2004-07-13 1080 10.8 43.0 ... 6.4 22.8 43.7 <2.1 11.9 17.5HD 135599 2006-04-06 1680 10.0 49.8 ... 4.6 32.2 50.5 <2.1 11.6 19.7HD 139006 2004-02-10 620 52.2 ... ... 39.3 ... ... 24.7 60.4 140.0HD 147584 2004-02-10 665 11.4 ... ... 9.7 25.3 ... <1.6 12.4 17.5HD 147584 2006-02-21 630 10.7 47.4 292.1 8.1 32.7 49.3 <1.6 12.0 23.7HD 165185f 2004-08-06 810 15.5 54.6 ... 13.0 36.2 56.1 7.8 16.8 25.3HD 165185 2006-06-27 1680 15.4 65.5 ... 12.5 47.4 67.2 <2.3 17.2 33.6HD 175742 2004-07-30 540 16.4 77.5 ... 12.9 33.1 88.9 <2.9 17.7 24.4HD 175742 2006-06-27 1680 15.1 70.0 ... 9.0 44.8 71.1 <2.9 16.8 26.8HD 217813g 2003-10-06 1146 23.3 ... ... 19.5 60.1 ... 12.9 25.0 39.3HIP 104383 2003-11-07 630 16.5 ... ... 12.5 35.5 ... <3.6 18.5 28.3
Notes. (1)Name of the target star. –(2) Epoch of exposure (average if several visits have been co-added, see below). –(3) On-target exposuretime (total exposure time on target if several visits have been co-added). –(4-12) lower limit on the separation of detectable objects for massesof 12, 20, and 35MJup and ages of 100 Myr, 500 Myr, and 1 Gyr, respectively. The relation of masses and magnitudes has been interpolated in theDUSTY00 and COND03 grids. Several targets have been observed repeatedly:(a) 2, 3, and 5 Sep 2004(b) 4 and 22 Nov 2003 and 4 Jan 2004(c) 22Nov 2003 and 11 Jan 2004(d) 22 Nov 2003, 10 and 15 Jan 2004(e) 4 and 22 Jul 2004(f) 4 Jul and 9 Sep 2004(g) 6 and 7 Oct 2003.
Table E.2. Apparent motion in right ascension and declination predicted for all stars with at least one candidate observed in two epochs.
star 1st epoch date 2nd epoch date ∆α cosδ [mas] ∆δ [mas]yyyy mm dd yyyy mm dd
HD 22049 2004-09-03 2005-12-23 -1734.94± 0.36 -155.21± 0.28HD 41593 2003-12-17 2005-11-08 -190.06± 1.40 -193.41± 0.81HD 60491 2003-12-26 2005-11-08 -128.10± 2.43 -72.76± 1.25HD 61606 2004-01-10 2005-11-08 185.25± 1.40 -499.95± 0.57HD 135599 2004-07-13 2006-04-06 398.45± 1.52 -255.43± 1.09HD 147584 2004-02-10 2006-02-21 410.33± 0.51 213.21± 0.88HD 165185 2004-08-06 2006-06-27 234.38± 1.17 12.16± 0.60HD 175742 2004-07-30 2006-06-27 276.77± 1.05 -537.13± 1.20
Notes.Based on proper motion and stellar parallactic motion measured byHipparcos (Tables A.1 and A.2). These numbers are used to identifynon-moving background stars next to the targets.

A&A–non_detect_v6.3.1_arXiv,Online Material p 24
0
20
40
60
80
100
0 2 4 6 8 10
mass[M
Jup]
angular separation [arcsec]
HD 26913 (2003-12-25)
HD 26913 (2005-12-06)
HD 26923 (2003-12-26)
HD 63433 (2004-01-15)
HD 175742 (2004-07-30)
HD 175742 (2006-06-27)
(a)
0
20
40
60
80
100
0 2 4 6 8 10
mass[M
Jup]
angular separation [arcsec]
HD 11131 (2004-07-22)
HD 11171 (2004-07-27)
HD 11171 (2006-08-03)
HD 139006 (2004-02-10)
(b)
0
20
40
60
80
100
0 2 4 6 8 10
mass[M
Jup]
angular separation [arcsec]
HD 60491 (2003-12-26)
HD 60491 (2005-11-08)
HD 125451 (2004-01-29)
HD 217813 (2003-10-06)
HIP 104383 (2003-11-07)
(c)
0
20
40
60
80
100
0 50 100 150 200
mass[M
Jup]
separation [au]
HD 26913 (2003-12-25)
HD 26913 (2005-12-06)
HD 26923 (2003-12-26)
HD 63433 (2004-01-15)
HD 175742 (2004-07-30)
HD 175742 (2006-06-27)
(d)
0
20
40
60
80
100
0 50 100 150 200 250
mass[M
Jup]
separation [au]
HD 11131 (2004-07-22)
HD 11171 (2004-07-27)
HD 11171 (2006-08-03)
HD 139006 (2004-02-10)
(e)
0
20
40
60
80
100
0 50 100 150 200 250 300
mass[M
Jup]
separation [au]
HD 60491 (2003-12-26)
HD 60491 (2005-11-08)
HD 125451 (2004-01-29)
HD 217813 (2003-10-06)
HIP 104383 (2003-11-07)
(f)
Fig. E.5. Same as in Fig. E.4 for the remaining objects.

A&A–non_detect_v6.3.1_arXiv,Online Material p 25
1