research paper assessment of power quality disturbance
TRANSCRIPT

International Journal of Research & Review (www.ijrrjournal.com) 57 Vol.6; Issue: 1; January 2019
International Journal of Research and Review www.ijrrjournal.com E-ISSN: 2349-9788; P-ISSN: 2454-2237
Research Paper
Assessment of Power Quality Disturbance Signals
Using Fractional Fourier Transform
Mithilesh Kumar Thakur1, Neeraj Kumar Kumawat
2
1P.G Scholar, Deptt. of Electrical Engg., YIT, Jaipur, Rajasthan, India
2Assistant Professor, Deptt. of Electrical Engg., YIT, Jaipur, Rajasthan, India
Corresponding Author: Neeraj Kumar Kumawat
ABSTRACT
In this paper disturbances like voltage sag, voltage swell and harmonics in power signal using
fractional Fourier transform methods are analyzed for different values of transform 0.1 to 1. We have
analyzed this algorithm in MATLAB simulation tool. This analysis is performed to find out the performance of this method on different types of disturbances. We have analyzed this to find out
maximum deviation in each disturbance.
Keywords – Fractional Fourier Transform, Sag, Swell, Harmonic, power quality.
INTRODUCTION
Power quality (PQ) has turned into a
big concern in the current years with the
growing utilization of non-linear loads,
power electronics based instruments etc.
Power quality concerns utility and
consumers similarly. Poor power quality
provides results such as; breakdowns,
instability, shortened life of the instrument
etc. Power quality disturbances such as;
voltage sag, voltage swell, momentary
interruption, notches, glitches, harmonic
distortions, transients etc. have become
normal in present power system. The
sources and reasons of such disturbances
must be known in order to enhance the
quality of the electric power. These power
quality disturbances are non-stationary in
nature and happen for short duration. IEEE
1159-2009 describes these disturbances in
terms of their magnitude, frequency content,
and duration. Quality of electric power is
generally degraded due to the occurrence of
disturbances like voltage sag, swell,
transients, interruption, harmonics and
flicker. These disturbances cause
malfunctioning of circuit breaker, failure of
end-user instrument and decay the
performance of transmission system
devices. Detection of the disturbances and
its source is important to install a mitigation
device for enhancing the power quality.
Most of the typical power analyzers do not
provide enough temporal information of the
disturbances. Therefore, the monitoring
device should be capable to identify and
classify the power quality disturbances. [1-2]
The signal processing methods frequently
implemented for parameter extraction
include fast Fourier transform (FFT), S-
transform (ST), Wavelet transform (WT),
empirical mode decomposition (EMD) and
Kalman filter. [3–6]
Good power quality (PQ)
is necessary for robust functioning of power
systems. Major reasons of power quality
degradation involve faults, capacitor
switching, load switching, solid state
switching instruments, arc furnaces, power
converters, and energised transformers.
These features increase the chances of
power quality disturbances (PQDs) like sag,
swell, transient, harmonics, notch,

Mithilesh Kumar Thakur et.al. Assessment of Power Quality Disturbance Signals Using Fractional Fourier
Transform
International Journal of Research & Review (www.ijrrjournal.com) 58 Vol.6; Issue: 1; January 2019
interruption, flicker and spikes. Literature [7]
provides the initial introduction to all the
power quality disturbances may occur in
power distribution scenario. Literature [8]
gives a survey of several distribution sites
and as a result provides various interesting
observations about the various types of
disturbance occurrence statistics which
involves computations that the majority of
the voltage sags in power signal have a
magnitude of around 80% and a time span
of around 4 to 10 cycles and that the total
harmonic distortion on harmonic
disturbances has value around 1.5 times the
normal value. Literatures [9–10]
propose the
features of wavelet transforms and their use
to situations equivalent to power quality
disturbance categorization. Poisson, P.
Rioual and M.Meunier [11]
proposed the
possibility of utilizing continuous wavelet
transform, Quadratic Transform and Multi-
resolution analysis for identification of the
disturbances. Olivier Poisson, Pascal
Rioual, and M.Meunier [12]
presented a
technique of using continuous wavelet
transforms to recognize and examine
voltage sags and transients. One more
interesting transform known as S-transform
which is an advancement of wavelet
transform is presented by P. K. Dash, B. K.
Panigrahi, and G. Panda. [13]
The S-
transform process had many promisingly
impressive time-frequency resolution
features.
Fractional Fourier Transform
Fractional Fourier transform (FRFT)
is a simple form of Fourier transform (FT).
It has been demonstrated to be one of the
most important equipment in non-stationary
signal processing methods. [14]
There has
been a vast research on the significant topics
connected with Fractional Fourier
Transform. [15-16]
One of the benefits for the
FRFT differentiated with the FT is that the
signal which is non-band limited in the
fourier transform domain may be band
limited in the fractional Fourier domain
(FRFD). Sampling theorem is an important
problem in signal processing. In the
sampling mechanism, the sampling rate
must fulfill the Nyquist sampling rate,
otherwise the spectrum aliasing will happen
and influence the performance of the signal
recovery and estimation. [15]
However, non-
uniform sampling usually occurs in practical
applications. The signal recovery and
spectral analysis from non-uniform
sampling sequence in the fractional fourier
transform have been researched in recent
years. [17-18]
Fourier Transform (FT) joins the
time domain and frequency domain, which
represents the signal frequency components
from the overall and is feasible to examine
the certainty and stability signal. To the
non-stability signal’s time-frequency
investigation, FT can map one dimensional
signal in time domain to two dimensional
signals in time-frequency domain, which
totally reflect the signal frequency
distribution feature as time varying. Fourier
transform is a linear operator, if which is
view as from time axis to frequency axis
through anticlockwise rotating the π/2, then
fractional fourier tranform operator can
rotate any angle. So fractional fourier
tranform can be considered as a generalized
FT. [19]
FRFT of p order is expressed as:
𝑋𝑝 𝑢 = 𝑥 𝑡 𝐾𝑝(𝑡,𝑢)𝑑𝑡∞
−∞
Where, Kp(t, u) is kernel function, which is defined as:
𝐾𝑝 𝑡, 𝑢 = (1 − 𝑗 cot𝛼)𝑒𝑗𝜋 𝑡
2 cot 𝛼 −2𝑢𝑡 cos 𝛼+𝑢2 cot 𝛼) 𝛼 ≠ 𝑛𝜋
𝛿 𝑡 − 𝑢 𝛼 = 2𝑛𝜋𝛿 𝑡 + 𝑢 𝛼 = (2𝑛 + 1)𝜋
PROPOSED METHOD
Mithilesh Kumar Thakur et.al. Assessment of Power Quality Disturbance Signals Using Fractional Fourier
Transform
International Journal of Research & Review (www.ijrrjournal.com) 59 Vol.6; Issue: 1; January 2019
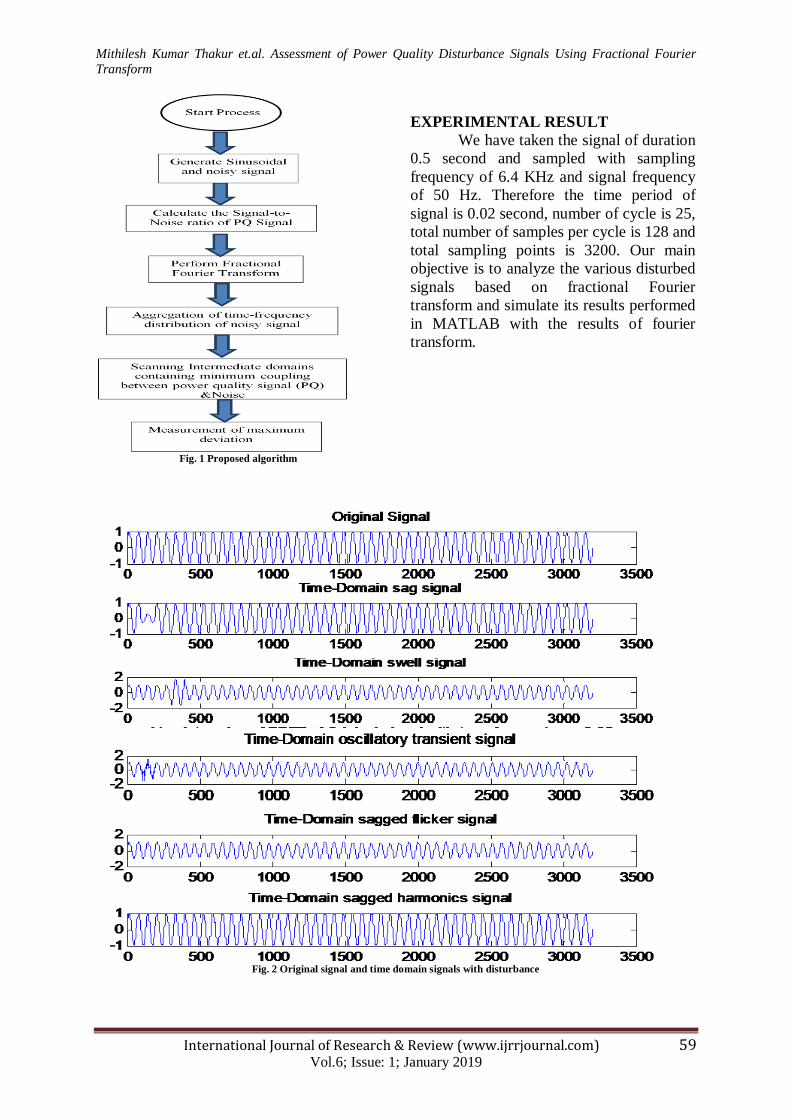
Fig. 1 Proposed algorithm
EXPERIMENTAL RESULT
We have taken the signal of duration
0.5 second and sampled with sampling
frequency of 6.4 KHz and signal frequency
of 50 Hz. Therefore the time period of
signal is 0.02 second, number of cycle is 25,
total number of samples per cycle is 128 and
total sampling points is 3200. Our main
objective is to analyze the various disturbed
signals based on fractional Fourier
transform and simulate its results performed
in MATLAB with the results of fourier
transform.
Fig. 2 Original signal and time domain signals with disturbance

Mithilesh Kumar Thakur et.al. Assessment of Power Quality Disturbance Signals Using Fractional Fourier
Transform
International Journal of Research & Review (www.ijrrjournal.com) 60 Vol.6; Issue: 1; January 2019
FRFT Analysis of Sag Signal

Mithilesh Kumar Thakur et.al. Assessment of Power Quality Disturbance Signals Using Fractional Fourier
Transform
International Journal of Research & Review (www.ijrrjournal.com) 61 Vol.6; Issue: 1; January 2019
Fig. 3 FRFT analysis of Sag signal according to different
transform order
FRFT Analysis of Swell Signal

Mithilesh Kumar Thakur et.al. Assessment of Power Quality Disturbance Signals Using Fractional Fourier
Transform
International Journal of Research & Review (www.ijrrjournal.com) 62 Vol.6; Issue: 1; January 2019

Mithilesh Kumar Thakur et.al. Assessment of Power Quality Disturbance Signals Using Fractional Fourier
Transform
International Journal of Research & Review (www.ijrrjournal.com) 63 Vol.6; Issue: 1; January 2019
Fig. 4 FRFT analysis of Swell signal according to different
transform order
FRFT Analysis of Transient Signal

Mithilesh Kumar Thakur et.al. Assessment of Power Quality Disturbance Signals Using Fractional Fourier
Transform
International Journal of Research & Review (www.ijrrjournal.com) 64 Vol.6; Issue: 1; January 2019
Fig. 5 FRFT analysis of Transient signal according to different
transform order

Mithilesh Kumar Thakur et.al. Assessment of Power Quality Disturbance Signals Using Fractional Fourier
Transform
International Journal of Research & Review (www.ijrrjournal.com) 65 Vol.6; Issue: 1; January 2019
Maximum Deviation for Different
Transform Order
Table 1: Maximum deviation for different transform order
S. No. Transform order Sag Swell Transient
1. 0.1 0.7428 0.3943 0.0991
2. 0.2 0.7449 0.3909 0.1000
3. 0.3 0.7294 0.3826 0.1014
4. 0.4 0.5611 0.3609 0.1029
5. 0.5 0.5781 0.3974 0.1036
6. 0.6 0.6366 0.4290 0.1009
7. 0.7 0.5867 0.4415 0.1129
8. 0.8 0.5703 0.4386 0.1701
9. 0.9 0.5941 0.4412 0.2469
10. 1.0 0.6078 0.4400 1.3303
CONCLUSION
In this Dissertation research work, a
new method based on Fractional Fourier
transform (FRFT) is proposed to detect the
power quality disturbances from the power
quality signal. I have considered some of the
disturbances like voltage sag, swell,
transient, flicker and harmonics. All the
simulations are carried out in MATLAB
simulation tool and performed by taking
different transform order. FRFT order
control provides flexibility to features under
noisy environment. Signal to noise ratio for
each power quality disturbance signal is
calculated.
Table 2 : Signal to noise ratio
Disturbance Signal Signal to noise ratio (dB)
Sag 1.5540
Swell 1.2136
Transient 2.1053
REFERENCES 1. IEEE Recommended Practice for
Monitoring Electric Power Quality, IEEE
Std. 1159-2009, 2009. 2. J. Milanovic, J. Meyer, R. Ball, and et al,
“International Industry Practice on Power-
Quality monitoring,” IEEE Trans. Power
Del., vol. 29, no. 2, pp. 934–941, 2014. 3. M. Kezunovic and Y. Liao, “A Novel
Software Implementation Concept for
Power Quality Study,” IEEE Trans. Power Del., vol. 17, no. 2, pp. 544–549, 2002.
4. M. Uyar, S. Yildirim, and M. T. Gencoglu,
“An effective wavelet-based feature extraction method for classification of
power quality disturbance signals,” Elect.
Power Syst. Res., vol. 78, no. 10, pp. 1747–
1755, 2008.
5. S. Shukla, S. Mishra, and B. Singh,
“Empirical-Mode Decomposition With Hilbert Transform for Power-Quality
Assessment,” IEEE Trans. Power Del., vol.
24, no. 4, pp. 2159–2165, 2009.
6. C.-Y. Lee and Y.-X. Shen, “Optimal Feature Selection for Power-Quality
Disturbances Classification,” IEEE Trans.
Power Del., vol. 26, no. 4, pp. 2342–2351, 2011.
7. IEEE Recommended Practice for
Monitoring Electric Power Quality, IEEE Inc., New York, USA, 1995.
8. E. W. Gunther and H. Mehta, “A survey of
distribution system power quality-
preliminary results,” IEEE Transactions on Power Delivery, vol. 10, no. 1, Jan. 1995,
pp. 322-329.
9. G. Beylkin, R. Coifman, I. Daubechies, S. G. Mallat, Y. Meyer, L. Raphael and M. B.
Ruskai, “Introduction to Wavelets”, Jones
and Bartlett, Boston, 1991. 10. A. Daubechies, “Ten Lectures on
Wavelets”, CBMS-NSF Regional
Conference Series in Applied Mathematics
for the Society for Industrial and Applied Mathematics, Philadelphia, 1992.
11. Oliver Poisson, Pascal Rioual and Michel
Meunier, “New Signal processing tools applied to power quality analysis”, IEEE
transactions on Power Delivery, vol. 14, no.
2, July 1999, pp. 324-327.
12. Oliver Poisson, Pascal Rioual and Michel Meunier, “Detection and Measurement of
Power quality disturbances using Wavelet
transform”, IEEE transactions on Power Delivery, vol. 15, no. 3, July 2000, pp. 214-
219.
13. P K Dash, B K Panigrahi and G Panda, “Power quality analysis using S transform”,
IEEE transactions on power delivery, vol.
18, no. 2, April 2003, pp. 23-29.
14. H. M. Ozaktas, Z. Zalevsky, and M. A. Kutay, “The fractional Fourier transform
with applications in optics and signal
processing”, New York: Wiley, 2001. 15. T. Erseghe, P. Kraniauskas, and G.
Cariolaro, ”Unified fractional Fourier
transform and sampling theorem,” IEEE Trans. Signal Process., vol. 47, no. 12, pp.
3419-3423, 1999.
16. R. Torres, P. Pellat-Finet, and Y. Torres,
“Fractional convolution, fractional correlation and their translation invariance

Mithilesh Kumar Thakur et.al. Assessment of Power Quality Disturbance Signals Using Fractional Fourier
Transform
International Journal of Research & Review (www.ijrrjournal.com) 66 Vol.6; Issue: 1; January 2019
properties,” Signal Process, vol. 90, no. 6,
pp. 1976-1984, 2010. 17. K. K. Sharma, ”Approximate signal
reconstruction using non-uniform samples
in fractional Fourier and linear canonical
transform domains,” IEEE Trans. Signal Process., vol. 57, no. 11, pp. 4573-4578,
Nov. 2009.
18. X. G. Xia, “On bandlimited signals with
fractional Fourier transform,” IEEE Signal Process. Lett., vol. 3, no. 3, pp. 72-74, Mar.
1996.
19. U. Borup, F. Blaabjerg, and P. N. Enjeti,
“Sharing of nonlinear load in parallel-connected three-phase converters”, IEEE
Trans. Ind. Appl., vol. 37, no. 6 (2001), pp.
1817–1823.
******
How to cite this article: Thakur MK, Kumawat NK. Assessment of power quality disturbance
signals using fractional fourier transform. International Journal of Research and Review. 2019;
6(1):57-66.