resolution ltd - results & strategy update fy 2013 · 2013 full year results & strategy...
TRANSCRIPT

Resolution Limited
2013 Full Year Results & Strategy Update18 March 2014

Board and Name Changes
2
Clive Cowdery and John Tiner to step down from the Board – restructuringcomplete, mid teens returns delivered
Structure of the Group is unchanged:Resolution Limited holds its investment in the Friends Life group through Resolution Holdco No.1 LP in which both Resolution Limited and RCAP GP Limited are partners. Resolution Limited has no other business.Resolution Holdco No.1 LP is a Guernsey registered limited partnership and is regulated in the UK as a Collective Investment Scheme. The purpose of Resolution Holdco No.1 LP is to generate returns for its partners. Resolution Limited acts as the general partner of Resolution Holdco No.1 LP.Resolution Limited’s board will keep the interests of both partners in mind as it considers the most appropriate strategy forgenerating returns
Quarterly partnership advisory committee established
Rename listed company to Friends Life Group Ltd – appropriate now to moveaway from a restructuring brand

Important notice
This presentation has been prepared by Resolution Limited for information purposes only and is the sole responsibility of Resolution Limited.
This presentation does not constitute of form part of an offer to sell or invitation to purchase any securities of Resolution Limited or any other entity or person, and no information set out orreferred to in this presentation is intended to form the basis of any contract of sale, investment decision or decision to purchase any securities in any entity or person.
Recipients of this presentation in jurisdictions outside the United Kingdom should inform themselves about and observe any applicable legal requirements in their jurisdictions. In particular,the distribution of this presentation may in certain jurisdictions be restricted by law. Failure to comply with any such restrictions and requirements may constitute a violation of the securitieslaws of any such jurisdiction. Accordingly, recipients represent that they are able to receive this presentation without contravention of any applicable legal or regulatory restrictions in thejurisdiction in which they reside or conduct business.
The merits or suitability of any securities of Resolution Limited must be determined independently by any recipient of this presentation on the basis of its own investigation and evaluation ofResolution Limited. Any such determination should involve, among other things, an assessment of the legal, tax, accounting, regulatory, financial, credit and other related aspects of thesecurities. Recipients are recommended to seek their own financial and other advice and should rely solely on their own judgment, review and analysis in evaluating Resolution Limited, itsbusiness and its affairs. Past performance is not indicative of future performance.
Statements in this presentation may constitute “forward-looking statements”. By their nature, forward-looking statements involve risks and uncertainties because they relate to events, anddepend upon circumstances, that may or may not occur in the future. Forward-looking statements are not guarantees of future performance. Resolution Limited’s actual performance(including the results of operations, internal rate of return, financial condition, liquidity and distributions to shareholders) may differ materially from the impression created by any forward-looking statements contained in this presentation. Such factors include, but are not limited to, future market conditions, including fluctuations in interest rates and exchange rates and thepotential for a sustained low-interest rate environment, and the performance of financial markets generally; the policies and actions of regulatory authorities, including, for example, newgovernment initiatives related to the financial crisis and the effect of the European Union’s ‘Solvency II’ requirements on Resolution Limited’s capital maintenance requirements; the impact ofcompetition, economic growth, inflation, and deflation; experience in particular with regard to mortality and morbidity trends, lapse rates and policy renewal rates; the timing, impact and otheruncertainties of future acquisitions or combinations within relevant industries; the impact of changes in capital, solvency standards accounting standards or relevant regulatory frameworks,and tax and other legislation and regulations in the jurisdictions in which Resolution Limited and its affiliates operate; and the impact of legal actions and disputes. Any forward-lookingstatements in this presentation are current only as of the date of this presentation, and Resolution Limited undertakes no obligation to update any such forward-looking statements. Nothing inthis announcement should be construed as a profit forecast.
For the purposes of this notice, “presentation” shall mean and include the slides that follow, any oral presentation of the slides, any question-and-answer session that follows any such oralpresentation, hard copies of this document and any materials distributed at, or in connection with, any such oral presentation.
3
Today’s Key MessagesAndy Briggs

Today’s key messagesRestructuring and turnaround complete
1. 2010 figures are annualised baseline for the most relevant products, as the divisional structure did not exist at that time2. Assumes dividends reinvested in Resolution Limited shares
<100
331
0
100
200
300
400
2010 2013
£m
(10)1
184
-50
0
50
100
150
200
2010 2013
£m
Cash tomorrow - UK VNB
Cash today - SFS
Shareholder value progression
3.4
5.0
1.0
0
1
2
3
4
5
6
7
31-Dec-10 31-Dec-13
£bn
Market Cap Dividends & 2011 Buyback
Total return annual
equivalent 24%2
Strong base and distinctive capabilities built for profitable growth
5

Today’s key messagesFriends Life strategy
Attractive growth markets, with scale and competitive advantage, to drive cash and returns for shareholders
Where we play
Our markets
Friends Life is a leading scale player in the UK Life & Pensions market, primarily focused on: • Legacy products• Fast growing retirement market
Strong financially disciplined team building distinctive capabilities and competitive advantage• Strategic partnership with Schroders
How we deliver cash and
returns
Our shareholders
Our distinctive capabilities
How we win
Growing cash generation demonstrates sustainable and growing franchise• UK and Heritage in force return in 2014 estimated to be
c.£40m higher than 2013
6

Agenda
Item Presenter
Today’s key messages Andy Briggs
2013 results Tim Tookey
Friends Life Group strategy• Where we play• How we win:
– Heritage, including investment management– UK
• How we deliver cash and returns: Financial framework
Andy Briggs
Jonathan MossJohn Van Der WielenTim Tookey
Summary Andy Briggs
Q&A
7

2013 ResultsTim Tookey

2013 financial highlights
Sustainable free surplus of £331m, up 10%
UK division; VNB up 30% with investment in new business down 8%, IRR increased to 15.3%
Group IFRS based operating profit before tax of £436m, up 59%
Group MCEV operating profit before tax of £489m, up 28%
Operating performance
2013 targets
Capital position and
dividend
Strong 2013 operating
performance
Delivered majority of 2013 targets
2013 cost savings target delivered
Successful delivery of key 2013 financial targets
International dividends of £33m received
Transformational change programmes delivered
Robust and low risk balance sheet
Strong capital base maintained
IGCA surplus of £2.2bn (coverage ratio of 238%)
Estimated economic capital surplus of £3.9bn (coverage ratio of 193%)
Final 2013 dividend of 14.09 pence per share (full year 21.14 pence)
9

2013 financial highlightsStrong profitable base for future growth
Sustainable free surplus, £m IFRS based operating profit, £m MCEV operating profit, £m
Free surplus expected return, £m Group operating expenses1, £m Group IGCA surplus, £bn
FY 2013
331
FY 2012
300+10%
FY 2013
436
FY 2012
274 +59%
FY 2013
489
FY 2012
382
+28%
584-5%
FY 2013FY 2012
612
FY 2013
2.2
FY 2012
2.2682+2%
FY 2013FY 2012
668221% 238% Coverage
ratio
19.84p 31.03p Earnings per share
1. Operating expenses include acquisition, maintenance and corporate expenses only.
10

£m FY 2012 FY 2013
Expected return from in-force business 668 682
Investment in new business (285) (213)
Development costs (38) (41)
Coupon on debt (85) (92)
260 336
Operating experience variances (31) 25
Other operating variances 86 2
Other income and charges (15) (32)
Sustainable free surplus 300 331
Sustainable free surplusNew business efficiency driving sustainable growth
Sustainable free surplus Driver of performance
Sour
ces
Use
sVa
rianc
es /
othe
r
+10%
-25%
Expected return growth achieved for the first time
Financial discipline driving reduced cost of new business
Variances/other contribute net £(5)m, in line with goal to achieve close to net nil average through the cycle
10% growth underpinned by higher quality of earnings
+2%
11

Sustainable free surplus contributionStrong growth driven by underlying performance
Heritage division, £m UK division, £m
International division, £m Corporate, £m
431489
FY 2013FY 2012
(40)(66)
FY 2013FY 2012
(28)
FY 2012
40
FY 2013
(95)
FY 2012
(100)
FY 2013
2% growth in free surplus emergence
Investment in new business down 45%
2012 result includes +£96m variances/other items (2013: +£26m)
Growing in-force book driving surplus generation
Investment in new business down 8%
£(22)m loss from Sesame due to remediation provision
Non-core exits driving a 31% reduction in the cost of new business
Non-core business to be transferred to Heritage
Increased finance costs following debt restructure in 2012
12
UK division surplus up principally reflecting surplus from 2012 new business growth
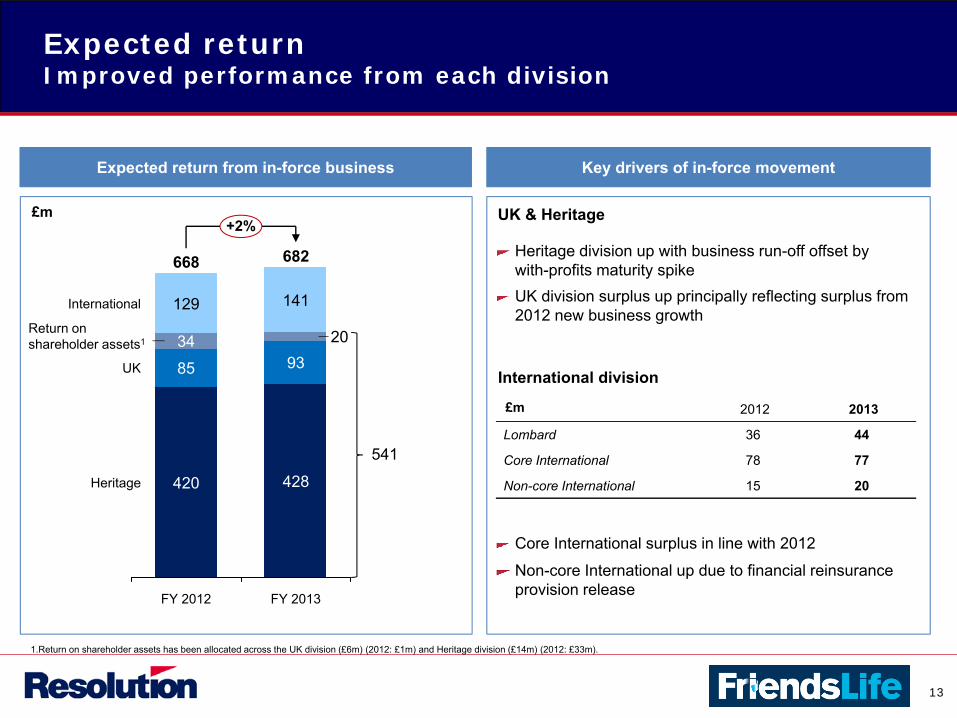
Expected returnImproved performance from each division
Expected return from in-force business
682
UK
428Heritage
International
FY 2013
9320
141
FY 2012
668
420
85
34
129
+2%
Key drivers of in-force movement
Heritage division up with business run-off offset by with-profits maturity spike
UK & Heritage
International division
£m
£m 2012 2013
Lombard 36 44
Core International 78 77
Non-core International 15 20
Core International surplus in line with 2012
Non-core International up due to financial reinsurance provision release
Return on shareholder assets1
541
1.Return on shareholder assets has been allocated across the UK division (£6m) (2012: £1m) and Heritage division (£14m) (2012: £33m).
13

UK & Heritage expected returnDriving increased confidence in the future
Undiscounted free surplus emergence
Surplus improvements, split evenly between UK and Heritage divisions, more than offsetting natural run-off
UK division growth driven by new business contribution
Benefits from Heritage revenue optimisation initiatives, including with-profits annuity reallocation and FLI asset recaptures, supported by economic factors
1.Based on management estimates and expectations (unaudited).
£m
Principal drivers of increasing free surplus emergence profile
600
500
400
300
200
100
0
+£39m
202320222021202020192018201720162015201420132012
Actual expected return
Run-off profile provided in 2012 (updated to include return on shareholder assets)1
Run-off profile provided in 20131
14

Investment in new businessIncreased new business profitability at lower cost
APE, £m
FY 2013 Target
15%+
FY 2013
15.3%1
FY 2012
10.4%
FY 2011
10.0%
VNB, £m
IRR
UK
Heritage
Core Int’l
Non-core Int’l
Lombard
∆
8%
-47%
-13%
-75%
-17%
Group investment in new business Group new business metrics
∆
30%
n/a
24%
-42%
-44%
(107) (62)(22)
(39)
(39)
(106)
(98)
(55)
(30)
(24)
(218)Heritage
UK
Core Int’l
Non-core Int’l
Lombard
FY 2013
(213)
FY 2012
(285)
(23)
FY 2011
(325)
1,210 1,211 1,117
151 194 204
UK
Heritage
Core Int’l
Non-core Int’l
Lombard
£m £m
724
54
127
14
198
£m
184
(19)
21
(7)
25
Int’lTotal
UK & HeritageTotal
-25%
1. Includes the benefit of discretionary investment of shareholder assets in the with-profits annuity reallocation.
15

UK division new business profitabilityStrong performance reflects financial discipline
+30%
FY 2013
184
75
26
83
FY 2012
142
62
21
59
FY 2011
63
1615
32
33
FY 2010 (baseline)
(10)
(23)
(20)
£m
+1.2
10%+8.4%7.2%8.3%
FY 2013 Target
20%
FY 2013
13.8%
FY 2012
13.8%
FY 2011
5.5%
Growth in UK division VNB New business IRR
New business margin %1
3.8% 4.5%
1. Pre-tax VNB / PVNBP.
15%+>25%>25%22%
+2.0
FY 2013
15.3%
FY 2012
13.3%
FY 2011
8.4%
Corporate Benefits
Protection
Retirement Income
Total UK division
Protection
CorporateBenefits
RetirementIncome
FY 2013 Target
155
80
25
50
+19%
Target outperformance
2.1%
16

Lombard and Core InternationalPerformance impacted by challenging market environment
New business Highlights
Continued discipline on the business we write
Improving efficiency of the back office operations
Deploying more resources into Asia
Challenges remain in certain markets for Lombard
Some Lombard performance disruption due to potential disposal
FY 2013FY 2012
Core Int’l
Lombard
2125
17
45
VNB, £m
238 198146 127Core Int’l
Lombard
FY 2013FY 2012
APE, £m
IRR
Momentum
Core InternationalImproved VNB but competitive pressures remain
Reduced APE includes closure to the Japanese market
LombardChallenging market environment and uncertainty impacting Q4 sales
FY 2012 FY 2013
22.5% 13.3%
11.0% 11.0%
Lombard
Core Int’l
17

IFRS based operating profitDelivering strong growth
£m FY 2012 FY 2013
In-force surplus 550 541
Expected return on shareholder assets1 78 51
Finance costs1 (101) (120)
New business strain (142) (97)
Development costs (50) (50)
Principal reserving changes & one-offs (23) 164
Other income and charges (38) (53)
IFRS based operating profit before tax 274 436
Oth
erSo
urce
s
1. Expected return on shareholder assets less finance costs is equivalent to long-term investment return.
Group IFRS based operating profit IFRS based operating profit contribution
Use
s
332 291
136(9)
Heritage division, £m
Corporate, £m
(31)(17)+59%
-32%
FY 2012 FY 2013
(32) 40
UK division, £m
International division, £m
18

+28%
MCEV operating profitStrong growth despite reduced economic returns
£m FY 2012 FY 2013
Value of new business 194 204
Expected existing business contribution 325 248
Operating experience variances (56) (57)
Other operating variances 27 82
With-profits annuity reallocation - 96
Operating assumption changes (9) 19
Development costs (50) (50)
Other income and charges (49) (53)
MCEV operating profit before tax 382 489
359 393
111
Heritage division, £m
International division, £m
Corporate, £m
(121) (107)
FY 2013FY 2012
Group MCEV operating profit MCEV operating profit contribution
-24%
143 192
UK division, £m
+5%
19

Return on embedded valuec.2.0% drag due to lower rates of return since target set in 2010
ROEV annual progression1 Impact on operating embedded value returns
2011 2013
c.9.2%
2010 baseline
2012
5.5%7.2%
5.1%
c.2.0%
6.5%
1. Measured at an FLG level. 2. Return on corporate bonds varies by portfolio, the rates shown are an indicative weighted average. 3. Rates applied to debt commitments are equivalent to the cash/gilt return plus spread on Group debt. 4. Expected return for property is 1% lower than equity.
Rates (%) EquityCorporate
bonds2Cash/Gilts (Risk free) Debt3∆
2010 7.30 3.35 1.01 5.90
2013 4.90 2.25 0.67 4.70
∆ (2.40) (1.10) (0.34) (1.20)
Impact on ROEV 2013 v 2010 (%) c.(1.0) c.(0.7) c.(0.5) c.0.2 c.(2.0)%
Rates (%) EquityCorporate
bonds2Cash/Gilts (Risk free) Debt3∆
2014 6.10 1.85 0.71 3.94
Cash and gilt bond rates remain significantly below normal levels for 2014
2014 equity and property expected returns will reflect the benefit of improving 10 year risk-free returns4
20

Capital and cashPerformance underpinned by strong capital position
2.2
1.61.8
2.2
FY 2013
3.81
IGCAsurplus
Group capital resources requirement(excluding WPICC)
FY 2012
4.01
Coverage ratio221%
1. Total capital is the sum of IGCA surplus and Group capital resource requirements (excluding WPICC); coverage ratio also excludes WPICC; 2013 WPICC: £4.2bn (2012: £3.4bn). 2013 surplus is before payment of £200 million dividend to shareholders 2. of which one third is assumed to be defaults 3. includes a 30% fall in property markets 4. Estimated unaudited position
£bn
IGCA surplus and sensitivities to market movements
200 bps increase in corporate bond spreads2 (0.6)
200 bps fall in interest rates across the yield curve
(0.2)
40% fall in equitymarkets3 (0.2)
IGCA surplus sensitivities to market movements, £bn
Strong capital position
Estimated IGCA surplus of £2.2bn
Capital base remains resilient to market movements
Estimated economic capital surplus of £3.9bn4
(coverage ratio of 193%)
Cash and dividends
Available shareholder assets of £917m
Total dividends received by Group holding companies of £383m for the year
Includes International dividends of £33m
238%
21

2013 report card
Commitment CommentaryStatus
£80m, £(30)m, 20%
£25m, £(75)m, 10%+
£50m, n/a, 15%+
15%+
20% (Lombard and Core Int’l)
All business on target platforms
15.3% delivered in 2013
Competitive challenges in Europe and Asia
£155mVNB
£75m 13.8%
-£m, £m, %
12.0%
£400m from sustainable sources Timescale extended due to economic headwinds
£331m
£200m reduction by 2013 £251m reduction delivered
£33m for 2013 (due spring 2014)
£126m of cost reductions
£160m of cost reductions
10%+ in the medium term
IRR constrained by AE margins
£129m reduction delivered
£33m paid
Fully secured
Timescale extended due to economic headwinds
7.2%
8.4%
Targets met
Protection
Corporate Benefits
VNB, (NBS), IRR
UK
Group total
£m, £m, %
UK & Heritage new business strain
2013
Cash dividend from International
Med
ium
term
FLG operating ROEV
FLG cash generation
UK & Heritage cost reductions
UK & Heritage cost reduction
Retirement Income
International
22

2013 results key messagesWe have a strong platform for the future
Summary
Restructuring phase now complete
Strong cash generation growth being achieved
Improving returns reflecting financial discipline and delivery of Heritage activities
Strong capital base maintained
Strong platform from which to deliver our growth ambitions
23
Friends Life Group strategy- Where we play
Andy Briggs
25
How we deliver cash and returns
Our shareholders
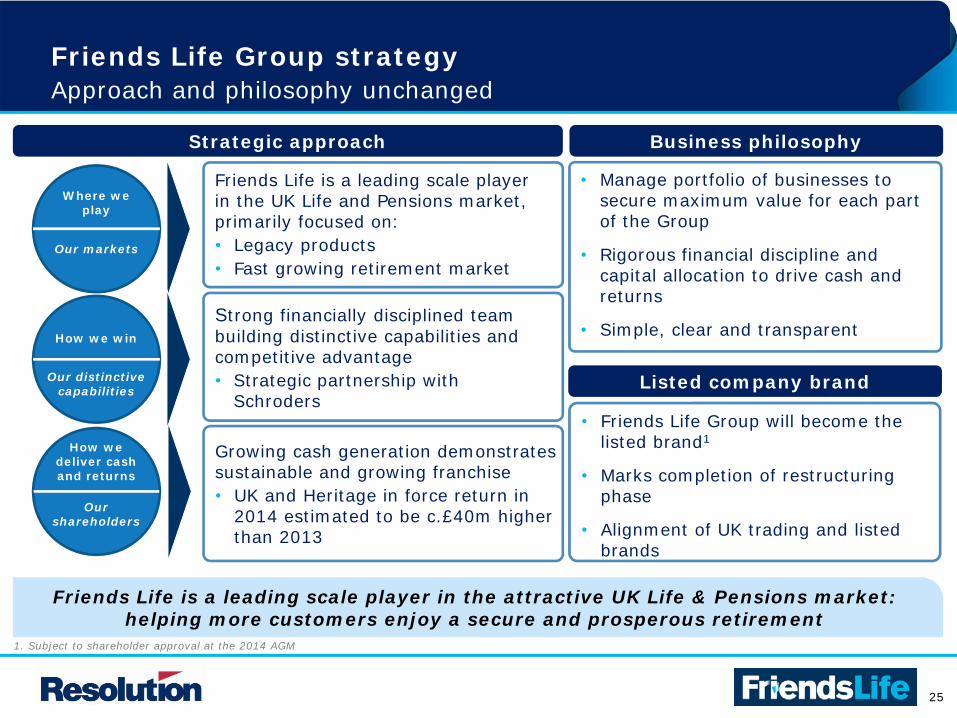
Friends Life Group strategyApproach and philosophy unchanged
• Manage portfolio of businesses to secure maximum value for each part of the Group
• Rigorous financial discipline and capital allocation to drive cash and returns
• Simple, clear and transparent
1. Subject to shareholder approval at the 2014 AGM
• Friends Life Group will become the listed brand1
• Marks completion of restructuring phase
• Alignment of UK trading and listed brands
Friends Life is a leading scale player in the UK Life and Pensions market, primarily focused on: • Legacy products• Fast growing retirement market
Strong financially disciplined team building distinctive capabilities and competitive advantage• Strategic partnership with
Schroders
Growing cash generation demonstrates sustainable and growing franchise• UK and Heritage in force return in
2014 estimated to be c.£40m higher than 2013
Where we play
Our markets
Our distinctive capabilities
How we win
25
Friends Life is a leading scale player in the attractive UK Life & Pensions market: helping more customers enjoy a secure and prosperous retirement
Strategic approach Business philosophy
Listed company brand

26
International strategy Update
• Core focus is unit linked products for global expatriates and domestic affluent customers in Asia and the Middle East
• Significant investment to re-platform
– Enhanced standalone capability and opportunities for organic growth
• Dividends of £20m received
• Process for potential sale ongoing
• Difficult trading in Q4 due to challenging market environment and impact of leak of sale process
• Dividends of £13m received
• All significant non-core exits completed in 2013
– Sold AmLife stake in 2013, proceeds repatriated to Group
– Exited / closed unprofitable and high risk business lines e.g. Corporate Pensions, Japanese nationals
– Withdrew from the sale of new products in Germany
Strong delivery against November 2012 strategy, and securing opportunities for further, incremental value
26
LombardFPI Non-core

27
Time
Cu
sto
mer
Ass
ets
Where we playUK Life and Pensions in the next decade
ProtectionNew business APE: £1.1bn 1.7x
Individual wealthAUA: £810bn 2.0x
Legacy productsAUA: £410bn 0.7x
1. Estimated 2013 and 2014 market sizes and flows are taken from Oliver Wyman, 2014. All market sizes are shown as estimated December 2013 AUA, with the exception of protection (estimated 2013 new business APE) and retirement income (estimated 2013 new business premium volumes). Majority of individual wealth and defined benefit markets are not in life and pensions products, figure provided to support holistic view of related markets. Workplace savings growth estimate excludes NEST.
Workplace savingsAUA: £350bn 3.5x
Indicates market size in 10 years
Defined benefitAUA: £1,140bn 1.0x
27
Retirement incomePremium: £23bn 3.3x
CAGR:
13%
CAGR:
12%
Two main parts of the UK Life and Pensions market1:• Legacy products - with drivers for consolidation• Fast growing retirement market – driven by DB to DC shift and auto-enrolment

28
Where we playScale player in both main parts of UK Life and Pensions market
• Leading scale player with £68bn AUA
• Dedicated team and management expertise
Heritage
• 1 in 9 retiring DC pension customers with us1
• Entry to open market and considering bulks
Retirement income
• Top 2 with £20bn AUA
• Cash positive in 2013
Corporate benefits
• Top 5 by sales volume
• 2 million customers with protection policies2
Protection
• Schroders strategic partnership
• FLI £19bn AUM3
• CRE & infrastructure mandates: £0.5bn each
Investment management
Protection
Customer assets
Time
Heritage
Investment management capability
RetirementincomeIndividual wealth
Corporate benefits
Defined benefit
1. Estimated based on 50,000 Friends Life vesting pensions customers and ABI policy sales data for market size2. Individual protection across Group; approximately 1.8m individual protection customers in Heritage 3. Pro-forma based on 31 December 2013 assets after transfer planned for 2014
28

29
29
Where we playFuture opportunities
Protection
Corporate benefits
Heritage
Retirement income
Transition to
retirement
Customer recruitment
Early life
stage
At retirement life stage
Mid life stage
• Strong customer recruitment and retention
• Significant transition to retirement opportunity
• Potential additional benefit of legacy book consolidation
Customer assets
Time

30
30
How we win Our distinctive capabilities and competitive advantage
Customer management
Cost management
Capital, pricing & underwriting
Investment management
Customer service & engagement
Customer propositions
Cost & supplier management Cost efficiency
Capital & risk management
Pricing & underwriting
Investment management capability
Group-wide Heritage UK

Friends Life Group strategy- How we win: Heritage, including investment management
Jonathan Moss

32
32
How we win: Heritage Our strengths and track record
Customer service &
engagement
Cost & supplier management
Capital & risk management
Investment management
capability
• 3.8m Heritage customers, managed through cost-efficient outsourcers
• Cost synergies of £160m secured
• Strategic partnership with Schroders
• £19bn in-house fixed income asset manager1
• Delivery of £291m capital synergies
Continue to apply rigorous financial discipline to all opportunities and risks
1. Pro-forma FLI assets as at 31 December 2013 after planned 2014 transfer
Capabilities Evidence of delivery

33
• Fund by fund analysis
• Deep understanding of assets and liabilities
• Achieve value by understanding risk exposure and hedging
• Manage risk within capital management policy to stabilise cash generation
Additional free surplus released due to COP 2011-131, £m
ASLAS
WLUK
ASL
BHA
FPLP
FPP
FPLAL
UK businesses acquired End 2013
FLL
FLP
Mainly Heritage
Mainly UK division
1. Includes benefit of deauthorisation of FLWL and FLC in Feb 2014 in 2013
How we win: HeritageCapital and risk management
181
291
101
9
2011 2012 2013 Total
Capital and liability optimisation programme (COP) 2011-13 complete
33
Significantly de-risked business with more stable cash generation
Risk management
34
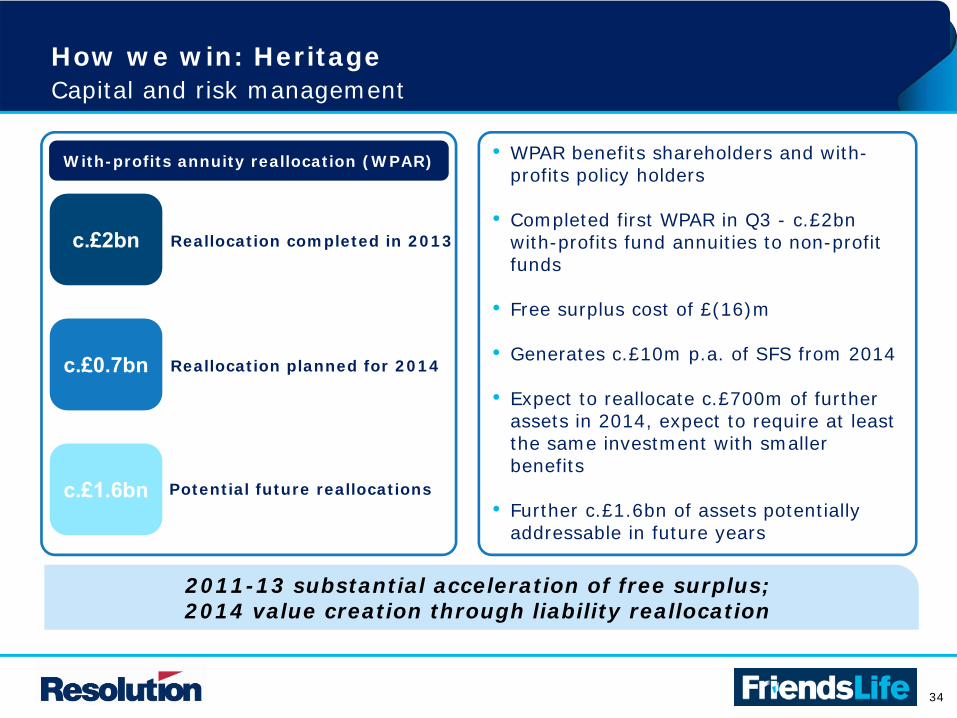
• WPAR benefits shareholders and with-profits policy holders
• Completed first WPAR in Q3 - c.£2bn with-profits fund annuities to non-profit funds
• Free surplus cost of £(16)m
• Generates c.£10m p.a. of SFS from 2014
• Expect to reallocate c.£700m of further assets in 2014, expect to require at least the same investment with smaller benefits
• Further c.£1.6bn of assets potentially addressable in future years
c.£1.6bn Potential future reallocations
c.£0.7bn Reallocation planned for 2014
c.£2bn Reallocation completed in 2013
How we win: HeritageCapital and risk management
With-profits annuity reallocation (WPAR)
34
2011-13 substantial acceleration of free surplus; 2014 value creation through liability reallocation

35
19
53
34
142
• Major new strategic partnership
• Customer access to leading asset management brand
• Significant competitive advantage, and future potential
• Specialist asset managers benefiting annuity customers
• Commercial Real Estate3 and Infrastructure mandates and £75m Drax loan
35
How we win: Heritage Investment management: best of breed model
Schroders
FLI
Specialist mandates
AXA IM
Open architecture
1. Pro-forma AUA as at 1 January 2014, post-implementation of planned Schroders, FLI, CRE and infrastructure asset transfers; 2. £2bn assets already placed with Schroders with additional £12bn now announced; 3. Agreement with Pramerica Investment Management, LLC through Pricoa Mortgage Capital
Total Group AUA1 and shareholder assets
by IM, £bn
• Open architecture supports customer propositions
• Broad customer choice – c.100 managers
1
• In-house fixed interest expertise, core skills in rates and credit
• FLI recaptures additional £2bn of assets bringing pro-forma total to £19bn

Friends Life Group strategy- How we win: UK
John Van Der Wielen

37
Customer propositions
Cost efficiency
Pricing & underwriting
Investment management
capability
37
How we win: UK Deploying key capabilities in attractive growth markets
37
Evidence of delivery
10-year growth3.5x
• Auto enrolment drives AUA growth
• Well placed as number 2 by size
• Strong investment proposition
• Largely fixed, efficient cost base
Strong cash growth
• c.£10m p.a. over last 2 years
Corporate benefits
10-year growth 1.7x
• Cost-efficient platform
• Value over volume
• Strong ties with IFAs and estate agents
• Top 5 by sales volume
Strong VNB growth
• £75m in 2013 from £16m in 2011
Protection
10-year growth 3.3x
• 1 in 9 retiring DC pensions customers
• Significant capability built
• Positive open market launch
• Considering bulk annuity market opportunity
Strong VNB growth
• VNB growth of 150% since 2010
Retirement income
38
38
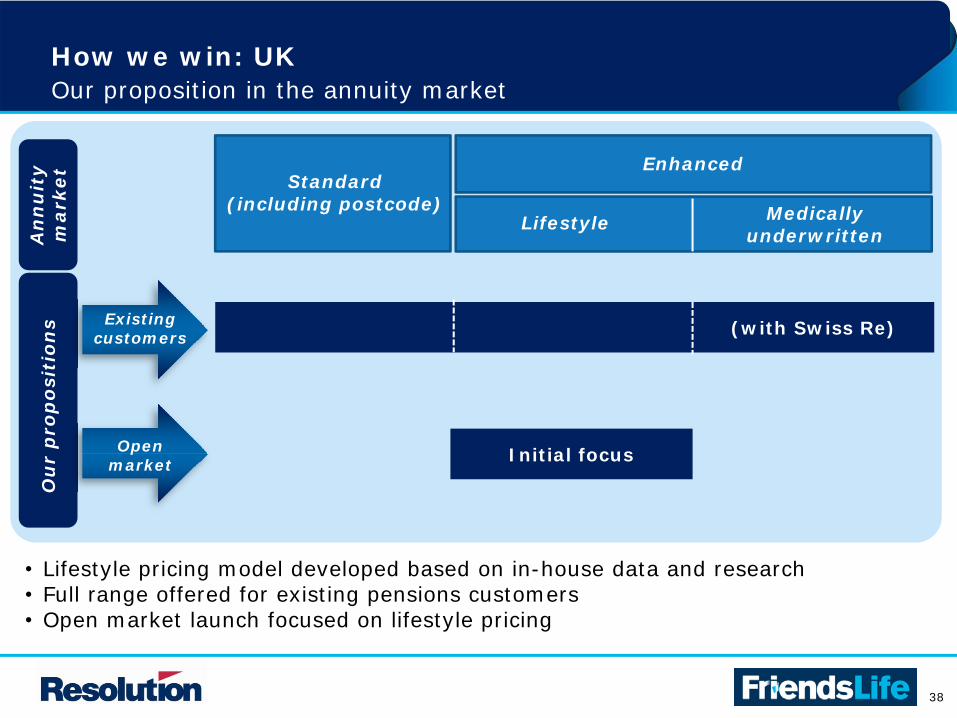
How we win: UKOur proposition in the annuity market
Lifestyle Medically underwritten
Initial focus
• Lifestyle pricing model developed based on in-house data and research• Full range offered for existing pensions customers• Open market launch focused on lifestyle pricing
Enhanced
(with Swiss Re)
Standard(including postcode)
An
nu
ity
mark
et
Ou
r p
rop
osi
tio
ns Existing
customers
Open market

39
Expected retirement
date
39
How we win: UKTransition to retirement – customer-led opportunities
2010
Now
25% of vesting pensions stay with Friends Life
8 weeks
8 weeks
6 months
• Warm up pack• Phone follow-up
• Improved information pack
• Better rates• Enhanced offering
We have significantly improved the retirement process for customers...
...but there is scope to do much more
34% of vesting pensions stay with Friends Life
• Telephone guidance
• Shopping around referral (KRS)
• Basic information pack
6 months
• Warm up pack
• Engagement with deferring retirees

Friends Life Group strategy- How we deliver cash and returns:
Financial Framework
Tim Tookey

41
41
Using our framework to measure cash and returns
Where we play
Our markets
How we deliver cash and returns
Our shareholders
Our distinctive capabilities
How we win
Framework
Capital Cash today Cash tomorrow
Returns
Strategic approach
How we deliver cash and returns
Our shareholders

42
Insurance
42
Presenting our business increasingly as we manage it
Heritage
Protection
CorporateBenefits
RetirementIncome
Lombard
FPI
Asset-based
Framework
Capital Cash today Cash tomorrow
Returns
Our businesses... ...two business characteristics... ...one financial framework
Developing clearer links between business drivers and performance

43
• Solvency II founded on economic capital
• Commencing migration to Solvency II from a strong capital position
• Preparations for Solvency II well advanced
• Expect IMAP submission during 2016 for approval by end 2016
IGCA surplus
Economic capital
ASA
43
Strong capital base – a prerequisite for high performanceStrength to be maintained across all measures, at all times
1. CMP is the Capital Management Policy
Solvency II
IGCA
Economic capital
Transitioning to Solvency IICurrent reporting
100%
£2.2bn
CMP1 150%
238%
160%
100%
£3.9bn193%
CMP1 125%
£917m
Prudence buffer: £325m
Final dividend: £200m

44
44
Shareholder assets
£917m
Available shareholder assets
£9.3bn1
Annuities
Shareholder assets Now
100% cash
• Looking to invest a proportion (up to £0.2bn) of available shareholder assets in assets with higher expected risk-adjusted returns
• Prudence and dividend buffers to be held in cash and gilts
• Targeting an allocation with an overall higher yield for new business:
– Shift in mix towards c.30% BBB including increased diversification to illiquid asset types
• £1bn allocated to commercial real estate and infrastructure loans
• Boosting capability in Friends Life Investments to widen available asset universe e.g. US credit market
• Move back-book towards new business strategy in time
Future direction
1. Excludes £1.6bn reinsurance asset 2. Gilts include supranational bond exposures
Note: Analysis excludes cash assets
Increased investment risk appetite allows generation of higher returns
14%
Other2%
19%
BBB
36%
A
18%AA
Gilts2
11%AAA

45
45
Cash today – SFS remains a principal measure
Investment in new business
Underlying free surplus
Development costs
Debt coupon
Operating variances and
other
Sustainable free surplus
Expected return from in-force
business
Greater analysis to be provided across business lines
682
(213)
469
(41)
(92)
(5)
331
1. Other principally includes movements on required capital, non-unit reserves and regulatory DAC (in Lombard)
Enhanced analysis of asset-based businesses
Income
Outgoings
Other1
INB
Expected return
579
(141)
249
(204)
(14)
438 31Subtotal
110
(94)
(5)
11
30
(44)
(14)
10
(6)
4
Corporate Benefits
LombardProt.Ret.
Income
139
(110)
(9)
20
442
(30)
FPI
Insurance Asset-based
Subtotal
97
(61)
Heritage
36412

46
Primary reporting metric Secondary reporting metric
-
-
-
-
46
Cash tomorrowImproving the relevance of our performance metrics
INB
IRR
Income bps
Outgoings bps
VNB
Net fund flows
Insurance
Regular premiums
Asset-basedMetric
Insu
ran
ce
bu
sin
ess
es
Ass
et-
base
d
bu
sin
ess
es
Improved transparency on
the levers of value

47
Metric
Asset-based businesses
2013
Asset-based businesses
20122013 v 2012
Performance ambitions
(0.2) 1.2 (1.4) +ve and growing
1,760 1,680 +5% Growing
68 68Leverage +6bps
+ve operating leverage
(56) (62)
Metric
Insurance businesses
2013
Asset-based businesses
2013Group 2013
Group 2012
2013 v 2012
Performance ambitions
153 51 204 194 +5% Group VNB +10%
18.11 9.7 15.32 10.4 +4.9pp 15%+
(141) (72) (213) (285) (25)% Disciplined
Cash tomorrowClear ambitions for future growth established
INB (£m)
IRR (%)
VNB (£m)
Insu
ran
ce
1. IRR for open insurance businesses 2. Includes the impact of with-profits annuity reallocation
(open insurance business)
Income (bps)
Outgoings (bps)
Net fund flows (£bn)
Regular premiums (£m)
Ass
et-
base
d
47

48
48
Returns metrics – now includes a ‘cash returns’ lensA stronger indicator of financial discipline and cash focus
SFSSNW1
=Sustainable earnings post tax, post
debt, post capital
Good proxy for shareholder owned tangible assets
1. Shareholders Net Worth (“SNW”) is free surplus and required capital (net of external debt), i.e. MCEV excluding VIF . The SNW is adjusted to reflect the in-period impacts of dividend payments and other capital movements.
• ROEV impacted by some factors
outside management control such
as economics
• 10% achievable but requires
increase in asset returns (i.e. risk
free rates)
• Growth constrained by high
proportion of Heritage book relative
to open business
Return on embedded value Cash return
14.2%
2011 2013 Target
>25%22.8%
16.3%
2012
SFS 291 300 331
SNW1 2,048 1,841 1,453
(£m)
49
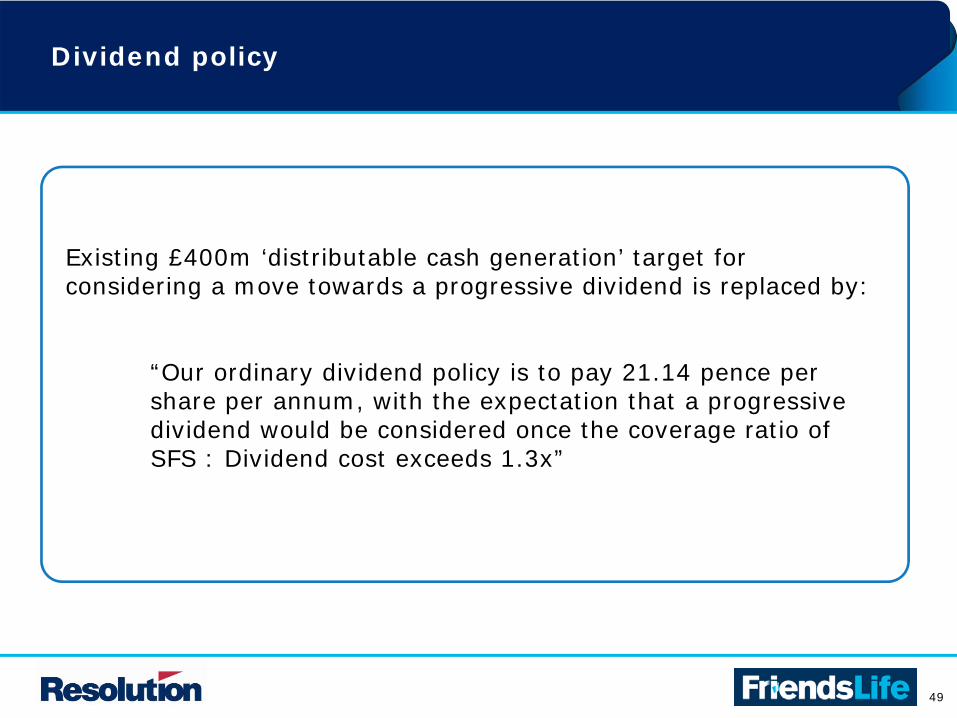
Existing £400m ‘distributable cash generation’ target for considering a move towards a progressive dividend is replaced by:
“Our ordinary dividend policy is to pay 21.14 pence per share per annum, with the expectation that a progressive dividend would be considered once the coverage ratio of SFS : Dividend cost exceeds 1.3x”
49
Dividend policy

50
Returns
• Positive operating leverage on asset-based business
• Growing free surplus generation from insurance business
• SFS dividend cover of >1.3x
Cash tomorrow
Cash today
Capital
50
Confidence in our returns generating capabilities
Framework
Capital Cash today Cash tomorrow
Returns
• Maintain a strong capital base, on each measure, at all times
• Group VNB growth of 10% p.a.• 15% IRR from open insurance business
• ‘Cash return’ above 25%
Performance ambitions
Summary
Andy Briggs

52
52
How we deliver cash and returns
Delivery evidenced by c.£40m increase in UK and Heritage estimated in force return in 2014
Expected Heritage run-off
Heritage initiatives (e.g. with-profits
annuity reallocation)
Asset-based businesses
Insurance businesses
4
21
3
Growing our cash generation

53
53
Today’s key messagesFriends Life strategy
Attractive growth markets, with scale and competitive advantage, to drive cash and returns for shareholders
Where we play
Our markets
Friends Life is a leading scale player in the UK Life & Pensions market, primarily focused on: • Legacy products• Fast growing retirement market
Strong financially disciplined team building distinctive capabilities and competitive advantage• Strategic partnership with Schroders
How we deliver cash and returns
Our shareholders
Growing cash generation demonstrates sustainable and growing franchise• UK and Heritage in force return in 2014 estimated to
be c.£40m higher than 2013
Our distinctive capabilities
How we win

Friends Life – A sustainable business with an exciting future
Q&A

Appendices

£m 2013 2014
(16) +10
76 +5
96 +5
With-profits annuity reallocationSummary of impacts
SFS
IFRS
MCEV
Developing a uniform capital management framework to ensure WP funds are suitably invested
c.£2bn of annuity liabilities and backing assets transferred to NP funds
This transaction de-risks the management of with-profits fund
First and largest of a potential series of WP transfers
HighlightsImpact
56

Non-core InternationalMarket exits completed as planned
New business IFRS based operating profit
£m FY 2012 FY 2013 FY 2014
New business strain (30) (16) ↓
In-force surplus 13 40 ↓
Principal reserving changes and one-off items (74) 18 ↓
Development costs (1) (3) ↔
Other income (3) - ↔
IFRS operating profit (95) 39 ↓
(12) (7)VNB, £m
1456
FY 2013FY 2012
APE, £m
£m FY 2012 FY 2013 FY 2014
Expected return from in-force business 15 20 ↓
Investment in new business (62) (22) ↓
Development costs (1) (2) ↓
Operating experience variances and other (6) 18 ↓
Sustainable free surplus (54) 14 ↔
Sustainable free surplus MCEV operating profit
£m FY 2012 FY 2013 FY 2014
Value of new business (12) (7) ↓
EEBC 5 3 ↓
Operating experience, other variances and assumption changes (93) 24 ↓
Development costs (1) (3) ↓
MCEV operating profit (101) 17 ↓
57

IFRS based operating profit Result driven by financial discipline and Heritage activities
Group IFRS based operating profit
£m
Changes in principal reserving and other
FY 2013
+59%
96
With-profits annuity reallocation
76
Long-term investment return
(46)
In-force surplus
(9)
New business strain
45
FY 2012
274
436
Lower return on SH assetsIncreased debt costsOther
£(23)m£(19)m£(4)m
EconomicWP spike and net run-offExperience variances
£24m£(5)m
£(28)m
Mortality/morbidity & longevityOther modelling
£73m£23m
58

311520
235
533182
436
0
50
100
150
200
250
300
350
400
450
500
550
600
650
FY 2013 IFRS profit
after tax
Acquisition acc adj
(298)
IFRS profit
after tax (exc. acq acc adj)
STICSTax1Gain on AmLife
sale
Non-recurring
costs
(151)
Investment fluctuations
FY 2013 IFRS based
op profit Separation &integration£(24)m
Outsourcing costs
Solvency II, finance trans-formation & other
Capital Optimisation Programme
£(65)m
£(53)m
£(9)m
IFRS result after taxReflects positive investment variances
Optimised capital requirements
Integrated financial reporting process for a Solvency II regulatory environment
Reduced and more directly variable costs
Delivery of targeted cost savings
£(151)m
Key capabilities and benefits
Group IFRS result after tax Group non-recurring costs
1. Excluding deferred tax on amortisation of acquisition accounting adjustments
£m
59

Group MCEV operating profitImprovement driven by UK and Heritage divisions
Group MCEV operating profit
£m
FY 2013 MCEV operating profit
489
Operating variances and other income
and charges
50
With-profits annuity reallocation
96
Operating assumption changes
28
Expected existing business contribution
(77)
UK divisions VNB
42
+28%
Other divisions VNB
(32)
FY 2012
382
60

Portfolio £bn Principal driver Rate (%) ∆
FY 2013 indicative
impact (£m)
VIF 4.2 Risk free -0.68 (29)
Shareholder assets 2.3 Risk free -0.68 (16)
Corporate bonds backing annuities 5.5 Return over
risk free3 -0.22 (12)
Debt, tax and other (20)
(77)
MCEV expected existing business contributionLower expected returns in line with guidance
Movement in expected existing business contribution Lower expected rates of return
£m
UK
Heritage
Corporate
£77m
InternationalLombard
FY 2013
248
(75)
211
6019
33
FY 2012
325
(75)
281
61
2335
Rates (%) 2012 2013 ∆
Equity 5.40 4.90 -0.50
Corporate bonds1 3.30 2.25 -1.05
Cash/Gilts (Risk free) 1.35 0.67 -0.68
Debt2 7.42 4.70 -2.72
1. Return on corporate bonds varies by portfolio. The rates shown are an indicative weighted average. 2. Rates applied to debt commitments are equivalent to the cash/gilt return plus spread on Group debt. 3. Excludes the impact of changes in illiquidity premium.
61
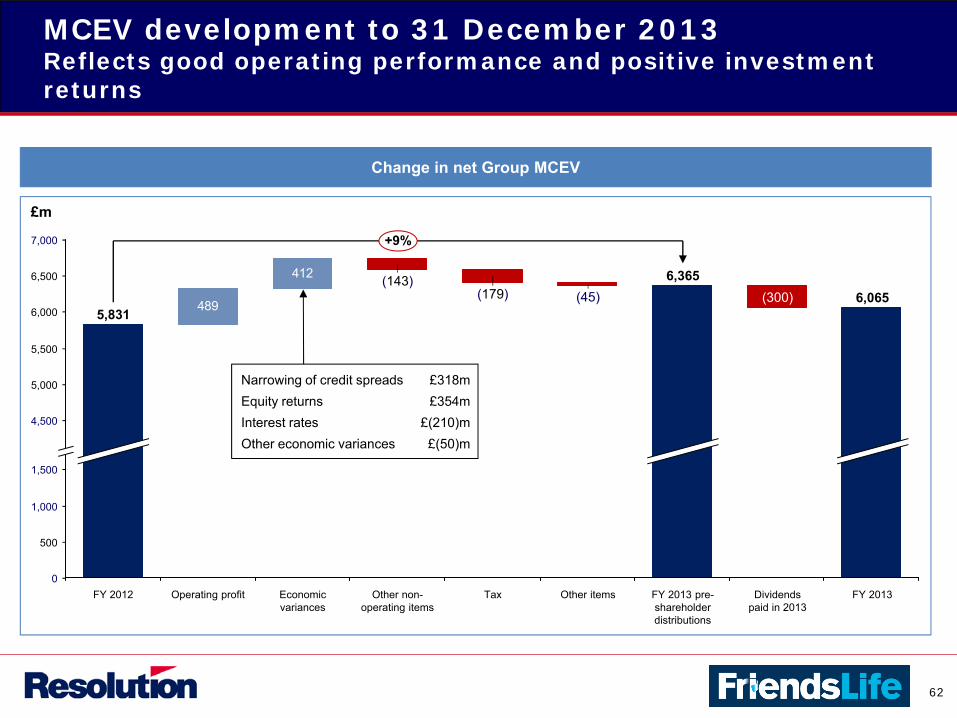
MCEV development to 31 December 2013Reflects good operating performance and positive investment returns
412
489
1,000
4,500
0
1,500
7,000
5,000
6,500
500
5,500
6,000
FY 2012
6,365
FY 2013 pre-shareholder distributions
(45)
Tax
+9%
FY 2013
6,065
Dividends paid in 2013
(300)(179)
Other itemsOperating profit Other non-operating items
(143)
Economic variances
5,831
Narrowing of credit spreadsEquity returnsInterest ratesOther economic variances
£318m£354m
£(210)m£(50)m
Change in net Group MCEV
£m
62
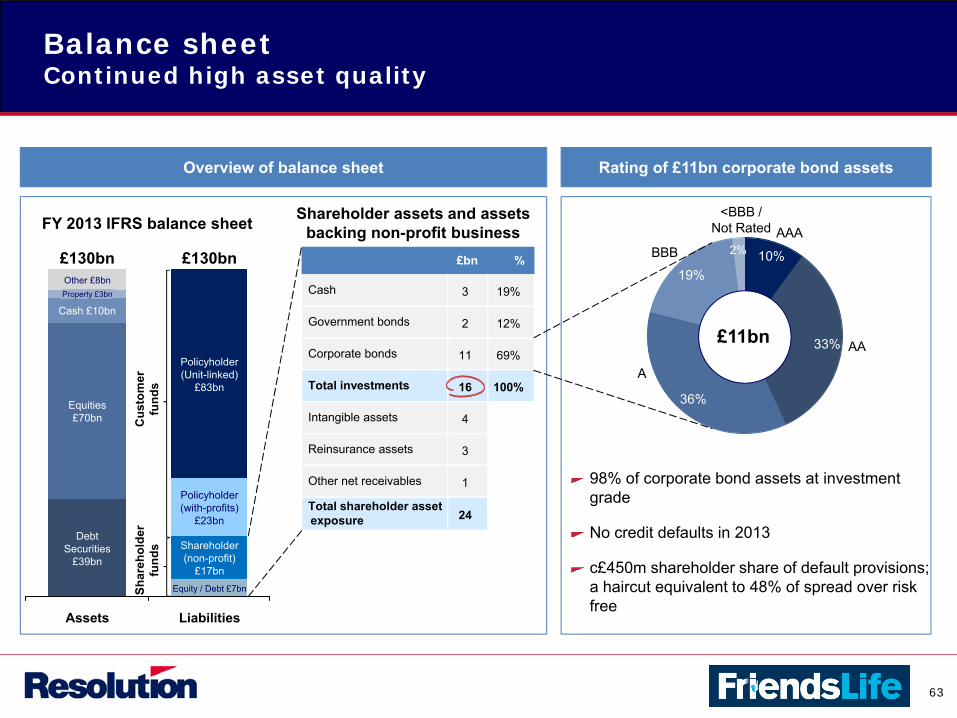
Liabilities
£130bn
Equity / Debt £7bn
Shareholder(non-profit)
£17bn
Policyholder(with-profits)
£23bn
Policyholder(Unit-linked)
£83bn
Assets
£130bn
DebtSecurities
£39bn
Equities£70bn
Cash £10bnProperty £3bn
Other £8bn
Balance sheetContinued high asset quality
FY 2013 IFRS balance sheet
98% of corporate bond assets at investment grade
No credit defaults in 2013
c£450m shareholder share of default provisions; a haircut equivalent to 48% of spread over risk free
Shareholder assets and assets backing non-profit business
£bn %
Cash 3 19%
Government bonds 2 12%
Corporate bonds 11 69%
Total investments 16 100%
Intangible assets 4
Reinsurance assets 3
Other net receivables 1
Total shareholder assetexposure 24
Overview of balance sheet Rating of £11bn corporate bond assets
<BBB /Not Rated
A
BBB
19%
36%
AA33%
AAA
10%
£11bn
Cus
tom
erfu
nds
Shar
ehol
der
fund
s
2%
63

Analysis of underlying free surplus by business type
1. Other principally includes movements on required capital, non-unit reserves and regulatory DAC (in Lombard) 2. 2012 analysis is unaudited and includes management estimates. 3. 2012 Investment in new business for Protection and Retirement income are £(65) million and £9 million respectively.
2013 £m
2012 £m
1
1
32
Greater analysis to be provided across business lines
64