resource-base, leadership, policy and economic development
TRANSCRIPT

UNIVERSITY OF NAIROBI
COLLEGE OF HUMANITIES AND SOCIAL SCIENCES
INSTITUE OF DIPLOMACY AND INTERNATIONAL STUDIES
RESOURCE-BASE, LEADERSHIP, POLICY AND ECONOMIC
DEVELOPMENT IN AFRICA AND SOUTHEAST ASIA:
A COMPARATIVE STUDY OF NIGERIA AND SINGAPORE
(1960 - 2000)
LUCKY CHAMBERS UMEZULIKE,
R50/75038/2014
RESEARCH PROJECT PAPER SUBMITTED IN PARTIAL FULFILLMENT
OF THE REQUIREMENTS FOR THE AWARD OF A DEGREE OF
MASTER OF ARTS IN INTERNATIONAL STUDIES (IS)
AUGUST, 2016

i
DECLARATION
I, the undersigned, declare that this project paper is my original work and has not been presented
for the award of a degree in this University or any other Institution of higher learning for
examination.
LUCKY CHAMBERS UMEZULIKE:
R50/75038/2014
Sign: . . . . . . . . . . . . . . . . . . . . . . . . . . . . . Date: . . . . . . . . . . . . . . . . . . . . . . .
This project paper has been submitted for examination with my approved as the supervisor.
MR. GERRISHON IKIARA
INSTITUTE OF DIPLOMACY AND INTERNATIONAL STUDIES
Sign: . . . . . . . . . . . . . . . . . . . . . . . . . . . . . Date: . . . . . . . . . . . . . . . . . . . . . . .

ii
DEDICATION
To
My loving dad
And mum

iii
ACKNOWLEDGEMENTS
I sincerely appreciate my dad and mum for their financial and moral support which made it
possible for me to complete this degree programme.
I would like to express sincere gratitude and appreciation to my indefatigable supervisor;
Mr. Gerrishon Ikiara for giving me an outstanding exposure to International Economics and
Economic Policy Analysis. And for his valuable academic role and who despite his numerous
commitments painstakingly guided this work to meet the required standard.
Special thanks to Prof Maria Nzomo, Dr Martin Ouma, Julius Adinoyi and Mr. Victor
Gatuiku for their time and guidance during my stay at the University of Nairobi. Also, thanks to
several Nigerian policymakers, scholars and politicians for their contributions through interviews,
warm support, discussions, and suggestions.

iv
LIST OF ABBREVIATIONS
ADB Asian Development Bank
AfDB African Development Bank
AIDS Acquired Immune Deficiency Syndrome
AUC African Union Commission
BPD Barrels Per Day
CCT Conditional Cash Transfers
CPF Singaporean Central Provident Fund
CPI Corruption Perception Index
CPI Consumer Price Index
CPIB Singaporean Corrupt Practices Investigation Bureau
DRC Democratic Republic of Congo
EDB Singaporean Economic Development Board
ESP Nigerian Economic Stabilisation Program
FDI Foreign Direct Investment
FOREX Foreign Exchange
GDP Gross Domestic Product
GNI Gross National Income
GNP Gross National Product
GRP Nigerian Green Revolution Program
HDB Singaporean Housing Development Board
HDI Human Development Index

v
HIV Human Immunodeficiency Virus
IMF International Monetary Fund
MNC Multinational Corporations
MRT Mass Rapid Transit
NDP Malaysian National Development Policy
NDP Nigerian National Development Plan
NEP Malaysian New Economic Policy
NNBS Nigerian National Bureau of Statistics
NPB Singaporean National Productivity Board
NTUC Singaporean National Trades Union Congress
NYSC Nigerian National Youth Service Corps
OECD Organisation for Economic Co‑operation and Development
OFN Nigerian Operation Feed the Nation
OPEC Organisation of Petroleum Exporting Countries
PB Per Barrel
PPP Purchasing Power Parity
SAF Singapore Armed Forces
SAP Structural Adjustment Program
SINGSTAT Statistics Singapore
SARS Severe Acute Respiratory Syndrome
SUV Sport Utility Vehicle
UN United Nations
UNDP United Nations Development Programme
UoN University of Nairobi
UNCTAD United Nations Conference on Trade and Development
UNDP United Nations Development Program
USAID United States Agency for International Development
WB World Bank

vi
TABLE OF CONTENTS
DECLARATION _______________________________________________________________ i
DEDICATION ________________________________________________________________ ii
ACKNOWLEDGEMENTS ______________________________________________________ iii
LIST OF ABBREVIATIONS ____________________________________________________ iv
TABLE OF CONTENTS ________________________________________________________ vi
LIST OF FIGURES ____________________________________________________________ ix
LIST OF TABLES _____________________________________________________________ ix
ABSTRACT __________________________________________________________________ xi
CHAPTER ONE: INTRODUCTION AND BACKGROUND TO THE STUDY __________ 1 1.0 Introduction ____________________________________________________________ 1
1.1 Background to the Study __________________________________________________ 2
1.2 Statement of the Problem __________________________________________________ 3
1.3 The Objectives __________________________________________________________ 5
Specific objectives ________________________________________________________ 5
1.4 Justification of Research __________________________________________________ 6
1.5 Operationalization of Key Terms ____________________________________________ 7
1.6.0 Literature Review ______________________________________________________ 7
1.6.1 The Concept of Economic Development __________________________________ 8
1.6.2 Leadership and Economic Development ___________________________________ 9
Leadership in Africa _____________________________________________________ 9
Economic Development in Africa _________________________________________ 11
Leadership and Economic Development in Southeast Asia ______________________ 12
Leadership and Economic Development in Nigeria ____________________________ 13
Leadership and Economic Development in Singapore _________________________ 14
1.6.3 Policy and Economic Development _____________________________________ 15
Africa and Southeast Asia _______________________________________________ 15
Nigeria ______________________________________________________________ 18
Singapore ____________________________________________________________ 20
1.7.0 Conceptual Framework _________________________________________________ 20
1.7.1 East Asian Model of Capitalism ________________________________________ 21
Relevance to this study __________________________________________________ 21
1.7.2. Resource Curse Theory ______________________________________________ 21
Relevance to this study: _________________________________________________ 23
1.7.3 Conceptual Model ___________________________________________________ 24
1.8 Hypotheses ____________________________________________________________ 25
1.9.0 Methodology of Research _______________________________________________ 25
1.9.1 Research Design ____________________________________________________ 25
1.9.2 Methods of Data Collection ___________________________________________ 25
Primary data __________________________________________________________ 25
Secondary data ________________________________________________________ 26
1.9.3 Data analysis _______________________________________________________ 26
1.9.4 Research Ethics _____________________________________________________ 26

vii
1.10 Scope and Limitations of study ___________________________________________ 27
1.11 Chapter Outline _______________________________________________________ 27
CHAPTER TWO: AN OVERVIEW OF ECONOMIC DEVELOPMENT IN AFRICA AND
SOUTHEAST ASIA ___________________________________________________________ 29 2.0 Introduction ___________________________________________________________ 29
2.1 An Overview of Economic Development in the two regions _____________________ 30
2.1.1 Real GDP growth ___________________________________________________ 30
2.1.2 Real GDP per capita growth ___________________________________________ 36
2.1.3 Poverty ____________________________________________________________ 37
2.1.4 Unemployment _____________________________________________________ 39
2.1.5 Education __________________________________________________________ 40
2.1.6 Life expectancy level _________________________________________________ 43
2.2 Leadership and Economic development in the two regions _______________________ 43
2.3 Policy processes and Economic development in the two regions __________________ 45
2.4 Conclusion ____________________________________________________________ 46
CHAPTER THREE: OVERVIEW OF RESOURCE-BASE AND ECONOMIC
DEVELOPMENT IN NIGERIA AND SINGAPORE _______________________________ 47 3.0 Introduction ___________________________________________________________ 47
3.1 Comparative analysis of the resource-base of Nigeria and Singapore _______________ 48
3.1.1 Land ______________________________________________________________ 48
3.1.2 Population _________________________________________________________ 49
3.1.3 Mineral resources ___________________________________________________ 51
3.2 Overview of Economic Development in the two countries _______________________ 52
3.2.1 Real GDP growth ___________________________________________________ 53
3.2.2 Real GDP per capita growth ___________________________________________ 56
3.2.3 Poverty ____________________________________________________________ 58
3.2.4 Unemployment _____________________________________________________ 59
3.2.5 Education __________________________________________________________ 59
3.2.6 Health ____________________________________________________________ 61
3.3 General overview of both countries‟ performances in related Economic Areas _______ 63
3.3.1 Diversification ______________________________________________________ 63
3.3.2 External trade ______________________________________________________ 66
3.3.3 Inflation ___________________________________________________________ 67
3.3.4 Infrastructure _______________________________________________________ 70
3.4 Conclusion ____________________________________________________________ 71
CHAPTER FOUR: AN ASSESSMENT OF KEY ECONOMIC POLICIES OF NIGERIAN
AND SINGAPOREAN LEADERS (1960 – 2000) ___________________________________ 72 4.0 Introduction ___________________________________________________________ 72
4.1 An Evaluation of key economic policies of Nigerian leaders _____________________ 73
4.1.1. 1960 – 1966: Formative Roles – Ist NDP _________________________________ 73
4.1.2. 1967 – 1975: Yakubu Gowon Years – 2nd
NDP and Indigenisation Policy _______ 76
4.1.3. 1975 – 1979: Murtala Muhammed and Olusegun Obansajo Years – 3rd
NDP and
OFN __________________________________________________________________ 78
4.1.4 1979 – 1983: Shehu Shagari Years – 4th
Plan, GRP and ESP __________________ 80
4.1.5. 1983 – 1985: Muhammadu Buhari Years ________________________________ 83
4.1.6. 1985 – 1993: Ibrahim Babangida Years - SAP ____________________________ 85
viii
4.1.7. 1993 – 1998 - Sani Abacha Years ______________________________________ 88
4.2 Assessing key economic policies of Singaporean leaders ________________________ 89
4.2.1. 1960 – 1990: Lee Kuan Yew‟s Years ___________________________________ 90
Export-Oriented Industrialisation Policy ____________________________________ 90
Financial Policies ______________________________________________________ 97
Anti-Corruption Policy __________________________________________________ 98
Capital Formation Act Amendment – Central Provident Fund ___________________ 98
Welfare policies _______________________________________________________ 99
Public Housing Policy _________________________________________________ 100
Employment and Industrial Relations Act Amendment - The Industrial Arbitration Court
___________________________________________________________________ 101
Singapore‟s Population Policy ___________________________________________ 102
4.2.2. 1990 – 2004: Goh Chok Tong Years ___________________________________ 104
4.3 A comparative summary of the economic policy regimes of the two countries ______ 106
4.4 Leadership and Economic development in Nigeria and Singapore ________________ 108
4.5 Conclusion ___________________________________________________________ 113
CHAPTER FIVE: SUMMARY, CONCLUSIONS AND RECOMMENDATIONS ______ 114 5.0 Introduction __________________________________________________________ 114
5.1 Summary ____________________________________________________________ 114
5.2 Conclusion ___________________________________________________________ 116
5.3 Recommendations _____________________________________________________ 118
5.4 Suggestion on Area for Further Study ______________________________________ 119
BIBLIOGRAPHY ___________________________________________________________ 120
APPENDICES ______________________________________________________________ 130 Appendix I: Letter of Introduction ______________________________________________ 130
Appendix II – Consent Form __________________________________________________ 131
Appendix III – Interview Guide ________________________________________________ 133
Appendix IV – List of Respondents _____________________________________________ 137

ix
LIST OF FIGURES
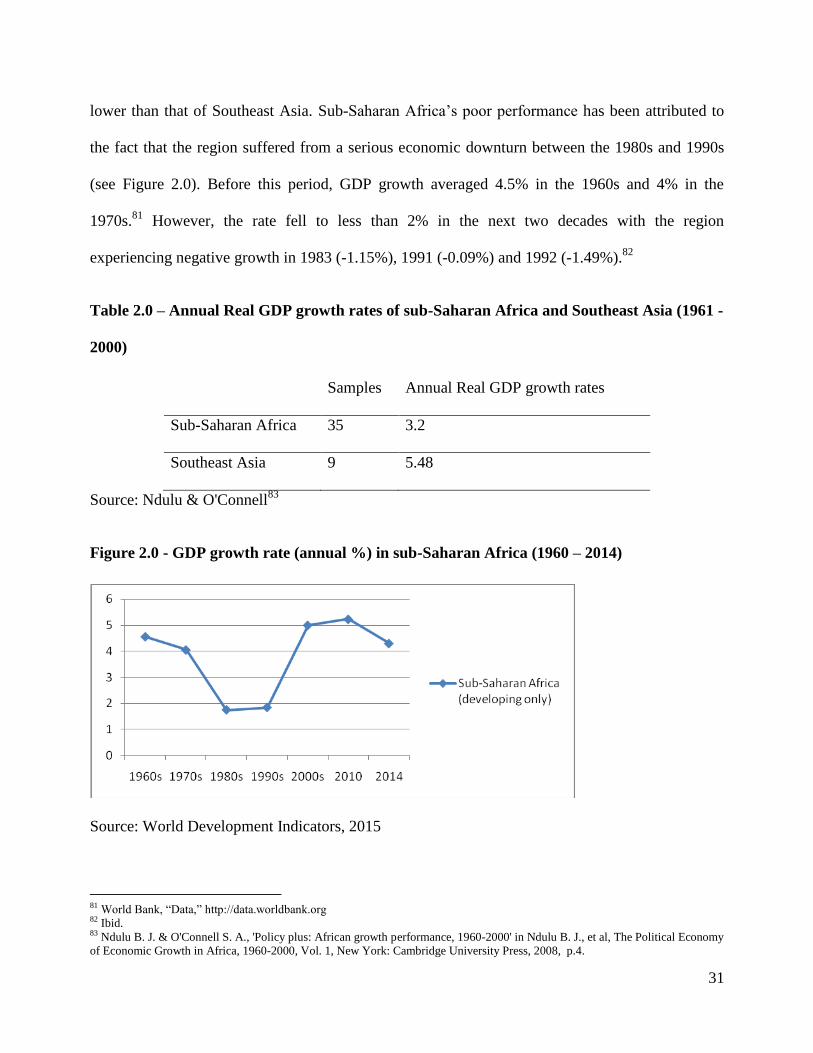
Figure 2.0 - GDP growth rate (annual %) in sub-Saharan Africa (1960 – 2014) _____________ 31
Figure 2.1 - Poverty headcount at $1.25 a day [(% of population) 1981 – 2011] _____________ 38 Figure 2.2 – Global distribution of adult and youth illiteracy - 2011 ______________________ 41 Figure 2.3 – Global adult literacy (1990 - 2015) ______________________________________ 42 Figure 2.4 – Global youth literacy (1990 - 2015) ______________________________________ 42 Figure 3.0 - Population growths of Nigeria and Singapore (1960 - 1990) ___________________ 49
Figure 3.1 - Population growths of Nigeria and Singapore (1990 - 2014) ___________________ 50 Figure 3.2 - Real GDP of Nigeria and Singapore in US$ (1960 - 1990) ____________________ 54 Figure 3.3 - Real GDP of Nigeria and Singapore in US$ (1990 - 2014) ____________________ 55
Figure 3.4 - Per capita income(s) of Nigeria and Singapore in US$ (1960 - 1990) ____________ 57 Figure 3.5 - Per capita income(s) of Nigeria and Singapore in US$ (1990 - 2014) ____________ 57 Figure 3.6 - Life expectancy rates of Nigeria and Singapore (1960 - 1990) _________________ 61
Figure 3.7 - Life expectancy rates of Nigeria and Singapore (1990 - 2012) _________________ 62 Figure 3.8 – Nigeria – Inflation, Consumer prices (annual %) (1961 - 2014) ________________ 67
Figure 3.9 – Nigeria – Inflation, Consumer prices (annual %) (2015 - 2016) ________________ 69 Figure 3.10 – Singapore – Inflation, Consumer prices (annual %) (1961 - 2014) _____________ 69 Figure 4.0 – Real GDP per capita of Nigeria in US$ (1960 - 1966) _______________________ 74
Figure 4.1 - Real GDP of Nigeria in US$ (1960 - 1966) ________________________________ 75 Figure 4.2 – Real GDP per capita of Nigeria in US$ (1970 - 1975) _______________________ 78
Figure 4.3 – Real GDP of Nigeria US$ (1980 - 1993) __________________________________ 85 Figure 4.4 – Real GDP per capita of Nigeria in US$ (1980 - 1993) _______________________ 86
Figure 4.5 – Real GDP of Nigeria US$ (1993 - 1998) __________________________________ 89 Figure 4.6 – Real GDP of Singapore in US$ (1960 - 1990) _____________________________ 95
Figure 4.7 – Real GDP per capita of Singapore in US$ (1960 - 1990) _____________________ 96 Figure 4.8 - Population growth of Singapore (1960 - 1990) ____________________________ 103 Figure 4.9 – Real GDP of Singapore in US$ (1990 - 2004) ____________________________ 104
Figure 4.10 – Real GDP per capita of Singapore in US$ (1990 - 2004) ___________________ 105

x
LIST OF TABLES
Table 2.0 – Annual Real GDP growth rates of sub-Saharan Africa and Southeast Asia (1961 -
2000) ________________________________________________________________________ 31 Table 2.1 - Economic growth in some selected Southeast Asian Economies (1960-2014) ______ 33 Table 2.2 – Real GDP per capita growth rates of sub-Saharan Africa and Southeast Asia (1960 -
2014) ________________________________________________________________________ 36 Table 2.3 – Real GDP per capita growth rates of some Southeast Asian countries (1960 - 2014) 37
Table 2.4 - Poverty incidence and changes in three Southeast Asian countries (1970 – 2002) ___ 39 Table 2.5 – Unemployment rates of sub-Saharan Africa (2009 - 2015) ____________________ 40 Table 2.6 – Unemployment rates of Southeast Asia (2009 - 2015) ________________________ 40 Table 2.7 – Life expectancy at birth – Africa, Americas and Southeast Asia (1990 – 2013) ____ 43
Table 3.0 – Resource-base of Nigeria and Singapore, as at 2015 _________________________ 48 Table 3.1 – Time series of Real GDP of Nigeria and Singapore in billion USD (1960 - 2015) __ 53
Table 3.2 – Time series of Nigeria and Singapore on Real GDP Per Capita _________________ 56 Table 3.3 – Percentage of Nigerians living below poverty line (1960 - 2015) _______________ 58
Table 3.4 – Literacy levels of Nigeria and Singapore (1960 - 2015) _______________________ 60 Table 3.5 – Distribution of Nigeria‟s GDP by sector, 1960 – 1969 (in %) __________________ 64 Table 3.6 – Distribution of Nigeria‟s GDP by sector, 1970 – 2013 (in %) __________________ 64

xi
ABSTRACT
This study is a critical examination of factors that influenced the differing economic development
performances of Africa and Southeast Asia through a comparative study of Nigeria and Singapore.
It examines how policy processes, resource-base and leadership dynamics influenced these
differing development performances. These have been considered to have precipitated the deep
differing economic development indicators of the two regions and countries despite that they used
to be peers in the 19060s. The study also analyses the economic development performances of
Africa and Southeast Asia; thereafter, it concentrates on Nigeria and Singapore. Emphasis is on
these elements of economic development: real GDP and per capita, employment, poverty, literacy
and life expectancy. By comparing the two countries with differing levels of economic
development, this study captures cross-national differences and finds out lessons Nigeria can learn
from Singapore in pursuing inclusive and sustainable economic development.
Furthermore, this study argues that Africa’s low economic development indicators despite
being the richest continent in the world in terms of natural resources have come about largely as a
result of poor leadership, incoherent policies, policy reversals, corruption, poor management of
resources and weak institutions. And that Southeast Asia’s successes, despite with little natural
resources have come about largely as a result of effective leadership, reformative economic
policies, efficient management of resources and strong institutions. The study also argues that: 1).
Resource-base does not explain the difference between the development levels of Nigeria and
Singapore, 2). Export-led industrialisation policy was a key determinant of the different levels of
development between Nigeria and Singapore, and 3). Military-rule interferences negatively
affected Nigeria’s economic development performance, unlike in Singapore. In addition, this study
found out that effective leadership influences economic development through coherent policies and
clinical management of resources at a country's disposal.
The study is based on East Asia model of Capitalism and Resource Curse economic
theories. This is a historical research with a pragmatic philosophical worldview, thus, it adopts
mixed method research methodology. Primary and secondary data are used. The researcher used
interview guide to collect primary data from 22 respondents. Primary and Secondary data were
analysed using statistical and thematic analysis.

1
CHAPTER ONE: INTRODUCTION AND BACKGROUND TO THE STUDY
1.0 Introduction
Economic Development encompasses elements such as growths in real GDP1 and per capita
income; reductions in unemployment and poverty levels; and improvements in literacy and life
expectancy rates among other welfare indicators.2 Often included in the criteria for evaluating the
degree of economic development are also the level of diversification of a country‟s economy, and
amount of widespread infrastructure.3 It is the aspiration of every country to economically develop
and carter for its population. This is often by transitioning from underdeveloped to industrialised
societies. In every part of the world, leaders strive to develop their countries through different
strategies and tactics. Most of these strategies and tactics to achieve most of the aforementioned
elements above are mostly contained in policy documents.
A policy is a guideline that a government uses to address a particular public issue. Various
issues concerning economic development have been addressed through the use of policies. Issues
such as inequality, inflation, budget deficit, balance of payment deficit, diversification of the
economy, unemployment, wealth creation, eradication of poverty, building human capital,
expanding infrastructure and attracting foreign direct investment. This makes policymaking
processes as well as implementation very important. Leaders have often used policies to transform
their countries and address social complaints. Policies are always in response or a reaction to
various societal challenges. A policy is mostly followed by an institutional mechanism for
implementation.
1 Gross Domestic Product 2 Investopedia, "Developed Economy Definition", 16 April, 2010. 3 Ibid

2
This chapter contains the Introduction; Background to the Study; Problem Statement; the
Broad and Specific Objectives; Justification of Research; Operationalization of Key Terms;
Literature Review; Conceptual Framework and Model; Hypotheses; Methodology of Research;
Scope and Limitations of Research; and Chapter Outline.
1.1 Background to the Study
According to the World Bank, 25 African countries4 are within low income countries (GNI
5 per
capita of US$1,026 or less). Furthermore, sub-Saharan Africa entered the 21st century with many
of the world‟s poorest countries.6 Average per capita for those countries was lower than at the end
of the 1960s.7 In addition, the continent still depends largely on foreign aid, with high proportions
of the population living in poverty. High child mortality and unemployment rates; as well as low
literacy and life expectancy levels are also major areas of concern.
Africa and Southeast Asia are regions of the world that once shared similar economic
development challenges. Most countries from the two regions also got their independence at the
same period. However, while African countries still face many aforementioned developmental
challenges, despite having enormous deposits of mineral resources, many Southeast Asian
countries are recently considered as developed countries. Some of these Southeast Asian countries
have little or no mineral resources but were able to transform themselves, and lift millions out of
poverty.8 This has led several researchers into investigating factors that led to the huge disparities.
This is the case of the oil-rich Nigeria and Singapore, which are from the two regions.
Nigeria and Singapore have differing economic development indicators despite starting with
4 World Bank, “Country and Lending Groups.” Retrieved on 17 January 2016, from http://data.worldbank.org/about/country-and-
lending-groups 5 Gross National Income 6 World Bank, Can Africa Claim the 21st Century?, (Washington, D.C.: World Bank, 2002. 7 Ibid 8 Dirk Vlasblom, "The Richer Harvest - Economic development in Africa and Southeast Asia," the African Studies Centre: Leiden,
2013.

3
similar development challenges. For Nigeria, despite her oil wealth and days of oil boom, it has
failed to become an industrialised economy, diversify exports (90% of export earnings are from
oil9); and cater for her increasing population. While Singapore, within a generation, industrialised
and developed rapidly, earning recognition as one of the Four Asian Tigers.
In trying to understand why Southeast Asia has overtaken Africa, economic development
wise, this study examines Nigeria and Singapore as comparative cases. This has been done by
carrying out investigation on how leadership dynamics, resource-base and policy processes of the
two countries influenced the both countries huge disparities. Emphasis is placed on these key
elements of economic development: real GDP, per capita income, employment, poverty, literacy
rate and life expectancy level. Between 1960 and 1990 for example played key, formative roles in
both countries economic development performances. Within the three decades, Singapore got
transformed from a third to a first world country while Nigeria was caught up with International
Monetary Fund‟s Structural Adjustment Program.
1.2 Statement of the Problem
A considerable number of studies have investigated the differing economic development indicators
of Africa and Southeast Asia by scholars such as Dirk Vlasblom10
and international organisations
such as World Bank, United Nations Conference on Trade and Development (UNCTAD) and
United Nations Development Programme (UNDP). Most of them paired Nigeria and Indonesia in
their studies, because of certain similarities. Scholars such as Erik Thorbecke11
; Bevan, Collier and
9 The African Economic Outlook 2013 estimates that oil sector contributes to 8.0 per cent of the average annual growth rate of the
country, as opposed to the -0.35 per cent of the non-oil sector (AfDB, OECD, UNDP and UNECA, 2013, p. 264). 10 Dirk Vlasblom, "The Richer Harvest - Economic development in Africa and Southeast Asia," the African Studies Centre: Leiden,
2013. 11 Thorbecke, Erik, "The institutional foundations of macroeconomic stability: Indonesia versus Nigeria', in Yujiro Hayami and
Masahiko Aoki (eds), The institutional foundations of East Asian economic development: proceedings of the IEA conference held
in Tokyo, Japan, pp. 106-39, Houndmills, Basingstoke: Macmillan, 1998.

4
Gunning12
; and Peter Lewis13
have done great studies on why Nigeria and Indonesia have different
indicators on poverty, per capita, and industries share of GDP and exports while having big
populations and oil. They have analysed economic policies of some leaders in both countries and
their leaderships. However, none of the studies has ever compared Nigeria and Singapore. Hence
the essence of this study, to contribute to the field of academia in this debate by examining these
two different countries, in the two regions with key differences in leadership, policy choices,
natural resources and economic development.
There is also a significant number of studies14
15
16
on Nigeria's policy choices and
processes that necessitated why Nigeria still face certain developmental challenges. However, none
was done in a systematic manner (policy after policy), and bringing in the elements of resource-
base management and leadership dynamics. None linked these previous policies with how they
contributed to current realities. None made policy suggestions for Nigeria to improve its low
economic development indicators with current realities. This study seeks to cover these gaps.
Similarly, though there are studies on Singapore‟s policy choices to explain Singapore's economic
success by scholars such as Barbara Leitch17
, the periods 1990 - 2000 are mostly left out. This
study seeks to cover this gap. Additionally, examining only one of the countries may not fully
show a broad picture as well as offer ideal solutions. By comparing the two countries, it will be
easier to capture cross-national dynamics.
12 Bevan, David L., Paul Collier, and Jan Willem Gunning, "The political economy of poverty, equity, and growth: Nigeria and
Indonesia," Washington, DC: The World Bank, 1999. 13 Lewis, Peter M., "Growing apart: oil, politics, and economic change in Indonesia and Nigeria," Ann Arbor: University of
Michigan Press, 2007. 14 Onah, F. O., “Managing Public Programmes and Projects,” Nsukka: Great AP Express Publishers, 2006. 15 Iheanacho, E. N., "National Development Planning in Nigeria: An Endless Search for Appropriate Development Strategy,"
International Journal of Economic Development Research and Investment, Vol. 5, No. 2; August 2014. 16 Koha, S, “Nigeria: The Political Economy of Oil”, London: Oxford University Press, 1994. 17 Barbara Leitch Lepoer, "Singapore as Part of Malaysia". Library of Congress Country Studies. Washington, D.C.: Government
Printing Office, 1989.

5
It is therefore essential to pair Nigeria and Singapore side by side through a systematic
analysis of economic policies, and the elements of leadership and resource-base in other to
critically bring to light - reasons why the both countries have differing economic development
indicators. In this regards, this research aims to fill all established knowledge gaps by trying to
answer the following questions: How did a small city-state of Singapore with small landmass and
no mineral resources outperform Nigeria with all her oil wealth and massive landmass? How did
the issues of resource-base and leadership dynamics influence the both countries economic
development performances? What were the key policies that gave Singapore her outstanding
development indicators? What sort of policies should Nigeria embrace and what lessons can it
learn from Singapore to solve its economic development challenges?
1.3 The Objectives
The broad objective of this study if to critically analyse the economic development performances
of Nigeria and Singapore, and find out how policy processes, resource-base and leadership
dynamics influenced these performances.
Specific objectives
1. To investigate how resource-base influenced the differing economic development indicators of
Nigeria and Singapore.
2. To evaluate the key economic policies of Nigerian and Singaporean leaders from 1960 to 2000.
3. To find out how leadership dynamics contributed to the both countries differing economic
development indicators from 1960 to 2000.
6
1.4 Justification of Research
Assessing the impacts of economic policies and developmental efforts of Nigerian and
Singaporean leaders on development will be helpful in finding out the kind of policies and efforts
made by leaders in Singapore to develop Singapore with no mineral resources, and Nigerian
leaders in failing to develop Nigeria despite her oil wealth. Such findings will be helpful to the
leaders and policymakers of most African countries especially Nigeria, in re-strategising and
adopting certain elements of Singapore‟s development model to pursue inclusive and sustainable
economic development.
The study is also expected to enhance our knowledge about Africa‟s low economic
development indicators and the role of leadership in it, through policy dynamics. The gaps filled
will enhance scholarly knowledge of the potential correlations of leadership, policy processes and
economic development. It will also deepen the understanding about the Southeast Asian Miracles
and how African countries can follow suit.
The study further makes policy suggestions that could be included in various development
policies of most African countries through key ideas from the Singaporean economic development
framework.
Immediate consumer/customer:
The President of the Federal Republic of Nigeria - the Nigerian Ministries of Finance; National
Planning; and Trade, Investment and Industry. This study makes suggestions on economic
development strategies that would be of interest to these offices.

7
1.5 Operationalization of Key Terms
Leadership: policy makers of a country at the national level.
Economic Policy: this refers to economic development policies which are meant to provide
employment, necessary infrastructure, social security; reduce poverty, income inequality;
build human capital; and increase income levels. Policies to achieve these could be on
industrialisation, providing conducive environment to attract foreign investors,
privatisation, agriculture modernisation, diversification of the economy, housing, wealth re-
distribution, job creation and poverty reduction.
Economic Development: policy intervention to promote the socio-economic wellbeing of a
country‟s people. This study focuses on six key elements of economic development: real
GDP, per capita income, unemployment, poverty, literacy rate and life expectancy.
Africa: general reference to Africa here in most cases is specifically with respect to sub-
Saharan Africa.
Southeast Asia: is a sub-region of Asia, consisting of these 11 sovereign states.
1.6.0 Literature Review
This section reviews literature on how leadership dynamics and policy processes influence
economic development. It looks at studies that have been done on Africa and Southeast Asia about
how this narrative contributed to the differing economic development indicators of the two regions
with special focus on Nigeria and Singapore. The section is a critical review of the studies done by
other researchers. It aims at identifying and evaluating opinion, knowledge, attitude and findings
of various studies that have been carried out in this area. This study then fills the gaps in the
literature reviewed.
8
1.6.1 The Concept of Economic Development
According to the University of Iowa's Center for International Finance and Development,
economic development has been discussed with other concepts such as modernization,
westernization, and industrialisation. It is often a policy intervention endeavour with aims of
improving the economic and social well-being of people. Economic growth is a phenomenon of
market productivity and rise in GDP.
Accordingly, as an economist, Amartya Sen pointed out that "economic growth is one
aspect of the process of economic development".18
Mansell and Wehn suggested that economic
development has been understood since the World War II to involve economic growth, namely the
increases in per capita income, and the attainment of a standard of living equivalent to that of
industrialised countries.19
Todaro and Smith stated in their book: “Economic Development” that
the three core values of development are: 1). Sustenance: the ability to meet basic needs, 2). Self-
esteem: to be a person, and 3). Freedom from servitude: to be able to choose.20
They further stated
that the three objectives of development are: 1). to increase the availability and expand the
distribution of basic life-sustaining goods such as food, shelter, health, and protection 2). to raise
levels of living, including, in addition to higher incomes, the provision of more jobs, better
education, and greater attention to cultural and human values and 3). to expand the range of
economic and social choices available to individuals and nations by freeing them from servitude
and dependence.21
18 Amartya Sen, "Development: Which Way Now?", The Economic Journal, Volume 93, Issue 372, Dec, 1983, 745 - 762 19 Mansell, R & and Wehn, U., "Knowledge Societies: Information Technology for Sustainable Development", New York: Oxford
University Press, 1998. 20 Todaro M. and Smith S., “Economic Development," Pearson Education, Inc., United States of America, 2012. ISBN 13: 978-0-
13-801388 21 Ibid

9
1.6.2 Leadership and Economic Development
Leadership in Africa
Various researchers have attributed Africa‟s poor development indicators despite having enormous
mineral resources to stimulate economic growth and development to poor leadership.
A study conducted by Kamuntu argues that most African leaders have assumed their
leadership roles with limited training in the art and science of directing and effectively instituting
policies of economic development.22
The challenge to African leaders is to develop the capacity
that would enable us to strike a balance between the values of African societies and the economic
development framework that our nations must follow, he argued. 23
Moreover, the political power
in Africa has become concentrated in one political party and finally in hand of one leader which
leads to greater violations of human rights, resulting in massacres, millions of Africans becoming
refugees or becoming displaced persons and brain drain. 24
Similarly, Adeola established the relationship between a nation‟s greatness and visionary
and purposeful leadership as can be seen in advanced and developing countries.25
He found out
that such leaders played significant roles in the socio-economic development and political
emancipation of their countries. Closely linked to leadership is ideology. 26
In the absence of
visionary leadership to give a clear-cut ideology, a nation continues to lack orientation and
commitment. Consequently, leadership has failed to harness the resources and the ingenuity of the
people for national development. 27
22 E.R Kamuntu, “Leadership Challenges in Consolidating Democracy and Good Governance in Africa,” A paper presented at
conference of The Leadership Forum, Nairobi, Kenya: March 10-12, 1993 23 Ibid 24 Ibid 25 G.L. Adeola, “Politics and Democratization Process in Nigeria: The Prevailing Issues”, LASU Journal of Social Sciences, Vol 6
Nos 1 & 2, August, 2007. 26 Ibid 27 Ibid

10
In the light of the above, a research conducted by Eze argues that the trouble with Africa is
simply and squarely a failure of leadership.28
He found out that there is nothing basically wrong
with the African character or political system in operation. The character of political leadership
became a problem as most of them lost or lacked control of effective leadership.29
He stresses that
this led to the scramble and partition of state resources to suit their purpose, instead of these
resources being used to power economic development.30
Additionally, a former Nigerian president, Olusegun Obasanjo in 2001 blamed Africa‟s
poor economic development performance on leadership crisis. He states that since 1960, with
whatever measurements, whether social or economic indicators, Africa declined compared to the
rest of the world, particularly when measured against those parts of the world that were
comparable to the region at that time such as Asia and Latin America. He affirms that why Africa
is failing while the rest of the world is succeeding, despite its enormous resources is because of
poor leadership and that Africa cannot continue on the same negative road (of having poor
leadership) and expect things to work for the better. 31
Agbaje and Roberts in their study analysed post independence African leaders. They point
out that most of these leaders not only personalised power but also privatised the state for the
purpose of primitive accumulation, repression and all forms of opposition. Instead of using their
position for initiating economic development policies, they leaders utilised it as a vehicle for
terrorizing the citizenry, thereby leading to the disengagement of the populace from the public
realm. 32
28 I. Eze, “A Study of Leadership in Nigerian Organisations”, ASCON Journal of Management Vol 7, Nos 1 & 2, April/October,
1988. 29 Ibid 30 Ibid 31 Africa News Service, “Obasanjo Blames Poor Leadership For Africa's Decline”, March 6, 2000. Retrieved on 17 January 2016,
from http://www.africanprogress.net/africanleaders.htm 32 Agbaje, D.O. and Roberts, Y, “Meeting the Challenge of Sustainable Democracy in Nigeria,” Ibadan: NISER, 2000.

11
Economic Development in Africa
The level of Economic development in Africa has been examined using various indicators with
results generally showed that Africa was the most underdeveloped continent in the world by the
second decade of the 21st century.
The World Bank report, 'Can Africa claim the 21st century?', analyses Africa‟s
development challenges by 2002, in other to put forward suggestions on improving the continent‟s
macroeconomic indicators in the new century.33
The report argues that Africa had a growing share
of the world‟s absolute poor and that many development problems have become largely confined
to Africa. These problems included lagging primary school enrollments, high child mortality (81
per 1,00034
), poverty, and endemic diseases. The report further states that one African in five lives
in countries severely disrupted by conflict. The report suggests that with the region‟s rapidly
growing population, 5% annual growth was needed simply to keep the number of poor from rising.
And that halving severe poverty by 2015 will require annual growth of more than 7%, along with a
more equitable distribution of income.35
In another study conducted by the UN in 2006, 34 of the 50 nations on the list of least
developed countries are in Africa.36
The organisation further stresses that, Africa's share of income
has been consistently dropping over the past century by any measure. The UN also lowered the
ranking of African states because the continent sees greater inequality than any other region.
According to the United Nations' Human Development Report of 2015, the bottom 1737
ranked
33 World Bank, Can Africa Claim the 21st Century?, (Washington, D.C.: World Bank, 2002. 34 World Health Organization, "Global Health Observatory (GHO) data Child mortality and causes of death," 2015. Retrieved on 04
January, 2016, from http://www.who.int/gho/en/ 35 Ibid 36 UN, “LDC‟s List,” 2006. Retrieved on 14 February 2016, from http://www.un.org/special-rep/ohrlls/ldc/list.htm 37 United Nations Development Programme, "2015 Human Development Report Statistical Annex." Retrieved on 04 January, 2016,
from http://hdr.undp.org/sites/default/files/hdr_2015_statistical_annex.pdf
12
nations (172nd
to 188th
) are all African. This means that life expectancy, literacy, education, and
income are all low. This means so much has not changed since 2002 and 2006.
An area of concern has been that poverty level is increasing instead of declining. In a study
conducted by World Bank to investigate this in 2012, it was found out that poverty is rising in
Africa with 330 million Africans living below $1.25 per day38
as against 280 million Africans in
1990.
Leadership and Economic Development in Southeast Asia
A good number of studies have attributed Southeast Asia‟s rapid development to effective
leadership.
Dirk asserts in his study that the right policy decisions of Southeast Asian leaders summed
it up.39
Wain reported in his study that during Mahathir Mohammed's tenure as Prime Minister of
Malaysia, the country experienced a period of rapid modernisation and economic growth, and his
government started a series of bold infrastructural projects.40
Milne and Mauzy reinforces this by
noting that Mahathir initiated a series of major infrastructure projects in the 1990s that changed the
story of Malaysia.41
One of the largest was the Multimedia Super Corridor, designed to cater for
the information technology industry; Putrajaya as the home of Malaysia's public service, and
bringing a Formula One Grand Prix to Sepang.
Similarly, in a study conducted by Panglaykim and Thomas in Indonesia, they state that
under President Suharto in 1996, poverty rate dropped to around 11% compared with 45% in 1970.
From 1966 to 1997, Indonesia recorded real GDP growth of 5.03% per annum, pushing GDP per
38 World Bank, "While Poverty in Africa Has Declined, Number of Poor Has Increased," October 2015. Retrieved on 17 January
2016, from http://www.worldbank.org/en/region/afr/publication/poverty-rising-africa-poverty-report 39 Dirk Vlasblom, "The Richer Harvest - Economic development in Africa and Southeast Asia," the African Studies Centre: Leiden,
2013. 40 Barry Wain, “Malaysian Maverick: Mahathir Mohamad in Turbulent Times,” Palgrave Macmillan, 2010. ISBN 0-230-23873-4. 41 R. S. Milne and Daine Mauzy, “Malaysian Politics under Mahathir”, Routledge, 1999, ISBN 0-415-17143-1.

13
capita upwards from US$806 to US$4,114. While in 1966, manufacturing sector made-up less than
10% of GDP (mostly industries related to oil and agriculture). By 1997, manufacturing had risen to
25% of GDP whereby 53% of exports consisted of manufactured products.42
Leadership and Economic Development in Nigeria
Nigeria still faces certain development challenges especially on high poverty and unemployment
within its population. Researchers, writers and many scholars have blamed the military regimes of
the 60s, 70s, 80s and 90s, about how they lacked vision and clear-cut policy frameworks for
economic development and diversification but rather fuelled embezzlement, nepotism and
corruption which marred economic development.
Chinua Achebe43
the eminent African novelist and critic linked Nigeria‟s problem to poor
leadership. He did so in his book “The Trouble with Nigeria.” He challenges the resignation of
Nigerians and inspire them to reject old habits which inhibit Nigeria from becoming a modern and
attractive country. He argues that the main trouble with Nigeria is the failure of leadership, because
with good leaders Nigeria could resolve its inherent problems such as tribalism; lack of patriotism;
social injustice and the cult of mediocrity; indiscipline; and corruption.
Similarly, Seteolu in his study explains that in Nigeria, the political elites are not a
productive class, but rely on the control of state structures for economic rewards. 44
He states that
the over politicisation of the Nigerian state is also understood in the context of the unmediated
struggle for power, influence and patronage. The nature of political contest ensured the emergence
of a local governing class without ideological commitment. Rather than pursue political contests
42 J. Panglaykim and K.D. Thomas, "The New Order and the Economy," Indonesia, April 1967, p. 73. 43 Chinua Achebe, "The Trouble with Nigeria," Fourth Dimension Publishers, ISBN-13: 978-9781561474, 2000. 44 D, Seteolu, “The Challenge of Leadership and Governance in Nigeria”, in Odion-Akhaine, S (eds), Governance: Nigeria and the
World, Lagos: CENCOD, 2004.

14
within ideological frameworks, politics became a contested terrain for shallow, self-centered
political gains.
Ake and Onoge examined the Nigerian governing class in their study. They found out that
the governing class has been target of pillory, vilification, condemnation and disdain in view of the
pervasive and persistent socio-economic and political crisis.45
To them, these led to the economic
domain being characterised by huge external debt overhang, net capital flight, disinvestments, food
crisis and insecurity, collapse of social infrastructure, over-devalued national currency, unpopular,
repressive and alienating economic policies, and pervasive poverty.46
Leadership and Economic Development in Singapore
Worldwide, international personalities and various scholars have praised Singapore‟s founding
father, Lee Kuan Yew, for his efforts in the development of the country. Dr Henry A. Kissinger, a
former US Secretary of State called Lee Kuan Yew one of the seminal figures of Asia. He further
states that Lee Kuan Yew, using superior performance started by cleaning up the country,
overcoming the initial hostility of their neighbors and their own ethnic divisions; and raised the per
capita income of the country from $1,000 to $30,000 within 3 decades.
Similarly, Barbara in his book attributes Singapore‟s success to its founding father, Lee
Kuan Yew. He states that nothing would have been possible if not for his vision, dedication,
courage, policies and works.47
Lee Kuan Yew himself, in his memoir, explains his resolve to
develop Singapore, how he embraced market economy, went around attracting foreign investors,
45 Ake, C and Onoge, O. “The Theories and Conception of Leadership”, in Fafowora, et al (eds), Nigeria: In Search of Leadership,
Ibadan: Spectrum Book, 1995. 46 Ibid 47 Barbara Leitch Lepoer, ""Singapore – Industrialization Policy", Washington: Government Printing Office for the Library of
Congress, 1989. Retrieved on 17 January 2016, from http://countrystudies.us/singapore/35.htm

15
provided a conducive environment for investments and industries, and how he managed their
uproarious diversity.
1.6.3 Policy and Economic Development
Policies are often used to address a variety of development issues in other to achieve economic
development. Governments undertake to meet broad economic objectives such as high
employment, and sustainable growth through policies on tax, affordable housing, crime prevention
etc. According to Sheffrin, the scope of economic development includes policies by which a
country improves the economic, political, and social well-being of its people.48
Africa and Southeast Asia
There have been a significant number of researches, on the linkage between policy choices and the
differing economic development performances of Africa and Southeast Asia.
Dirk in his study analysed why Southeast Asia was able to pull it off and Africa could not.
He explains that some of the Asian Tigers: Malaysia, Singapore and Indonesia, in just a few years,
multiplied their food production and created successful export industries. And as these Tigers
started to roar in the 1980s, African exports were collapsing.49
He argues that Africa‟s
geographical factors, greater diversity and poor institutions were responsible for the regions
differing economic indicators. That these factors slowed Africa‟s economic growth. He further
stresses that it was never bad governance and corruption that frustrated Africa‟s economic
development efforts but bad policy decisions. On corruption, he argues that within the same time
that Nigeria and Indonesia were pursuing differing economic policies, that both were competing on
48 A. and Sheffrin, S. M., “Economics: Principles in action”, Pearson Prentice Hall, Upper Saddle River, New Jersey, 2003). 49 Dirk Vlasblom, "The Richer Harvest - Economic development in Africa and Southeast Asia," the African Studies Centre: Leiden,
2013.

16
corruption neck to neck.50
He explained Southeast Asia‟s success as a result of their policies
having three implementation principles: (1) outreach; (2) urgency and (3) expediency - „Outreach‟
to refer to the number of people who benefit directly from measures; „Urgency‟ to refer to
priorities, not plans; and „Expediency‟ to refer to results and not rules.51
The 1993 World Bank report, „East Asian Miracle‟ was an inquiry into the East Asia‟s
rapid economic development. The report analysed the relationship between public policy and
economic growth. It was found out that Asian governments heavily intervened in their rapid
economic growth through policies that were geared towards building human capital, birth control,
agriculture expansion, macroeconomic stability, providing government incentives and subsidies,
export-oriented industrialisation, rapid infrastructuralisation, flexible currency regimes and weak
tax regimes to attract foreign investors.
According to Todaro and Smith52
in “Economic Development,” many issues concerning
economic development have to be addressed through the use of policies. However, polices cannot
thrive under unfavorable conditions no matter how good they were.
Scholars such as Dirk also attributed policymaking and implementation crisis to be the
bane of African polices. Policy formulation in Africa has been marred by lack of professionalism,
roadside declarations, poor prioritisation and lack of stakeholders or experts; while policy
implementation has been marred by political instabilities, policy inconsistencies, policy reversals,
corruption, lack of human and physical resources, and lack of political will from leaders. This is
50 Ibid 51 Ibid 52 Michael Todaro and Stephen Smith, “Economic Development," Pearson Education, Inc., United States of America, 2012. ISBN
13: 978-0-13-801388

17
different from Southeast Asia‟s experience where conducive environment and adequate political
will helped policies to thrive.53
In Malaysia for an example, according to Wain in examining the leadership and policies of
Mahathir Mohammed in his book, the expiry of the Malaysian New Economic Policy (NEP) in
1990 gave Mahathir the opportunity to outline his economic vision for Malaysia. In 1991,
Mahathir announced Vision 2020 [National Development Policy (NDP)], under which Malaysia
would aim to become a fully developed country within 30 years.54
The NDP achieved success out
of one of its main aims, poverty reduction. According to Milne and Mauzy, by 1995, less than 9%
of Malaysians lived in poverty and income inequality.55
Wain further adds that Mahathir's
government also cut corporate taxes and liberalised financial regulations to attract foreign
investment. The economy grew by over 9% per annum until 1997 prompting other developing
countries to try to emulate Mahathir's policies.56
Milne and Mauzy assert further that the economic
target required average economic growth of approximately 7% of GDP per annum.57
Similarly, Panglaykim and Thomas58
in their study assert that in Indonesia, to stabilise the
economy, Suharto‟s administration enlisted a group of mostly American-educated Indonesian
economists, dubbed the "Berkeley Mafia", to formulate key changes in economic policy which was
subsequently termed the New Order. And that through cutting subsidies, decreasing government
debt, and reforming the exchange rate mechanism, inflation was lowered from 60% in 1966 to
19% in 1969.59
With a lack of adequate domestic capital that was required for economic growth,
the New Order reversed Sukarno's economic self-sufficiency policies and opened selected
53 Dirk Vlasblom, "The Richer Harvest - Economic development in Africa and Southeast Asia," the African Studies Centre: Leiden,
2013. 54 Barry Wain, “Malaysian Maverick: Mahathir Mohamad in Turbulent Times,” Palgrave Macmillan, 2010. ISBN 0-230-23873-4. 55 R. S. Milne and Daine Mauzy, “Malaysian Politics under Mahathir”, Routledge, 1999, ISBN 0-415-17143-1. 56 Barry Wain, “Malaysian Maverick: Mahathir Mohamad in Turbulent Times,” Palgrave Macmillan, 2010. ISBN 0-230-23873-4. 57 R. S. Milne and Daine Mauzy, “Malaysian Politics under Mahathir”, Routledge, 1999, ISBN 0-415-17143-1. 58 J. Panglaykim and K.D. Thomas, "The New Order and the Economy," Indonesia, April 1967, p. 73. 59 Ibid

18
economic sectors of the country to foreign investment though the 1967 Foreign Investment Law.60
Suharto subsequently travelled to Western Europe and Japan to promote investment in Indonesia.
The first foreign investors to re-enter Indonesia included mining companies, Freeport Sulphur
Company / International Nickel Company. As a result of the government regulatory frameworks,
domestic entrepreneurs emerged in the late 1960s and early 1970s in the import-substitution, light-
manufacturing sector such as Astra Group and Salim Group.61
The government also invested into
massive infrastructure development (notably the launching of series of Palapa telecommunication
satellites), consequently Indonesian infrastructure in the mid-1990s was considered at par with
China.
They argue further, that Suharto government's health-care programs increased life
expectancy from 47 years (1966) to 67 years (1997) while cutting infant mortality rate by more
than 60%. The government's Inpres program launched in 1973 resulted in primary school
enrollment ratio reaching 90% by 1983 while almost eliminating education gap between boys and
girls. In agriculture, sustained support through far reaching agricultural policies resulted in
Indonesia reaching rice self-sufficiency by 1984.
Nigeria
Between the 60s and 80s, Nigeria‟s development strategy was commissioning development plans
for every 5 years. A considerable number of studies have shown that Nigeria‟s problem has never
been lack of policies but poor implementation. In fact Nigeria has implemented four fixed medium
term national development plans. After them were then SAP (1986 - 1990) and the Rolling Plan
(1990 - 1993).
60 Ibid 61 Ibid

19
Onah in his research critically examined various development plans in Nigeria and
identified those problems that hinder successful implementation of them.62
He stresses that though
1st NDP had feasibility issues, it lacked the financial and human resources for implementation and
was obstructed by the first coup and civil war. Moreover, the leaders then were pre-occupied by
tribalism and nepotism instead of aggressively pursuing the plan. On the second and third plans, he
found out that they were marred by poor implementation. Additionally, lack of resources frustrated
the ambitious 4th
NDP because of the global recession and fall in oil prices of the early 80s.63
Iheanacho in examining why most of the plans failed to meet their objectives and targets
states that Lack of Plan Discipline, Lack of Commitment, Absence of Relevant Data, Over
Ambitious Development Plans, Lack of Continuity of Government Programs, Public Service
Inefficiency, and Poor Public and Private Sector Partnership were responsible.64
Charles Soludo in his study argues that policy inconsistency has been the problem of
Nigeria‟s economic policies. The unsteady regimes within 1960 and 2000 made governments to
overthrow each other and initiate a differing policy from the previous. He further states that during
SAP‟s implementation, the country made progress on reducing poverty and unemployment.
Similarly, Koha in his study, have attributed roadside declarations of Nigerian leaders as
one of the reasons why the country still face many certain development challenges.65
General
Gowon, a former Nigerian Head of State, initiated an indigenisation policy that closed many
foreign businesses in Nigeria and prevented the attraction of foreign capital.66
62 Onah, F. O., “Managing Public Programmes and Projects,” Nsukka: Great AP Express Publishers, 2006. 63 Ibid 64 Iheanacho, E. N., "National Development Planning in Nigeria: An Endless Search for Appropriate Development Strategy,"
International Journal of Economic Development Research and Investment, Vol. 5, No. 2; August 2014. 65 Koha, S, “Nigeria: The Political Economy of Oil”, London: Oxford University Press, 1994. 66 Ibid
20
According to Adeola67
, Nigeria‟s economic challenges despite having implemented all
manners of economic policies is the lack of political will from her leaders. A political will is the
compelling force for sound leadership quality, the ability to do what is right, what is relevant and
what is attainable within the context of patriotic nationalism. Political will often means personal or
group sacrifices. It implies the ability to implement policies that have a nationalistic importance
and relevance without allowing pockets of interest to detract from what should naturally be of
national benefit.68
Singapore
According to Barbara, Lee Kuan Yew initiated key, far-reaching, market oriented policies and
aggressively pursued FDI‟s attraction. These policies, according to him, led to Singapore‟s
transformation within a generation.69
1.7.0 Conceptual Framework
This study is based on East Asia Model of Capitalism and Resource Curse economic theories. East
Asia Model of Capitalism helps to interrogate the theoretical backing of the economic policies that
Singaporean leaders used in transforming Singapore from a third to first world. The Resource
Curse Theory helps to understand why despite having huge deposits of mineral resources and rents
earned from oil, Nigerian leaders have failed to economically develop Nigeria.
67 G.L Adeola, “Politics and Democratization Process in Nigeria: The Prevailing Issues”, LASU Journal of Social Sciences, Vol 6
Nos 1 & 2, August, 2007 68 Salami Issa Afegbua, “The Challenges of Leadership and Governance in Africa,” Vol. 2, No. 9 ISSN: 2222-6990 , September
2012 69 Barbara Leitch Lepoer, ""Singapore – Industrialization Policy", Washington: Government Printing Office for the Library of
Congress, 1989. Retrieved on 17 January 2016, from http://countrystudies.us/singapore/35.htm

21
1.7.1 East Asian Model of Capitalism
The East Asian Model of Capitalism is an economic model where the government invests in
certain sectors of the economy in order to stimulate the growth of new (or specific) industries in
the private sector. It generally refers to the model of development pursued in East Asian
economies such as Singapore, Japan, Taiwan and South Korea.70
Key aspects of the East Asian
model include state control of finance, direct support for state-owned enterprises in "strategic
sectors" of the economy or the creation of privately owned "national champions", export-oriented
industrialisation for growth, massive attraction of foreign capital and a high rate of savings. This
economic system differs from a centrally planned economy, where the state would mobilise its
own resources to create the needed industries which would themselves end up being state-owned
and operated.
Relevance to this study
This is the theoretical basis of Singapore‟s economic development miracle as the government
through subsidies and loans encouraged local production, used tax incentives, provision of
infrastructures and building of human capital to attract foreign investors; and directly supervised
the economy.
1.7.2. Resource Curse Theory
This theory also known as the paradox of plenty, indicates the paradox that countries with an
abundance of mineral resources such as oil, tend to have less economic development than countries
with fewer mineral resources. This happens for many different reasons, including a decline in the
competitiveness of other economic sectors as government tends to abandon them, primary export
70 Paul W. Kuznets, “An East Asian Model of Economic Development: Japan, Taiwan and South Korea,” Economic Development
and Cultural Change, Vol. 36, No. 3, April 1988.
22
dependence, volatility of revenues from the natural resource sector due to exposure to global
commodity market swings, political corruption, conflicts fueled by struggles for resources,
government mismanagement of resources, weak - unstable - corrupt institutions, and seeing
revenues from mineral resources as outputs rather than as inputs to build other sectors. The
resource curse may not be universal for all countries with an abundance of mineral resources, but
for many countries, such as Nigeria, it is real.71
This theory was first propounded by Richard Auty in 1993 to describe how countries rich
in mineral resources were unable to use that wealth to boost their economies and how, counter-
intuitively, these countries had lower economic development than countries without an abundance
of mineral resources.72
Numerous studies, including one by Jeffrey Sachs and Andrew Warner,
have shown a link between mineral resource abundance and poor economic growth and
development. 73
This disconnect between mineral resource wealth and economic growth can be
seen by examining development in several petroleum-producing countries. From 1965 to 1998, in
the OPEC countries, gross national product per capita growth decreased on average by 1.3%, while
in the rest of the developing world, per capita growth was on average 2.2%. 74
Some writers such
as Djankov etal argue that financial flows from foreign aid can provoke effects that are similar to
the resource curse. 75
Abundance of financial resources in absence of sufficient innovation effort in
the corporate sector may also lead to the problem of resource curse.76
71 Jeffrey Sachs, D; Warner, Andrew M, “Natural resource abundance and economic growth, NBER Working Paper 5398, 1995-
02-02. Retrieved on 17 January 2016, from http://ideas.repec.org/p/nbr/nberwo/5398.html 72 Richard M. Auty, “Sustaining Development in Mineral Economies: The Resource Curse Thesis,” London: Routledge, 1993. 73 Sachs, Jeffrey D; Warner, Andrew M (1995-02-02), NBER Working Paper 5398: Natural resource abundance and economic
growth. 74 T Gylfason, "Natural resources, education, and economic development", European Economic Review (Elsevier) 45 (4-6): 847–
59, doi:10.1016/s0014-2921(01)00127-1, 2001. 75 S. Djankov; J.G. Montalvo; M. Reynal-Querol, "The curse of aid", Journal of Economic Growth (Springer) 13 (3): 169–94,
doi:10.1007/s10887-008-9032-8, 2008. 76 Quan Hoang Vuong; Nancy K. Napier, "Resource Curse or Destructive Creation in Transition: Evidence from Vietnam's
Corporate Sector". Management Research Review 37 (7): 642–657. doi:10.1108/mrr-12-2012-0265, July 2014.

23
Relevance to this study:
Resource Curse theory seems relevant in explaining what has been happening to Nigeria and
Singapore in terms of economic development and the rest of Africa and Southeast Asia broadly.
Nigeria, like the theory explains, has an abundance of mineral resources but has not been able to
use it to drive economic development. This is the same with most African countries with abundant
mineral resources. While Singapore with little no mineral resources has been able to diversify her
economy and has been transformed economically from a third to a first world country. This is the
same applies to most Southeast Asian countries.

24
1.7.3 Conceptual Model
Source: the Researcher

25
1.8 Hypotheses
1). Resource-base does not explain the difference between the development levels of Nigeria and
Singapore.
2). Earlier adoption of export-led industrialisation policy by Singapore‟s leadership was a key
determinant of the different levels of development between Nigeria and Singapore.
3). Military-rule interferences negatively affected Nigeria‟s economic development performance,
unlike in Singapore.
1.9.0 Methodology of Research
1.9.1 Research Design
This study utilises historical data to carry out the comparative cases of Nigeria and Singapore. It
has used mixed method research design for data collection and data analysis. Both primary and
secondary data have been used. This study was undertaken between January and July 2016.
1.9.2 Methods of Data Collection
Primary data
Primary data was collected through interviews with Political leaders; Scholars of Economics &
other related fields, and Top Officials from the Nigerian Ministries of Finance & National
Planning Commission. They were interviewed on how policy processes, resource-base and
leadership dynamics influenced the differing development performances of Nigeria and Singapore.
Purposive sampling was used to select the respondents. The sample size is 22 respondents: 6
Political leaders from 6 geopolitical zones of Nigeria; 12 lecturers from 4 Universities in Nigeria,

26
Benin, Lagos, and Ibadan; and 4 top officials from the Nigerian Ministries of Finance & National
Planning Commission. Key emphasis was placed on the sexes and religions of respondents.
Secondary data
Secondary data was collected by analysing the literature in academic journals, policy documents,
periodicals, books, newspapers, and academic papers and magazines, TV and documentaries.
Statistical data was collected from reports and websites such as Nigerian National Bureau
of Statistics (NNBS), Statistics Singapore (SINGSTAT), African Development Bank (AfDB),
African Union Commission (AUC), Asian Development Bank (ADB), United Nations
Development Programme (UNDP), World Bank (WB), Organisation for Economic Co‑operation
and Development (OECD), United Nations Conference on Trade and Development (UNCTAD),
and International Monetary Fund (IMF)
1.9.3 Data analysis
This study used thematic analysis, as well as descriptive & explanatory analysis (mixed method) in
finding out how policy processes, resource-base and leadership dynamics influenced the differing
development performances of Nigeria and Singapore. Qualitative data was analysed using thematic
analysis and the task was to reduce a wide variety of items of information to a more limited set of
attributes in terms of a variable. Quantitative data from existing statistics was analysed using
descriptive and explanatory analysis. All were used to draw conclusions on how leaderships in
both countries were able to influence economic development through their policies and efforts. For
better observation and comparison, statistical tools like graphs, charts and tables will be used.
1.9.4 Research Ethics
The researcher adhered to considerations such as professional practice by ensuring data validity

27
and research instruments reliability. The study observed confidentiality, non-forceful respondent
compliance and consent of the respondent. Research approval was obtained from the University of
Nairobi (UoN).
1.10 Scope and Limitations of study
The researcher interviewed key persons and decision makers in successive Nigerian governments
since 1970. The researcher relied on secondary data for Singapore by accessing a variety of
secondary materials on key policies of the country. In addition, this study focuses on only six key
economic development elements, such as real GDP, per capita income, unemployment, poverty,
literacy rate and life expectancy level.
1.11 Chapter Outline
This study is organised into five chapters.
Chapter one contains the Introduction, Background to the study, Problem Statement, the
Objectives, Justification of Research, Operationalization of Key Terms, Literature Review,
Conceptual Framework and model, Hypotheses, Methodology of Research, Scope and Limitations
of Research, and Chapter Outline.
Chapter two contains an overview of economic development in Africa and Southeast Asia
since 1960. It examines real GDP growth, per capita income growth; reductions in poverty and
unemployment levels; and improvements in literacy and life expectancy levels. It further captures
the leadership dynamics and policy processes of the two regions and how they contributed to the
differing economic development performances.
Chapter three starts with a comparative analysis of the resource-base (land, population and
minerals) of Nigeria and Singapore. It then captures a general overview of economic development
28
in the two countries since 1960. Real GDP growth, per capita income growth; reductions in
poverty and unemployment levels; and improvements in literacy and life expectancy levels of the
two countries are compared. It further captures a general overview of both countries on
diversification, infrastructure, external trade, and inflation.
Chapter four assesses key economic policies of Nigerian and Singaporean leaders from
1960 – 2000 and how they contributed to the two countries differing economic development levels.
It looks at the quality and focus of the policies, as well as their implementation. It also examines
how leadership dynamics influenced the implementation of these policies and contributed to the
countries‟ differing economic development performances.
Chapter five contains the summary, conclusions and recommendations of this study.
29
CHAPTER TWO: AN OVERVIEW OF ECONOMIC DEVELOPMENT IN AFRICA AND
SOUTHEAST ASIA
2.0 Introduction
The former colonies in Africa and Southeast took up the reins of self-rule at more or less the same
time and got off to a similar start in many respects. At the end of the 1950s, they were in the same
stage of economic development. Currently, many Southeast Asian countries have become
developed economies while their sub-Saharan African counterparts continue lagging far behind.
This chapter provides a general overview of economic development in Africa and
Southeast Asia. It examines trends in a wide range of variables including, growths in real GDP and
per capita income, poverty and unemployment levels, and improvements in literacy and life
expectancy levels. By looking at how the two regions differently reached their current status, the
chapter tries to find out how they were able to have differing economic development indicators
despite having been more or less in the same level at the time of independence. This leads to an
examination of the influence of leadership and policy processes on the development performances
of the two regions.
Data used in the chapter was collected from primary and secondary sources. Primary
source was through interviews with 22 respondents while secondary sources included scholarly
papers and regional & international organizations such as ADB, AfDB, AUC, IMF, OECD, UNDP
and World Bank with the findings presented in tabular and graphical forms.

30
2.1 An Overview of Economic Development in the two regions
Africa‟s economic development challenges are mostly characterised by seasonal and concurrent
intra-state conflicts; heavy food importation estimated at US$33 billion in 201077
; high rates of
hunger, corruption78
, poor governance, infrastructure gap; and low manufacturing capacity. It is
quite paradoxical that Africa remains the world's most underdeveloped continent79
despite its
resources, vast arable lands and an outstanding agricultural climate. In most parts of the continent,
natural resources have ended up exacerbating corruption, deepening fractionalisation, and
guaranteeing primary-export-dependence.
Many Southeast Asian countries used to be almost at the same level at independence
(considering GDP, per capita income, unemployment and poverty levels as measurements) with
many African countries. However, some of these Southeast Asian countries such as Singapore,
Malaysia, Thailand and Indonesia have transformed themselves as is clear giving a number of
indicators. Currently, they record high Human Development Indexes (HDI); with magnificent
infrastructures; and have been able to experience rapid rates of industrialisation.
2.1.1 Real GDP growth
Usually, available data divide Africa into North Africa and sub-Saharan Africa.80
As the main
focus of this research is sub-Saharan Africa where Nigeria belongs to, more attention will be given
to the latter.
Sub-Saharan Africa's real GDP growth has been significantly weak compared to Southeast
Asia. Table 2.0 shows that real GDP growth rate of Sub-Saharan Africa within 1961 and 2000 was
77 United Nations Economic Commission for Africa, "Africa remains hungry despite $3billion annual food aid and $33 billion on
food imports," ECA Press Release No. 11/2010 78 Transparency International, “Corruption Perceptions Index 2014. Full table and rankings”. Retrieved on 04 January, 2016, from
http://www.transparency.org/cpi2014/results/ 79 Richard Sandbrook, “The Politics of Africa's Economic Stagnation.” Cambridge University Press, 1985. 80 World Bank, “Data,” http://data.worldbank.org
31
lower than that of Southeast Asia. Sub-Saharan Africa‟s poor performance has been attributed to
the fact that the region suffered from a serious economic downturn between the 1980s and 1990s
(see Figure 2.0). Before this period, GDP growth averaged 4.5% in the 1960s and 4% in the
1970s.81
However, the rate fell to less than 2% in the next two decades with the region
experiencing negative growth in 1983 (-1.15%), 1991 (-0.09%) and 1992 (-1.49%).82
Table 2.0 – Annual Real GDP growth rates of sub-Saharan Africa and Southeast Asia (1961 -
2000)
Samples Annual Real GDP growth rates
Sub-Saharan Africa 35 3.2
Southeast Asia 9 5.48
Source: Ndulu & O'Connell83
Figure 2.0 - GDP growth rate (annual %) in sub-Saharan Africa (1960 – 2014)
Source: World Development Indicators, 2015
81 World Bank, “Data,” http://data.worldbank.org 82 Ibid. 83 Ndulu B. J. & O'Connell S. A., 'Policy plus: African growth performance, 1960-2000' in Ndulu B. J., et al, The Political Economy
of Economic Growth in Africa, 1960-2000, Vol. 1, New York: Cambridge University Press, 2008, p.4.

32
The reason for this poor economic performance can be attributed to many external and
internal factors. First, the oil shocks of the 1970s made many African economies suffer from
skyrocketing inflation. For instance, in DRC, inflation rose from 8% in 1970 to 101% in 1979,
while in Ghana, it rose from 3% in 1970 to 116% in 1977.84
Increased interest rates in the early
1980s also burdened Africa with heavy debt due to a large amount of investment capital and
foreign aid that the region borrowed in the earlier decades. The region‟s external debt rose from
$36 billion by the end of the 1970s to $176 billion in 1998.85
Secondly, there was the era of
sidelining of African economies from mid-1980s to 1990s. The continent had less political
strategic importance to the major world powers after the Cold War ended.86
Therefore,
unconditional economic support from the West reduced significantly; the United States economic
investment in Africa was less than one third of that in Brazil in this period.87
Lastly, there were many internal factors that slowed Africa's economic growth: slowed
foreign investments as many African governments were using protectionist and nationalization
economic strategies, high Aid dependence, corruption, dictatorships and political instabilities.
According to Collier & Gunning, the lack of openness to trade, high policy volatility, and poor
public services also affected negatively on the region's economic performance.88
Another factor
which hindered growth in Africa was poor infrastructure development which hindered growth.89
After the economic hardships, the region's growth rate gradually increased reaching 5% in
the 2000s (see Figure 2.0). The recent economic performance is also positive with more than 4%
84 Dambisa Moyo, “Dead Aid,” New York: Farrar, Straus and Giroux, 2009. p.16. 85 Ibid, p.17 and Harbeson J. W. & Rothchild D., “Africa in World Politics: Reforming Political Order (4th)”, Colorado: Westview,
2009, p.50. 86 Thomson A., An Introduction to African Politics,” London and New York: Routledge, 2006. 87 Ibid. 88 Collier P. & Gunning J. W., “Explaining African Economic Performance”, Journal of Economic Literature, Vol. 37, No. 1,
(1999) p.74. 89 Jerome A., “Infrastructure, Economic Growth and Poverty Reduction in Africa”, Journal of Infrastructure Development, Vol. 3,
No. 2, (2011) p.146.
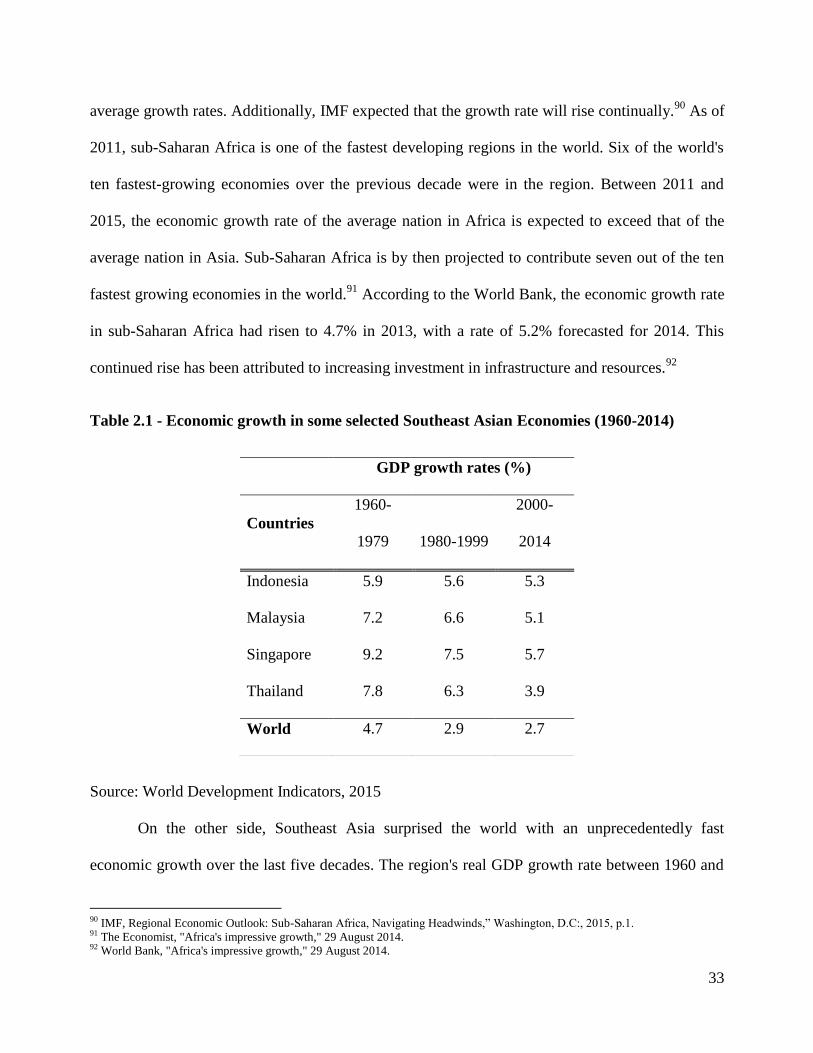
33
average growth rates. Additionally, IMF expected that the growth rate will rise continually.90
As of
2011, sub-Saharan Africa is one of the fastest developing regions in the world. Six of the world's
ten fastest-growing economies over the previous decade were in the region. Between 2011 and
2015, the economic growth rate of the average nation in Africa is expected to exceed that of the
average nation in Asia. Sub-Saharan Africa is by then projected to contribute seven out of the ten
fastest growing economies in the world.91
According to the World Bank, the economic growth rate
in sub-Saharan Africa had risen to 4.7% in 2013, with a rate of 5.2% forecasted for 2014. This
continued rise has been attributed to increasing investment in infrastructure and resources.92
Table 2.1 - Economic growth in some selected Southeast Asian Economies (1960-2014)
Source: World Development Indicators, 2015
On the other side, Southeast Asia surprised the world with an unprecedentedly fast
economic growth over the last five decades. The region's real GDP growth rate between 1960 and
90 IMF, Regional Economic Outlook: Sub-Saharan Africa, Navigating Headwinds,” Washington, D.C:, 2015, p.1. 91 The Economist, "Africa's impressive growth," 29 August 2014. 92 World Bank, "Africa's impressive growth," 29 August 2014.
GDP growth rates (%)
Countries
1960-
1979 1980-1999
2000-
2014
Indonesia 5.9 5.6 5.3
Malaysia 7.2 6.6 5.1
Singapore 9.2 7.5 5.7
Thailand 7.8 6.3 3.9
World 4.7 2.9 2.7

34
2000 was 5.48% (see table 2.0 on page 31). Among 11 economies of the region, table 2.1 shows
that the economies of Indonesia, Malaysia, Singapore and Thailand have been rapidly growing
with GDP growth much above the World's average since 1960. Between 1966 and 1973, in
particular, South Korea and Singapore achieved brilliant economic growth of more than 10%; the
highest growth rate of each country was about 15% (in 1973) and 14% (in 1970) respectively.93
During 1980-1999, when Africa underwent a deep recession with only about 1.8% growth rate, the
countries of these economies experienced robust economic growth with average of 8% of GDP
growth rate.
The region‟s rapid and sustained growth was possible due to several successful policies
implemented in the region. First, the Southeast Asian economies achieved stable macroeconomic
environment, which is essential for private investment. They maintained average annual inflation
rates at about 7.5% for 30 years since 1961 while all low and middle income economies had
average 61.8% of annual inflation rates.94
During this period, inflation rate of sub-Saharan Africa
was 20%95
, which is almost 3 times higher than that of all the economies.
Secondly, there were successful export-oriented industrialisation policies and technology
transfers. They established a pro-export regime using a variety of instruments such as export
credit, duty-free imports for exporters and their suppliers, tax incentives, and export targets. As a
result, their exports of goods and services (% of GDP) surged about 5 times for the last five
93 World Bank, “Data,” http://data.worldbank.org 94 World Bank, “The East Asian Miracle: Economic Growth and Public Policy (Summary),” Washington, D.C.: World Bank, 1993,
p.12. 95 Ibid

35
decades.96
In addition, their active promotion of technology transfers and protection of domestic
firms and markets resulted in producing world-class products.97
Thirdly, they encouraged savings and investment for the accumulation of physical
resources. Since physical resources are highly important to promote rapid growth, they ensured
positive interest rates and investment friendly environment. For instance, during 1970 - 1986,
South Korea, Malaysia, and Thailand maintained their real interest rates between -10 to 10% while
Ghana's real interest rates were highly volatile, between -50 to 10%.98
To promote investment,
they implemented tax policies favoring investment and kept the relative prices of capital goods
low. Lastly, there was a rapid accumulation of high-quality human capital. Their governments
invested not only in primary and secondary education but also in scientific and technological
education to supply skilled manpower.
Unfortunately, between 1997 and 1998, Southeast Asia faced a financial crisis which
stopped the region's high-speed sustained growth. During the crisis, the growth rates of most of the
countries in the region dropped sharply: Malaysia (-7.4%), Singapore (-2.2%), and Thailand (-
10.5%).99
It was explained that a banking crisis in Thailand preceded the currency crisis and the
rest of the region got affected due to their financial vulnerability.100
However, there was a recovery
after the crisis and the economies performed strongly again in the 2000s.
96 Hong Kong: 2.7 times, Indonesia: 1.6 times, Singapore: 1.15 times, South Korea: 16 times, Thailand: 5 times, World Bank, Data,
http://data.worldbank.org 97 Kolluru S. & Rao B., 'East Asian Experience on Growth and Equity: Lessons and Implications', Global Business Review, Vol.12,
No. 2, (2011) p.239. 98 Ibid, p.14. 99 World Bank, “Data,” http://data.worldbank.org 100 Ito T., 'Growth, Crisis, and the Future of Economic Recovery in East Asia' in Stiglitz J. E. & Yusuf S., “Rethinking the East
Asian Miracle,” Washington, D.C.: World Bank and Oxford University Press, 2001, pp.78-81.

36
2.1.2 Real GDP per capita growth
Table 2.2 shows that real GDP per capita growth rate of sub-Saharan Africa within 1960 and 2000
was extremely lower than that of Southeast Asia. In the late 1950s, the average per capita income
in both regions was almost identical. Between 1960 and 2000, some parts of Southeast Asia have
booked spectacular growth while sub-Saharan Africa has stumbled from one economic failure to
another.
Table 2.2 – Real GDP per capita growth rates of sub-Saharan Africa and Southeast Asia
(1960 - 2014)
Samples Real GDP per capita growth rates
Sub-Saharan Africa 35 0.56
Southeast Asia 9 3.41
Source: Ndulu & O'Connell101
Real GDP growth indirectly affects real GDP per capita growth. In this regards, Africa‟s
slowed performance in per capita income growth has been attributed to most of the internal and
external factors discussed in Sub-Section 2.1.1. Included to this was the rapid fertility rates in
Africa within this period. As Africa‟s economic performance in the 2000s started improving,
average per capita income growths also started improving.
On the other side, the GDP per capita growth rate of Southeast Asia was 3.41% between
1960 and 2000. Among the economies of the region, table 2.3 shows that per capita growths of
Indonesia, Malaysia, Singapore and Thailand have been rapidly growing much above the World's
101 Ndulu B. J. & O'Connell S. A., 'Policy plus: African growth performance, 1960-2000' in Ndulu B. J., et al, “The Political
Economy of Economic Growth in Africa, 1960-2000,” Vol. 1, New York: Cambridge University Press, 2008, p.4.

37
average since 1960. Southeast Asia‟s good performance in per capita growth is attributed to most
of the policy processes discussed in Sub-Section 2.1.1. As in the case of real GDP, per capita
income growth slowed between 1997 and 1998, when the region faced a financial crisis. However,
there was stabilization after the crisis.
Table 2.3 – Real GDP per capita growth rates of some Southeast Asian countries (1960 -
2014)
Source: World Development Indicators, 2015
2.1.3 Poverty
Despite recent economic progress, sub-Saharan Africa still has the world's highest rate of extreme
poverty. In 1981, there were more people living with income less than $1.25 a day in East Asia and
Pacific (Southeast Asia) than in sub-Saharan Africa (see figure 2.1). However, the poverty
headcount ratio in Southeast Asia fell sharply below 30% between 1990 and 2002 while the ratio
in sub-Saharan Africa was at 59%. Furthermore, despite the slight decline of the poverty ratio in
sub-Saharan Africa since 2000, the population living with less than $1.25 increased by 180 million
Countries
1960-
1979 1980-1999
2000-
2014
Indonesia 3.3 3.7 3.9
Malaysia 4.4 3.8 3.2
Singapore 7.1 4.8 3.4
Thailand 4.9 4.8 3.3
World 2.8 1.2 1.5
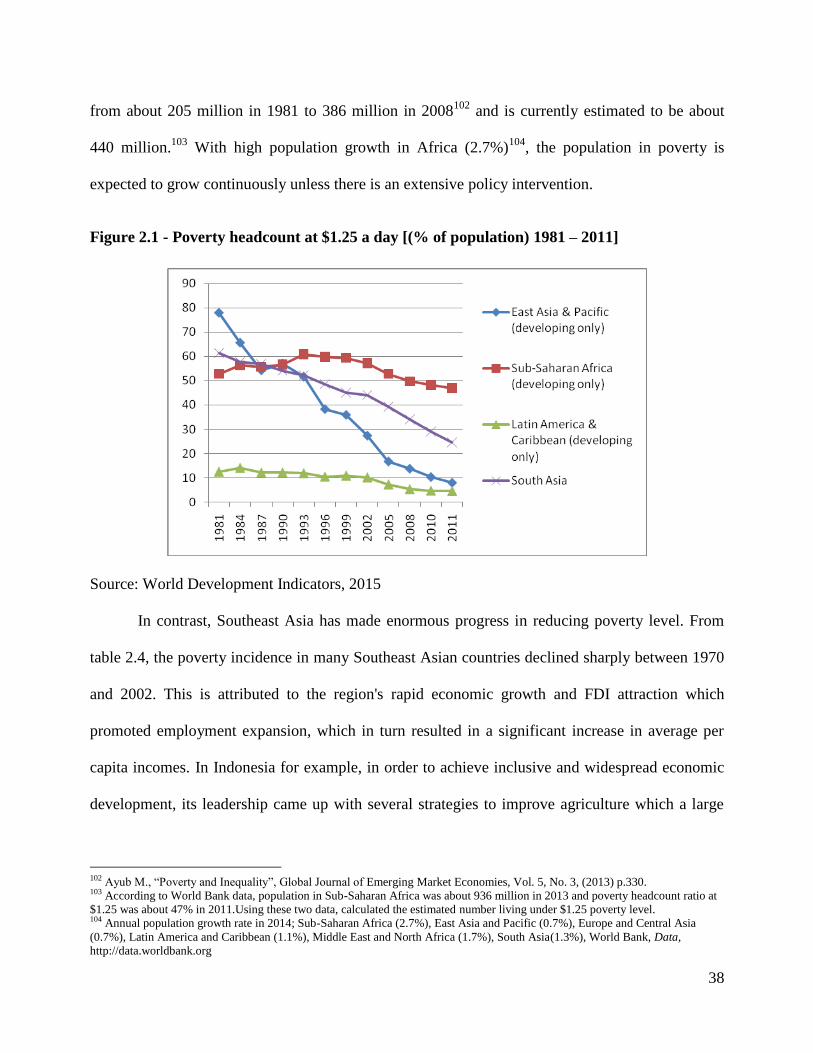
38
from about 205 million in 1981 to 386 million in 2008102
and is currently estimated to be about
440 million.103
With high population growth in Africa (2.7%)104
, the population in poverty is
expected to grow continuously unless there is an extensive policy intervention.
Figure 2.1 - Poverty headcount at $1.25 a day [(% of population) 1981 – 2011]
Source: World Development Indicators, 2015
In contrast, Southeast Asia has made enormous progress in reducing poverty level. From
table 2.4, the poverty incidence in many Southeast Asian countries declined sharply between 1970
and 2002. This is attributed to the region's rapid economic growth and FDI attraction which
promoted employment expansion, which in turn resulted in a significant increase in average per
capita incomes. In Indonesia for example, in order to achieve inclusive and widespread economic
development, its leadership came up with several strategies to improve agriculture which a large
102 Ayub M., “Poverty and Inequality”, Global Journal of Emerging Market Economies, Vol. 5, No. 3, (2013) p.330. 103 According to World Bank data, population in Sub-Saharan Africa was about 936 million in 2013 and poverty headcount ratio at
$1.25 was about 47% in 2011.Using these two data, calculated the estimated number living under $1.25 poverty level. 104 Annual population growth rate in 2014; Sub-Saharan Africa (2.7%), East Asia and Pacific (0.7%), Europe and Central Asia
(0.7%), Latin America and Caribbean (1.1%), Middle East and North Africa (1.7%), South Asia(1.3%), World Bank, Data,
http://data.worldbank.org
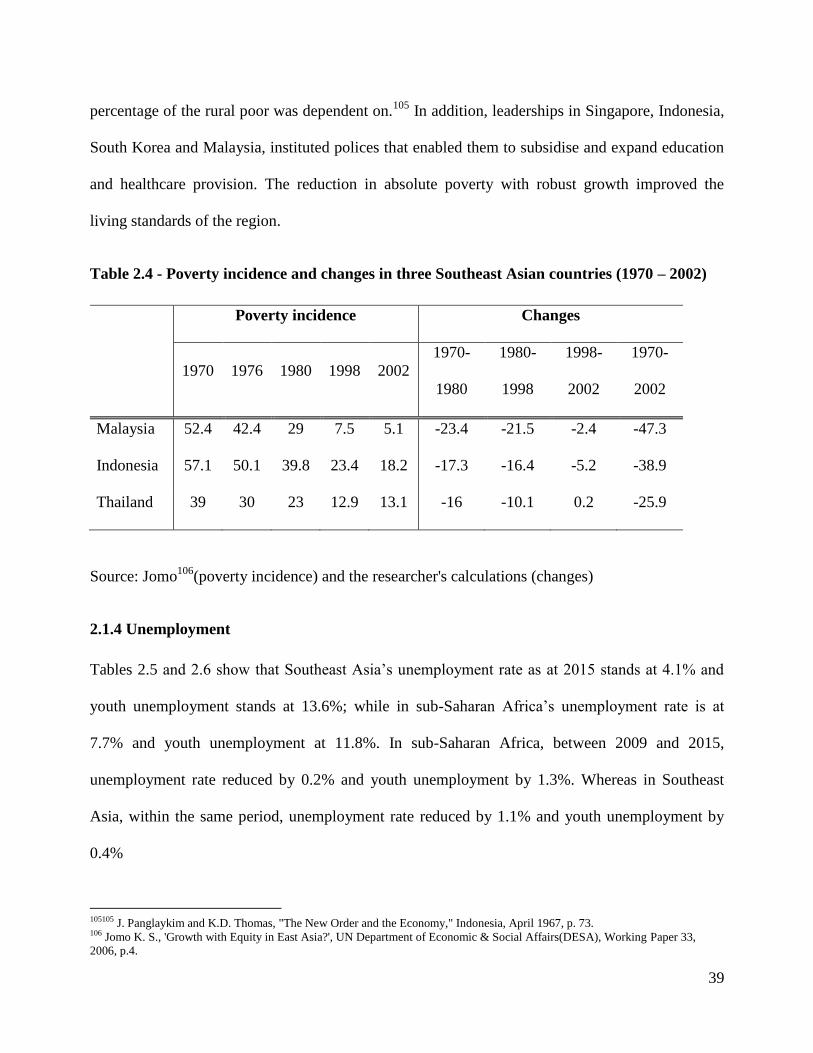
39
percentage of the rural poor was dependent on.105
In addition, leaderships in Singapore, Indonesia,
South Korea and Malaysia, instituted polices that enabled them to subsidise and expand education
and healthcare provision. The reduction in absolute poverty with robust growth improved the
living standards of the region.
Table 2.4 - Poverty incidence and changes in three Southeast Asian countries (1970 – 2002)
Poverty incidence Changes
1970 1976 1980 1998 2002
1970-
1980
1980-
1998
1998-
2002
1970-
2002
Malaysia 52.4 42.4 29 7.5 5.1 -23.4 -21.5 -2.4 -47.3
Indonesia 57.1 50.1 39.8 23.4 18.2 -17.3 -16.4 -5.2 -38.9
Thailand 39 30 23 12.9 13.1 -16 -10.1 0.2 -25.9
Source: Jomo106
(poverty incidence) and the researcher's calculations (changes)
2.1.4 Unemployment
Tables 2.5 and 2.6 show that Southeast Asia‟s unemployment rate as at 2015 stands at 4.1% and
youth unemployment stands at 13.6%; while in sub-Saharan Africa‟s unemployment rate is at
7.7% and youth unemployment at 11.8%. In sub-Saharan Africa, between 2009 and 2015,
unemployment rate reduced by 0.2% and youth unemployment by 1.3%. Whereas in Southeast
Asia, within the same period, unemployment rate reduced by 1.1% and youth unemployment by
0.4%
105105 J. Panglaykim and K.D. Thomas, "The New Order and the Economy," Indonesia, April 1967, p. 73. 106 Jomo K. S., 'Growth with Equity in East Asia?', UN Department of Economic & Social Affairs(DESA), Working Paper 33,
2006, p.4.
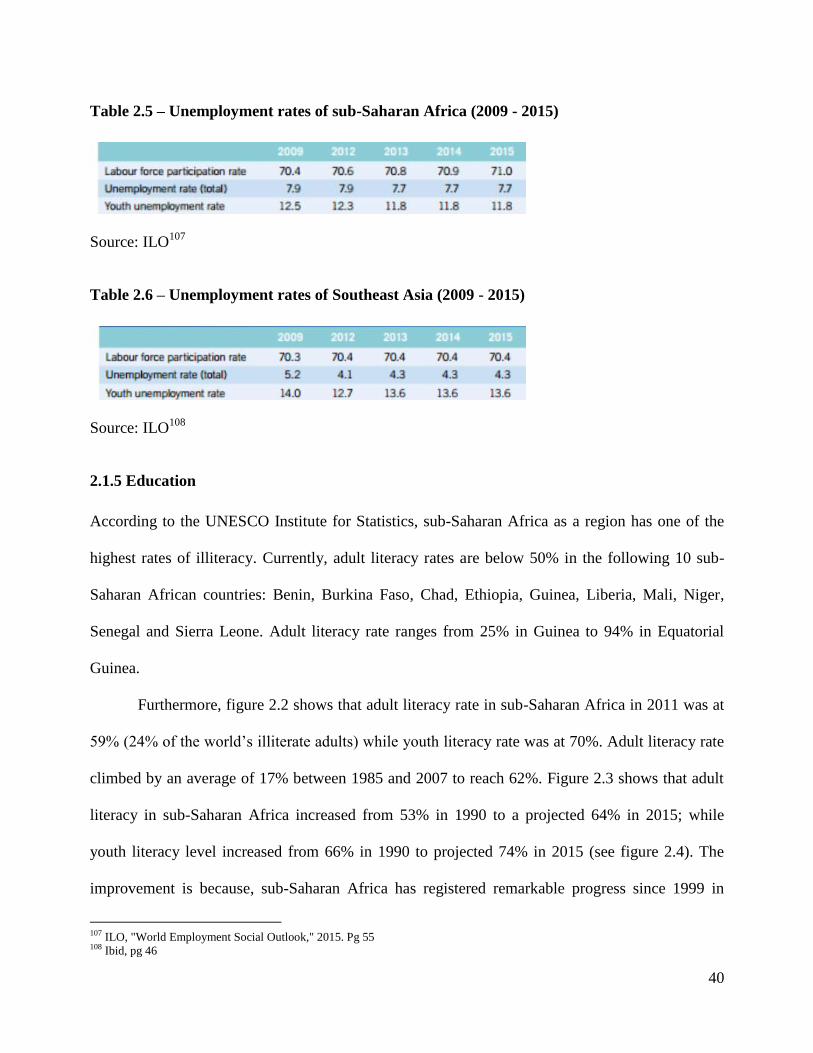
40
Table 2.5 – Unemployment rates of sub-Saharan Africa (2009 - 2015)
Source: ILO107
Table 2.6 – Unemployment rates of Southeast Asia (2009 - 2015)
Source: ILO108
2.1.5 Education
According to the UNESCO Institute for Statistics, sub-Saharan Africa as a region has one of the
highest rates of illiteracy. Currently, adult literacy rates are below 50% in the following 10 sub-
Saharan African countries: Benin, Burkina Faso, Chad, Ethiopia, Guinea, Liberia, Mali, Niger,
Senegal and Sierra Leone. Adult literacy rate ranges from 25% in Guinea to 94% in Equatorial
Guinea.
Furthermore, figure 2.2 shows that adult literacy rate in sub-Saharan Africa in 2011 was at
59% (24% of the world‟s illiterate adults) while youth literacy rate was at 70%. Adult literacy rate
climbed by an average of 17% between 1985 and 2007 to reach 62%. Figure 2.3 shows that adult
literacy in sub-Saharan Africa increased from 53% in 1990 to a projected 64% in 2015; while
youth literacy level increased from 66% in 1990 to projected 74% in 2015 (see figure 2.4). The
improvement is because, sub-Saharan Africa has registered remarkable progress since 1999 in
107 ILO, "World Employment Social Outlook," 2015. Pg 55 108 Ibid, pg 46

41
reducing the number of out of school children by nearly 13% in 2007.109
This was following
current efforts to increase primary and secondary school enrolment figures by African
governments. Total primary school enrolment stood at 124 million in 2007, up by 42 million since
1999.110
Figure 2.2 – Global distribution of adult and youth illiteracy - 2011
Source: UNESCO Institute for Statistics, September 2013
Figure 2.2 further shows that as at 2011, East Asia and the Pacific (Southeast Asia) has
adult literacy of 95% (12% of the world‟s illiterate adults) and youth literacy of 99%. Between
1990 and 2015 in the region, adult literacy grew from 82 to 96%, while youth literacy grew from
95 to 99% (see figures 2.3 and 2.4). Southeast Asia‟s high literacy rate is possible through their
governments‟ earlier efforts in expanding education so as to build human capital. The great record
in human capital building also explains their economic transformation.
109 Global Monitoring Report, "Education for All," 2010. Retrieved on 5 April 2016, from http://en.unesco.org/gem-
report/sites/gem-report/files/gmr2010-fs-ssa.pdf 110 Ibid

42
Figure 2.3 – Global adult literacy (1990 - 2015)
UNESCO Institute for Statistics, September 2013111
Figure 2.4 – Global youth literacy (1990 - 2015)
UNESCO Institute for Statistics, September 2013112
111 UNESCO Institute for Statistics, "Adult and Youth Literacy,” September 2013. 112 Ibid

43
2.1.6 Life expectancy level
With efforts in expanding healthcare so as to build human capital, Southeast Asia was able to have
increasingly higher life expectancy level than Africa. From 1990 to 2013, Table 2.7 shows that life
expectancy grew by 9 from 59 to 68 in Southeast Asia while in Africa, it grew by 8 from 50 to 58.
This shows that Africa is having deep challenges in the health sector.
Table 2.7 – Life expectancy at birth – Africa, Americas and Southeast Asia (1990 – 2013)
Source: WHO (Life expectancy Data) 2013
2.2 Leadership and Economic development in the two regions
Available literature reviewed during the course of this study tends to consider poor leadership as
one of the major factors behind Africa‟s poor economic development performance when paired
with Southeast Asia. They pointed out that committed leaderships enabled Southeast Asia to
aggressively implement comprehensible economic policies which transformed most countries in
the region, unlike in Africa.
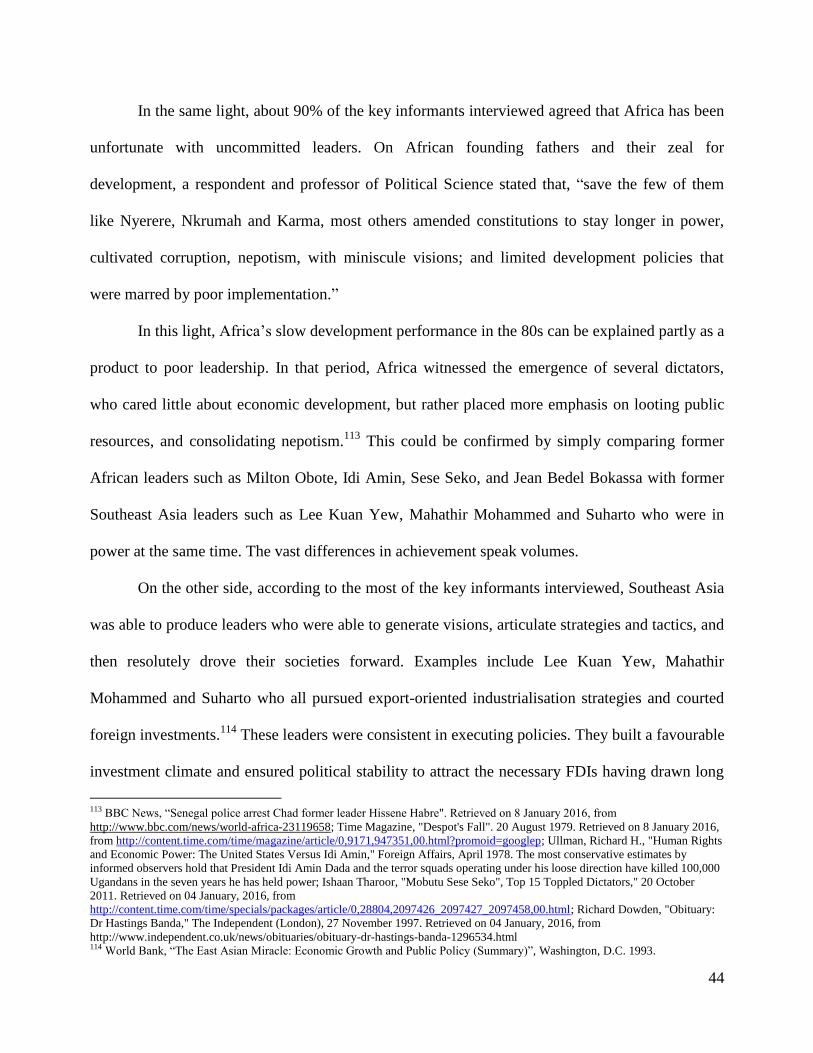
44
In the same light, about 90% of the key informants interviewed agreed that Africa has been
unfortunate with uncommitted leaders. On African founding fathers and their zeal for
development, a respondent and professor of Political Science stated that, “save the few of them
like Nyerere, Nkrumah and Karma, most others amended constitutions to stay longer in power,
cultivated corruption, nepotism, with miniscule visions; and limited development policies that
were marred by poor implementation.”
In this light, Africa‟s slow development performance in the 80s can be explained partly as a
product to poor leadership. In that period, Africa witnessed the emergence of several dictators,
who cared little about economic development, but rather placed more emphasis on looting public
resources, and consolidating nepotism.113
This could be confirmed by simply comparing former
African leaders such as Milton Obote, Idi Amin, Sese Seko, and Jean Bedel Bokassa with former
Southeast Asia leaders such as Lee Kuan Yew, Mahathir Mohammed and Suharto who were in
power at the same time. The vast differences in achievement speak volumes.
On the other side, according to the most of the key informants interviewed, Southeast Asia
was able to produce leaders who were able to generate visions, articulate strategies and tactics, and
then resolutely drove their societies forward. Examples include Lee Kuan Yew, Mahathir
Mohammed and Suharto who all pursued export-oriented industrialisation strategies and courted
foreign investments.114
These leaders were consistent in executing policies. They built a favourable
investment climate and ensured political stability to attract the necessary FDIs having drawn long
113 BBC News, “Senegal police arrest Chad former leader Hissene Habre". Retrieved on 8 January 2016, from
http://www.bbc.com/news/world-africa-23119658; Time Magazine, "Despot's Fall". 20 August 1979. Retrieved on 8 January 2016,
from http://content.time.com/time/magazine/article/0,9171,947351,00.html?promoid=googlep; Ullman, Richard H., "Human Rights
and Economic Power: The United States Versus Idi Amin," Foreign Affairs, April 1978. The most conservative estimates by
informed observers hold that President Idi Amin Dada and the terror squads operating under his loose direction have killed 100,000
Ugandans in the seven years he has held power; Ishaan Tharoor, "Mobutu Sese Seko", Top 15 Toppled Dictators," 20 October
2011. Retrieved on 04 January, 2016, from
http://content.time.com/time/specials/packages/article/0,28804,2097426_2097427_2097458,00.html; Richard Dowden, "Obituary:
Dr Hastings Banda," The Independent (London), 27 November 1997. Retrieved on 04 January, 2016, from
http://www.independent.co.uk/news/obituaries/obituary-dr-hastings-banda-1296534.html 114 World Bank, “The East Asian Miracle: Economic Growth and Public Policy (Summary)”, Washington, D.C. 1993.

45
term economic plans and pursued them vigorously.115
They further went for strong economic
teams for further formation of progressive economic agendas and their implementations. They
made use of their human capital which they developed over time, embarked on reforms and
utilised available natural resources to grow the economy through massive industrialisation.116
2.3 Policy processes and Economic development in the two regions
Policy choices also largely contributed to the differing economic development performances of
Africa and Southeast Asia. In explaining Southeast Asia‟s outstanding economic growth in Sub-
Section 2.1.1 of this Chapter and from the reviewed literature, it was clear that their governments
embraced policies that were led by free market and export growth. This was unlike in Africa where
at the same period, leaders were pursuing policies led by protectionism and nationalisation until
the advent of SAP. A respondent and political economist also stated that “the outstanding
economies in Southeast Asia applied the developmental state‟s model in which there was adequate
state‟s intervention in the process of development.”
Another key difference to the regions‟ differing economic performances was policy making
and implementation. The leaders of Southeast Asia created a conducive environment for policies to
thrive through improving governance; strengthening institutions; providing adequate funding and
skilled workforce; and supervised implementation of these policies. Example is Lee Kuan Yew
who entered office and prioritised infrastructural development, enhanced domestic savings for
development and high-skills acquisition a priority.117
On the other side, African governments have
been having enormous challenges in making and implementing policies based on a number of
factors.
115 Ibid 116 Ibid 117 Lee Kuan Yew, “From Third World to First – The Singapore Story (1965–2000).” Harper Collins, New York, 2000.

46
First, since independence, many African leaders have been engaged in practices that would
have even been against comprehensible policy processes. Practices such as nepotism and
favoritism. Secondly, most of the respondents agreed that issues such as incoherent policies, poor
prioritisation of issues, lack of experts in policymaking and roadside declarations really affected
policy making on the continent. Lastly, policy implementation has been affected by issues like
corruption, political instabilities, weak public institutions, lack of political will from politicians and
policy reversals.
2.4 Conclusion
In consideration of the above findings, it could be concluded that many Southeast Asian countries
have made outstanding economic feats as former third world countries. On the other side of the
coin, Africa has much to do on reducing poverty, expanding infrastructure, creating jobs, and
building human capital. Furthermore, we have been able to see the trends of economic
development in the two regions, where indicators diverged and converged and how Southeast Asia
was able to overtake Africa on economic development.
47
CHAPTER THREE: OVERVIEW OF RESOURCE-BASE AND ECONOMIC DEVELOPMENT IN
NIGERIA AND SINGAPORE
3.0 Introduction
In the previous chapter, we looked at an overview of economic development in Africa and
Southeast Asia. We did this by examining real GDP and per capita income growths; reductions in
poverty and unemployment levels; and improvements in literacy and life expectancy rates. The
important lesson learnt was that through committed leaderships that formulated comprehensible
policies on market economy and export-oriented industrialisation; and ensured clinical
implementation of such policies; Southeast Asian countries were able to make outstanding
progress on economic development unlike African countries.
This chapter examines the cases of Nigeria and Singapore in detail. First, in line with the
first objective of this study, this chapter begins with a comparative analysis of the resource-base
(land, population and mineral resources) of Nigeria and Singapore. The second part of the chapter
looks at an overview of economic development in Nigeria and Singapore. It carefully examines the
selected economic development indicators of this study to achieve this. The third part captures a
general overview of both countries‟ performances on diversification, external trade, inflation and
infrastructure. This is to document a good picture of resource-base and economic development
overview of both countries.
The data used in this chapter was collected from reliable sources such as scholarly papers,
government official data (NNBS, SINGSTAT), regional organizations (AfDB, ADB) and
international organisations (UNDP, UNCTAD, World Bank, IMF). To help readers easily grasp
the findings, they are analysed and presented in tabular and graphical forms.

48
3.1 Comparative analysis of the resource-base of Nigeria and Singapore
3.1.1 Land
Singapore is a very small country and has been battling with severe land shortage. It is almost
1/1000 of Nigeria‟s land size and consists of 63 islands.118
Current land reclamation projects have
increased its land area from 581.5 km2 in the 1960s to 719.1 km
2 in 2015, an increase of some 23%
(130 km2).
119 Current projections show that the country is expected to grow by another 100 km
2 by
2030, making the potential land size 819.1 km2.120
Reclamation projects involve merging smaller
islands to form larger, more functional islands.
Nigeria on the other hand has a total area of 923,768 km2 121
making it the world's 32nd
largest country. This massive land muscle, with favourable climate and arable lands give Nigeria a
big comparative advantage over Singapore in agriculture.
Table 3.0 – Resource-base of Nigeria and Singapore, as at 2015
Land Size Mineral resources Population Labour Force
Nigeria 923,768 km2 Oil, Natural Gas,
Solid Minerals
182 million 74 million
Singapore 719.1 km2 None 5.5 million 3.63 million
Source: the Researcher
118 Savage, Victor R.; Yeoh, Brenda S.A., "Toponymics: A Study of Singapore's Street Names", Singapore: Eastern Universities
Press, 2004, ISBN 978-981-210-364-2. 119 Department of Statistics Singapore, "Statistics Singapore – Latest Data – Population & Land Area (Mid-Year Estimates)", June
2014. 120 Ministry of the Environment and Water Resources, "Towards Environmental Sustainability, State of the Environment 2005
Report (PDF)",
23 June 2011. 121 Central Intelligence Agency, "Rank Order – Area", The World Factbook. Retrieved on 4 April 2016, from
https://www.cia.gov/library/publications/the-world-factbook/rankorder/2147rank.html
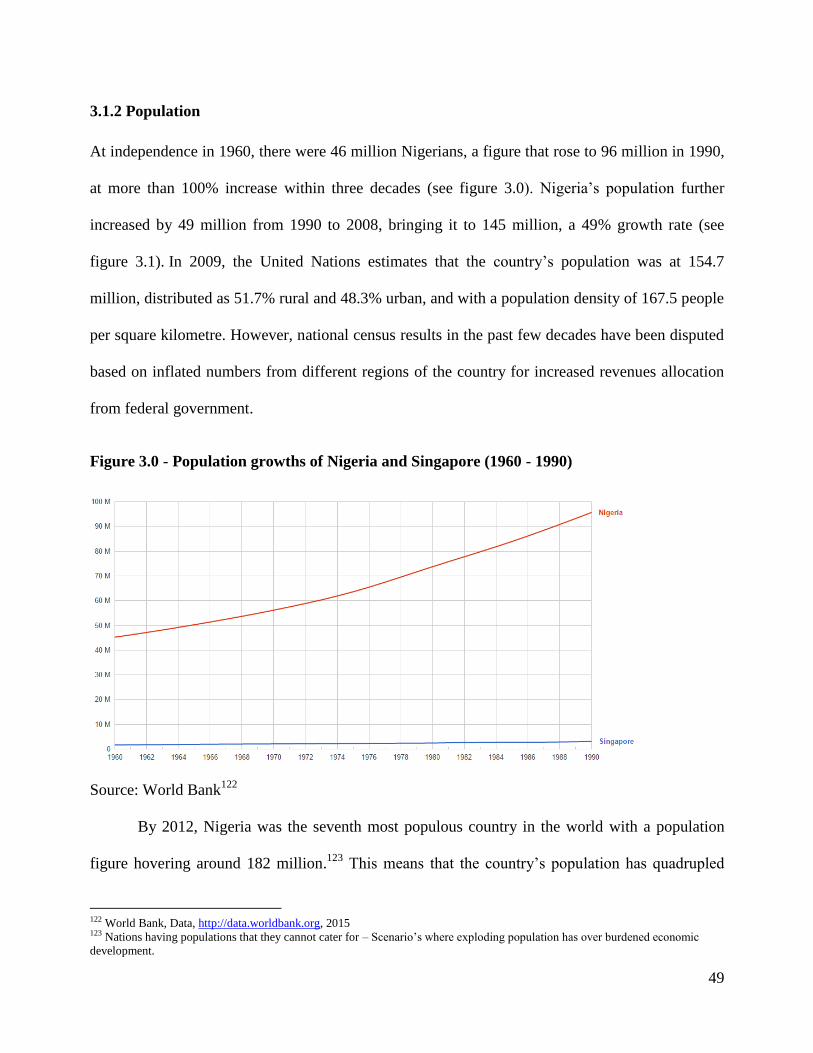
49
3.1.2 Population
At independence in 1960, there were 46 million Nigerians, a figure that rose to 96 million in 1990,
at more than 100% increase within three decades (see figure 3.0). Nigeria‟s population further
increased by 49 million from 1990 to 2008, bringing it to 145 million, a 49% growth rate (see
figure 3.1). In 2009, the United Nations estimates that the country‟s population was at 154.7
million, distributed as 51.7% rural and 48.3% urban, and with a population density of 167.5 people
per square kilometre. However, national census results in the past few decades have been disputed
based on inflated numbers from different regions of the country for increased revenues allocation
from federal government.
Figure 3.0 - Population growths of Nigeria and Singapore (1960 - 1990)
Source: World Bank122
By 2012, Nigeria was the seventh most populous country in the world with a population
figure hovering around 182 million.123
This means that the country‟s population has quadrupled
122 World Bank, Data, http://data.worldbank.org, 2015 123 Nations having populations that they cannot cater for – Scenario‟s where exploding population has over burdened economic
development.

50
since its independence. It also means that Nigeria has been recording one of the highest population
growth and fertility rates in the world. Currently as the most populous country in Africa, Nigeria
accounts for about 18% of the continent's total population. One in five Africans is a Nigerian.124
The country‟s massive population size has always provided a large labour force for economic
productivity which is an immense advantage. In the second quarter of 2015, the country‟s labour
force was 74 million.125
However, it has also slowed the country‟s efforts to fight poverty and
reduce unemployment rate.
Figure 3.1 - Population growths of Nigeria and Singapore (1990 - 2014)
Sources: World Bank126
Compared to Nigeria, as of mid-2015, the estimated population of Singapore was 5.5
million, 3.4 million (60.98%) of whom were citizens, while the remaining 2.1 million (39.02%)
were permanent residents (527,700) or foreign students/foreign workers/dependants (1.6
124 BBC News, "What do you think of Nigeria?", 16 June 2006. Retrieved on 7 February 2016, from
http://news.bbc.co.uk/2/hi/africa/5072244.stm 125 National Bureau of Statistics, "Labour Productivity Report," August 2015. Retrieved on 4 April 2016, from
http://www.nigerianstat.gov.ng/pages/download/319 126 World Bank, Data, http://data.worldbank.org, 2015

51
million).127
At self-rule in 1959, Singapore‟s population was 2 million, a figure that has been
growing slowly over the following years based on governmental efforts to make certain that
population explosion does not overburden economic development (see figure 3.0). The median age
of Singaporean residents is 39.3,128
and the total fertility rate is estimated to be 0.80 children per
woman in 2014, the lowest in the world and well below the 2.1 needed to replace the population.129
To overcome this problem, the Singapore government has been encouraging foreigners to
immigrate to Singapore for the past few decades. As at June, 2015, the country‟s labour force was
3.63 million, very miniscule to be compared with that of Nigeria.130
3.1.3 Mineral resources
It is expected that a country‟s endowment with mineral resources will be an immense advantage as
it would help to fast track economic growth and development.
While Singapore has no single deposit of mineral resources, and was importing water from
Malaysia in the 1960s, Nigeria has enormous mineral resources such as oil, natural gas,
coal, bauxite, tantalite, gold, tin, iron ore, limestone, niobium, lead and zinc. Singapore‟s only
competitive advantage is its geography which makes its Port one of the most strategic, for trade in
the region. The Port of Singapore is currently the third-busiest in the world by cargo tonnage.
Though most of Nigeria‟s resources are underexploited, Nigeria is the 11th
largest producer
of petroleum in the world and the 8th
largest exporter. According to the United States Energy
Information Administration (EIA), Nigeria's proven oil reserves are estimated at between 16 and
127 Statistics Singapore, "Statistics Singapore – Latest Data – Population & Land Area (Mid-Year Estimates)", June 2014. Retrieved
on 6 February 2016, from http://www.singstat.gov.sg/statistics/latest-data#14 128 Statistics Singapore, "Statistics Singapore – Latest Data – Resident Population Profile", June 2014.
Retrieved on 26 February 2016, from http://www.singstat.gov.sg/statistics/latest-data#15 129 Central Intelligence Agency, "The World Factbook". Retrieved on 26 February 2016, from
https://www.cia.gov/library/publications/the-world-factbook/rankorder/2127rank.html 130 Department Of Statistics Singapore, "Singapore Employment Labour as at June 2015," 2015. Retrieved on 4 April 2016, from
http://www.singstat.gov.sg/statistics/latest-data#4
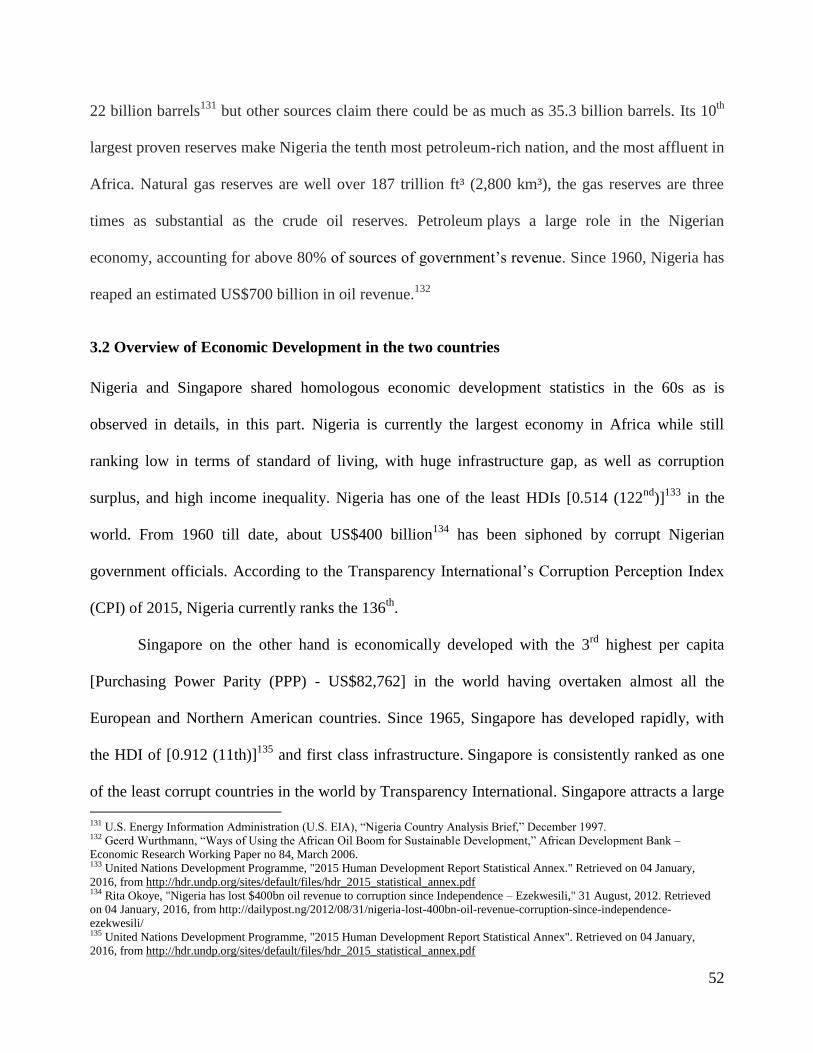
52
22 billion barrels131
but other sources claim there could be as much as 35.3 billion barrels. Its 10th
largest proven reserves make Nigeria the tenth most petroleum-rich nation, and the most affluent in
Africa. Natural gas reserves are well over 187 trillion ft³ (2,800 km³), the gas reserves are three
times as substantial as the crude oil reserves. Petroleum plays a large role in the Nigerian
economy, accounting for above 80% of sources of government‟s revenue. Since 1960, Nigeria has
reaped an estimated US$700 billion in oil revenue.132
3.2 Overview of Economic Development in the two countries
Nigeria and Singapore shared homologous economic development statistics in the 60s as is
observed in details, in this part. Nigeria is currently the largest economy in Africa while still
ranking low in terms of standard of living, with huge infrastructure gap, as well as corruption
surplus, and high income inequality. Nigeria has one of the least HDIs [0.514 (122nd
)]133
in the
world. From 1960 till date, about US$400 billion134
has been siphoned by corrupt Nigerian
government officials. According to the Transparency International‟s Corruption Perception Index
(CPI) of 2015, Nigeria currently ranks the 136th
.
Singapore on the other hand is economically developed with the 3rd
highest per capita
[Purchasing Power Parity (PPP) - US$82,762] in the world having overtaken almost all the
European and Northern American countries. Since 1965, Singapore has developed rapidly, with
the HDI of [0.912 (11th)]135
and first class infrastructure. Singapore is consistently ranked as one
of the least corrupt countries in the world by Transparency International. Singapore attracts a large
131 U.S. Energy Information Administration (U.S. EIA), “Nigeria Country Analysis Brief,” December 1997. 132 Geerd Wurthmann, “Ways of Using the African Oil Boom for Sustainable Development,” African Development Bank –
Economic Research Working Paper no 84, March 2006. 133 United Nations Development Programme, "2015 Human Development Report Statistical Annex." Retrieved on 04 January,
2016, from http://hdr.undp.org/sites/default/files/hdr_2015_statistical_annex.pdf 134 Rita Okoye, "Nigeria has lost $400bn oil revenue to corruption since Independence – Ezekwesili," 31 August, 2012. Retrieved
on 04 January, 2016, from http://dailypost.ng/2012/08/31/nigeria-lost-400bn-oil-revenue-corruption-since-independence-
ezekwesili/ 135 United Nations Development Programme, "2015 Human Development Report Statistical Annex". Retrieved on 04 January,
2016, from http://hdr.undp.org/sites/default/files/hdr_2015_statistical_annex.pdf

53
amount of foreign capital, having more than 7,000 Multinational Corporations (MNC) from the
United States, Japan, and Europe. Currently, the Singaporean economy is one of the most
competitive in the world. The 2013 Index of Economic Freedom ranks Singapore as the second
freest economy in the world, behind Hong Kong.
3.2.1 Real GDP growth
Table 3.1 – Time series of Real GDP of Nigeria and Singapore in billion USD (1960 - 2015)
1960 1970 1980 1990 2000 2010 2015
Nigeria 4.1 12 64 31 98 370 485
Singapore 1 3 12 36 49 240 308
Source: World Bank, 2016
Economic growth is traditionally measured by real GDP growth. According to NNBS, after
Nigeria rebased its GDP in 2014, Nigeria‟s GDP was hovering around US$560 billion (see figure
3.3) and was ranked as the largest economy in Africa, surpassing South Africa by a wide
margin.136
However, Nigeria has been a shining example of growth without development as it has
not been able to address poverty, provide social services and improve human capital. Nigeria still
strives in making sure that GDP growth translates into inclusive economic development.
At independence, Nigeria‟s GDP was U$4.1 billion. Between 1960 and1966, the economy
grew at an outstanding average annual rate of 8.3% (led by agriculture) more than the 4% that was
targeted in the 1st National Development Plan (see figure 3.2). However, the Civil War (1967 -
1970) interrupted growth. Few months to the war and during the early days of the war, real GDP
growth slumped from $6.4 billion in 1966 to $5.2 billion in 1967. The 70s era saw Nigeria
136 Data released from the Nigerian statistics office estimate the value of the country‟s economy at around $509 billion for 2013,
which is nearly twice as high as what was estimated earlier. This outdoes the South African GDP of $315 billion for the same year.

54
recording extreme high GDP growth rate. Between 1970 and 1975, the GDP jumped from $12
billion to $27 billion. This was greatly influenced by the oil boom of the early 70s which saw
Nigeria earning enormous oil revenues. GDP performance slowed from the early 80s based on fall
in oil prices, economic mismanagement and global recession; and the economy went into
recession. SAP introduction between 1986 and 1990 helped to stabilise the economic slide.
Between 1980 and 2000, the GDP fell from $64 billion to $44 billion (see figures 3.2 and 3.3).
Growth rate in the 90s was 2.2%. This was through factors such as economic mismanagement and
international oil price fluctuations. The 2000s saw Nigeria recovering and having high growth
rates of 6 – 7% owing to a stable democratic government and sound macroeconomic management,
until the 2014 rebasing.
Figure 3.2 - Real GDP of Nigeria and Singapore in US$ (1960 - 1990)
Source: World Bank137
137 World Bank, “Data,” http://data.worldbank.org

55
Figure 3.3 - Real GDP of Nigeria and Singapore in US$ (1990 - 2014)
Source: World Bank138
In Singapore, its GDP currently stands at $308 billion139
, driven by services and industry.
Between 1960 and 1990, its first government initiated economic reforms that were geared towards
attracting FDIs and industrialisation. This saw Singapore‟s GDP growing from $1 billion in 1960
to $36 billion in 1990 (see figure 3.2). Real growth averaged 8.0% from 1960 to 1999. Growth
slowed down during the Asian financial crisis. However, growth picked up in 1999 after the
financial crisis, with a growth rate of 5.4%, followed by 9.9% for 2000 (see figure 3.3). The 2001
economic slowdown in the United States, Japan and the European Union, as well as the worldwide
electronics slump, reduced the estimated economic growth in 2001 to a negative 2.0%. The
economy expanded by 2.2% the following year, and by 1.1% in 2003 when Singapore was affected
by the Severe Acute Respiratory Syndrome (SARS) outbreak. Subsequently, a major turnaround
which occurred in 2004 allowed it to make a significant recovery of 8.3% growth, although the
actual growth fell short of the target growth for the year with only 2.5%. In 2005, economic
138 World Bank, “Data,” http://data.worldbank.org 139 International Monetary Fund, "Singapore", 2014. Retrieved on 6 January 2016.

56
growth was 6.4%; and in 2006, 7.9%. Altogether, from 1990 – 2014, the GDP grew from $36
billion to $300 billion (see figure 3.3).
3.2.2 Real GDP per capita growth
Table 3.2 – Time series of Nigeria and Singapore on Real GDP Per Capita
1960 1970 1980 1990 2000 2010 2015
Nigeria $92 $223 $800 $321 $377 $2300 $2758
Singapore $400 $925 $5,000 $12,200 $24000 $47,000 $56,319
Source: World Bank, 2016
Of more importance to economic growth is the growth in the ratio of real GDP to the
population which is known as per capita income. Figure 3.4 shows that at independence, Nigeria‟s
per capita income was at $92 to be compared with around $400 for Singapore. The oil boom of the
70s saw Nigeria‟s per capita rise to $800 by 1980 while Singapore‟s was at $5,000 (through its
industrial revolution). The oil prices fall of the early 80s saw Nigeria‟s per capita diminishing
terribly to $321 by 1990. In contrast, by 1990, Singapore‟s per capita income was at an outstanding
$12,200 (see figure 3.4). Between 1990 and 2014, the annual real per capita growth rate of Nigeria
was at 3.3% (see figure 3.5). Nigeria‟s growth rate rose in the 2000s (2000 - 2014) and peaked at
4.6%, which is about double the average growth rate of most other African developing countries
for the same period. This was through macroeconomic stability and economic reforms from 1999.
Currently, Nigeria‟s per capita income is at $2,758 as against Singapore‟s which is at $56,319 (see
figure 3.5).
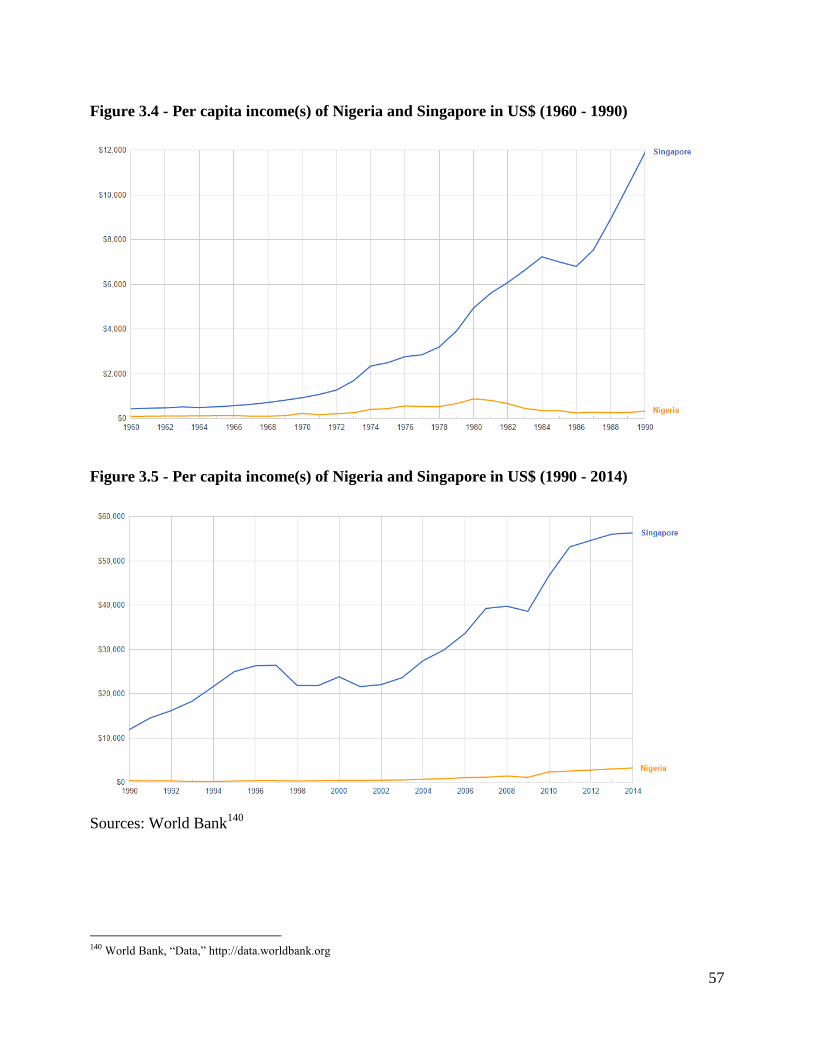
57
Figure 3.4 - Per capita income(s) of Nigeria and Singapore in US$ (1960 - 1990)
Figure 3.5 - Per capita income(s) of Nigeria and Singapore in US$ (1990 - 2014)
Sources: World Bank140
140 World Bank, “Data,” http://data.worldbank.org

58
3.2.3 Poverty
Poverty level is a major economic development indicator. Singapore has not been releasing its
poverty statistics since independence but with such outstanding per capita income; high life
expectancy and high literacy levels, and unemployment at 1.8% (as we discuss below), the number
of Singaporeans living below poverty line is expected to be extremely miniscule. In 2012, one in
thirty Singaporeans was a millionaire, and this is expected to reach one in twenty by 2017.
Singapore‟s successive governments have been sustaining various welfare programs which are
discussed in the next chapter. Such programs would have thoroughly reduced poverty level to the
barest minimum.
In the case of Nigeria, 15% of the Nigerian population was living below poverty line in
1960 (see table 3.3). This percentage shockingly increased to 43% in 1990, because of Nigeria‟s
economic recession in the 80s. This subsequently increased to 70% by 1999 because of slow
economic growth, autarkic policies, economic mismanagement, high debt to GDP ratio from the
early 80s economic downturn and widespread corruption. Nigeria‟s population living below
poverty line currently stands at 33.1% (one third of the population). This means that there are more
poor Nigerians currently than there were at the country‟s independence. However, this reduction
by more than half from 70% was because of sustained economic growth and political stability.
Table 3.3 – Percentage of Nigerians living below poverty line (1960 - 2015)
1960 1990 1999 2015
15% 43% 70% 33.1%
Source: NNBS141
141 Nigerian National Bureau of Statistics - http://www.nigerianstat.gov.ng/

59
3.2.4 Unemployment
Nigeria‟s unemployment rate is currently at 9%142
, though it is largely considered to be far more
than that with the country‟s current FOREX crisis. This is because of overdependence on oil, weak
manufacturing sector and lack of comprehensible policies to address unemployment.
Contradictingly, Singapore‟s unemployment rate at independence was 13%143
and dropped to
1.7%144
within the first three decades, under its first government. This was possible through the
government‟s efforts in providing jobs to Singaporeans through economic reforms that are
discussed in the next chapter. Since then, Singapore traditionally has one of the
lowest unemployment rates among developed countries. The unemployment rate did not exceed
4% from 2005 to 2014, hitting highs of 3.1% in 2005 and 3% in 2009 during the global financial
crisis; it fell to 1.8%145
in the first quarter of 2015.
3.2.5 Education
Economic development theory argues that the promotion of education is critical in developing
human capabilities and achieving economic development. After the 1970s oil boom, primary,
secondary and tertiary education were improved in Nigeria to boost literacy level. Despite this,
literacy rate has dropped from 68% in the 70s to 59.6% (69.2 for males and 49.7 for females) as of
2015 (see table 3.4). This could be credited to “later” poor governmental maintenance culture of
educational institutions, lack of quality facilities in them, governmental neglects, corruption,
examination malpractices and falling standards.
142 Ibid 143 Statistics Singapore - http://www.singstat.gov.sg/statistics 144 Ibid 145 ChannelNewsAsia, “Unemployment rate dips to 1.8% in Q1: MOM,” 15 June 2015. Retrieved on 14 January 2016, from
http://www.channelnewsasia.com/news/business/singapore/unemployment-rate-dips-to/1915976.html

60
Contradictingly, in Singapore, its government since 1960 has frequently referred to
Singapore's population as its only natural resource and described education in the vocabulary of
resource development. The goal of the education system was to develop the talents of every
individual so that each could contribute to the economy and to the country‟s ongoing struggle to
make Singapore productive and competitive in the international marketplace.146
Singapore‟s literacy rate increased from 52% in 1960 to 90% in 1990 and currently at
100% in 2015 (see table 3.4). This was because of intense governmental efforts. Education for
primary, secondary, and tertiary levels is mostly supported by the state. Some 4% of the GDP was
devoted to education in 1987. The government's goal for the 1990s was to increase its spending to
6% of GDP, which would match the levels of Japan and the United States. Students' families had
to purchase textbooks and school uniforms, but special funds were available to ensure that no
student dropped out because of financial need. All instructions were made in English.147
Singaporean students consistently rank in the top five in the world in the two major international
assessments of mathematics and science knowledge.
Table 3.4 – Literacy levels of Nigeria and Singapore (1960 - 2015)
Country 1960 1990 2015
Nigeria - 68% (1970s)148
59.6149
Singapore 52%150
90%151
100%152
146 Barbara Leitch Lepoer, "Education," Washington: Government Printing Office for the Library of Congress, 1989. Retrieved on
17 January 2016, from http://countrystudies.us/singapore/26.htm 147 Ibid 148 United States Library of Congress, "Country Profile – Nigeria", Federal Research Division. July 2008. 149 UNESCO, "Adult literacy rate, population 15+ years (both sexes, female, male)", UIS Data Centre, August 2015. 150 World Bank, “Literacy Indicator.” Retrieved on 6 February 2016, from http://data.worldbank.org/indicator/SE.ADT.1524.LT.ZS 151 Ibid 152 World Bank http://data.worldbank.org/indicator/SE.ADT.1524.LT.ZS

61
3.2.6 Health
The promotion of healthcare is also critical in developing human capabilities and achieving
economic development. The UN emphasises that poor health status can negatively affect a person's
ability to learn at school and the level of productivity.153
With poorer performance in the
workplace and educational attainment, an individual has fewer chances of being productive which
affects overall economic performance.
Figure 3.6 - Life expectancy rates of Nigeria and Singapore (1960 - 1990)
Source: World Bank154
Figures 3.6 and 3.7 show that life expectancy in Nigeria increased from 37.18 years in
1960 to 47 years in 1990 and 53 years as at 2013. This shows that Nigeria is currently having deep
challenges in the health sector. This is in contrast to Singapore where life expectancy was 65 years
in 1960, 74 years in 1990 and 82 years (80 for males and 85 for females) in 2014 (see figures 3.6
and 3.7). Singapore is the 4th
in the world in terms of life expectancy. Just around half of the
153 United Nations, “The Employment Imperative: Report on the World Social Situation 2007”, New York: UN, 2007. pp.98-99 154 World Bank, Data, http://data.worldbank.org

62
Nigerian population have access to untainted water and appropriate sanitation, unlike in Singapore
where almost the whole population have access to these. Nigerians are also amongst the most
travelled in the world for medical tourism because of lack of extensive medical equipments, and
lack of medical practitioners for grave health issues and brain drain.
Figure 3.7 - Life expectancy rates of Nigeria and Singapore (1990 - 2012)
Source: World Bank155
HIV/AIDS rate in Nigeria is much lower compared to many other African nations such
as Kenya or Swaziland whose prevalence (percentage) rates are in the double digits. As of 2012,
the HIV prevalence rate among adults aged 15 – 49 years in Nigeria was just 3.1 per cent.156
As of
2010, Nigeria‟s infant mortality was 8.4 deaths per 1000 live births, against 2.59 in Singapore
(lowest in the world in the past 2 decades).157
In the 2014 Ebola outbreak, Nigeria was the first
country in the region to effectively contain and eliminate the threat. However, the Nigerian
155 Ibid 156 CIA World Factbook, "HIV/AIDS - adult prevalence rate," 2012. Retrieved on 17 February 2016, from
https://www.cia.gov/library/publications/the-world-factbook/rankorder/2155rank.html 157 United Nations Population Fund, "The State Of The World's Midwifery". Retrieved on 17 February 2016, from
http://www.unfpa.org/sowmy/report/home.html

63
healthcare system is continuously faced with a shortage of doctors, because of emigration by
skilled Nigerian doctors to North America and Europe for higher wages. In 1995, it was estimated
that 21,000 Nigerian doctors were practicing in the United States alone, which is about the same as
the number of doctors working in the Nigerian public service.
Singapore has an efficient healthcare system. The World Health Organisation ranks
Singapore's healthcare system as 6th
overall in the world in its World Health Report.158
Singapore‟s
great records in health could be attributed to several government‟s interventions and subsidies
which are explained in chapter 4. A subsidy scheme also exists for those on low income.159
In
2008, 32% of healthcare was funded by the government which accounts for approximately 3.5% of
Singapore's GDP.160
3.3 General overview of both countries’ performances in related Economic Areas
3.3.1 Diversification
Sustainable economic development comes with diversification of the economy. Diversification
helps countries to have more sources of government revenues, have more ways of earning
FOREX; address unemployment and increase per capita income. Every country aspires to diversify
by reducing dependence on primary exports. Diversification is mostly pursued through
industrialisation efforts. One key thing developed countries have in common is competitive
manufacturing and industrial sectors.
Though oil constitutes large percentage of Nigeria‟s export earnings and sources of
government revenue, Nigeria‟s economy tends to be a little bit more diversified than previously
158 World Health Organization, "World Health Organization Assesses the World's Health Systems", Geneva, 21 June 2000.
Retrieved on 2 February 2016, from http://www.who.int/whr/2000/media_centre/press_release/en/index.html 159 World Health Organization, "The World Health Report," 2000. p. 66. Retrieved on 2 February 2016, from
http://www.who.int/whr/2000/en/whr00_en.pdf 160 World Health Organization, "Core Health Indicators Singapore", May 2008.
Retrieved on 2 February 2016, from http://apps.who.int/whosis/database/core/core_select_process.cfm

64
thought. As at 2015, after the 2014 rebasing of the economy, it was found out that agriculture,
industry, and services were leading GDP contribution by 17.8%, 25.7%, and 54.6%,161
respectively. Post independence Nigeria was an agrarian economy with 61% of the GDP on
peasant farming while modern agriculture accounted for 75% exports.
Table 3.5 – Distribution of Nigeria’s GDP by sector, 1960 – 1969 (in %)
Source: Central Bank of Nigeria162
Table 3.6 – Distribution of Nigeria’s GDP by sector, 1970 – 2013 (in %)
Source: UNCTAD163
Tables 3.5 and 3.6 show distributions of Nigeria‟s GDP by sector from 1960 – 2013 (%).
Between 1960 and 1964, industry was at 7.6% and services was at 13.6%. From 1965 to 1969,
agriculture reduced to 53.1% partly because of the civil war, industry increased to 12.1% based on
oil exploration activities that began and services grew by 16.4%.
161 National Bureau of Statistics, "Nigerian Gross Domestic Product Report Q2 2015". 162 Central Bank of Nigeria, “Statistical Bulletin,” 2008. 163 UNCTAD, Technology and Innovation Report,” December 2015

65
From 1970 to 2013, the agriculture share of GDP was further reduced from 27.1% to
21.0%. Industry grew from 19.3% to 26.0%, making it the second largest sector in the country.
However, most of this was attributable to the oil sector: with mining and utilities accounting for
13.7%, and manufacturing having 9.0% (see table 3.6). Services has been hovering around 53%
since 1970.
Industrialisation boomed in the 1970s, despite many infrastructural constraints. Growth
was particularly pronounced in the production and assembly of consumer goods, including vehicle
assembly, and the manufacture of soap and detergents, paint, soft drinks, beer, pharmaceuticals
and building materials. Heavy investment was later planned in steel production.
With Soviet assistance, a steel mill was developed at Ajaokuta in Kogi State. The reliance of the
economy on crude oil exports, led to a shift away from industrial activities of a productive nature,
leading to over-dependence on a single commodity. However, Nigeria aspires to have a developed
economy with a diversified industrial base, and to reduce dependence on oil-based exports. Nigeria
currently has an indigenous auto manufacturing company, Innoson Vehicle Manufacturing located
at Enugu producing buses and SUVs, and cars.
Nigeria's number one policy challenge remains diversifying government sources of revenue
and export earnings (90% of export earnings are from oil as at 2013164
). The country has not
successfully done this since 1970. Successive Nigerian governments have all sang the
diversification song. They have all come up with plans to diversify away from oil but only few of
them have worked. Lack of governmental incentives and basic infrastructure have further
frustrated industrial activities in Nigeria. Diversification remains the surest way of the country to
fight poverty, create jobs and develop.
164 The African Economic Outlook 2013 estimates that oil sector contributes to 8.0 per cent of the average annual growth rate of the
country, as opposed to the -0.35 per cent of the non-oil sector (AfDB, OECD, UNDP and UNECA, 2013, p. 264).

66
In Singapore, the country‟s first government embarked on industrialisation through several
strategies and tactics in order to diversify the economy. Since the 1970s, Singapore‟s economy has
been heavily diversified with its top contributors being financial services, manufacturing, oil-
refining, port services, aviation and tourism. Services and industry constituted 75% and 25% of the
2015 GDP respectively, and 70.6% and 29.4% based on 2013 estimate. Globally, Singapore leads
in so many sectors, including being the 3rd
largest oil-refining and trading centre; the world's
largest oil-rig producer; major hub for ship repair services165
; 3rd
largest foreign exchange centre;
4th
leading financial centre166
; and 2nd
largest casino gambling market167
. Singapore‟s main exports
include electronics, integrated circuits and computers which constituted 27% of the country's GDP
in 2010; refined petroleum; chemicals; and pharmaceutical products.
3.3.2 External trade
A country‟s trade volume greatly shows how productive and diversified its economy is and how
developed the country is. Countries earn FOREX through mainly exports.
Singapore‟s government through economic reforms that were geared towards increasing
export size achieved external trade increase from $7.3 billion in 1959 to $205 billion in 1990168
.
Despite its small size, Singapore's total trade in 2014 amounted to $983 billion as against Nigeria‟s
$145 billion. From this, exports amounted to $519 billion169
as against Nigeria‟s $93 billion170
165 Burton, John, "Singapore economy grows 9.1% in first quarter", Financial Times (London), 10 April 2006. 166 "Global Financial Centres 7", City of London, March 2010. Retrieved on 4 April 2016, from
http://217.154.230.218/NR/rdonlyres/661216D8-AD60-486B-A96F-EE75BB61B28A/0/BC_RS_GFC7full.pdf 167 Adam, Shamim, "Singapore Miracle Dimming as Income Gap Widens Squeeze by Rich", Bloomberg (New York), 10 August
2011. 168 Chan, Fiona; Ching, Choon Hiong. "The Singapore that LKY built" (PDF). The Straits Times. Archived from the original (PDF)
on 29 March 2015. 169 Department Of Statistics Singapore, "Singapore Exports as at 2014", 2015. Retrieved on 2 February 2016, from
http://www.singstat.gov.sg/statistics/latest-data#2 170 CIA, “EXPORTS - PARTNERS: Country Comparison to the World”, The World Fact Book, 2014. Retrieved on 2 February
2016, from https://www.cia.gov/library/publications/the-world-factbook/geos/ni.html

67
while imports amounted to $464 billion (2014)171
as against Nigeria‟s $52 billion
172. Since
Nigeria‟s oil boom, it increased its dependence on oil for export earnings while the
competitiveness in other sectors like manufacturing and agriculture continue declining. Singapore's
principal exports are petroleum products, food/beverages, chemicals, textile/garments, electronic
components, telecommunication apparatus, and transport equipment. Also, Singapore is the 14th
largest exporter and the 15th
largest importer in the world. Nigeria‟s exports include petroleum and
petroleum products, chemicals, vehicles, aircraft parts, vessels, vegetable products, processed food,
beverages, spirits and vinegar, cashew nuts, processed leather, cocoa, tobacco, aluminum alloys.
3.3.3 Inflation
Figure 3.8 – Nigeria – Inflation, Consumer prices (annual %) (1961 - 2014)
Source: IMF, 2015
171 Department Of Statistics Singapore, "Singapore Imports as at 2014", 2015. Retrieved on 2 February 2016, from
http://www.singstat.gov.sg/statistics/latest-data#2 172 CIA, “EXPORTS - PARTNERS: Country Comparison to the World”, The World Fact Book, 2014. Retrieved on 2 February
2016, from https://www.cia.gov/library/publications/the-world-factbook/geos/ni.html

68
Inflation refers to a sustained increase in the general price level of goods and services, in an
economy, over a period of time. It is traditionally measured by Consumer Price Index (CPI). Its
negative effects include a discouragement of investments and savings, and hoarding of goods. The
Southeast Asian success stories were able to bring inflation under control which helped to spur
private investments, as investors were able to count on relatively constant prices. Low inflation is
one the marks of fiscal prudence. Inflation is mostly caused by weak currencies which make
imports costlier, excessive growth of money supply, scarcity of hard currency, capital controls and
hike in the prices of very important commodities like petroleum which directly affects transport
prices.
Figure 3.8 shows that over the past 53 years in Nigeria, this indicator reached a maximum
value of 72.84% in 1995 and a minimum value of -3.73% in 1967. During Nigeria‟s oil boom in
the mid 1970s, the rate of inflation reached 35% and the then military government did not help
matters with its inflationary policies such as the Udoji Awards173
. The Awards unnecessarily put
money in the pockets of civil servants. In the late 70s and early 80s, inflation hovered between
10% and 20% (see figure 3.8). It was brought down to below 10% between 1985 and 1986 through
price control measures. However, the introduction of Structural Adjustment Program (SAP) in
1986 which had devaluation of Naira as one of its components, saw inflation climbing and
reaching the peak of 48% by 1989. It came down between 1990 and 1991 and later went up again
over financial recklessness and excessive money supply in the economy, reaching 72.84% in 1995
(see figure 3.8). Inflation rate in Nigeria averaged 12.11% from 1996 until 2016. The
government‟s debt reduction policies from 1999 to 2007 have to some extent helped to reduce the
hike in the inflation rate, and would have been more effective if not for poor budgetary discipline,
173 Udoji Awards was an enormous increment in the salaries of civil servants in 1972 following a review of the civil service
standards and compensation in the country.

69
corruption and infrastructure gap. In 2012, inflation rate reached 12.90% because of the January
fuel price hike and huge liquidity injections into the economy by federal government.
Figure 3.9 – Nigeria – Inflation, Consumer prices (annual %) (2015 - 2016)
Source: NNBS, 2016
Figure 3.10 – Singapore – Inflation, Consumer prices (annual %) (1961 - 2014)
Source: IMF, 2015

70
As at February 2016, inflation stood at 11.4% (see figure 3.9). It is the highest reading
since December 2012, as Naira continued to depreciate because of low oil prices, severe scarcity of
hard currency, higher food prices and the fact that capital controls imposed by the Central Bank are
hiking up import costs.
While the Nigerian government has barely kept inflation below 2 digits, Singapore has kept
inflation below 6% since its independence except between 1969 and 1976 that inflation reached
22%, and in 1980 when it reached 8.8% (see figure 3.10). This was because of financial prudence
and diversified economy. Figure 3.10 shows that as at 2014, inflation in Singapore was 1%.
3.3.4 Infrastructure
Infrastructure availability remains a key consideration of investors and is essential for domestic
economic performance. Nigeria has been facing a huge infrastructural gap. The whole nation is
marred by dilapidated infrastructures following decades of government‟s neglect. Nigeria currently
lacks steady electricity. This alone has crippled businesses through increasing the cost of doing
business, created capital flight and prevented adequate attraction of foreign investments. There is
no business in Nigeria that runs without a generating set. Nigeria's publicly owned transportation
infrastructure has also been a major constraint to economic development. Of the 80,500 kilometers
(50,000 mi.) of roads, more than 15,000 kilometers (10,000 mi.) are officially paved, and many
remain in poor shape. However, extensive road repairs and new construction activities are
gradually being implemented as state governments, in particular, spend their portions of
government revenue allocations on such. Five of Nigeria's airports - Abuja, Enugu, Kano, Lagos,
and Port Harcourt, currently receive international flights but are still below international standards.
The railway has been in crisis and abandoned by the government. Just until lately, the construction
71
of Standard Gauge Railways is being pursued through partnerships with China and the private
sector.
On the other hand, Singapore‟s first government on entering office focused on building
first class standards of infrastructure to lure investors to the country. This saw Singapore pursuing
massive infrastructural programs; created industrial estates; built road networks, upgraded the Port
of Singapore and built a new international airport to attract investors. Through several reforms,
Singapore is currently the major international transport hub in Asia, serving some of the busiest
sea and air trade routes. Changi Airport is an aviation centre for Southeast Asia and hosts a
network of over 100 airlines connecting Singapore to some 300 cities in about 70 countries and
territories worldwide. It has been rated one of the best international airports by international travel
magazines, including being rated as the world's best airport for the first time in 2006 by Skytrax.174
3.4 Conclusion
In consideration of the above findings, it could be concluded that Singapore has made outstanding
economic progress as a former third world country. Nigeria on the other hand has much to do
regarding poverty reduction, job creation, expanding infrastructure, and improving health and
education conditions. Furthermore, from examining economic development performances of
Nigeria and Singapore in this chapter, there is a cascade of development similarities from Africa
and Southeast Asia‟s examination in the former chapter. Finally, the findings show that according
to the first hypothesis of this study, resource-base does not explain the difference between the
development levels of Nigeria and Singapore. This is because, a contrast would have meant that
Nigeria should have outperformed Singapore by wide margins.
174 World Airport Awards, "2006 Airport of the Year result", 31 December 2006. Retrieved on 18 February 2016, from
https://web.archive.org/web/20061231160516/http://www.worldairportawards.com/Awards-2006/AirportYear-2006.htm

72
CHAPTER FOUR: AN ASSESSMENT OF KEY ECONOMIC POLICIES OF NIGERIAN AND
SINGAPOREAN LEADERS (1960 – 2000)
4.0 Introduction
In the previous chapter, we comparatively analysed the resource-base of Nigeria and Singapore,
and also captured an overview of economic development in both countries. The important lesson
learnt was that despite having small land size, small population and no mineral resources,
Singapore was able to develop rapidly and outperform Nigeria with outstanding statistics in all
economic development areas examined except on real GDP. This is very surprising considering
Nigeria‟s massive land size, bigger population and enormous mineral resources.
This chapter examines the paradox of how a small-state of Singapore with limited resource-
base outperformed Nigeria with enormous resource-base. In line with objective two of this study,
this chapter evaluates key economic policies of different Nigerian and Singaporean leaders
between 1960 and 2000 with the objective of finding out how such policies contributed to the two
countries different economic development levels as discussed in chapter 3. The chapter further
examines the quality and focus of the policies, as well as the implementation element. In chapter
two, it was observed that Southeast Asian countries were able to make outstanding progress on
economic development unlike African countries largely due to committed leaderships and
comprehensible market economy and export-oriented industrialisation policies. In this light, this
chapter also examines whether Singapore made its quintessential economic development
performance through such, unlike Nigeria. Finally, in line with objective three of this study, this
chapter examines how leadership dynamics in both countries influenced their economic
development performances.

73
The data used in this chapter was collected from primary and secondary sources. Primary
data was collected through interviews with 22 respondents, while secondary data was collected
from scholarly papers, government official data (NNBS, SINGSTAT), regional organizations
(AfDB, ADB) and international organisations (UNDP, UNCTAD, World Bank, IMF). To help
readers easily grasp the findings, they are analysed and presented in tabular and graphical forms.
4.1 An Evaluation of key economic policies of Nigerian leaders
Since independence, Nigeria has used several National Development Plans (NDP) and visions in
its search for an appropriate development strategy. A wide range of models were experimented
between175
between 1960 and 2000, including nationalisation, indigenisation, self-reliance, import-
substitution, free market strategy among others - through the 1st, 2
nd, 3
rd and 4
th NDPs;
Indigenisation Decree; the Green Revolution Program (GRP); Economic Stabilisation Program
(ESP); Operation Feed the Nation (OFN); Structural Adjustment Program (SAP); the Rolling Plan;
and Guided Deregulation. These plans and policies all included economic growth targets, policies
toward socio-economic development and wealth distribution, and a list of proposed public
expenditures. However, these development plans, policies and programs do not seem to have
achieved their expected goals, as the analysis below shows.
4.1.1. 1960 – 1966: Formative Roles – Ist NDP
After independence, Dr Nnamdi Azikiwe became the president with Sir Abubakar Tafawa-Balewa
as the prime minister (see Section 3.2 of Chapter three for Nigeria‟s statistics on per capita income,
life expectancy and poverty, as at 1960). They championed Nigeria‟s first strategy for
industrialisation through commissioning an ambitious 1st NDP in June 1962, for a 5-year period
175 Aremu I, “Development and Political Stability in Kwanashie (ed) Politics and Political Power Relations in Nigeria”, Lagos. Dat
and Partners Logistic Ltd, 2003, 12: 248-262

74
(1962 - 1966). Under the plan, a total investment expenditure of about N2,132 million176
was
projected.
A target growth rate of 4% per annum177
was set for this plan with the objectives of
bringing about equal distributions of national income; generating savings for investments so as to
reduce dependence on external capital, raising enough capital for the development of manpower,
improving the standard of living of the masses, and rapid development of infrastructure.178
The
plan was also designed to lay emphasis on agriculture while allowing a mixed economic system.
The industrialisation strategy was largely based on import-substitution. The plan also sought to
invest in some large-scale industrial projects in energy, mining and transportation.179
Figure 4.0 – Real GDP per capita of Nigeria in US$ (1960 - 1966)
Source: World Bank180
176 O.C. UKAH, "An Appraisal of the Performance of the Nigeria‟s National Rolling Plans in the 90‟s," African Research Review
vol.1(1) 177 Ibid 178 Onyenwigwe P. I., "Principles of Development Administration: Third World Perspectives," Owerri: Ambix Printers Nigeria,
2009. 179 Chicago Daily Defender, "Nigeria Unveils Bold Six-Year Economic Plan", Dec 26, 1962. 180 World Bank, “Data,” http://data.worldbank.org

75
The plan recorded notable achievements which included the execution of projects like the
Port Harcourt Refinery, Jebba Paper Mill, Niger Dam, Sugar Mill in Bacita, Niger Bridge,
construction of a number of trunk „A‟ roads and ports extension.181
These achievements also
included the establishment of the first generation universities: the Universities of Ibadan, Lagos,
Nigeria, Ife; and Ahmadu Bello University by both the federal and regional governments.182
Despite that the collapse of the First Republic in 1966 and the commencement of civil war in 1967
also disrupted the plan, GDP per capita grew from $92.8 to $124 under the plan (see figure 4.0);
and real GDP grew from $4.1 billion to $6.2 billion (see figure 4.1).
Figure 4.1 - Real GDP of Nigeria in US$ (1960 - 1966)
Source: World Bank183
However, the plan could not achieve all its intended objectives and projections as it lacked
sufficient feasibility studies prior to implementation.184
The objectives and targets of the plan were
181 Ogwumike F, "The Effects of Macrolevel Government Policies on Rural Development and Poverty Alleviation in Nigeria,"
Ibadan J. Soc. Sci., 1(1): 85-101, 1995. 182 Ibid 183 World Bank, “Data,” http://data.worldbank.org 184 Ogwumike F, "The Effects of Macrolevel Government Policies on Rural Development and Poverty Alleviation in Nigeria,"
Ibadan J. Soc. Sci., 1(1): 85-101, 1995.

76
too large and over-ambitious and therefore were not commensurate with the financial, technical
and managerial capabilities of the country.185
In addition, 50% of the resources needed to finance
the plan was to come from external sources, and only 14% of that was received because of limited
external capital.186
Ultimately, government they did not have enough time to develop agro-based
industries and further industrial infrastructures for industrialisation before the military intervention.
Still, the administration played a pivotal part in laying a good economic foundation for the newly
independent country.
4.1.2. 1967 – 1975: Yakubu Gowon Years – 2nd
NDP and Indigenisation Policy
General Gowon became the Head of State from 1966, through the civil war (1967 - 1970) and
early days of oil boom. He came in through a military coup. In 1970, he launched the 2nd
NDP
(1970 - 1974) whose goals were to repair a war-devastated economy and to promote the country‟s
socio-economic development, with priorities in agriculture, industry, manpower, transport, and
provision of social services.187
It had a total capital expenditure of about N4 billion and economic
growth was targeted at 6.3% per annum in the period.188
The plan‟s achievements were the successful construction of many federal roads; using the
National Youth Service Corps (NYSC) to tackle fractionalisation crisis; and the introduction of
federal scholarship and loan schemes for Nigerian students, for improvement in education.189
The
real GDP growth rate between 1970 and 1974 averaged 12.3% per year far above what the plan
185 A respondent and politician 186 Ogwumike F, "The Effects of Macrolevel Government Policies on Rural Development and Poverty Alleviation in Nigeria,"
Ibadan J. Soc. Sci., 1(1): 85-101, 1995. 187 Ibid 188 Ibid 189 Tolu Lawal and Abe Oluwatoyin, "National development in Nigeria: Issues, challenges and prospects," Journal of Public
Administration and Policy Research Vol. 3(9), pp. 237-241, November 2011. Retrieved on 8 February 2016, from
http://www.academicjournals.org/article/article1380534762_Lawal%20and%20Oluwatoyin.pdf

77
targeted. GDP per capita income grew from $225 to $440 (see figure 4.2). These growths could be
explained by the 1970s rapid oil industry growth and sharply increasing oil prices.
This second plan recognised the need to promote technology acquisition to boost industrial
activity as the government also invested in large-scale iron and steel plants, petrochemical
companies (in Eleme), fertilizer plants (in the Onu and Kaduna regions), oil refineries (in Warri
and Kaduna regions). However, the continuous oil boom and economic upturn, resulted in a lower
emphasis on industrial development over time and relegated agriculture, as a result of the
expansion of the oil sector.190
Table 3.6 (page 64) shows that from 1970 to 1975, agriculture share
of GDP declined from 27.1 to 18.8% while industry‟s share grew from 19.3 to 24.8 (with mining
share growing from 5 to 7.9%). Additionally, this period also saw a rapid increase in corruption,
mostly bribery, of and by federal government officials (e.g. the “cement armada”191
).
Furthermore, Gowon, inspired by the boom initiated his Indigenisation Decree of 1972,
declaring many sectors of the Nigerian economy off-limits to all foreign investments, and ruled out
more than minority participation by foreigners in several other areas. According to a respondent,
“this scared away investors and made the Nigerian bureaucracy more ineffective because at that
moment, Nigeria did not have adequately trained personnel to occupy policy relevant positions.”
The decree transferred equities from foreigners to locals who had less managerial abilities to grow
the entities. FDIs slowed as foreign investors would not want to concede equities to the policy. The
decree discouraged FDIs and constrained growth in the non-oil sector of the economy.192
190 A respondent, senior civil servant at the National Planning Commission 191 In the summer of 1975, the Lagos port became jammed with hundreds of ships trying to unload cement. This was because,
agents of the Nigerian government had signed contracts with more than 50 different international suppliers for the delivery of a total
of 20 million tons of cement in one year to Lagos, even though its port could only accept one million tons of cargo per year.
Subsequently, the port of Lagos was so badly jammed that basic supplies could not get through. 192 Tolu Lawal and Abe Oluwatoyin, "National development in Nigeria: Issues, challenges and prospects," Journal of Public
Administration and Policy Research Vol. 3(9), pp. 237-241, November 2011. Retrieved on 8 February 2016, from
http://www.academicjournals.org/article/article1380534762_Lawal%20and%20Oluwatoyin.pdf

78
Figure 4.2 – Real GDP per capita of Nigeria in US$ (1970 - 1975)
Source: World Bank193
Shortly after Gowon initiated the 3rd
NDP, on 29 July, 1975, a group of officers overthrew
him justifying their actions on accounts of several scandals and political corruption.
4.1.3. 1975 – 1979: Murtala Muhammed and Olusegun Obansajo Years – 3rd
NDP and OFN
General Muhammed ruled Nigeria from 1975 until his assassination in 1976. He initiated a
comprehensive review of the 3rd
NDP. Singling out inflation as the greatest danger to the economy,
he created plans to reduce the money supply that had been swollen by government expenditures on
public works. Muhammed also immediately announced that his government would encourage the
privatisation of government corporations.
To fight corruption and over-bloating of the Nigerian civil service that was legitimised by
the Gowon government, he also dismissed more than 10,000 public officials and employees
without benefits, on account of age, health, incompetence, or malpractice. About 85% of the
193 World Bank, Data, http://data.worldbank.org

79
respondents agreed that this was the single biggest policy error in the development of Nigeria by
damaging the public service both in capacity and through encouraging corruption.
A respondent and former federal minister commented that “this significantly destroyed the
public and civil service; with some officials being brought to trial on charges of corruption.” To
him, prior to Muhammed‟s regime, the average public servant was assured security of employment
(except for gross misbehaviour) and could look forward to retirement with a comfortable pension.
The dismissals woke public servants to the fact that security of tenure was something that could be
swept away with a stroke of the pen. Since one does not know how long a public service might
last, it was considered better to feather the nest while one had the opportunity. In addition, the
mass sack had an adverse effect on socio-economic development because Nigeria lost skilled and
trained manpower that would have strengthened its institutions.194
After Muhammed‟s assassination, General Olusegun Obasanjo, his deputy was put in
charge of the country and supervised most of the execution process of the 3rd
NDP amidst a
continuous oil boom. The third plan (1975 – 1980) had emphasis being placed on rural
development, revamping agricultural sector and diversification of the economy. N30 billion was
earmarked for the plan and this later increased to N43.3 billion.195
However, like other plans before it, the plan failed to achieve most of its objectives. For
instance, Obasanjo initiated the Operation Feed the Nation program in line with the plan‟s focus on
agriculture and rural development. Through OFN, seed and fertilizer were distributed to farmers to
increase nationwide productivity in farming. The program was intended to strengthen agricultural
production, improve farmer's access to subsidised agro inputs and credit facilities and with the
chief purpose of engendering increased levels of food production throughout the country and
194 O.C. UKAH, "An Appraisal of the Performance of the Nigeria‟s National Rolling Plans in the 90‟s," African Research Review
vol.1(1) 195 Ibid

80
ensuring national food security. However, the program was affected with corruption, poor
governance and thus could not lay the desired foundation in the agric sector.196
During its
implementation, it was alleged that fertilizers meant for poor farmers were either diverted or in
some other instance funds meant for the proper implementation of the program were diverted.197
Table 3.6 (page 64) shows that the agriculture share of GDP which the program intended to
bolster, fell from 18.8% in 1975 to 17.4% in 1980. On diversification, one of the key focuses of the
plan, manufacturing remained at 6.5% between 1975 and 1980 (see table 3.6). Construction sector
fell from 10.4% to 10.0% and the services fell from 56.4% to 54.1%. Meanwhile, from 1975 to
1979, real GDP grew from $28 billion to $47 billion (see figure 3.2, page 54) and per capita
income grew from $437 to $659 (see figure 3.4, page 57). This growth was led by increased
FOREX earnings from oil. On 1 October 1979, Obasanjo handed power to Shehu Shagari, a
democratically elected president.
4.1.4. 1979 – 1983: Shehu Shagari Years – 4th
Plan, GRP and ESP
Shehu Shagari served as the president from 1979 –1983. Under him, the fourth plan (1981 - 85)
was threatened by falling oil revenues. Projected to rise 12.1% annually, exports actually fell to
5.9% during the plan.198
Oil production fell by 43.5% to 1.3m Barrels Per Day (BPD) as against
the estimated 2.3m BDP. Crude oil prices fell by 25% to $30 Per Barrel (PB) as against the plan
estimate of US $40 PB.199
It was projected that $79.449 million would be earned from petroleum
exports between 1980 and 1984, but only $52.78 million was earned.200
As exports declined, the
196 Many of the respondents 197 A respondent, former Special Adviser to President Shehu Shagari 198 O.C. UKAH, "An Appraisal of the Performance of the Nigeria‟s National Rolling Plans in the 90‟s," African Research Review
vol.1(1) 199 Ibid 200 Okigbo, P., "National Development Plan in Nigeria 1960 - 1987," Enugu: Fourth Dimension Publishers Ltd, 1989.

81
capacity to import construction materials and related capital goods also fell, reducing growth in the
construction, transport, communications, utilities, and housing sectors.
The plan recognised the role of social services, health services, etc. with the aim of
bringing about improvement in the living conditions of the people. The plan primarily focused on
greater self-reliance, industrial revolution, development of technology, increased agricultural
productivity, infrastructure expansion, and a reduction in the level of unemployment.201
The 4th
plan projected capital expenditure of about N82 billion.202
In line with the plan, Shagari initiated
programs in transportation, housing, industries and agriculture. He completed the Delta Steel
Complex in 1982, and spent $2 billion on the Ajaokuta Steel Complex.
With regard to transportation, Shagari launched road networks across the country. On
agriculture, he abandoned the OFN of the previous administration and initiated Green Revolution
Program. The GRP was to foster the use of mechanical machinery in farming. Between 1980 –
1985, through the GRP, agriculture share of GDP grew from 17.4% to 23.2%, however, industry
share of GDP declined from 28.5% to 18.2% (see table 3.6). Up to today, the Ajaokuta Steel
Complex is yet to produce even one kg of steel after over 30 years. The necessary transport
infrastructure to support the plant is still not in place. On the GRP, a respondent and academician
stated that “the program was hampered by the prevalence of retired military officers, who had
acquired land as parting gift under the previous administrations.”
Shagari also commissioned social housing schemes known as "Shagari's Housing Estates"
in order to meet the burgeoning housing deficit at the time. On his housing projects, due to poor
political judgment, many of them were built in inaccessible locations in states with opposing
201 Ogwumike F, "The Effects of Macrolevel Government Policies on Rural Development and Poverty Alleviation in Nigeria,"
Ibadan J. Soc. Sci., 1(1): 85-101, 1995. 202 Ibid

82
political parties.203
Also, the housing project was hijacked by politicians masquerading as
contractors who flooded the market with imported cement leveraging on import waivers to defraud
the government. The award of these housing project contracts also provided the platform for what
was then known as the 10% kickback syndrome whereby government officials demanded 10% of
the cost of the contract sum as payment.204
Furthermore, the fall in oil prices and global recession in the early 1980s adversely affected
Shagari‟s agricultural and industrial revolutions. Following this fall, public sector investment was
financed through huge deficits incurred through commercial bank loans, Central Bank of Nigeria
and local contractors. Consequently, there was a sharp increase in number of uncompleted projects
all over the nation. External debt liability increased as Shagari has to continue financing his series
of projects with the help of foreign loans and aid. By 1985, external debt was at N17.3 billion from
an estimate of N3.7 billion in 1981, increasing the debt service ratio from 4.7% in 1981 to 31.7%
in 1985.205
In fact, by 1985 Nigeria‟s external reserves had run close to a level that could hardly
finance more than one and half month import bills. Domestic debt outstanding more than doubled
from N11.4 billion in 1981 to N28.0 billion in 1985.206
In response to the low oil prices, Shagari then initiated an Economic Stabilization Program
to steer the economy towards positive growth. However, in an election year, and because of
corruption and insufficient political will, it was difficult for the Shagari administration to fully
implement its ESP. Key objectives of the ESP program were to limit import licenses, reduce
government spending, raise custom duties, and check leakages. According to a respondent and
deputy director at the Nigerian Ministry of Finance, “the ESP did little to stem the tide of an
203 Onyenwigwe P. I., "Principles of Development Administration: Third World Perspectives," Owerri: Ambix Printers Nigeria,
2009. 204 Okigbo, P., "National Development Plan in Nigeria 1960 - 1987," Enugu: Fourth Dimension Publishers Ltd, 1989. 205 O.C. UKAH, "An Appraisal of the Performance of the Nigeria‟s National Rolling Plans in the 90‟s," African Research Review
vol.1(1) 206 Ibid

83
economic stagflation because the balance of payment did not improve, the country‟s industrial
capacity utilisation was in decline, and manufacturing also had a negative growth.” Shagari met
the GDP at $48 billion and left office with it at $28 billion (see figure 3.2, page 54). At the same
time, GDP per capita got reduced from around $670 to $350 (see figure 3.4, page 57).
Indeed, as the performance of the economy during the 4th
Plan was generally poor, the
period eventually saw an end to major National Development Plans. With allegations of electoral
fraud in the 1983 election and continuous economic hardship, Shagari was overthrown by
General Muhammadu Buhari in a military coup.
4.1.5. 1983 – 1985: Muhammadu Buhari Years
General Buhari was the Head of State from December, 1983 to August, 1985.207
He came in
through a military coup and instituted what became known as a Buharinomics of command and
control economic policy regime (exchange and price controls; rationing of essential commodities;
government ownership and control of banks and insurance, telecommunications, roads and
transport, airline, refineries, manufacturing companies etc.) which worsened the economic
recession that he inherited. He tightened some of the elements of Shagari‟s ESP by further
removing the excesses in national expenditure; halting capital projects; prohibiting borrowing by
state governments; realigning import duties; reducing the balance of payment deficit by curbing
imports; giving priority to the importation of raw materials and spare parts that were needed for
agriculture and industry; and rejecting IMF‟s advice to devalue the naira and liberalising trade.
207 Dawodu.com, "Military Regime Of Buhari And Idiagbon." Retrieved on 6 February 2016, from
http://www.dawodu.com/buhari.htm

84
Buhari strategy was an import-substitution industrialisation which led to many job losses and the
closure of businesses.208
In addition, prices of food and other essential commodities, which fell in the first weeks of
his regime largely because of the presence of soldiers in the marketplaces, returned to or exceeded
their levels before he came in.209
Imported raw materials and spare parts needed to keep factories
running were also lacking.210
Under him, it was almost like a criminal offence to be in possession of foreign currency.211
In the face of continuing shocks especially the fall in oil prices (in the face of huge debt service
payments), relative prices were not allowed to adjust to restore internal and external balances.
Rather, even more controls were imposed with all the gargantuan distortions in the economy (and
industrial capacity utilisation was largely below 20%).212
Generally, his government‟s economic
initiatives were a response to symptoms rather than causes and the larger issue of how to
restructure Nigeria's economy. Instead of alternatively deploying an expansionary public
expenditure, he deepened the already contractionary public expenditure which caused more havoc
on the economy. The economy imploded as poverty worsened. His measures further put the Naira
under serious stress, while giving foreign investors the impression that Nigeria wasn‟t investor
friendly. Buhari was overthrown in a coup led by General Ibrahim Babangida.213
208 BBC News, "Nigeria's Muhammadu Buhari in profile," 17 April 2011. Retrieved on 7 February 2016, from
http://www.bbc.com/news/world-africa-12890807 209 Clifford D. May, "Nigerian Military Is Seen As Losing Support," May 1, 1984. Retrieved on 6 February 2016, from
http://www.nytimes.com/1984/05/01/world/nigerian-military-is-seen-as-losing-support.html 210 Ibid 211 Ibid 212 Charles Soludo, "Can a New Buharinomics Save Nigeria?", Vanguard News, November 19, 2015. Retrieved on 6 February
2016, from http://www.vanguardngr.com/2015/11/can-a-new-buharinomics-save-nigeria/ 213 Britannica.com, "Muhammad Buhari (head of state of Nigeria) - Britannica Online Encyclopedia". Retrieved on 6 February
2016, from http://www.britannica.com/biography/Muhammadu-Buhari

85
4.1.6. 1985 – 1993: Ibrahim Babangida Years - SAP
Babangida ruled Nigeria from August, 1985 until his departure from office on August, 1993. His
government faced little choice but to liberalise the economy and devalue the naira based on IMF‟s
advice, helping Nigeria to begin the journey to a modern market economy. As of then, Nigeria had
been faced with a cataclysmically large international debt as despite over 101 billion US
dollars that has been generated by the oil industry between 1958 and 1983,214
nearly all of these
funds had been siphoned into the private bank accounts.215
Rather than continuing with the fixed 5-year medium term plan, his government adopted
and implemented SAP in 1986 in order to service the country‟s massive debts, of which 44% of all
federal revenue was already servicing.216
SAP was initially designed to cover the period 1986 -
1988, but later extended to 1990.
Figure 4.3 – Real GDP of Nigeria US$ (1980 - 1993)
Source: World Bank217
214 Owah, Emmanuel Onyemaghani, "Government of the Crooks, by the Crooks, for the Crooks", Xlibris, 2011, ISBN 1465352023. 215 A respondent and politician 216 Ibid 217 World Bank, Data, http://data.worldbank.org

86
With SAP came the deregulation of the agricultural sector, elimination of price controls,
privatisation of public enterprises, devaluation of the Naira to aid the competitiveness of the export
sector, removal of import licenses, reduction of tariffs, opening the economy to foreign trade,
promotion of non-oil exports through incentives, and the relaxation of restraints on foreign
investments put in place by the Gowon and Obasanjo governments during the 1970s. Between
1986 and 1990, when SAP was executed, the Nigerian economy actually did grow as had been
hoped, with the export sector performing so well. According to data from NNBS, the economy did
far better under SAP especially in terms of output growth, and in some years even inflation.
Figure 4.4 – Real GDP per capita of Nigeria in US$ (1980 - 1993)
Source: World Bank218
Overall, SAP halted the economic slide by steadying economic growth (see figure 4.3).
There were issues of sequencing of policies, weak institutions that resulted in push back on some
good policies, but elite indiscipline, poor governance and corruption became greater threats to the
218 Ibid
87
heights that could have been achieved.219
A respondent and director at Nigerian National Planning
Commission commented that, “the SAP program by Babangida hoisted a flag of economic
prosperity for Nigeria but it was met with stiff resistance by a populace who were accustomed to
socialist‟s freebies of past governments.” Again, it was not well communicated to the citizens
leading to massive protests and consequently a haphazard implementation.
Though SAP had several austerity measures that hurt most vulnerable Nigerians, though it
was rapid and caused inflation based on devaluation, it ended up opening and helping the Nigerian
economy to start attracting investors, increasing efficiency and competitiveness in production,
reducing governmental role and distortions in the economy, pursuing export led industrialisation,
boosting job creation and leading to the creation of financial institutions for macroeconomic
stability. Figures 4.3 and 4.4 show Nigeria‟s economic performance shortly before SAP, under
SAP (1986 - 1990) and shortly after SAP. The introduction of SAP in 1986 led to an annual GDP
growth rate of 4% between 1988 and 1997 (see figure 4.3). SAP had a positive effect as real GDP
grew at a 5.4% average annual rate from 1986 to 1990. Under SAP, the country‟s real GDP and
per capita income growths that had unimaginable slowed down, picked up. Furthermore,
agriculture grew from 23.2% in 1985 to 24.5% in 1990 and industry grew from 18.2% to 25.8%
(see table 3.6, page 64).
At the end of SAP, a three-year Rolling Plan was introduced for 1990 - 92 in the context of
more comprehensive fifteen to twenty-year plans. A rolling plan, considered more suitable for an
economy facing uncertainty and expeditious change, was revised at the end of each year, at which
point estimates, goals, and projects are added for an additional year. The objectives of the rolling
219 Tolu Lawal and Abe Oluwatoyin, "National development in Nigeria: Issues, challenges and prospects," Journal of Public
Administration and Policy Research Vol. 3(9), pp. 237-241, November 2011. Retrieved on 8 February 2016, from
http://www.academicjournals.org/article/article1380534762_Lawal%20and%20Oluwatoyin.pdf

88
plan were to reduce inflation and exchange rate instability, achieve agricultural self-sufficiency,
maintain infrastructure, and reduce the burden of SAP on the most vulnerable social groups.
The increasing revenues from the sudden jump in oil prices caused by the First Gulf War in
1990 and 1991 should have aided the rolling plan, but it was at best squandered. The Babangida
administration has been widely accused of mismanaging the oil windfall from the Gulf War price
jump, which accounted for about $12.5 billion in revenues.220
Key ingredients of the rolling plan
like agricultural self-sufficiency was not met while inflation, instead of reducing, jumped from 8%
to 44% (see figure 3.8, page 67). Through the First Rolling Plan, Babangida subsequently returned
to an inflationary economic policy and incompletely reversed the deregulatory initiatives he had
set in motion during the heyday of the SAP following mounting pressure. This forced economic
growth to slow down correspondingly, as capital flight resumed posthastly under the influence of
negative real interest rates.221
4.1.7. 1993 – 1998 - Sani Abacha Years
Sani Abacha became the Head of State from 1993 to 1998 through a military coup.222
His regime
is controversial; although it more than doubled Nigeria‟s GDP (see figure 4.5), there were also
alleged widespread human-rights abuses and massive corrupt practices.
The Abacha administration through a Guided Deregulation economic policy recorded
unprecedented economic achievements: through overseeing an increase in the country's foreign
exchange reserves from $494 million in 1993 to $9.6 billion by the middle of 1997,223
reducing the
220 Oyeniyi, Bukola Adeyemi; Falola, Toyin, "Nigeria", ABC-CLIO, February 2015. p. 58. 221 Ibid, p. 58. 222 Paden, John N., "Muslim Civic Cultures and Conflict Resolution," Brookings Institution Press, 2005, p. 240. ISBN 0-8157-
6817-6. 223 Premium Times Nigeria, "Why we honoured Abacha - Nigerian government - Premium Times Nigeria", Retrieved on 8
February 2016, from
http://www.premiumtimesng.com/news/156004-why-we-honoured-abacha-nigerian-government.html

89
external debt of Nigeria from $36 billion in 1993 to $27 billion by 1997,224
bringing all the
controversial privatisation programs of the Babangida administration to halt, reducing an inflation
rate of 54% inherited from Ibrahim Badamasi Babangida to 8.5% between 1993 and 1998 (see
figure 3.8, page 67), all while the nation's primary commodity, oil was at an average of $15 per
barrel.
Figure 4.5 – Real GDP of Nigeria US$ (1993 - 1998)
Source: World Bank225
4.2 Assessing key economic policies of Singaporean leaders
At independence, Nigeria had huge resource potential way above that of Singapore in many ways
and was in a position to outshine the small state. Regardless Singapore‟s weak resource-base, after
separation from Malaysia, Singapore‟s major immediate problem was that of security and threat to
her territorial integrity and political sovereignty. Her large neighbors were all unfriendly, all
224 Ibid 225 World Bank, Data, http://data.worldbank.org

90
pursuing nationalistic policies and issued threats of invasion.226
These neighbors further issued
threats of generating internal political instabilities to undermine the capacity of the country‟s first
government and make sure the country‟s independence did not survive.227
Nigeria did not have this
challenge of territorial insecurity. So Singapore‟s major preoccupation after its separation from
Malaysia was building an army that can protect the country‟s sovereignty.228
Further challenge to
Singapore‟s wellbeing and nationhood was the British withdrawal of their Force Base which was
the major pillar of the economy as discussed below. Other challenges were the rising
unemployment, and diversifying the economy. In explaining Singapore‟s economic
transformation, some of the key economic policies that were deployed by Lee Kuan Yew [first
prime-minister of Singapore (1959 - 1990)] and Goh Chok Tong‟s [second prime-minister of
Singapore (1990 - 2000)] governments are examined in this section.
4.2.1. 1960 – 1990: Lee Kuan Yew’s Years
Export-Oriented Industrialisation Policy
After independence, a major pre-occupation of Lee‟s administration was developing and
industrialising Singapore (see Section 3.2 of Chapter three for Singapore‟s statistics on per capita
income, unemployment, life expectancy and literacy levels, as at 1960). After battling with
unemployment, his administration knew that the best thing to do was to industrialise.229
They first
of all bolstered tourism which was labour intensive by setting up a Tourism Board. Tourism
Industry reduced the unemployment rate minimally. Under the umbrella of export-oriented
226 Lee Kuan Yew, “From Third World to First – The Singapore Story (1965–2000),” Times Edition, pp. 66–88. ISBN 981 204 984
3, 2000. 227 Ibid 228 Ibid 229
Lee Kuan Yew, “From Third World to First – The Singapore Story (1965–2000).” Harper Collins, New York, 2000.
91
industrialisation policy, many key processes, reforms, establishments and factors were
instrumental to his government‟s successful industrialisation of Singapore within a generation.
First, with his rather soft socialist ideas, Lee Kuan Yew re-considered focusing on wealth
creation through market economy rather than wealth distribution.230
Lee‟s economic development
theoretical lens of Neo-Classical Counter-Revolution later shaped his policies that developed
Singapore. This theory enabled him to focus rigourously on attracting FDIs for industrialisation,
technology transfer, boosting exports, providing employment and reducing poverty. This theory
also enabled him to embrace free trade, privatisation, liberalisation and providing support for the
private sector.
Secondly, Lee worked closely with his team of advisers including Dr. Albert Winsemius,
who was his economic adviser, towards designing and implementing an export-led
industrialisation strategy for the county. Through this strategy, they started creating an enabling
environment for investors. For the latter, they established the Economic Development Board
(EDB) in 1961 to formulate and implement national economic strategies, focusing on promoting
Singapore's manufacturing sector.231
The EDB‟s mandate was sourcing investors and promoting
investments. Singapore‟s strategy with the EDB was to develop its export-oriented industries, and
EDB opened its first overseas centres in Hong Kong and New York to be better placed for wooing
foreign investors232
. The EDB subsequently opened offices in other parts of Asia, US and Europe.
Thirdly, subsequent effort of Lee‟s administration was building skilled and advanced
labour for Singaporeans to match the job requirements required by the foreign companies. In
addition, his administration started building first world standards of infrastructure in other to
230 Ibid 231 Ministry of Information, Communications and the Arts, "Singapore Infomap – Coming of Age". Retrieved on 17 January 2016,
from https://www.sg/explore/history_coming.htm 232 Ibid
92
attract investors and encourage private sector growth.233
Fourthly, Lee himself then started making
frequent visits to the United States and meeting her business community to source investors.
MNCs Chiefs‟ complaints of the overregulation by the government, rising value of the S$, too
much job-hopping and too restrictive policy on employing foreign workers were all addressed to
make them invest in Singapore.234
His government subsequently provided export promotion
schemes and sound macroeconomic policies for MNCs.235
Fifthly, his government set up the Jurong Town Corporation to develop Jurong and the
other industrial estates. Relief from Income Tax Act was also initiated giving tax relief for up to
five years and unrestricted repatriation of profits and capital in certain government-favored
industries. Foreign investors were attracted by such tax incentives. Through the Tax Act and
infrastructural expansion, there was an influx of United States‟ firms in Singapore, accounting for
46% of new foreign capital invested in 1972.236
Companies from Western Europe, Japan, Hong
Kong, Taiwan, Malaysia, and Australia also invested capital, and by 1972 one quarter of
Singapore's manufacturing firms was either foreign-owned or joint-venture companies. By late
1970s, 271 factories in Jurong employed 32,000 workers, and there were more than 100 factories
under construction. Most of the factories were into the production of garments, textiles, toys, wood
products and hair wigs.237
Sixthly, another attraction of Singapore for foreign capital was the region's petroleum
resources. Singapore was the natural base for dozens of exploration, engineering, diving, and other
support companies for the petroleum industry in nearby Indonesia, as well as being the oil storage
233
Barbara Leitch Lepoer, "Singapore – Two Decades of Independence", Washington: Government Printing Office for the Library
of Congress, 1989. Retrieved on 17 January 2016, from http://countrystudies.us/singapore/11.htm 234 Lee Kuan Yew, “From Third World to First – The Singapore Story (1965–2000).” Harper Collins, New York, 2000. Page 60 235 Barbara Leitch Lepoer, "Singapore – Two Decades of Independence", Washington: Government Printing Office for the Library
of Congress, 1989. Retrieved on 17 January 2016, from http://countrystudies.us/singapore/11.htm 236 Ibid 237 Ibid

93
center for the region. This enabled Singapore to also attract big oil companies like Shell and Esso
to establish oil refineries in Singapore which by the mid-1970s, it became the third largest oil-
refining centre in the world.238
Seventhly, in addition, his government turned to advantage, the British Force Base
withdrawal by converting some of the military facilities to commercial and industrial purposes and
retraining laid-off workers for new jobs. The former King George VI Graving Dock was converted
to the Sembawang Shipyard, employing 3,000 former naval base workers in ship building and
repair.239
Singapore also moved into shipping in 1968 with its own Neptune Orient Line. A
container complex built in 1972 made the country the container transshipment center of Southeast
Asia.
Eighthly, by the late 70s, General Electric was the highest employer of labour in Singapore.
To encourage competition and standards, Lee‟s administration started removing protection for
domestic industries. After that, their next challenge was improving investments quality and
education-skills of workers. To balance the opening of new EDB overseas centres in Zurich, Paris,
Osaka and Houston between 1971 and 1976, they established a Manpower and Training Unit to
focus on industrial training. The Joint Government Training Centres and Overseas Training
Program with Tata of India, Philips of Holland and Rollei of Germany were also drawn up to place
young Singaporean workers in apprenticeship programmes for knowledge and skills transfer. This
was a significant step forward in Singapore‟s investment promotion programme.240
Ninthly, Lee‟s administration subsequently established the National Productivity Board
(NPB) in 1972 to improve productivity in all economic sectors. Increasing individual and company
238 Ibid 239 Ibid 240 EDB, "The Millennuim." REtrieved on 17 January 2016, from https://www.edb.gov.sg/content/edb/en/why-singapore/about-
singapore/our-history/2000s.html

94
productivity at all levels was prioritised by his administration, given Singapore's full employment
picture and relatively high wages.241
Greater worker productivity than Singapore‟s neighbours and
competitors was viewed by the government as a necessity as well as one of the country‟s major
advantages. The NPB followed a "total productivity" approach, which emphasised productivity
measurement, a flexible wage system, product quality, worker training, and assistance to small-and
medium-sized enterprises.242
In order to promote productivity in both the public and private
sectors, the board used mass media publicity, conventions, seminars, and publications to remind
Singaporeans that productivity must be a permanent pillar of the economy. The board sponsored a
productivity campaign each year with such slogans as the one for 1988, "Train Up--Be the Best
You Can Be."243
Finally, in 1979, after the shock of the two oil crises, Lee‟s administration started programs
of economic restructuring. This was achieved by modifying education policies, offering more
financial incentives to industrial enterprises, and expanding technology and computer education.
The National Computer Board was established in 1981 to make Singapore an international center
for computer services, to reduce the shortage of trained computer professionals, and to assure
standards of international caliber at all levels.
Furthermore, in the 1980s, further economic success continued under Lee‟s administration,
with the unemployment rate falling to 3% and real GDP growth averaging at about 8% (see table
2.1, page 33) up until 1999. Singapore Changi Airport was opened in 1981 as well as the creation
of Singapore Airlines.244
The service and tourism industries also grew immensely during this
period. Singapore emerged as an important transportation hub and a major tourist destination. The
241 Ibid 242 Ibid 243 Ibid 244 Land Transport Authority, "1982 – The Year Work Began." Retrieved on 17 January 2016, from
http://www.lta.gov.sg/content/ltaweb/en.html

95
country maximised its geographical advantage and built one of the busiest seaports in the world,
Port of Singapore. It also embraced technology and coupled with the technology transfer between
the MNCs and Singaporeans, an extremely higher-technological advanced country with industries
such as the wafer fabrication sector was established. His government also established new
industries such as: National Iron and Steel Mills, Development Bank of Singapore, Insurance
Corporation of Singapore and Singapore Petroleum Company.245
Figure 4.6 – Real GDP of Singapore in US$ (1960 - 1990)
Source: World Bank246
The 1980s also saw the EDB co-establishing institutions of technology with Japan, France
and Germany to meet the specialised manpower needs of high-technology industries.247
Coupled
with the Skills Development Fund, these places of learning provided Singaporeans with the right
kind of training for specialised jobs in the electronics and engineering sectors. In 1981, the 65,000
245 EDB, "The Millennuim." REtrieved on 17 January 2016, from https://www.edb.gov.sg/content/edb/en/why-singapore/about-
singapore/our-history/2000s.html 246 World Bank, Data, http://data.worldbank.org 247 Ibid

96
to 70,000 electronics workers comprised about 7% of the labor force; gross production of
electronics at about S$5.9 billion was about 15% of total manufacturing output.248
By 1987
electronics accounted for 28% of manufacturing employment and contributed 31% or S$11 billion
in output.249
By 1989, Singapore had become the world's largest producer of disk drives and disk
drive parts. Other related products included integrated circuits, data processing equipment,
telecommunications equipment, and radio receivers.250
Figure 4.7 – Real GDP per capita of Singapore in US$ (1960 - 1990)
Source: World Bank251
Through these rigorous efforts, by 1997, Singapore had nearly 200 American MNCs with
over $19 billion worth of investments. There are also approximately 1,500 companies from China
and a similar number from India.252
Foreign firms are found in almost all sectors of the country's
248 Ibid 249 Ibid 250 Barbara Leitch Lepoer, ""Singapore – Industrialization Policy", Washington: Government Printing Office for the Library of
Congress, 1989. Retrieved on 17 January 2016, from http://countrystudies.us/singapore/35.htm 251 World Bank, Data, http://data.worldbank.org 252 S. Ramesh, "S'pore is India's second-largest foreign investor". Channel NewsAsia (Singapore), 14 January 2011.
97
economy. Singapore is also the second-largest foreign investor in India.253
Despite market
freedom, Singapore's government operations have a significant stake in the economy, contributing
22% of the GDP. By 1980, real GDP increased to $12 billion and $26,500 billion by 1988 (see
figure 4.6). Real GDP per capita increased to $2647 by 1976 and to $9316 by 1988 (see figure
4.7). There were also unprecedented achievements in employment provision, external trade, life
expectancy rate, inflation control, infrastructure expansion and literacy level. See Sections 3.2 and
3.3 of Chapter three for further discussions on Singapore‟s performance on these between 1960
and 1990.
Financial Policies
Lee‟s administration further worked with his cabinet to establish Singapore as an International
Financial Centre. Foreign bankers were assured of the reliability of Singapore's social conditions,
with top-class infrastructure and skilled professionals, and investors were made to understand that
the Singapore government would pursue sound macroeconomic policies, with budget surpluses,
leading to a strong, stable Singapore dollar.254
Singapore is currently the world‟s 4th
leading financial centre.255
Furthermore, Singapore not spending more that she collects in revenues
has been the guiding principle that all her finance ministers followed. Singapore ended up not
running loose fiscal and monetary policies that enabled it survive few regional and international
financial crisis.
253 Ibid 254 "Global Financial Centres 7", City of London, March 2010. Retrieved on 4 April 2016, from
http://217.154.230.218/NR/rdonlyres/661216D8-AD60-486B-A96F-EE75BB61B28A/0/BC_RS_GFC7full.pdf 255 Ibid
98
Anti-Corruption Policy
Corruption discourages foreign investments and threatens economic development. To attract
investors to Singapore it had to be dealt with thoroughly. At independence, Singapore had
problems of political corruption. In response, Lee‟s administration on entering office, resolved to
run a clean government and administration. They made sure that corruption was not nurtured in the
new Singapore.
They instituted accountability on entering office to make sure that any dollar spent would
be accounted for. Secondly, they tackled corruption head on by managing and reforming the
Corrupt Practices Investigation Bureau (CPIB) that was instituted by the British. They legislation
giving the CPIB greater power to conduct arrests, search, call up witnesses, and investigate bank
accounts and income-tax returns of suspected persons and their families.256
They put a fine on
corrupt practices. This has helped to make Singapore one of the least corrupt countries in the world
along with New Zealand and the Scandinavian countries.
Capital Formation Act Amendment – Central Provident Fund
In Singapore, the Central Provident Fund (CPF) is a mandatory comprehensive savings plan for
working Singaporeans and permanent residents primarily to fund their retirement, healthcare, and
housing needs. CPF was also established to strengthen the country‟s capital formation and
development funding. British colonial authorities in Singapore created the CPF in 1955 as a
compulsory savings scheme to assist workers to provide for their retirement without needing to
256Lee Kuan Yew, “From Third World to First – The Singapore Story (1965–2000).” Harper Collins, New York, 2000. P. 159–163,
647.
99
introduce a more extensive and costly old age pension. From the 60s, Lee‟s government expanded
CPF to provide for affordable housing and medical expenses through expanding the Act.257
When the CPF was started by the British, both employees and employers contributed 5% of
an employee's pay to the scheme. The rate of contribution was progressively increased along with
the growth of Singapore's economy, reaching 25% for both employers and employees in 1985. The
CPF gave Singapore the financial muscle (domestic savings) with which to pursue several
ambitious infrastructural and human capital improvement programs.
Welfare policies
Lee‟s government was convinced to create a fair society where Singaporeans will have access to
shelter and basic things. This made them to consider the provision of basic necessities and building
human capital very important. They worked on not creating a winner takes it all society. They
were preoccupied with giving each citizen a stake in the country and its future. The administration
redistributed wealth through assets enhancement and not through traditional subsidies.
They also started a remarkable Health Insurance Scheme which has made Singapore‟s
health one of the best in the world, with an outstanding life expectancy rate. Singapore‟s great
records in health could be attributed to some of his government‟s initiatives such as: Medifund,
which provides a safety net for those not able to otherwise afford healthcare; and Medishield, a
government-funded health insurance program.258
Additionally, his government came up with initiatives through which the government
provides numerous assistance programs to the homeless and needy. Some of the programs include
providing between S$400 and S$1000 per month to needy households, providing free medical care
257 Central Provident Fund, “History of CPF.” Retrieved on 2 April 2016, from https://mycpf.cpf.gov.sg/Members/AboutUs/about-
us-info/history-of-cpf 258 Tucci, John, "The Singapore health system – achieving positive health outcomes with low expenditure", Towers Watson, 2010.
Retrieved on 2 February 2016, from http://www.watsonwyatt.com/europe/pubs/healthcare/render2.asp?ID=13850

100
at government hospitals, and paying for children's school fees.259
260
261
His government also
initiated numerous benefits to its citizenry, including: free money to encourage residents to
exercise in public gyms,262
money to help the disabled, cheap laptops for poor students,263
rebates
for numerous areas such as public transport,264
utility bills and more.265
266
Lee‟s government also
made policies through which Singaporeans were able to own shares in major companies. Presently,
90% of the work force own Singapore Telecom Shares (the highest in the world).
Public Housing Policy
Upon independence from Malaysia in 1965, 70% of Singapore's households lived in badly
overcrowded conditions, and a third of its people squatted in slums on the city outskirt. In
response, Lee‟s administration worked to make sure that every citizen owned a home. They
created a home ownership scheme through the Housing Development Board (HDB). HDB‟s
mandate is to build, low cost housing for workers with enticing resettlement policies like equitable
payments, minimal readjustment, and real improvement in housing conditions. His administration
oversaw the massive construction of high-rise, low-cost apartments that will eventually become the
main source of housing for Singaporeans. In the first two year of this crash program, over 25,000
259 Ministry of Social and Family Development, "Assistance", 26 October 2014. Retrieved on 6 February 2016, from
http://app.msf.gov.sg/Assistance 260 The Economist, "The stingy nanny", 16 October 2009. Retrieved on 6 February 2016, from
http://www.economist.com/node/15524092 261 The Economist, "Welfare in Singapore: Singapore government response", 17 February 2010. Retrieved on 6 February 2016,
from http://www.economist.com/node/15541423 262 Today Online, "ActiveSG$100 for Singaporeans to play sport." Retrieved on 6 February 2016, from
http://www.todayonline.com/print/475546 263 Development Authority of Singapore, "NEU PC Plus Programme – Learning – Infocomm." Retrieved on 6 February 2016, from
https://www.ida.gov.sg/Learning/Community-Development/NEU-PC-Plus-Programme/Schemes/NEU-PC-Plus-Programme-PC-
Bundle-scheme 264 Ministry of Transport, Singapore, "250,000 Public Transport Vouchers to Help Needy Families Cope with Fare Adjustment."
Retrieved on 6 February 2016, from http://www.mot.gov.sg/News-Centre/News/2015/250,000-Public-Transport-Vouchers-to-Help-
Needy-Families-Cope-with-Fare-Adjustment/ 265 Ministry of Social and Family Development, "Numbers and profile of homeless persons." Retrieved on 6 February 2016, from
http://app.msf.gov.sg/Press-Room/Numbers-and-profile-of-homeless-persons 266 Ministry of Social and Family Development, "Measures For Households," Singapore Budget 2014. Retrieved on 6 February
2016, from http://www.singaporebudget.gov.sg/budget_2014/families1.aspx

101
units were built, more than what was built in the previous decade. Workers were offered loans to
own houses. The HDB continued to promote public housing in new towns.
Under Lee‟s government, the number of public flats in Singapore rose from 22,975 in 1959
to 667,575 in 1990. Presently, 80 – 90% of the population lives in HDB apartments. In 1987, the
first Mass Rapid Transit (MRT) line began operation, connecting most of these housing estates and
the city centre. Currently, Singapore has one of the best public housing programs in the world. By
1996, there were 725,000 housing units.
Employment and Industrial Relations Act Amendment - The Industrial Ariitration Court
Lee and most people in his government used to be unionists before Singapore‟s Independence but
later found out that a fierce union that always ask for crazy wages and embark on strikes to get that
would overburden economic development. Lee‟s administration was also concerned about the
work ethics, good labour relations and increasing productivity to attract Foreign Investors. They
were was concerned that a Trade Union that could wake up and hold the country at ransom would
prevent investors from coming in to invest. To create a better Union and a better environment for
foreign investors, they had to regulate the unionists and freed them from communist control.
They had to amend the Employment and Industrial Relations Act in 1968 to promote
industrial peace and discipline among the workforce.267
This enabled his administration to put all
the Trade Unions under an established National Trades Union Congress (NTUC), curtail the
extreme practices of the unionists: endless strikes, slowdowns, riots; and established supervision
and working norms to get efficiency. In order to make factors such as working hours, conditions of
service, and fringe benefits predictable, and thus make businesses sufficiently attractive for
267
Barbara Leitch Lepoer, "Singapore – Two Decades of Independence", Washington: Government Printing Office for the Library
of Congress, 1989. Retrieved on 17 January 2016, from http://countrystudies.us/singapore/11.htm
102
investors, trade unions were barred from negotiating such matters as promotion, transfer,
employment, dismissal, retrenchment, and reinstatement, issues that accounted for most earlier
labor disputes.268
To spread work and help alleviate the effects of unemployment, overtime was limited and
the compulsory retirement age was set at fifty-five. The government's actions were part of efforts
to create in Singapore the conditions and laissez-faire atmosphere that had enabled Hong Kong to
prosper. Such measures, in the government's view, were necessary to draw business to the
country‟s port.
The Industrial Arbitration Court established in 1960, existed to settle disputes through
conciliation and arbitration.269
The court played a major role in settling labor-management disputes
through binding decisions based on formal hearings and through mediating voluntary agreements.
Lee‟s government subsequently set up National Wages Council with representatives from different
unions to yearly review wages increment.270
All these helped investment attraction and
unemployment reduction. Lee‟s government would later inject young people into the unions and
later helped the Trade Unions to own establishments and recreational facilities, and boosted their
morale. His administration‟s responsibility for workers' welfare won the government the support of
the population, hence guaranteeing the political stability that encouraged private investment.
Singapore’s Population Policy
Lee‟s government initiated a “Stop at 2” policy for child birth in the early 60s. This was to make
sure that population explosion does not overburden economic development and to deal first of all
268
Ibid 269
Lee Kuan Yew, “From Third World to First – The Singapore Story (1965–2000).” Harper Collins, New York, 2000. 270
Ibid
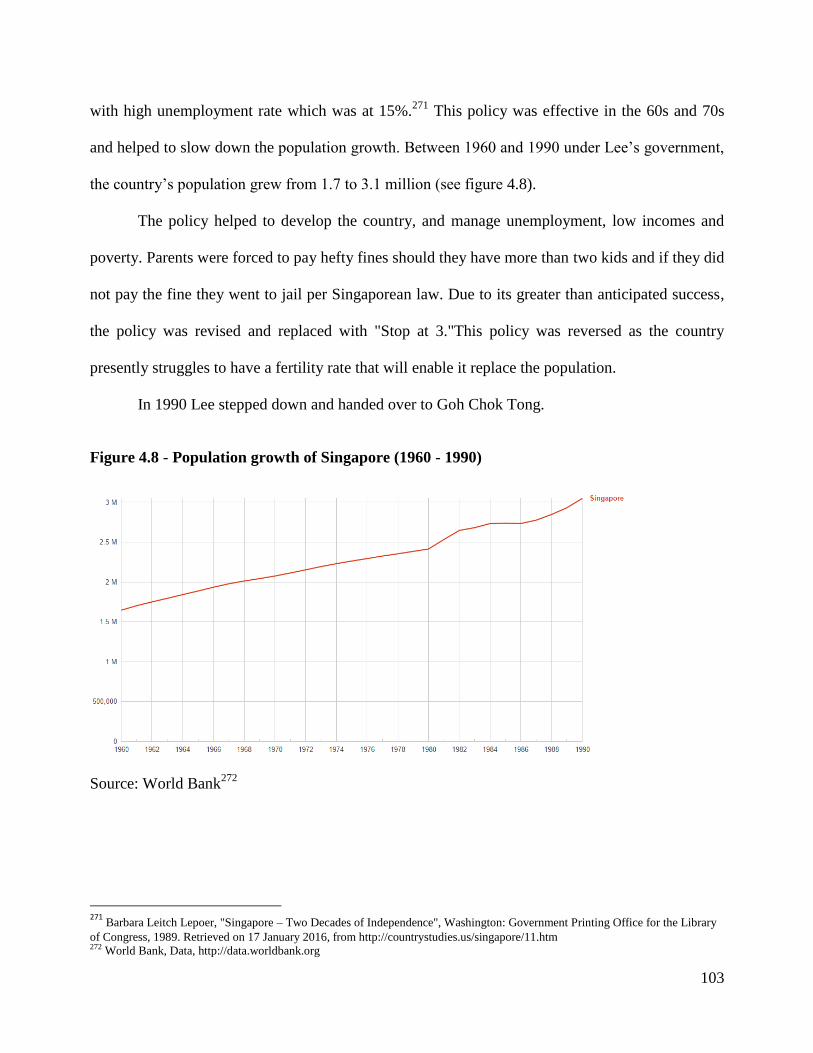
103
with high unemployment rate which was at 15%.271
This policy was effective in the 60s and 70s
and helped to slow down the population growth. Between 1960 and 1990 under Lee‟s government,
the country‟s population grew from 1.7 to 3.1 million (see figure 4.8).
The policy helped to develop the country, and manage unemployment, low incomes and
poverty. Parents were forced to pay hefty fines should they have more than two kids and if they did
not pay the fine they went to jail per Singaporean law. Due to its greater than anticipated success,
the policy was revised and replaced with "Stop at 3."This policy was reversed as the country
presently struggles to have a fertility rate that will enable it replace the population.
In 1990 Lee stepped down and handed over to Goh Chok Tong.
Figure 4.8 - Population growth of Singapore (1960 - 1990)
Source: World Bank272
271
Barbara Leitch Lepoer, "Singapore – Two Decades of Independence", Washington: Government Printing Office for the Library
of Congress, 1989. Retrieved on 17 January 2016, from http://countrystudies.us/singapore/11.htm 272 World Bank, Data, http://data.worldbank.org

104
4.2.2. 1990 – 2004: Goh Chok Tong Years
Goh succeeded Lee Kuan Yew in 1990 and served as prime minister till 2004. For someone that
inherited Lee‟s success in transforming Singapore into a diversified and advanced economy with
outstanding macroeconomic and political stabilities, all he needed to do was to continue the great
works of Lee Kuan Yew.
Figure 4.9 – Real GDP of Singapore in US$ (1990 - 2004)
Source: World Bank273
He ensured continuity of vital economic policies and transformation and operated a more
open-minded and consultative style of leadership than that of Lee. This greater openness extended
also to the socio-economic spheres of life, for instance, in his support for the rise of "little
bohemias" in Singapore, enclaves where more creativity and entrepreneurship could thrive.274
His
administration introduced several major economic policies including: Medisave
(a compulsory health savings scheme covering about 85% of the population), Vehicle Quota
273 World Bank, Data, http://data.worldbank.org 274 Quoted in "Singapore can become an entrepreneurial society" by Eugene Low, The Business Times, 19 August 2002, and
analysed in Brand Singapore: How Nation Branding Built Asia's Leading Global City by Koh Buck Song, Marshall Cavendish
2011, page 160.

105
Scheme and Singapore 21. During Goh's administration, Singapore experienced several crises,
such as the 1997 Asian financial crisis, threats of terrorism including the 2001 Singapore
embassies attack plot by Jemaah Islamiyah, the 2001 - 2003 economic recession, and the 2003
Severe Acute Respiratory Syndrome (SARS) outbreak. See the last paragraph of Sub-Section 3.2.1
of Section 3.2 of Chapter three for a breakdown of real GDP statistics during these crises.
Under Goh, between 1990 and 2004, the Nominal GDP grew from US$38,899 to
US$114,200 billion in (see figure 4.9); real GDP per capita grew from US$12,766 to US$27,404
(see figure 4.10); and Foreign Reserves rose from US$27.789 to US$116.172 billion despite these
crises. This was possible through macro-economic stability, financial stability, and efficient health
sector. See Sections 3.2 and 3.3 of Chapter three for further discussions on Singapore‟s
performance on employment provision, external trade, life expectancy rate, inflation control,
infrastructure expansion and literacy level between 1990 and 2004.
Figure 4.10 – Real GDP per capita of Singapore in US$ (1990 - 2004)
Source: World Bank275
275 World Bank, Data, http://data.worldbank.org

106
After the general election in 2001, Goh indicated that he would step down as Prime
Minister after leading the country out of the recession.276
He subsequently stepped down on 12
August 2004.
4.3 A comparative summary of the economic policy regimes of the two countries
In comparatively analysing the policy regimes discussed in the study of both countries, this Section
highlights a number of issues. First is policy implementation, which is extremely difficult to
achieve, and most policies will either take a long time getting off the ground or not be
implemented at all. In the case of Nigeria and Singapore, a respondent and political economist
commented that “better leaders make better policy choices and vice versa.” However, Nigeria‟s
problem in most instances is not making good economic policies but executing them. From the
analyses in Section 4.1 and according to most of the key informants interviewed, the second &
third NDPS were affected by poor governance, cheap political commitment, financial
mismanagement and corruption. A coup; and lack of financial resources, following fall in oil
prices frustrated the ambitious fourth NDP as Nigeria did not use revenues from oil to diversify
during earlier days of oil boom.
SAP though it boosted economic growth had problems such as falling real wages in the
public sector, along with a drastic reduction in expenditure on public services (see Sub-Section
4.1.6, page 85). It further set off waves of rioting and other manifestations of discontent that made
sustained commitment to it difficult to maintain. About 80% of the respondents agreed that
corruption, weak institutions and insufficient political will also marred the First National Rolling
Plan of Babangida (see Sub-Section 4.1.6). Successive governments in Nigeria found it difficult to
276 Mauzy, Diane K. and R.S. Milne, “Singapore Politics Under the People's Action Party, Routledge, 2002. ISBN 0-415-24653-9

107
continue good policies and programs of their predecessors. This made the country abandon many
good programs. For instance, if the OFN and GRP agricultural programs had been sustained and
improved upon, Nigeria‟s dependence on oil as the mainstay of the economy might have been a
thing of the past. In summary, as observed in Section 4.1 & according to most of the respondents,
the implementation of these policies and plans could not achieve so much because of corruption,
weak institutions, poor governance, policy reversals, mismanagement, nepotism, and lack of
sufficient political will.
Singapore on the other side as seen in Section 4.2 made clear-cut policies and implemented
them vigorously. In providing conducive environment for policies, its governments addressed
corruption, strengthened institutions; were policy consistent, prudent; prioritised; and were
politically committed. Furthermore, the education system was reformed to train a skilled
workforce as English language was promoted over the Chinese language as the language of
instruction. Labour unrest was eliminated through a consolidation of all the labour unions into a
single umbrella organisation, the NTUC, with strong oversight from the government. These
enabled Singapore to pursue the implementation of the already discussed policies aggressively.
Secondly is policy focus. Political-economic ideologies of leaders and national priorities
shape the focus of development policies. From Sections 4.1 and 4.2, Nigeria and Singapore after
independence focused on industrialisation. For Nigeria, this was reflected in the 1st NDP which
laid emphasis on infrastructure, industrialisation and agriculture expansion. Nigeria‟s second plan
also focused on reconstruction after the civil war, industrialisation, and agriculture expansion. The
3rd
plan focused on agriculture and rural development; while the 4th
plan focused on
industrialisation, agriculture, housing and infrastructure expansion. All these plans had great focus

108
areas, focusing on Nigeria‟s comparative advantage which is in agriculture with hopes of using oil
revenues to industrialise. However, most of them could not achieve so much.
Singapore‟s export-oriented industrialisation strategy partly explained the country‟s focus
on industrialisation. With such strategy, further strategies ranging from tax incentives to the
establishment of a large industrial estate in Jurong and smaller estates in Kallang Park, Tanjong
Rhu, Redhill, Tiong Bahru and Tanglin Halt helped to ensure the industrialisation of the
country.277
Lastly is policy quality, difference and shift. Our discussions in Sections 4.1 and 4.2 clearly
show that while Singapore was using export-led industrialisation model, Nigeria was using import-
substitution, protectionism, and nationalisation. This made a key difference in both countries‟
development. Export-led industrialisation partly enabled Singapore to open its economy and
aggressively source foreign direct investments (See Section 4.2, page 89). This enabled Singapore
to become more competitive in several areas and provide an enabling environment for investors.
Singapore has been consistent with market economy driven economic principles. As the same
time, Nigeria nationalised several corporations and instituted the indigenisation decree. The
Buharinomics of command and control policy regime (1983 - 1985) created market distortions and
worsened the inherited recession. It was until SAP that Nigeria embraced a liberal economy and
export-oriented industrialisation.
4.4 Leadership and Economic development in Nigeria and Singapore
About 95% of the respondents attributed Singapore‟s early success to Lee Kuan Yew‟s
quintessential leadership style. According to a respondent and former Minister, “the difference in
277 Barbara Leitch Lepoer, "Singapore – Road to Independence," Washington: Government Printing Office for the Library of
Congress, 1989.
Retrieved on 17 January 2016, from http://countrystudies.us/singapore/10.htm

109
economic performances of Nigeria and Singapore was largely Lee Kuan Yew, who had a long
term vision for the country, as well as a strategy for realising that vision.” Another respondent
stated that, “the major difference in human development indices between Nigeria and Singapore
has been primarily the absence in Nigeria of a visionary and determined leader like Singapore had.
While Lee Kuan Yew was focused, committed to the country‟s development and had three decades
of uninterrupted leadership, Nigerian leaders were just selfish, corrupt and ruled for shorter
periods.”
Lee Kuan Yew‟s method involved prioritising national challenges and coming up with
strategies to deal with them. After separation from Malaysia, he knew the first thing to do was to
have Singapore internationally recognised. This he did by having Singapore becoming part of the
UN and Commonwealth.278
His next priority was security based on threats to his country‟s
territorial integrity and knowing that no economic transformation could happen under insecurity.
In response, Lee‟s government introduced conscription whereby all able-bodied male Singaporean
citizens, age 18 and above are required to serve National Service either in the Singapore Armed
Forces, Police Force or the Civil Defence Force.279
They collaborated closely with the Israelis in
building an army through training and buying weaponry at discounted prices; and the Taiwanese in
building an air force. By 1971, after mere six years, Singapore had 17 national service battalions
(16,000 men) with 14 battalions (11,000 men) in the reserves. Singapore had a battalion each of
tanks, armored personnel carriers, field engineers, field maintenance, field hospital and field
supply. By 1990, Singapore Armed Forces had grown into a respected and professional force
278
Barbara Leitch Lepoer, "Singapore – Two Decades of Independence", Washington: Government Printing Office for the Library
of Congress, 1989. Retrieved on 17 January 2016, from http://countrystudies.us/singapore/11.htm 279
Ibid

110
operating modern defense systems that was capable of defending her territorial integrity and
independence.280
Singapore‟s next priority was the withdrawal of the British Force Base from Singapore
which was announced in 1968. The Force Base gave Singapore the confidence to attract investors
and export. Additionally, as of the late 60s, the Base was contributing 20%281
of Singapore‟s GDP.
Lee‟s administration was heavily concerned that more than 70,000282
Singaporeans would lose
their jobs if the British Forces left. Lee personally did all he could through lobbying and several
trips to the UK to extend their withdrawal all to no purpose. In reaction, he set up the Economic
Conversion Department, for the conversion of British Assets to their use. He persuaded the British
not to destroy their dock and had the British naval dockyard later converted for civilian use. His
administration started aggressive attraction of foreign investments that by the time the British
Forces left, there were no job losses. By 1971, enough jobs have been created by American
Electronics Companies. By 1972, economic growth was at 13%.283
On the other hand, about 90% of the respondents attributed Nigeria‟s persistent economic
development challenges to partly poor leadership. First, although Nigerian founding fathers were
committed to the country‟s economic development, their administration tended to foster
corruption, nepotism and created the first post-colonial political crises, reasons why the military
struck in early 1966.284
Secondly, their successor, General Gowon governed during Nigeria‟s first oil boom.
Regardless of the growths inspired by the oil boom, most of the key informants interviewed agreed
that Gowon lacked vision to develop the country and failed to improve its economic fortunes by
280 Lee Kuan Yew, “From Third World to First – The Singapore Story (1965–2000).” Harper Collins, New York, 2000, Page 24 281 Ibid, page 33 282 Ibid 283 Ibid 284 Okigbo, P., "National Development Plan in Nigeria 1960 - 1987," Enugu: Fourth Dimension Publishers Ltd, 1989.

111
channeling oil rents towards rapid industrialisation, greater infrastructuralisation, diversifying
exports and agricultural expansion. This is in contrast to Lee Kuan Yew who had virtually no
resources but was master of efficiently using available scarce resources. Furthermore, while
Gowon came up with his Indigenisation Decree of 1972, Lee Kuan Yew was aggressively courting
FDIs, while Nigeria was in effect, discouraging it with the decree.
Thirdly, the General Obasanjo‟s leadership (see Sub-Section 4.1.3, page 78) did not
achieve much in using revenues from then prevailing oil boom to diversify the economy and with
regard to expanding agriculture. From the key informants interviewed, the oil boom of the 70s was
mostly squandered and siphoned by political leaders. Fourthly, about 90% of the respondents
agreed that Babangida presided over one of the most corrupt governments in Nigeria. Babangida‟s
administration has been further accused of siphoning off about $12.2 billion between 1988 and
1994 into private accounts, secretively undertaken while the country was openly reeling with a
crushing external debt.285
Finally, his successor, Sani Abacha presided over the most corrupt
government in Nigeria‟s history. During his regime, he and his family reportedly stole a total of £5
billion from the country's coffers.286
In 2004, Abacha was listed as the fourth most corrupt leader
in the world‟s history by Transparency International.287
In addition, Lee Kuan Yew‟s long stay in power with no interruptions enabled him to
stabilise and transform the newly independent country. During his long stay, Nigeria had eight
different leaders who all came up and reversed most of the ongoing economic plans and came up
with new ones. Most of the leaders came in through military coups. About 90% of the respondents
agreed that Nigeria‟s frequent coups also created serious political instability and lack of continuity
285 Owah, Emmanuel Onyemaghani, "Government of the Crooks, by the Crooks, for the Crooks", Xlibris, 2011, ISBN 1465352023. 286 The New York Times, "Late Nigerian Dictator Looted Nearly $500 Million - Swiss Say", 19 August 2004. Retrieved on 2 April
2006,
from http://www.nytimes.com/2004/08/19/world/late-nigerian-dictator-looted-nearly-500-million-swiss-say.html 287 Transparency International, "Introduction to Political Corruption," transparency.org, London, 25 March 2004, p. 13.

112
in economic management and development. Altogether, Nigeria has been ruled, for almost 30
years out of her 55 years of self-governance, by military dictators and has had six successful
military coups. Nigeria in most part of the 60s, 70s, 80s and 90s was ruled by many military rulers,
many of whom were poorly prepared and with limited vision, lacked basic exposure to modern
economic management, guided by incoherent and anti-developmental economic policies,
dependent on oil rents, leave other sectors to deteriorate, instituted corruption, and committed
human rights abuses.288
Whereas in Singapore, Lee Kuan Yew as its founding father, created institutions that
virtually eradicated corruption, and pursued economic development, before he retired as the prime
minister in 1990. While Nigerian leaders from General Gowon to Sani Abacha have all been
indicted with corruption and traces of nepotism, Lee Kuan Yew was rarely associated with such
acts. A respondent stated that, “Singapore was fortunate to be led an individual with huge ideas,
dreams and a clear vision for what Singapore should be, whereas Nigeria never had any of such.”
She further commented that, “leaders in Nigeria since 1965 have lacked the required zeal for
economic development, the leaders have not demonstrated sincere desire with appropriate
strategies to develop or move the nation forward.”
Ultimately, effective Leadership brings in good governance, respect for the rule of law,
professionalism and policies that are necessary for economic development. Singapore has been
lucky in this respect. Lee admitted in his memoir, “From Third World to First – The Singapore
Story (1965–2000)” that his responsibility was to provide security and livelihood for his people,
and that he could not sleep well while thinking of solutions. His story demonstrates that
development hinges on leadership and requires planning, visioning, development of strategies and
288 Onyenwigwe P. I., "Principles of Development Administration: Third World Perspectives," Owerri: Ambix Printers Nigeria,
2009.
113
tactics etc. There is a strong correlation between leadership and economic development. A good
leader is one who has the ability to diagnose the problem of his society and proffer solutions to
address it. Economic development is a function of policies, Singapore and Nigeria cases show that
and that a good leader must be able to identify good policies that will institutionalise economic
development and pursue it aggressively with sufficient political will.
4.5 Conclusion
Considering the above findings and discussions, it could be concluded that different policy
processes were very key in explaining the both countries differing economic development
performances. The findings prove the second hypothesis as earlier adoption of export-led
industrialisation policy by Singapore‟s leadership majorly determined the different levels of
development between Nigeria and Singapore. The findings also show that effective, focused and
stable leaderships enabled Singapore to make exceptional progress on economic development
unlike in Nigeria. It was also obvious that military-rule interferences negatively affected Nigeria‟s
economic development performance, through policy reversals, unlike in Singapore where there has
been continuity, proving the third hypothesis. Finally, we have noted that Singapore like most
other countries in Southeast Asia was able to make outstanding progress on economic development
unlike Nigeria (and most other sub-Saharan African countries) through committed leaderships, and
comprehensible market economy and export-oriented industrialisation policies.

114
CHAPTER FIVE: SUMMARY, CONCLUSIONS AND RECOMMENDATIONS
5.0 Introduction
Nigeria and Singapore were in a similar economic situation in the early 1960s with substantially
low GDP per capita, and high poverty and unemployment levels. However, while Nigeria is still
struggling with several economic development challenges, Singapore is one of the most developed
countries in the world, having achieved outstanding economic development indicators with a
diversified economy.
In this regards, according to its objectives, this study was aimed at examining how
leadership, resource-base and policy processes influenced the differing economic development
performances of Nigeria and Singapore. The research explores why Singapore with a highly
limited resource-base has outperformed Nigeria, a country endowed with massive resource-base,
and examines factors that propel sustainable economic development today.
This chapter, thus summarizes what has been found out through the research, and provides
the conclusions and recommendations emanating from the study.
5.1 Summary
This research has discussed economic growth; poverty, unemployment, literacy and life
expectancy levels in Africa and Southeast Asia. Compared to Southeast Asia, the economic
performance of Africa for the last 50 years has been significantly poorer with the lowest GDP and
GDP per capita growth rates and the world's highest levels of extreme poverty. Moreover, Africa
continues to have substantial lower literacy and life expectancy levels compared with other regions
of the world. Most African countries have remained primary-export dependent countries with weak
industrial base.

115
On the other side, most Southeast Asian countries have successfully achieved economic
development with outstanding development indicators. It was also found out that different policy
processes and leadership dynamics have contributed to the prevailing wide disparities. In this light,
through committed leaderships that formulated comprehensible policies on market economy and
export-oriented industrialisation; and ensured clinical implementation of such policies; Southeast
Asian countries were able to make outstanding progress on economic development unlike African
countries.
In line with objective one, the study has comparatively analysed the resource-base of
Nigeria and Singapore. It was found out that Nigeria has a resource-base that is far greater than
Singapore‟s. The study further examined economic development in Nigeria and Singapore. In
doing this, the study looked at economic growth, poverty and unemployment levels, literacy and
life expectancy rates as well other economic vital indicators such as diversification, inflation,
infrastructure, and external trade. Nigeria scored so low in all these areas, far below Singapore,
except in real GDP growth. Besides, Nigeria still faces an array of economic development
challenges. Singapore has made outstanding progress in these areas, hence its transformation to a
first world country. The study shows that a country‟s resource-base does not explain the difference
between the development levels of Nigeria and Singapore, proving the first hypotheses.
Further, in line with objectives two and three, the study examined how policy processes
and leadership dynamics influenced the differing economic development levels of Nigeria and
Singapore. The study found that this factor played key roles in both countries development levels.
The study found that Singapore‟s committed leaderships made better policies, made sure they were
all implemented and managed resources in a better way. Unlike in Nigeria where leaders had
issues of corruption, nepotism, tribalism; and had problems in providing a conducive environment

116
for policies to thrive. It was also found out that an early adoption of export-led industrialisation
policy by Singapore‟s leadership played a key role in the different levels of development between
Nigeria and Singapore, proving the second hypothesis. Finally, the study found out that policy
reversals through military-rule interferences negatively affected Nigeria‟s economic development
performance, unlike in Singapore. This proves the last hypothesis.
5.2 Conclusion
The study found that there were various contributors to the differing development performances of
Nigeria and Singapore. First, committed and quality leadership was found to be a key determinant.
Unlike different Nigerian leaders from 1960 to 1990, Lee Kuan Yew had well designed &
articulated ideas & dreams, a long term vision of what Singapore should be and a strategy for
realising that vision. With his uninterrupted leadership spanning over three decades, he was able to
develop the requisite tactics.
Secondly, his administration consistently adopted policies that were influenced by export-
oriented industrialisation strategy and free market. The both influenced the creation of industrial
estates, and the Economic Development Board - for manufacturing, industrialisation, attraction of
FDI and provision of a conducive environment for them. Export-oriented industrialisation policy
influenced policies on massive infrastructuralisation, building human capital and providing tax
incentives. His government‟s Employment and Industrial Relations Act helped to control the
excessive power of Trade Unions to provide the required conducive environment for investors and
ensuring an investment friendly climate where labour relations are predictable. The Act further
influenced very obvious necessaries such as improving labour productivity. His government‟s
Housing Policy influenced the creation of the HDB, for public housing, land optimisation, and
source of government revenue. His government‟s Anti-Corruption policy addressed the issue of

117
corruption, while the Capital Formation Act was used for domestic savings, capital formation and
development funding. These policies and programs were well implemented and successive
governments modified them to suit current realities and sustained them.
Nigeria, on the other hand, had challenges with policy processes. The country first adopted
an import-substitution and nationalisation model of industrialisation which failed woefully as
necessary governmental incentives, subsidies, commitments and prioritisation were not in place to
boost domestic production. The oil boom era saw Nigeria moving towards nationalisation,
indigenisation, and self sufficiency, while revenues from the boom were not sufficiently used to
diversify the economy or pursue aggressive industrialisation. Being a shining example of primary
export dependence country, Nigeria faced an economic downturn from the early 80s to mid 90s as
a result of low oil prices. In addition and as observed in this study, most of Nigeria‟s economic
policies and plans could not achieve measurable progress as a result of policy reversals, corruption,
weak institutions, nepotism, cheap political commitments, mismanagement, poor articulation of
them in few instances, overambitious plans, roadside policy declarations and instability arising
from a high turnover of leaders.
Seeking lessons for sustainable economic development, the study found out that it is
essential to diversify sources of government revenues and export earning, attract foreign
investment and pursue industrialisation. Singapore has successfully done this. This helps to
address poverty, unemployment and low incomes. It is also important to build human capital
through expanding educational opportunities, investing in Research and Development, encourage
knowledge transfer, and expand national health insurance services. Singapore has promoted
investment in human capital more largely than Nigeria. Literacy and life expectancy rates of
Singapore have been largely higher than Nigeria‟s. In conclusion, as it has been found out through

118
this research, committed leadership, diversification, industrialisation, foreign investment attraction;
expanding infrastructure, fighting poverty, increasing job opportunities, expanding access to
education and investing in the health sector should be taken seriously when forming policies for
sustainable economic development.
5.3 Recommendations
In respect to the above findings, this research makes some policy suggestions for the achievement
of sustainable economic development in Nigeria and for the country to be within the top 20
economies by 2020 as it hopes.
First, for Nigeria to reduce primary export dependence on export earnings and sources of
government‟s revenue, the country should diversify away from oil through expanding and
continuously modernising agriculture; supporting local industries through incentives and subsidies;
and aggressive drive for foreign investment. This will also help the country to address its low
economic development indicators. In addition, Nigeria does not have to wait for the entire nation
to have steady power supply before it could become a serious industrial economy. What can be
done is for the government to mark out areas, guarantee steady power supply, infrastructure and
security; and invite manufacturers. Singapore did this through the creation of industrial estates.
China also did this through the creation of Special Economic Zones. Nigeria should also embrace
Singapore‟s styled export-oriented industrialisation policy to diversify its exports.
Secondly, there is an urgent need to ensure that elections are free and fair in Nigeria,
strengthen the independence of electoral institutions, inject young people into leadership and strip
it of money politics that have made it impossible for potential qualified leaders not to be able to
compete.
119
Thirdly, Nigeria, should address poverty through increasing the access of the rural poor to
education and health; taxation of the wealthy; agricultural development policies; Conditional Cash
Transfers like the Brasilia Bolsa Familia program289
; temporary employment schemes etc.
Ultimately, Nigeria should strengthen its institutions, address corruption, ensure policy consistency
& coherency, while its leaders should donate sufficient political will to ensure effective
implementation of its policies and management of resources.
5.4 Suggestion on Area for Further Study
This research suggests further comparative studies on how leadership and policy processes
influence economic development between other sub-Saharan African and Southeast Asian
countries to get more lessons and policy paths on achieving sustainable economic development.
289 Bolsa Família (Family Allowance) is a social welfare program of the Brazilian government. Through it, financial aid is provided
to poor Brazilian families; if they have children, families must ensure that the children attend school and are vaccinated. The
program attempts to both reduce short-term poverty by direct cash transfers and fight long-term poverty by increasing human
capital among the poor through conditional cash transfers. It also works to give free education to children who cannot afford to go
to school. The program has been mentioned as one factor contributing to the reduction of poverty in Brazil. About 12 million
Brazilian families receive funds from it and it has been described as "the largest program of its kind in the world." By February
2011, 26% of the Brazilian population were covered by the program.
120
BIBLIOGRAPHY
Achebe, Chinua, "The Trouble with Nigeria," Fourth Dimension Publishers, ISBN-13: 978-
9781561474, 2000.
Adam, Shamim, "Singapore Miracle Dimming as Income Gap Widens Squeeze by Rich",
Bloomberg, New York, 10 August 2011.
Adeola G.L., “Politics and Democratization Process in Nigeria: The Prevailing Issues”, LASU
Journal of Social Sciences, Vol 6 Nos 1 & 2, August, 2007.
Afegbua, Salami Issa, “The Challenges of Leadership and Governance in Africa,” Vol. 2, No. 9
ISSN: 2222-6990, September 2012
Africa News Service, “Obasanjo Blames Poor Leadership For Africa's Decline”, March 6, 2000.
Retrieved on 17 January 2016, from http://www.africanprogress.net/africanleaders.htm
Agbaje, D.O. and Roberts, Y, “Meeting the Challenge of Sustainable Democracy in Nigeria,”
Ibadan: NISER, 2000.
Ake, C and Onoge, O. “The Theories and Conception of Leadership”, in Fafowora, et al (eds),
Nigeria: In Search of Leadership, Ibadan: Spectrum Book, 1995.
Aremu I, “Development and Political Stability in Kwanashie (ed) Politics and Political Power
Relations in Nigeria”, Lagos. Dat and Partners Logistic Ltd, 2003, 12: 248-262
Auty, Richard M., “Sustaining Development in Mineral Economies: The Resource Curse Thesis,
London: Routledge, 1993.
Ayub M., 'Poverty and Inequality', Global Journal of Emerging Market Economies, Vol. 5, No. 3,
2013. p.330.
BBC News, "Nigeria's Muhammadu Buhari in profile," 17 April 2011. Retrieved on 7 February
2016, from http://www.bbc.com/news/world-africa-12890807
__________, "Senegal police arrest Chad former leader Hissene Habre". Retrieved on 8 January
2016, from http://www.bbc.com/news/world-africa-23119658
__________, "What do you think of Nigeria?", 16 June 2006. Retrieved on 7 February 2016, from
http://news.bbc.co.uk/2/hi/africa/5072244.stm
Bevan, David L., Paul Collier, and Jan Willem Gunning, "The political economy of poverty,
equity, and growth: Nigeria and Indonesia," Washington, DC: The World Bank, 1999.

121
Britannica.com, "Muhammad Buhari (head of state of Nigeria) - Britannica Online Encyclopedia".
Retrieved on 6 February 2016, from
http://www.britannica.com/biography/Muhammadu-Buhari
Burton, John, "Singapore economy grows 9.1% in first quarter", Financial Times (London), 10
April 2006.
Central Bank of Nigeria, “Statistical Bulletin,” 2008.
Central Provident Fund, “History of CPF.” Retrieved on 2 April 2016, from
https://mycpf.cpf.gov.sg/Members/AboutUs/about-us-info/history-of-cpf
Chan, Fiona; Ching, Choon Hiong. "The Singapore that LKY built" (PDF). The Straits Times.
Archived from the original (PDF) on 29 March 2015
Central Intelligence Agency, “EXPORTS - PARTNERS: Country Comparison to the World”, The
World Fact Book, 2014. Retrieved on 2 February 2016, from
https://www.cia.gov/library/publications/the-world-factbook/geos/ni.html
__________World Factbook, "HIV/AIDS - adult prevalence rate," 2012. Retrieved on 17 February
2016, from https://www.cia.gov/library/publications/the-world-
factbook/rankorder/2155rank.html
_______________, "Rank Order – Area", The World Factbook. Retrieved on 4 April 2016, from
https://www.cia.gov/library/publications/the-world-factbook/rankorder/2147rank.html
_______________, "The World Factbook". Retrieved on 26 February 2016, from
https://www.cia.gov/library/publications/the-world-factbook/rankorder/2127rank.html
Channel News Asia, “Unemployment rate dips to 1.8% in Q1: MOM,” 15 June 2015. Retrieved on
14 January 2016, from
http://www.channelnewsasia.com/news/business/singapore/unemployment-rate-dips-
to/1915976.html
Chicago Daily Defender, "Nigeria Unveils Bold Six-Year Economic Plan", Dec 26, 1962.
Collier P. & Gunning J. W., 'Explaining African Economic Performance', Journal of Economic
Literature, Vol. 37, No. 1, (1999) p.74.
CPIB, "Politicians | Corrupt Practices Investigation Bureau", www.cpib.gov.sg. Retrieved on 17
January 2016, from https://www.cpib.gov.sg/cases-interest/cases-involving-public-
sector-officers/politicians

122
Department Of Statistics Singapore, "Singapore Exports as at 2014", 2015. Retrieved on 2
February 2016, from http://www.singstat.gov.sg/statistics/latest-data#2
_______________, "Singapore Imports as at 2014", 2015. Retrieved on 2 February 2016, from
http://www.singstat.gov.sg/statistics/latest-data#2
_______________, " Latest Data – Population & Land Area (Mid-Year Estimates)", June 2014.
_______________, "Singapore Employment Labour as at June 2015," 2015. Retrieved on 4 April
2016, from http://www.singstat.gov.sg/statistics/latest-data#4
_______________, "NEU PC Plus Programme – Learning – Infocomm." Retrieved on 6 February
2016, from https://www.ida.gov.sg/Learning/Community-Development/NEU-PC-
Plus-Programme/Schemes/NEU-PC-Plus-Programme-PC-Bundle-scheme
Djankov, S; Montalvo, J G; Reynal-Querol, M, "The curse of aid", Journal of Economic Growth
(Springer) 13 (3): 169–94, doi:10.1007/s10887-008-9032-8, 2008.
Dowden, Richard, "Obituary: Dr Hastings Banda," The Independent, London, 27 November 1997.
Retrieved on 04 January, 2016, from
http://www.independent.co.uk/news/obituaries/obituary-dr-hastings-banda-
1296534.html
Dawodu.com, "Military Regime Of Buhari And Idiagbon." Retrieved on 6 February 2016, from
http://www.dawodu.com/buhari.htm
Exploitz, "Public-domain information from the US State Department Country Guide,"
Exploitz.com. Retrieved on 17 January 2016, from
http://www.exploitz.com/Singapore-Religious-Change-cg.php
Eze I., “A Study of Leadership in Nigerian Organisations”, ASCON Journal of Management Vol
7, Nos 1 &, April/October, 1988.
"Global Financial Centres 7", City of London, March 2010. Retrieved on 4 April 2016, from
http://217.154.230.218/NR/rdonlyres/661216D8-AD60-486B-A96F-
EE75BB61B28A/0/BC_RS_GFC7full.pdf
Google Books, "China in the Era of Deng Xiaoping." Retrieved on 17 January 2016, from
https://books.google.ca/books?id=mDS0GW7FH_0C&pg=PA179&dq=&hl=en#v=on
epage&q&f=false
Gylfason, T, "Natural resources, education, and economic development", European Economic
Review (Elsevier) 45 (4-6): 847–59, doi:10.1016/s0014-2921(01)00127-1, 2001.

123
Harbeson J. W. & Rothchild D., “Africa in World Politics: Reforming Political Order (4th)”,
Colorado: Westview, 2009. p.50.
Iheanacho, E. N., "National Development Planning in Nigeria: An Endless Search for Appropriate
Development Strategy," International Journal of Economic Development Research and
Investment, Vol. 5, No. 2; August 2014.
ILO, "World Employment Social Outlook," 2015.
International Monetary Fund, “Regional Economic Outlook: Sub-Saharan Africa, Navigating
Headwinds”, Washington, D.C: IMF, 2015. p.1.
___________, "Singapore", 2014. Retrieved on 6 January 2016.
___________, “World Economic Outlook Database”, April 2015.
Investopedia, "Developed Economy Definition", 16 April, 2010.
Ito T., 'Growth, Crisis, and the Future of Economic Recovery in East Asia' in Stiglitz J. E. & Yusuf
S., Rethinking the East Asian Miracle, (Washington, D.C.: World Bank and Oxford
University Press, 2001) pp.78-81.
Jerome A., 'Infrastructure, Economic Growth and Poverty Reduction in Africa', Journal of
Infrastructure Development, Vol. 3, No. 2, 2011, p.146.
Jomo K. S., 'Growth with Equity in East Asia?', UN Department of Economic & Social
Affairs(DESA), Working Paper 33, 2006. p.4.
Kamuntu E.R, “Leadership Challenges in Consolidating Democracy and Good Governance in
Africa, A paper presented at conference of The Leadership Forum, Nairobi, Kenya:
March 10-12.
Koha, S, “Nigeria: The Political Economy of Oil”, London: Oxford University Press, 1994.
Kolluru S. & Rao B., “East Asian Experience on Growth and Equity: Lessons and Implications”,
Global Business Review, Vol.12, No. 2, 2011. p.239.
Kuepper, Justin, "Mining Companies Could See Big Profits in Congo", Theotcinvestor.com, 26
October 2010.
Kuznets, Paul W., “An East Asian Model of Economic Development: Japan, Taiwan and South
Korea,” Economic Development and Cultural Change, Vol. 36, No. 3, April 1988.
Land Transport Authority, "1982 – The Year Work Began." Retrieved on 17 January 2016, from
http://www.lta.gov.sg/content/ltaweb/en.html

124
Lepoer L. Barbara, "Singapore". Library of Congress Country Studies. Washington, D.C.:
Government Printing Office, 1989.
Lewis, Peter, "From Prebendalism to Predation: The Political Economy of Decline in Nigeria",
The Journal of Modern African Studies 34 (1): 79–103.
doi:10.1017/s0022278x0005521x, March 1996.
__________, "Growing apart: oil, politics, and economic change in Indonesia and Nigeria," Ann
Arbor: University of Michigan Press, 2007.
Mansell, R & and Wehn, U., "Knowledge Societies: Information Technology for Sustainable
Development", New York: Oxford University Press, 1998.
May, D. Clifford, "Nigerian Military Is Seen As Losing Support," May 1, 1984. Retrieved on 6
February 2016, from http://www.nytimes.com/1984/05/01/world/nigerian-military-is-
seen-as-losing-support.html
Milne, R. S.; Mauzy, D, “Malaysian Politics under Mahathir”, Routledge, 1999, ISBN 0-415-
17143-1.
Ministry of the Environment and Water Resources, "Towards Environmental Sustainability, State
of the Environment 2005 Report (PDF)", 23 June 2011.Nigerian National Bureau of
Statistics, "Labour Productivity Report," August 2015. Retrieved on 4 April 2016,
from http://www.nigerianstat.gov.ng/pages/download/319
Ministry of Information, Communications and the Arts, "Singapore Infomap – Coming of Age".
Retrieved on 17 January 2016, from https://www.sg/explore/history_coming.htm
Ministry of Social and Family Development, "Assistance", 26 October 2014. Retrieved on 6
February 2016, from http://app.msf.gov.sg/Assistance
___________, "Measures For Households," Singapore Budget 2014. Retrieved on 6 February
2016, from http://www.singaporebudget.gov.sg/budget_2014/families1.aspx
___________, "Numbers and profile of homeless persons." Retrieved on 6 February 2016, from
http://app.msf.gov.sg/Press-Room/Numbers-and-profile-of-homeless-persons
Ministry of Transport, Singapore, "250,000 Public Transport Vouchers to Help Needy Families
Cope with Fare Adjustment." Retrieved on 6 February 2016, from
http://www.mot.gov.sg/News-Centre/News/2015/250,000-Public-Transport-Vouchers-
to-Help-Needy-Families-Cope-with-Fare-Adjustment/
Moyo, Dambisa, “Dead Aid,” New York: Farrar, Straus and Giroux, 2009. p.16.

125
Ndulu B. J. & O'Connell S. A., 'Policy plus: African growth performance, 1960-2000' in Ndulu B.
J., et al, “The Political Economy of Economic Growth in Africa (1960 - 2000)”, Vol.
1, New York: Cambridge University Press, 2008. p.4.
Nigerian National Bureau of Statistics - http://www.nigerianstat.gov.ng/
_______________, 2015. Retrieved on 04 January, 2016, from http://www.nigerianstat.gov.ng/
_______________, "Nigerian Gross Domestic Product Report Q2 2015".
Nnadozie, U., "The State Civil Service and Underdevelopment in Nigeria: An Analysis of Public
Policy Making Process in a Neocolonial Society, " Enugu: Johnkens J and Willy
Publishing Co. Nig. Ltd, 2004.
O.C. UKAH, "An Appraisal of the Performance of the Nigeria‟s National Rolling Plans in the
90‟s," African Research Review vol.1(1)
Ogwumike F, "The Effects of Macrolevel Government Policies on Rural Development and
Poverty Alleviation in Nigeria," Ibadan J. Soc. Sci., 1(1): 85-101, 1995.
Okigbo, P., "National Development Plan in Nigeria 1960 - 1987," Enugu: Fourth Dimension
Publishers Ltd, 1989.
Onah, F. O., “Managing Public Programmes and Projects,” Nsukka: Great AP Express Publishers,
2006.
Onyenwigwe P. I., "Principles of Development Administration: Third World Perspectives,"
Owerri: Ambix Printers Nigeria, 2009.
Owah, Emmanuel Onyemaghani, "Government of the Crooks, by the Crooks, for the Crooks",
Xlibris, 2011, ISBN 1465352023.
Oyeniyi, Bukola Adeyemi; Falola, Toyin, "Nigeria", ABC-CLIO, February 2015. p. 58.
Paden, John N., "Muslim Civic Cultures and Conflict Resolution," Brookings Institution Press,
2005, p. 240. ISBN 0-8157-6817-6.
Panglaykim, J. and Thomas, K.D., "The New Order and the Economy," Indonesia, April 1967, p.
73.
Premium Times Nigeria, "Why we honoured Abacha - Nigerian government - Premium Times
Nigeria", Retrieved on 8 February 2016, from
http://www.premiumtimesng.com/news/156004-why-we-honoured-abacha-nigerian-
government.html

126
Quah, Jon S. T., “Curbing Corruption in Asian Countries: An Impossible Dream?: An Impossible
Dream?” Bingley, UK: Emerald Group. p. 461. ISBN 9780857248206, 2011.
Ramesh, S., "S'pore is India's second-largest foreign investor". Channel NewsAsia (Singapore), 14
January 2011.
Rita Okoye, "Nigeria has lost $400bn oil revenue to corruption since Independence – Ezekwesili,"
31 August, 2012. Retrieved on 04 January, 2016, from
http://dailypost.ng/2012/08/31/nigeria-lost-400bn-oil-revenue-corruption-since-
independence-ezekwesili/
Sachs, Jeffrey D; Warner, Andrew M, “Natural resource abundance and economic growth, NBER
Working Paper 5398, 1995-02-02. Retrieved on 17 January 2016, from
http://ideas.repec.org/p/nbr/nberwo/5398.html
Sandbrook, Richard, “The Politics of Africa's Economic Stagnation.” Cambridge University Press,
1985.
Savage, Victor R.; Yeoh, Brenda S.A., "Toponymics: A Study of Singapore's Street Names",
Singapore: Eastern Universities Press, 2004, ISBN 978-981-210-364-2.
Seteolu, D., “The Challenge of Leadership and Governance in Nigeria”, in Odion-Akhaine, S
(eds), Governance: Nigeria and the World, Lagos: CENCOD, 2004.
Sheffrin, S. M., “Economics: Principles in action”, Pearson Prentice Hall, Upper Saddle River,
New Jersey, 2003.
Siollun, Max, “Oil, Politics and Violence: Nigeria's Military Coup Culture (1966-1976),” Algora,
pp. 98 – 102, ISBN 9780875867090.
Soludo, Charles, "Can a new Buharinomics save Nigeria?" Vanguard News, November, 2015.
Retrieved on 17 January 2016, from http://www.vanguardngr.com/2015/11/can-a-new-
buharinomics-save-nigeria/
Statistics Singapore - http://www.singstat.gov.sg/statistics
___________, "Latest Data – Population & Land Area (Mid-Year Estimates)", June 2014.
Retrieved on 6 February 2016, from http://www.singstat.gov.sg/statistics/latest-
data#14
___________, "Latest Data – Resident Population Profile", June 2014.
Retrieved on 26 February 2016, from http://www.singstat.gov.sg/statistics/latest-data#15

127
Time Magazine, "Despot's Fall". 20 August 1979. Retrieved on 8 January 2016, from
http://content.time.com/time/magazine/article/0,9171,947351,00.html?promoid=googl
ep
Tharoor, Ishaan, "Mobutu Sese Seko", Top 15 Toppled Dictators," 20 October 2011. Retrieved on
04 January, 2016, from
http://content.time.com/time/specials/packages/article/0,28804,2097426_2097427_209
7458,00.html
The Economist, "Africa's impressive growth," 29 August 2014.
___________, "The stingy nanny", 16 October 2009. Retrieved on 6 February 2016, from
http://www.economist.com/node/15524092
___________, "Welfare in Singapore: Singapore government response", 17 February 2010.
Retrieved on 6 February 2016, from http://www.economist.com/node/15541423
The New York Times, "Late Nigerian Dictator Looted Nearly $500 Million - Swiss Say", 19
August 2004. Retrieved on 2 April 2006, from
http://www.nytimes.com/2004/08/19/world/late-nigerian-dictator-looted-nearly-500-
million-swiss-say.html
Thomson A., “An Introduction to African Politics,” London and New York: Routledge, 2006.
Thorbecke, Erik, "The institutional foundations of macroeconomic stability: Indonesia versus
Nigeria', in Yujiro Hayami and Masahiko Aoki (eds), The institutional foundations of
East Asian economic development: proceedings of the IEA conference held in Tokyo,
Japan, pp. 106-39, Houndmills, Basingstoke: Macmillan, 1998.
Todaro M. and Smith S., “Economic Development," Pearson Education, Inc., United States of
America, 2012. ISBN 13: 978-0-13-801388
Today Online, "ActiveSG$100 for Singaporeans to play sport." Retrieved on 6 February 2016,
from http://www.todayonline.com/print/475546
Transparency International, “Corruption Perceptions Index 2014. Full table and rankings”.
Retrieved on 04 January, 2016, from http://www.transparency.org/cpi2014/results/
___________, "Introduction to Political Corruption," transparency.org, London, 25 March 2004, p.
13.

128
Tucci, John, "The Singapore health system – achieving positive health outcomes with low
expenditure", Towers Watson, 2010. Retrieved on 2 February 2016, from
http://www.watsonwyatt.com/europe/pubs/healthcare/render2.asp?ID=13850
Udofia, O. E., "Nigerian Political Parties: Their Role in Modernizing the Political System, 1920–
1966". Journal of Black Studies 11 (4): 435–447, 1981.
Ullman, Richard H., "Human Rights and Economic Power: The United States Versus Idi Amin,"
Foreign Affairs, April 1978.
UNCTAD, Technology and Innovation Report,” December 2015
UNESCO, "Adult literacy rate, population 15+ years (both sexes, female, male)", UIS Data Centre,
August 2015.
_________, “Global Monitoring Report, Education for All," 2010. Retrieved on 5 April 2016,
from http://en.unesco.org/gem-report/sites/gem-report/files/gmr2010-fs-ssa.pdf
United Nations, “LDC‟s List,” 2006. Retrieved on 14 February 2016, from
http://www.un.org/special-rep/ohrlls/ldc/list.htm
__________, “The Employment Imperative: Report on the World Social Situation 2007”, New
York: UN, 2007. pp.98-99
United Nations Development Programme, "2015 Human Development Report Statistical Annex."
Retrieved on 04 January, 2016, from
http://hdr.undp.org/sites/default/files/hdr_2015_statistical_annex.pdf
United Nations Economic Commission for Africa, "Africa remains hungry despite $3billion annual
food aid and $33 billion on food imports," ECA Press Release No. 11/2010
United Nations Population Fund, "The State Of The World's Midwifery". Retrieved on 17
February 2016, from
http://www.unfpa.org/sowmy/report/home.html
U.S. Energy Information Administration (U.S. EIA), “Nigeria Country Analysis Brief,” December
1997.
United States Library of Congress, "Country Profile – Nigeria", Federal Research Division. July
2008.
Vlasblom, Dirk, "The Richer Harvest - Economic development in Africa and Southeast Asia," the
African Studies Centre: Leiden, 2013.
129
Vuong, Quan Hoang; Napier, Nancy K. (Jul 2014). "Resource Curse or Destructive Creation in
Transition: Evidence from Vietnam's Corporate Sector". Management Research
Review 37 (7): 642–657. doi:10.1108/mrr-12-2012-0265.
Wain, Barry, “Malaysian Maverick: Mahathir Mohamad in Turbulent Times,” Palgrave
Macmillan, 2010. ISBN 0-230-23873-4.
World Airport Awards, "2006 Airport of the Year result", 31 December 2006. Retrieved on 18
February 2016, from
https://web.archive.org/web/20061231160516/http://www.worldairportawards.com/A
wards-2006/AirportYear-2006.htm
World Bank, "Africa's impressive growth," 29 August 2014.
_________, “Can Africa Claim the 21st Century?,” Washington, D.C.: World Bank, 2002.
_________, “Data”, http://data.worldbank.org
_________, “The East Asian Miracle: Economic Growth and Public Policy (Summary)”,
Washington, D.C.: World Bank, 1993. p.12.
_________, “Literacy Indicator.” Retrieved on 6 February 2016, from
http://data.worldbank.org/indicator/SE.ADT.1524.LT.ZS
World Health Organization, "Core Health Indicators Singapore", May 2008. Retrieved on 2
February 2016, from
http://apps.who.int/whosis/database/core/core_select_process.cfm
___________, "The World Health Report," 2000. p. 66. Retrieved on 2 February 2016, from
http://www.who.int/whr/2000/en/whr00_en.pdf
____________, "World Health Organization Assesses the World's Health Systems", Geneva, 21
June 2000. Retrieved on 2 February 2016, from
http://www.who.int/whr/2000/media_centre/press_release/en/index.html
Wurthmann, Geerd, “Ways of Using the African Oil Boom for Sustainable Development,”
African Development Bank – Economic Research Working Paper no 84, March 2006.

130
APPENDICES
Appendix I: Letter of Introduction
Date ……./……………../2016
TO WHOM IT MAY CONCERN
Dear Sir/Madam:
REQUEST FOR COLLECTION OF DATA
My name is L. CHAMBERS UMEZULIKE, a Masters‟ student at the Institute of Diplomacy and International
Studies, College of Humanities and Social Sciences, University of Nairobi.
I am conducting a research study titled “RESOURCE-BASE, LEADERSHIP, POLICY AND ECONOMIC
DEVELOPMENT IN AFRICA AND SOUTHEAST ASIA: A COMPARATIVE STUDY OF NIGERIA AND
SINGAPORE (1960 - 2000)”. You have been selected to form part of this study.
Kindly assist by filling in the attached interview guide. The information given will be treated in strict confidence
and will be purely used for academic purposes.
Your assistance and cooperation will be highly appreciated.
Yours Sincerely,
L. Chambers Umezulike, R50/75038/2014

131
Appendix II – Consent Form
Title of the Study: “Resource-Base, Leadership, Policy and Economic Development in Africa and Southeast
Asia: A Comparative Study of Nigeria and Singapore (1960 - 2000).”
Institution: Institute of Diplomacy and International Studies, Faculty of Arts, College of Humanities and Social
Sciences, University of Nairobi, P.O.BOX 30197-00400, Nairobi.
Investigator: L. Chambers Umezulike
Supervisor: Mr. Gerrishon Ikiara
Ethical Approval: University of Nairobi Ethical and Research Committee.
Permission is requested from you to participate in this research study. With principles that You:
Voluntarily agreement to participate in this study is voluntary
May wish to withdraw from the study at any point you deem fit.
May seek clarity to understand the nature and importance of this study
Purpose of the study: To analyse the economic development performances of Nigeria and Singapore, and find
out how policy processes, resource-base and leadership dynamics influenced these performances.
Procedures to be followed: With your cooperation, you will answer questions related to the objectives of this
study. All information obtained will be handled with confidentiality.
Risks: There will be no risks involved in this study to you.
Benefits: There may be no direct benefits to you but the results of this study will be useful in analysing the
economic development performances of Nigeria and Singapore, and find out how policy processes, resource-
base and leadership dynamics influenced these performances.
Assurance on confidentiality: All information obtained from you will be kept confidential and used for the
purpose of this study only.
Contacts: you may wish to contact me with regards to issues concerning this study through any of the various
addresses provided above.
I now request you to sign the consent form attached

132
CONSENT FORM “Resource-Base, Leadership, Policy and Economic Development in Africa and Southeast Asia: A Comparative
Study of Nigeria and Singapore (1960 - 2000).”
I________________________________ (respondent) give consent to the investigator to use the information that
I will provide him as part of his study and that the nature of the study has been explained to me by the
……………………………………………………………………………..
Signature___________________________________ Date________________________
I (field agent/researcher) confirm that I have explained the nature and effect of the study.
Signature___________________________________ Date________________________

133
Appendix III – Interview Guide
INTERVIEW GUIDE Ref. No ____________________________ Date ________________________/2016
QUESTIONS:
Tick and Fill as appropriate
SECTION A: DEMOGRAPHICS
1. Name (optional): ____________________________________________
2. Gender Male [ ] Female [ ]
3. What is your age? _______________________________Years
4. Name of organization? ________________________________________
5. What is your area of specialization? ____________________________________
6. What is your period of experience in the organization? __________________Years
7. Highest Level of education? ________________________________________
SECTION B: LEADERSHIP, POLICY AND ECONOMIC DEVELOPMENT IN NIGERIA
1. The leadership of the First Republic [1960 - 1966 (Nnamdi Azikiwe – Abubakar Tafawa Balewa)] rolled out the
First National Development Plan. Though the plan was interrupted by the first coup and following civil war:
i). In what ways did this plan record measurable progress?
___________________________________________________________________________
___________________________________________________________________________
___________________________________________________________________________
ii). What factors affected the effective implementation of this plan?
___________________________________________________________________________
___________________________________________________________________________
___________________________________________________________________________
2. General Yakubu Gowon (1967 - 1975) boasted that Nigeria’s problem was not money, but what to do with the
money during the early 70s’ oil boom. Given this massive financial muscle, why did his administration fail to
effectively achieve the objectives of the Second National Development Plan, especially on agriculture expansion
and industrialisation?
___________________________________________________________________________
___________________________________________________________________________
___________________________________________________________________________

134
3. Yakubu Gowon’s 1972 Indigenization Decree:
i). In what ways do you think that this decree affected Nigeria’s economy during his regime (1972 - 1975)?
___________________________________________________________________________
___________________________________________________________________________
___________________________________________________________________________
ii). How did this decree affect Nigeria’s Foreign Direct Investment and private sector practice immediately after
him (1975 - 1979)?
___________________________________________________________________________
___________________________________________________________________________
___________________________________________________________________________
4. Murtala Muhammed (1975 - 1976), dismissed more than 10,000 public officials and employees without benefits, on
different accounts. What are the socio-economic implications of this on years after his assassination?
__________________________________________________________________________
___________________________________________________________________________
___________________________________________________________________________
5. In line with the Third National Development Plan, General Olusegun Obasanjo’s (1976 - 1979) initiated the
Operation Feed the Nation program.
i). What were the impacts of this program?
___________________________________________________________________________
___________________________________________________________________________
___________________________________________________________________________
ii). What affected the effective implementation of this program?
___________________________________________________________________________
___________________________________________________________________________
___________________________________________________________________________
6. In line with the Fourth National Economic Development Plan, Shehu Shagari (1979 - 1983) initiated some socio-
economic reforms with proceeds from the oil boom. What were the effects of this on economic development?
___________________________________________________________________________
___________________________________________________________________________
___________________________________________________________________________
7. Shagari initiated an Economic Stabilization Program after the 1981 fall in oil price. How effective was this before
the end of 1983?
___________________________________________________________________________
___________________________________________________________________________
___________________________________________________________________________

135
8. Muhammadu Buhari (1983 - 1985) initiated some self reliance and protectionist economic measures and rejected
IMF’s development program. What were impacts of this on the economy under his regime?
___________________________________________________________________________
___________________________________________________________________________
___________________________________________________________________________
9. Under General Ibrahim Babangida, IMF’s SAP was implemented:
i). How did this affect Buhari’s economic protectionist policy?
___________________________________________________________________________
___________________________________________________________________________
___________________________________________________________________________
ii) What were SAP’s impacts on economic performance and development from 1985 – 1990 giving that Nigeria’s
economy was on a free fall before its implementation?
___________________________________________________________________________
___________________________________________________________________________
___________________________________________________________________________
iii) How does SAP’s implementation still affect Nigeria today?
___________________________________________________________________________
___________________________________________________________________________
___________________________________________________________________________
iv)What affected the implementation of General Babangida’s Rolling Plan?
___________________________________________________________________________
___________________________________________________________________________
___________________________________________________________________________
10. Do you think military-rule interferences negatively affected Nigeria‟s economic development performance? YES or
NO
11. Do you think that Nigeria’s economic development failure is as a result of leadership and policy crises? YES or
NO.
12. Is corruption systemic in the Nigerian socio-political system?
______________________________________
If YES, in what ways do you think the Nigerian economy has suffered as a result of corruption?
____________________________________________________________________________
____________________________________________________________________________

136
13. What are the measures that Nigeria could implement to curb corruption?
___________________________________________________________________________
___________________________________________________________________________
___________________________________________________________________________
14. What strategies should Nigeria adopt to curb leadership crisis which has deeply marred her National and
Economic Development?
___________________________________________________________________________
___________________________________________________________________________
___________________________________________________________________________
15. Currently, Nigeria faces security, economic, human security, oil revenues and power crises. What do you think that
the current Buhari Administration and future ones, should do to economically develop and industrialise Nigeria?
___________________________________________________________________________
___________________________________________________________________________
___________________________________________________________________________
SECTION C: COMPARING NIGERIA (AFRICA) AND SINGAPORE (SOUTHEAST ASIA)
1. Do you think that there is a significant correlation between leadership and economic development? YES or NO.
2. Do you think that good, purposeful leadership shapes economic development through policies and vice versa? YES
or NO.
3. Despite Africa’s richness, the continent remains poor and underdeveloped. What major factor can you attribute to
this?
___________________________________________________________________________
___________________________________________________________________________
___________________________________________________________________________
4. Considering that Nigeria (with abundant natural resources) and Singapore (with no natural resources) got
Independence in the same period, Singapore is now economically developed while Nigeria isn’t? What could you
attribute this to?
___________________________________________________________________________
___________________________________________________________________________
___________________________________________________________________________
5. In your estimation, what do you think the developed South East Asia countries (Singapore, Malaysia, South Kotrea,
Indonesia) have been able to do that African countries have not?
___________________________________________________________________________
___________________________________________________________________________
___________________________________________________________________________

137
Appendix IV – List of Respondents
1. Senior Lecturer of Political Science, University of Lagos – Dr. Paul Sewanu
2. Political Economist, University of Nigeria – Name Withheld
3. Professor of History, University of Ibadan – Prof Olayemi Akinwumi
4. Former Senator in Nigeria‟s 2nd
Republic – Name Withheld
5. Governor of Enugu State in Nigeria‟s 3rd
Republic – Dr Okwesilieze Nwodo
6. Former Junior Minister of Finance – Name Withheld
7. Politician – Former Gubernatorial Candidate in Anambra State - Name Withheld
8. Former Special Adviser to President Shehu Shagari (1979 – 1983) - Prof Pat Utomi
9. Senior Civil Servant at the Ministry of Finance – Name Withheld
10. Senior Lecturer, University of Benin – Name Withheld
11. Senior Civil Servant at National Planning Commission – Name Withheld
12. Governor of Kaduna State in Nigeria‟s 2nd
Republic - Balarabe Musa
13. Senior Lecturer of Economics, University of Benin – Name Withheld
14. Professor of Political Science, University of Benin – Name Withheld
15. Professor of Economics, University of Benin – Name Withheld
16. Senior Lecturer of Economics, University of Nigeria - Dr Agu Cletus
17. Senior Lecturer of Development Economics, University of Nigeria - Dr Mrs. Gladys Aneke
18. Senior Lecturer of Economics, University of Lagos – Name Withheld
19. Senior Lecturer of Economics, University of Lagos - Dr Akanni Olayinka Lawanson
20. Professor of Economics, University of Ibadan – Name Withheld
21. Professor of Economics, University of Ibadan –Name Withheld
22. Senior Civil Servant at National Planning Commission - Dr. Abdul Garba