retrieval of total precipitable water and cloud liquid ... · pdf fileretrieval of total...
TRANSCRIPT
1
Retrieval of Total Precipitable Water and Cloud Liquid Water Path from Jason-2 AMR Observations
Fuzhong Weng 1 , Wei Yu 2 , Ninhai Sun 3
1. Satellite Calibration & Data Assimilation Branch/STAR/ NESDIS/NOAA, 5200 Auth Road, Camp Springs, Md 20746
2. Dell Inc. for NOAA 5200 Auth Road, Camp Springs, Md 20746 3. IMSG Inc. for NOAA 5200 Auth Road, Camp Springs, Md 20746
Abstract
Total precipitable water (TPW) and cloud liquid water path (CLW) retrieval algorithms
developed for Advanced Microwave Sounding Unit (AMSU) operational missions are
applied to Advanced Microwave Radiometer (AMR)’s measurements on board Jason-2.
The channel frequency shift issue, from 31.4 GHz in AMSU to 34 GHz in AMR, is
replaced by mapping AMR measurements to AMSU using Simultaneous Nadir
Overpasses (SNO). The comparison between our AMR retrievals and Centre National
d’Etudes Spatiales (CNES) products using original AMR measurements and the
comparison between our AMR retrievals and the TPW and CLW retrieved from AMSU’s
measurements demonstrate a high consistence, particularly in the TPW retrievals. Our
analyses show that 1. large TPW values move northward slowly while the intensities get
slightly stronger from April to September then move gradually southward with the
intensities becoming weaker from October to March; 2. large values are near tropical
region and small values near pole regions which reflect more water vapor with high
evaporation, more clouds and precipitations in low latitudes and less water vapor with
low evaporation, less clouds and precipitations in high latitudes; 3. there are more water
vapor with high evaporation, more clouds and precipitation in summer than in winter; 4.
there are more CLW over Storm Tracks (North Atlantic, North Pacific), Inter-tropical
Convergence Zone (ITCZ) and South Pacific Convergence Zone (SPCZ); 5. the TPW
values are about 100 times larger than those of CLW. The global oceanic monthly,
seasonal, yearly composite of TPW clearly illustrate characteristic meteorological
features which indicate that such method can be adapted for other microwave instruments
2
with similar frequencies for satellite meteorology applications and satellite climate trend
study.
1. Introduction
Water vapor is vital for understanding global hydrologic cycle and
dynamics of atmospheric circulation. It impacts atmospheric chemistry,
pollution and climate trend monitoring. Total precipitable water (TPW) or
total water vapor (TWV) plays a major role to short range weather
prediction as precipitation, flash flood and other severe weather are closed
related to distribution of water vapor. Clouds are important in the global
climate change and weather as clouds control the planetary albedo and are
precursor of precipitation. The critical role of clouds in the radiative balance
of the Earth is widely recognized. Cloud Liquid Water (CLW) also plays a
key role in the transport of energy (latent heat) in the earth-atmosphere
system. Among the variables in the cloud radiation interactions and feedback
processes, cloud liquid water is identified as one of the most important
factors. Researcher and operation forecaster can use CLW to access cloud
properties and aircraft icing [Bernstein et al. 2005; Guan et al. 2001].
The measurements of TPW and CLW from observations of Radio-
sonde (RAOBs), ground based microwave radiometers and research
aircrafts have been well documented by previous studies [Pratt 1985; Wade
1994; Guan et al. 2001 and 2002; Cober et al. 1996; Han and Westwater
1995; Solheim et al.1998; Vaillancourt et al.2003; Tremblay et al., 2003].
Many researchers have focused on the retrieval of TPW and CLW by
microwave radiometers aboard satellites or on the development of
algorithms for different satellites to retrieval TPW and CLW since the
3
launch of the Special Sensor Microwave Imager (SSM/I) [Alishouse et al.
1990a,b; Ferraro et al. 1996; Grody et al. 2001; Greenwald et al. 1993;
Kokhanovsky et al. 2006; Liu and Curry 1993; Weng and Grody 1994a,b;
Weng et al. 1997 and 2003; Wentz 1997]. These effects have increased the
application of the satellite retrieved TPW and CLW to numerical models
[Deblonde and Wagneur 1997] and climate analysis [Jackson and Stephens
1995; Trenberth and Guillemot 1995]. However, not only inter-comparisons
between CLW algorithms from different satellites have shown significant
differences, but also the retrieved values of CLW using different algorithms
have remain large discrepancies because of the difficulty in validating the
satellite-derived values of Liquid Water Path (LWP) [Liu and Curry 1993].
It took lots of time, energy and cost for the remote sensing community to
develop many new algorithms for different observation platforms with big
different results especially for CLW path.
The primary mission of recently launched Jason-2 is to measure sea
surface heights for determining ocean circulation, climate change and sea-
level rise. The altimetric sea surface height (SSH) measurements are derived
from the difference between the orbit altitude of the satellite and the
corrected range measurement from the altimeter [Desai and Haines 2004].
One of the largest error sources for the corrected range measurement is the
wet troposphere path delay in which total water vapor play a crucial role and
cloud liquid water play a smaller role. Since pocket of high humidity can
have limited size and travel fast, modeling of these phenomena is extremely
difficult. Therefore, most altimeter satellites carry a microwave radiometer
that senses the radiation from the earth at two or three distinct frequencies in
the range of 18 to 37 GHz, in which absorption by water vapor and liquid
water occurs. The measured radiation at these frequencies is expressed in
4
terms of brightness temperatures (TBs). These TBs can be converted to
estimates of total water vapor and liquid water content which in turn
determine attenuation and path delay of the altimeter radar pulse. The third
radiometer frequency is used to estimate and eliminate the effect of sea
surface roughness and foam on the brightness temperatures [Scharroo et al.
2004]. In order to save time and cost, instead of developing another
algorithm for TPW and CLW of AMR measurements the operational AMSU
water vapor and cloud algorithms of Weng et al. [2003] combined with a
linear mapping technique is used to retrieve TPW and CLW simultaneously
with brightness temperature measurements from channel 23.8 and 34.0 GHz
of Advanced Microwave Radiometer (AMR) on board satellite Jason-2
under Simultaneous Nadir Overpasses (SNO) condition for 95% global
unfrozen ocean environment. The combination technique is evaluated by
comparing our retrieved TPW and CLW to AMSU-A’s retrieved quantities
based on traditional well tested 23.8 and 31.4 GHz microwave radiometric
retrieval technique for AMSU-A’s measurements and also by comparing our
retrieved TPW and CLW to same quantities retrieved by CNES based on
their technique on the same AMR brightness temperature measurements.
2. Linear Mapping between AMSU-A and AMR under SNO condition
a. Dataset
Advanced Microwave Radiometer (AMR) on board of Jason-2 that was
launched on June, 20 2008 is a nadir viewing passive microwave instrument
which collects radiation reflected by the oceans at frequencies of 18.7, 23.8
and 34.0 GHz with a spatial resolution near 25 km. In this study, AMR
5
brightness temperatures at channel 23.8 and 34.0 GHz were used to retrieve
total precipitable water and cloud liquid water over oceans for the period
spanning from June 22, 2008 to Dec. 31, 2009. The same retrieval procedure
can be used for data of other years when all data of other years become
available in order to get more accurate mapping coefficients. There are three
families of geophysical data records (GDRs) of Jason-2 products in NetCDF
format, distinguished by increasing latency and accuracy, going from the
operational GDR (OGDR, available 3-5 hours), to the Interim GDR (IGDR
available 1-2 days), to the final GDR(available around 60 Days). The final
GDR data were used here as it is most completed, accurate and validated
data. The data covers the entire Earth between 66.15 S to 66.15 N that is
about global 95% unfrozen ocean environment.
b. Inter-satellite Calibration of AMSU-A and AMR Radiometers Using the SNO Method
Simultaneous Nadir Overpass (SNO) uses a novel approach that takes
advantage of inter-satellite calibration with SNO observations at the orbital
intersections between each succeeding pair of satellites. At each SNO,
radiometers from each pair of satellites view the same place at the same time
at nadir, thus eliminating uncertainties associated with the atmospheric path,
view geometry, and time differences. As a result, uncertainties in the inter-
satellite calibration are greatly reduced. This method is useful for the on-
orbit verification of instrument performance for newly launched radiometers,
calibration transfer from instruments on one satellite to those on another, as
well as retrospective analyses of historical data in constructing time series
for climate studies [Cao et al. 2005].
In this project, SNO observations contain brightness temperatures from
AMR and AMSU-A. Criteria for the SNOs are: 1) at the SNO, the distance
6
between nadir pixels of two orbits < 20 km; 2) time difference between nadir
pixels of the two orbits is less than 5 minutes. A pixel by pixel match is
performed for the matchup data between the two satellites based on the
latitude and longitude of each pixel.
c. Linear Mapping Technique
Since the first launch of the Advanced Microwave Sounding Unit
(AMSU) onboard NOAA-15, the products including cloud liquid, water
vapor, rain rate, snow cover and sea ice concentration have been
operationally generated by NOAA with a quality similar to those derived
from SSM/I although the AMSU only has four window channels. Since
AMR has two channels similar to AMSU-A, the operational AMSU water
vapor and cloud algorithms can be directly used for AMR after channels are
linearly mapped into AMSU-A channels. This linear mapping also calibrates
AMR data using AMSU-A as a reference.
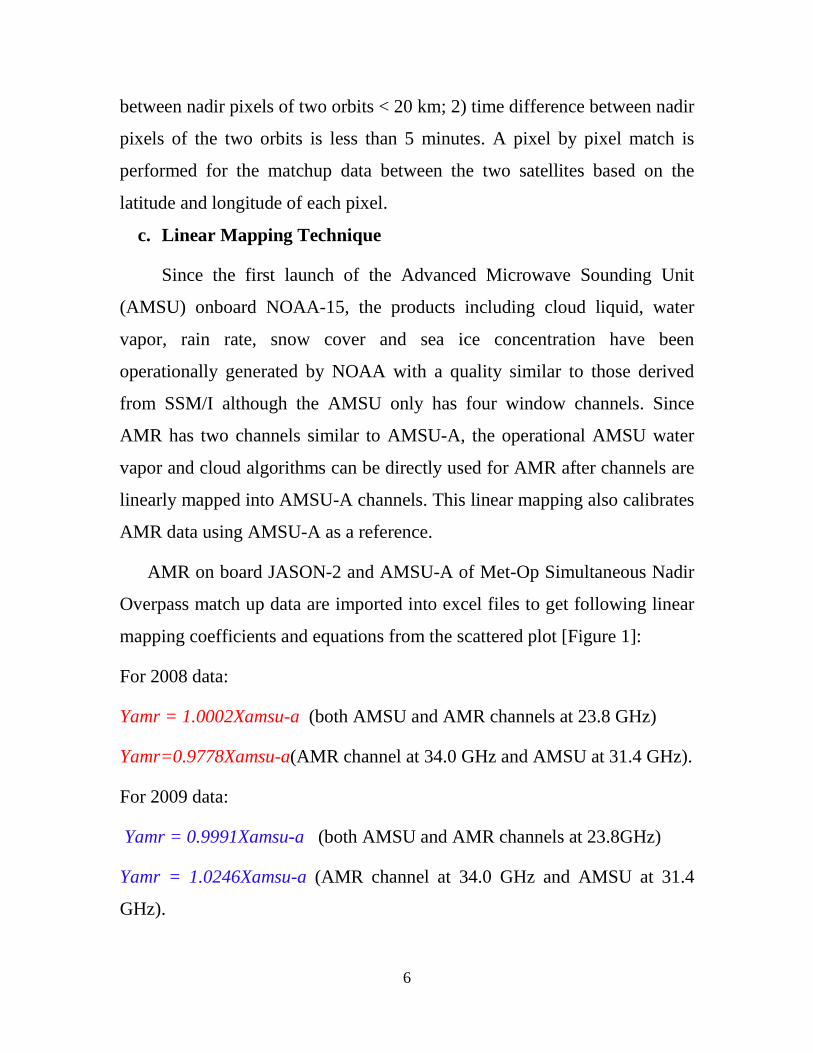
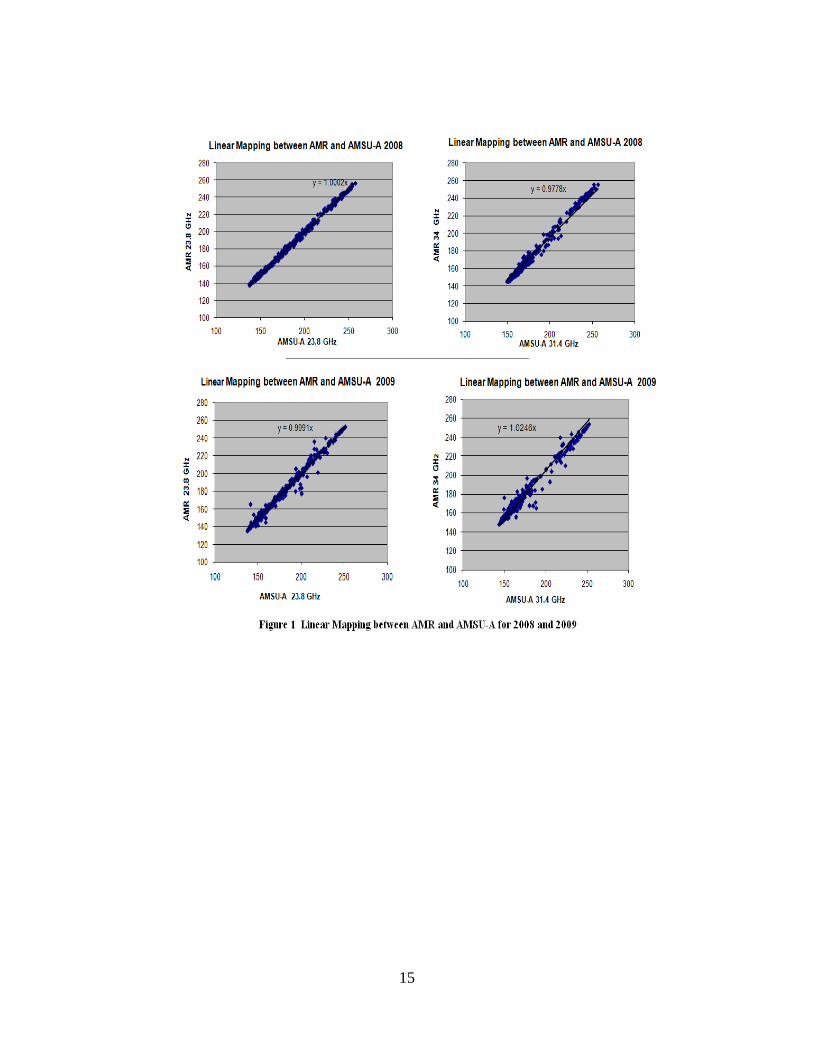
AMR on board JASON-2 and AMSU-A of Met-Op Simultaneous Nadir
Overpass match up data are imported into excel files to get following linear
mapping coefficients and equations from the scattered plot [Figure 1]:
For 2008 data:
Yamr = 1.0002Xamsu-a (both AMSU and AMR channels at 23.8 GHz)
Yamr=0.9778Xamsu-a(AMR channel at 34.0 GHz and AMSU at 31.4 GHz).
For 2009 data:
Yamr = 0.9991Xamsu-a (both AMSU and AMR channels at 23.8GHz)
Yamr = 1.0246Xamsu-a (AMR channel at 34.0 GHz and AMSU at 31.4
GHz).
7
3. AMR Water Vapor and Cloud Liquid Water Retrievals
a. AMSU-A Water Vapor and Cloud Algorithms
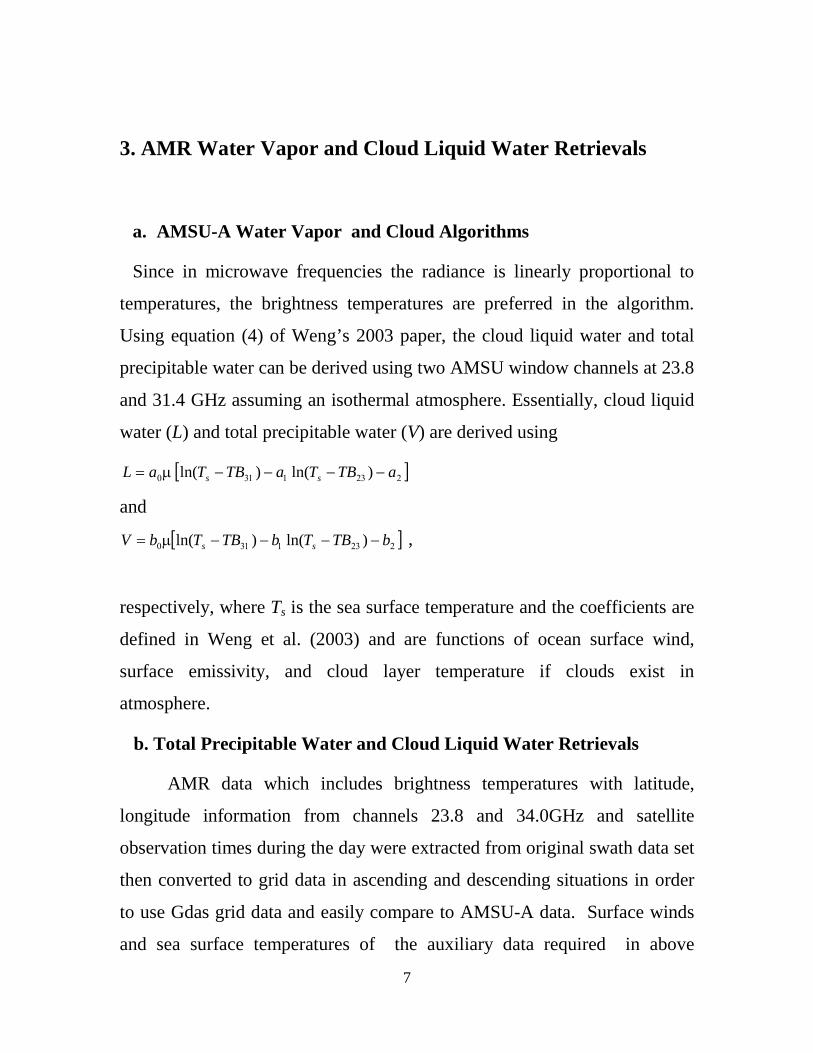
Since in microwave frequencies the radiance is linearly proportional to
temperatures, the brightness temperatures are preferred in the algorithm.
Using equation (4) of Weng’s 2003 paper, the cloud liquid water and total
precipitable water can be derived using two AMSU window channels at 23.8
and 31.4 GHz assuming an isothermal atmosphere. Essentially, cloud liquid
water (L) and total precipitable water (V) are derived using
[ ]2231310 −−−−µ= aTBTaTBTaL ss )ln()ln(
and
[ ]2231310 −−−−µ= bTBTbTBTbV ss )ln()ln( ,
respectively, where Ts is the sea surface temperature and the coefficients are
defined in Weng et al. (2003) and are functions of ocean surface wind,
surface emissivity, and cloud layer temperature if clouds exist in
atmosphere.
b. Total Precipitable Water and Cloud Liquid Water Retrievals
AMR data which includes brightness temperatures with latitude,
longitude information from channels 23.8 and 34.0GHz and satellite
observation times during the day were extracted from original swath data set
then converted to grid data in ascending and descending situations in order
to use Gdas grid data and easily compare to AMSU-A data. Surface winds
and sea surface temperatures of the auxiliary data required in above
8
algorithm formula are taken from Global Data Assimilation System (Gdas)
which is a grid data from 1 -360 and 90 S-90 N with both latitude /
longitude resolution at 1 degree. To get the correspondent Gdas data for
satellite observation, 4 Gdas files are read simultaneously and interpolated
by weight spatially and temporarily according to satellite observation time.
AMR brightness temperatures with correspondent auxiliary Gdas sea
surface winds and sea surface temperature data were substituted into AMSU
water vapor and cloud retrieval algorithm equations based on above
mapping relation to get daily AMR total precipitable water and cloud liquid
water data for 2008, 2009 [Figures 2 a, b, d, e]. The monthly averaged TPW
and CLW are also computed and plotted [Figure 2 c, f].
4. Preliminary Results and AMR Linear Mapping
Algorithm Performance
a. Preliminary Results
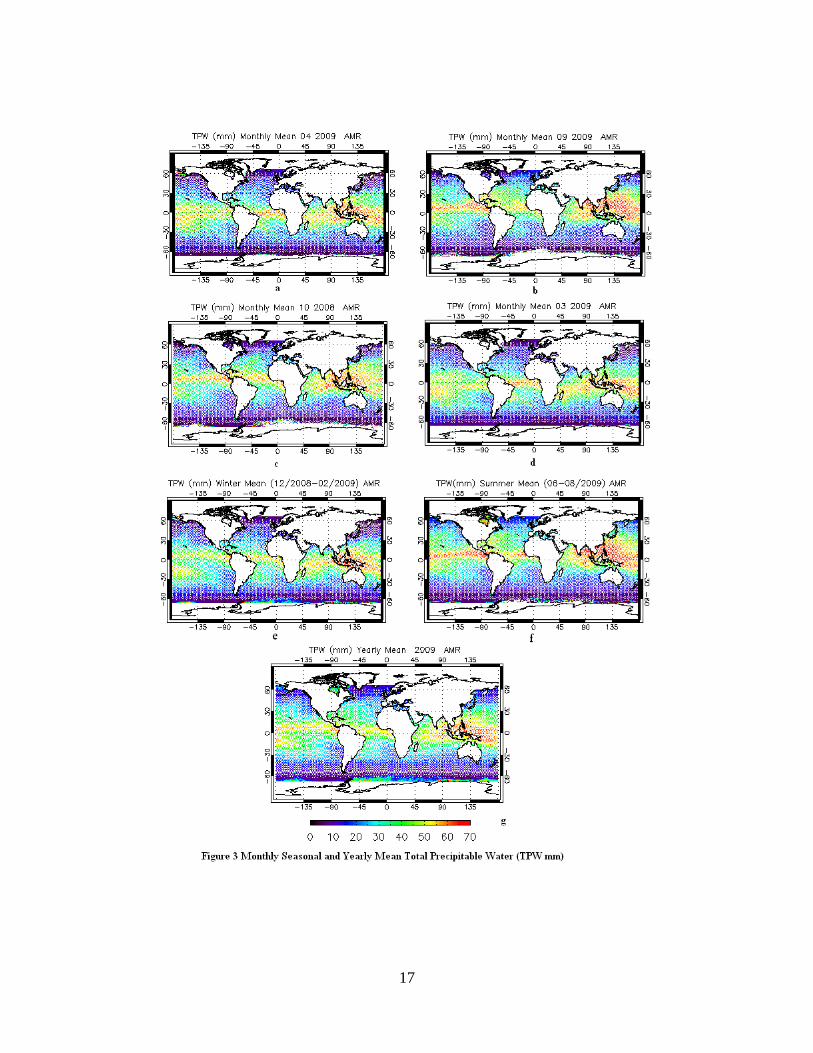
TPW were retrieved over ocean only for this study. All daily,
monthly, seasonal and yearly TPW maps show the large values near tropical
region and small values near pole regions which reflect more water vapor
with high evaporation, more clouds and precipitations in low latitudes and
less water vapor with low evaporation, less clouds and precipitations in high
latitudes. The monthly averaged maps indicate that the large TPW values in
red move northward slowly while its intensities get slightly stronger (red
areas becoming larger and brighter) from April to September (April 2009 to
Sept. 2009 see Figure 3 a, b) then move gradually southward with their
intensities becoming weaker from October to March (Oct. 2008 to March
2009 see Figure 3 c, d; Only first and last monthly maps are given here, all
9
other monthly mean plots are available upon request). We can monitor the
location, extent and movement of tropical moisture from these movements
which is useful for operation forecaster to do severe weather and
precipitation forecast.
The analysis from seasonal maps [Figures 3 e, f] illustrate that more
water vapor with high evaporation, more clouds and precipitation in summer
than those in winter. There are more TPW in Hudson Bay in summer than in
winter. The reddish and brighter areas along 66.15 S are most likely caused
by sea ices in those areas. The half year (available upon request) and yearly
averaged TPW [Figure 3 g] look similar to those of monthly and seasonal
average as Jason-2 satellite passes over the same point on the Earth's surface
(to within one kilometer) every ten days.
The relative large values which appear in red on the daily and
monthly CLW maps [Figures 2 d,e,f] demonstrate larger amount of cloud
water and more convective clouds in those areas and blue and green colors
show low to moderate amount cloud water or less cloud droplets in the
columns from surface to top of the atmosphere in those areas. There are
more CLW over Storm Tracks (North Atlantic, North Pacific), Inter-tropical
Convergence Zone (ITCZ) and South Pacific Convergence Zone (SPCZ) and
more sea ices showing in red and brighter colors along 66.15 S which are
consistent with CLW and sea ice pattern retrieved from AMSU-A. The
reasons that CLW pattern in the monthly AMR maps are not as obvious as
the pattern of TPW and not as clear as CLW pattern of AMSU-A are due
to: 1) clouds are naturally spottier and not continuous in the atmosphere and
in many places of the world there are no clouds with CLW values at zeros;
2) there are still gaps in the monthly averaged map due to Jason-2 satellite
10
passing over the same point on the Earth's surface (to within one kilometer)
every ten days. CLW is also valid over ocean only with values larger than
0.7mm being not reliable.
It is shown in both monthly mean and daily plots that TPW values are
about 100 times those of CLW which means that water content in the
column of atmosphere from surface to top is in the order of one hundred
time larger in vapor form than in liquid form. This result is in good
agreements with those from AMSU-A on board NOAA-KLM and AMSU-A
on board of EuMetSat’s Met-Op.
b. Linear Mapping Technique Performance
The correlation between AMRus (retrieved with our linear mapping
method) and AMSU-A for 08012009 (randomly selected) is at 0.9075 for
ascending and 0.9055 for descending in the TPW scattered plot [Figure 4 a,
b] after coastal contamination with islands or/and clouds is screened out.
The standard deviation of TPW from AMRus subtracting AMSU-A dataset
is 9.18993mm for ascending case and 8.75910mm for descending case. The
TPW RMS difference between AMRus dataset and AMSU-A dataset is
11.93mm for ascending and 11.41mm for descending which is good
considering many TPW values over 70mm.
TPW and CLW retrieved by Centre National d’Etudes Spatiales
(CNES) were also extracted from original AMR data set and used to
compare to our retrieved TPW and CLW in linear mapping technique with
very good agreements: The daily correlations between our retrieved TPW
and those of CNES retrieved for 08/01/2009 (randomly selected) are at
0.9751 for ascending and 0.9785 for descending [Figure 4 c,d]. The standard
deviation of TPW from AMRus subtracting AMRec (retrieved from CNES)
11
dataset is 3.02215mm for ascending case and 3.61641mm for descending
case. The TPW RMS difference between AMRus dataset and AMRec
dataset is 3.625 mm for ascending and 4.291 mm for descending for
08/01/2009 which is very good. The correlations of August of 2009 monthly
averaged TPW between our retrievals and theirs are at 0.9815 for ascending
and 0.9823 for descending [Figure 4e, f]. However, the correlations are a bit
lower when smaller TPW values are included for either daily or monthly
correlations.
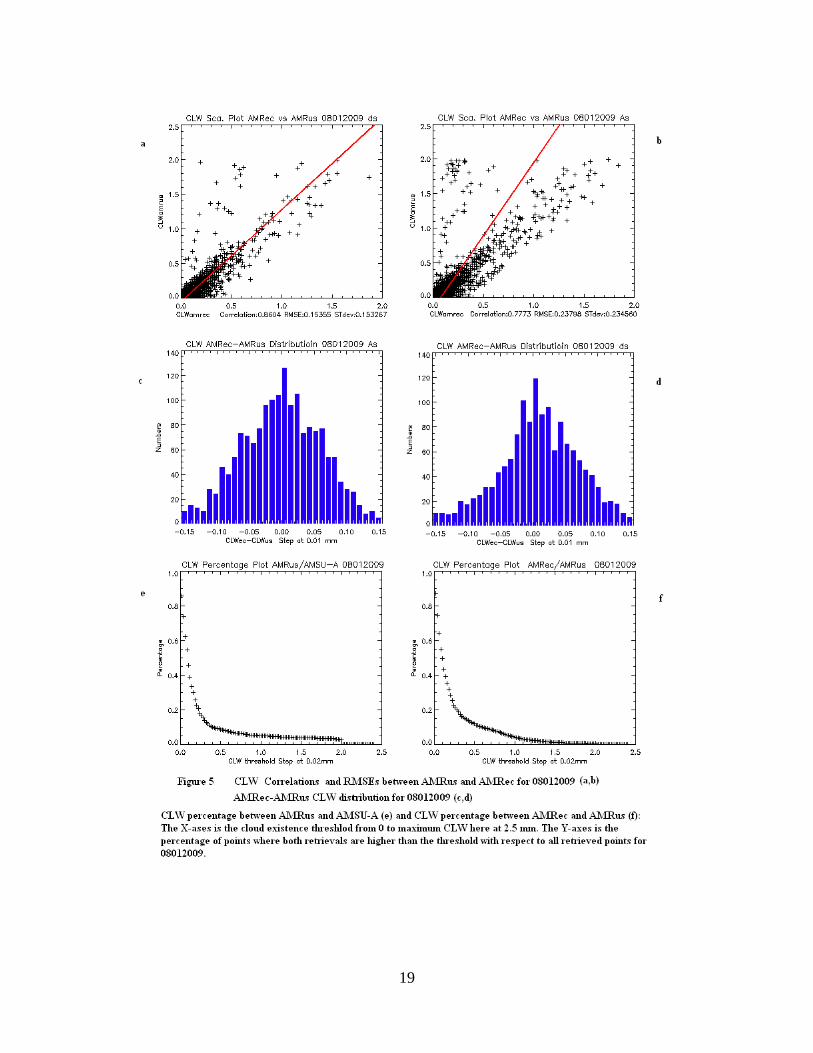
The CLW correlation between our AMR daily retrieved and CNES
AMR retrieved is at 0.8604 for descending and 0.7773 for ascending [Figure
5 a, b] for 08/01/2009 which is better than the CLW correlation between our
AMR retrievals to AMSU-A retrievals. The randomly selected CLW
correlation values for other days (available upon request) are between
0.7773 to 0.8604. The standard deviation of CLW from AMRus subtracting
AMRec dataset is 0.153267mm for descending case and 0.23456mm for
ascending case for 08/01/2009. The CLW RMS difference between AMRus
dataset and AMRec dataset is 0.15355mm for descending and 0.23798mm
for ascending for the same date. Although the CLW correlation is not as
good as that of TPW it is still reasonable and realistic considering that CLW
is a less continuous and spottier parameter comparing to TPW. The results
are in good agreements with those of retrievals [Grody and Weng 2001] that
also showed larger variability of CLW in both space and time.
The bias distribution from CLWec subtracting CLWus are plotted
[Figure 5 c,d] as histogram which shows the numbers of CLWec-CLWus
falling in various ranges from -0.15 to 0.15mm with step increase at
0.01mm. The difference between CLWec and CLWus are plotted on the X
axis and their numbers on the Y axis. The histogram indicates that a rough
12
approximation of the CLWec subtracting CLWus number distribution is
near the normal distribution with large numbers located around the center of
the distributions.
The CLW is also evaluated qualitatively by plotting cloud cover
comparison between our linear mapping retrieval to AMSU-A retrievals and
our linear mapping retrievals to CNES retrievals [Figure 5 e, f]. The X-axes
is the cloud existence threshold from 0 to maximum CLW here at 2.5 mm.
The Y-axes is the percentage of points where both retrievals are higher than
the threshold with respect to all retrieved points. It is found between
0.01mm to 0.2mm thresholds both retrievals have the high consistence in
cloud existence for both AMRus vs. AMRec and AMRus vs. AMSU-A
cases.
5. Summary and Conclusions
The combination of the operational AMSU water vapor and cloud
algorithms with a linear mapping technique presented in this paper provides
a new tool for retrieval water vapor and cloud liquid water from AMR on
board Jason-2 whose primary mission is to measure sea surface heights.
Although TPW (or TWV) is a critical factor in achieving highest accuracies
in the determination of sea surface height the retrieved TPW and CLW can
be used widely in other weather and climate study and applications. Our
analyses not only provide some new and interesting results but also make an
inter-calibration polar orbiting radiometers between AMR on board Jason-2
and AMSU-A on board Met-Op to achieve the consistency of the climate
observations data. In summary the following points are included in this
paper:

13
1. The operational AMSU water vapor and cloud algorithms combined
with a linear mapping technique is used to retrieve total precipitable
water and cloud liquid water in the Simultaneous Nadir Overpasses
(SNO) condition from AMR’s measurements for 95% global
unfrozen ocean environment.
2. The linear mapping algorithm is evaluated by comparing retrieved
TPW and CLW with same quantities retrieved by AMSU-A based on
traditional well tested 23.8 and 31.4 GHz microwave radiometric
retrieval technique from AMSU-A’s measurements and also by
comparing our retrieval quantities to TPW and CLW retrieved by
CNES based on their technique on the same AMR measurements.
The TPW correlations between our retrievals and those retrieved by
CNES and between our retrievals and AMSU-A’s retrieval are very
good. The CLW correlation between our retrieval and CNES retrieval
is good and the CLW correlation between our retrieval to AMSU-A
retrieval is scattered.
3. Our analyzed results show that the large TPW values near tropical
region and small values near pole regions which reflect more water
vapor with high evaporation, more clouds and precipitations in low
latitudes and less water vapor with low evaporation, less clouds and
precipitations in high latitudes.
4. Our analyses from monthly mean plots indicate that the large TPW
values move northward slowly while intensities get slightly stronger
from April to September then move gradually southward with
intensities becoming weaker from October to March.
5. The analysis from season’s maps illustrates that more water vapor
with higher evaporation, more clouds and precipitation in summer
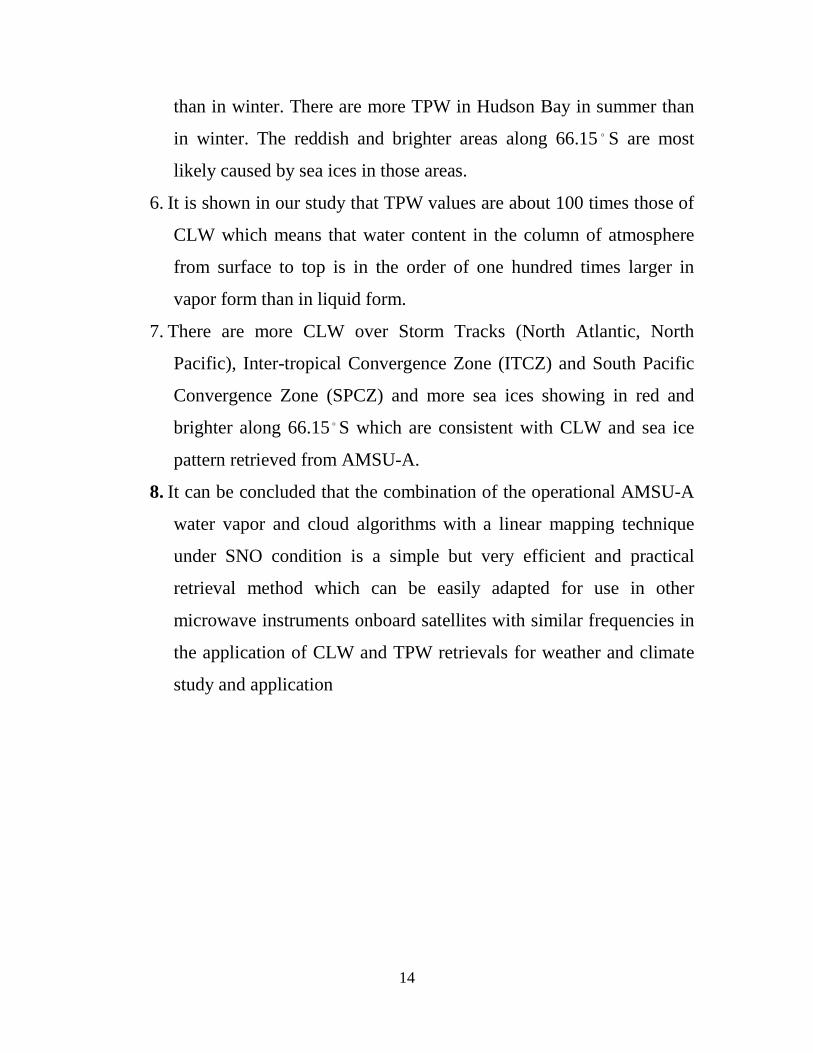
14
than in winter. There are more TPW in Hudson Bay in summer than
in winter. The reddish and brighter areas along 66.15 S are most
likely caused by sea ices in those areas.
6. It is shown in our study that TPW values are about 100 times those of
CLW which means that water content in the column of atmosphere
from surface to top is in the order of one hundred times larger in
vapor form than in liquid form.
7. There are more CLW over Storm Tracks (North Atlantic, North
Pacific), Inter-tropical Convergence Zone (ITCZ) and South Pacific
Convergence Zone (SPCZ) and more sea ices showing in red and
brighter along 66.15 S which are consistent with CLW and sea ice
pattern retrieved from AMSU-A.
8. It can be concluded that the combination of the operational AMSU-A
water vapor and cloud algorithms with a linear mapping technique
under SNO condition is a simple but very efficient and practical
retrieval method which can be easily adapted for use in other
microwave instruments onboard satellites with similar frequencies in
the application of CLW and TPW retrievals for weather and climate
study and application
15

16
17

18
19

20
References Alishouse, J., S. Snyder, J. Vongsathorn, and R. Ferraro, 1990a: Determination of oceanic precipitable water from the SSM/I, IEEE Trans, Geosci. Remote Sens., 28, 811–816. Alishouse, J., Snider, E. Westwater, C. Swift, C. Ruf, S. Snyder, J. Vongsathorn, and R. Ferraro, 1990b: Determination of cloud liquid water content using the SSM/I, IEEE Trans. Geosci. Remote Sens., 28, 817–822. Bernstein, B.C., F. McDonough, M. K. Politovich, B. G. Brown, T. P. Ratvasky, D. R. Miller, C. A. Wolff, G. Cunning, 2005: Current Icing Potential: Algorithm Description and Comparison with Aircraft Observations. Journal of Applied Meteorology 44:7, 969-986. Cao, C., P. Ciren, M. Goldberg, F. Weng, 2005, Inter-satellite calibration of HIRS from 1980 to 2003 using the simultaneous nadir overpass (SNO) method for improved consistency and quality of climate data, resented at the ITSC14, Beijing, May 2005. Cober, S.G., A. Tremblay and G.A. Issac, 1996: Comparisons of SSM/I Liquid Water Paths with aircraft measurements. J.Geophys. Res., 101D,503-519. Deblonde, G., and N. Wagneur, 1997: Evaluation of global numerical weather prediction analysis and forecasts using DMSP special sensor microwave imager retrievals, J. Geophys. Res., 102, 1833–1850. Desai, S.D., B.J. Haines, 2004: Monitoring measurements from the Jason-1 Microwave Radiometer and Independent validation with GPS, J. Mar. Geod. 27, 221-240.
Ferraro, R.R., F. Weng, N. Grody, and A. Basist, 1996: An eight year (1987-1994) time series of rainfall, clouds, water vapor, snow and sea ice derived from SSM/I measurements, Bull. Amer. Meteor. Soc., 77, 891-905. . Greenwald, T., G. Stephens, T. Vonder Haar, and D. Jackson, 1993: A physical retrieval of cloud liquid water over the global oceans using
21
Special Sensor Microwave/Imager (SSM/I) observations, J. Geophys. Res., 98, 18,471–18,488. Grody, N., J. Zhao, R. Ferraro, F. Weng and R. Boers, 2001: Determination of precipitable water and cloud liquid water over oceans from the NOAA 15 advanced microwave sounding unit. J. Geophys.Res., 106 D3, 2943–2953. Guan, H., S. G. Cober, and G. A. Isaac, 2001: Verification of supercooled cloud water forecasts with in situ aircraft measurements. Wea. Forecasting, 16:145–155. Guan, H. Stewart G. Cober, George A. Isaac, André Tremblay, André Méthot, 2002: Comparison of Three Cloud Forecast Schemes with In Situ Aircraft Measurements. Weather and Forecasting 17:6, 1226-1235. Han, Y., and E. R. Westwater, Remote sensing of tropospheric water vapor and cloud liquid water by integrated ground-based sensors, J. Atmos. Oceanic Technol., 5, 1050–1059, 1995. Jackson, D. L., and G. L. Stephens, 1995: A study of SSM/I-derived columnar water vapor over the global oceans, J. Clim., 8, 2025–2038. Kokhanovsky, A.A., V. V. Rozanov, T. Nauss, C. Reudenbach, J. S. Daniel, H. L. Miller, and J. P. Burrows, 2006: The semianalytical cloud retrieval algorithm for SCIAMACHY I, 2006: The validation. Atmos. Chem. Phys., 6, 1905–1911. Liu, G., and J.A. Curry, 1993: Determination of Characteristic Features of Cloud Liquid Water From Satellite Microwave Measurements. J.Geophys. Res., 98D3, 5069-5092. Norman G., J. Zhao, R. Ferraro, F. Weng, and R. Boers, 2001: Determination of precipitable water and cloud liquid water over oceans from the NOAA 15 advanced microwave sounding unit. J. Geophys. Res., 106D3, 2943-2953. Prat,R.W., 1985: Review of radiosonde humidity and temperature errors. J.Atmos. Oceanic Technol., 2, 404-407.
22
Scharroo, R., J. L. Lillibridge and W.H.F.Smith, 2004: Cross-Calibration and Long-Term Monitoring of the Microwave Radiometers of ERS, TOPEX, GFO, Jason, and Envisat. J. Mar. Geod. 27, 279-297. Solheim, F., J. R. Godwin, E. R. Westwater, H.Yong, S. J. Keihm, K. Marshand and R.Ware, 1998: Radiometric profiling of temperature, water vapor and cloud liquid water using various inversion methods. Radio Science, 33, 393-404. Tremblay, A., P. A. Vaillancourt, S. G. Cober, A. Glazer, G. A. Isaac, 2003: Improvements of a Mixed-Phase Cloud Scheme Using Aircraft Observations. Monthly Weather Review 131:4, 672-686. Trenberth, K. E., and C. J. Guillemot, 1995: Evaluation of the global atmospheric moisture budget as seen from analysis, J. Clim., 8, 2225–2272. Vaillancourt, P.A., A Tremblay, S. G. Cober, G. A. Isaac, 2003: Comparison of Aircraft Observations with Mixed-Phase Cloud Simulations. Monthly Weather Review 131:4, 656-671.
Wade, C,G,1994: An evaluation of problems affecting the measurement of
low relative humidity on the United States radio-sonde. J.Atmos. Oceanic Technol., 11,687-700. Weng, F., L. Zhao, R. Ferraro, G. Poe, X. Li, and N. Grody, 2003: Advanced Microwave Sounding Unit Cloud and Precipitation Algorithms. Radio Sci., 38, 8,086-8,096.
Weng, F., N. C. Grody and R. R. Ferraro and A. Basist and D. Forsyth, 1997: Cloud liquid water climatology derived from the Special Sensor Microwave Imager. J. Climate, 10, 1086-1098. Weng, F., and N. Grody, 1994a: Retrieval of cloud liquid water using the Special Sensor Microwave Imager (SSM/I), J. Geophys. Res., 99, 25,535–25,551.
Weng, F., and N. C. Grody, 1994b: Retrieval of liquid and ice water content in atmosphere using the special sensor microwave imager (SSM/I), Microwave Radiometer and Remote Sensing of Environment, Ed. by Solminili, VSP, Netherlands, p. 281 - 295.
23
Wentz, F. J., 1997: A well-calibrated ocean algorithm for SSM/I. J. Geophys. Res., 102, 8703–8718.