using gps to measure precipitable water vapor in antarctica
TRANSCRIPT
Using GPS to Measure Precipitable Water Vapor in Antarctica
Amanda MurrayGeorgia State University

TAMDEF GPS Receivers in Antarctica

GPS signal delays
• GPS is broadcast on
the L1 and L2 signals
• Precipitable Water
Vapor (PWV) can be
extracted from the
signal delay
www.redorbit.com/modules/reflib/article_images/21_aab02a40d790b5bdb771c2f0fd2fc6d0.jpgwww.trimble.com/gps/howgps-error.shtml
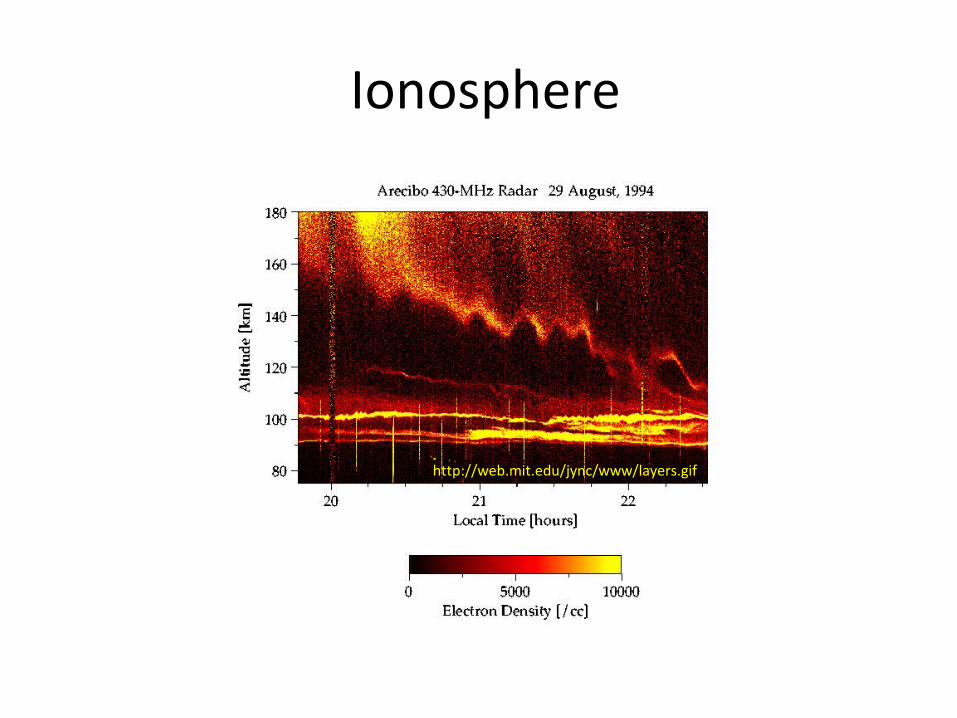
Ionosphere
http://web.mit.edu/jync/www/layers.gif

Atmospheric Mesoscale Prediction System
• At present, a reliable source for predictions• Predicts model data for multiple variables• Makes predictions every 6 hours
• 2-meter temperature (k)• Surface pressure (hPa)• Moisture (mm)
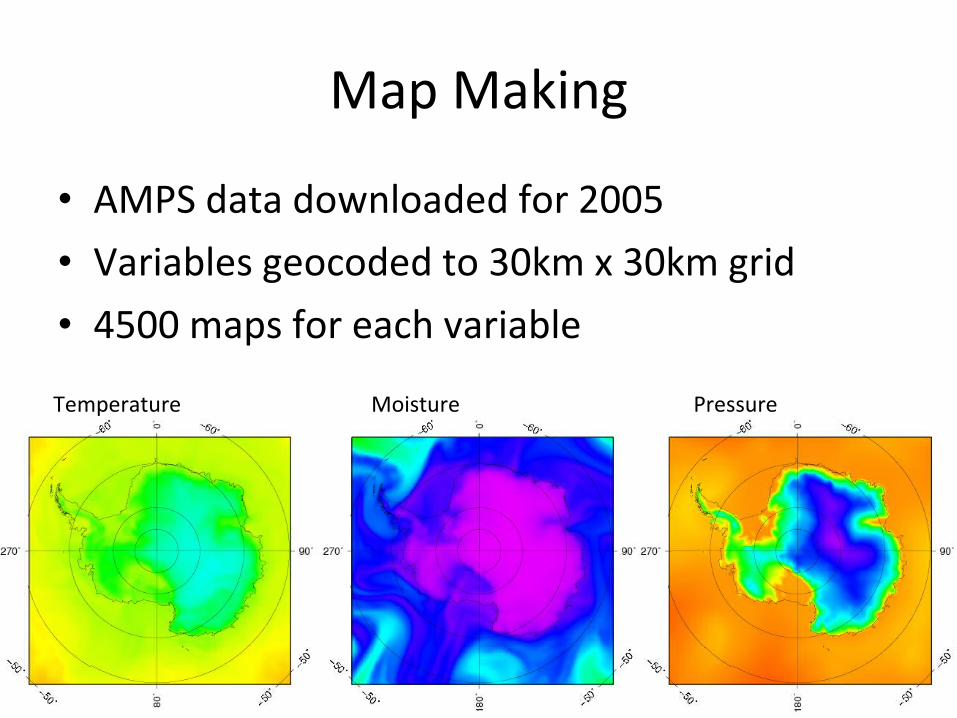
Map Making
• AMPS data downloaded for 2005
• Variables geocoded to 30km x 30km grid
• 4500 maps for each variable
Temperature Moisture Pressure

Animation for Moisture
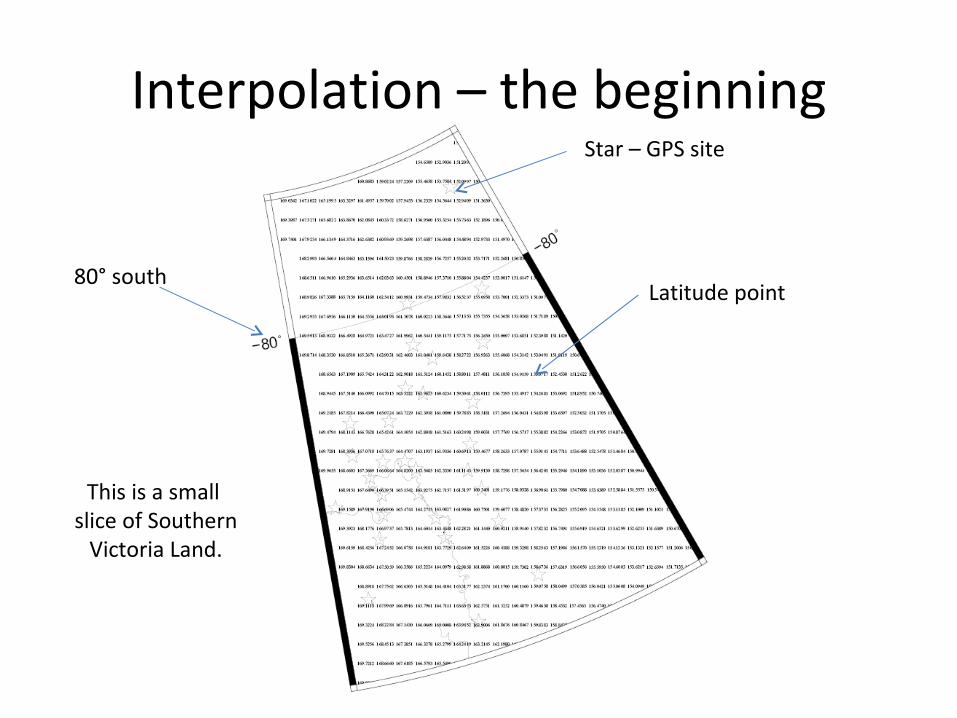
Interpolation – the beginningStar – GPS site
Latitude point80° south
This is a small slice of Southern
Victoria Land.
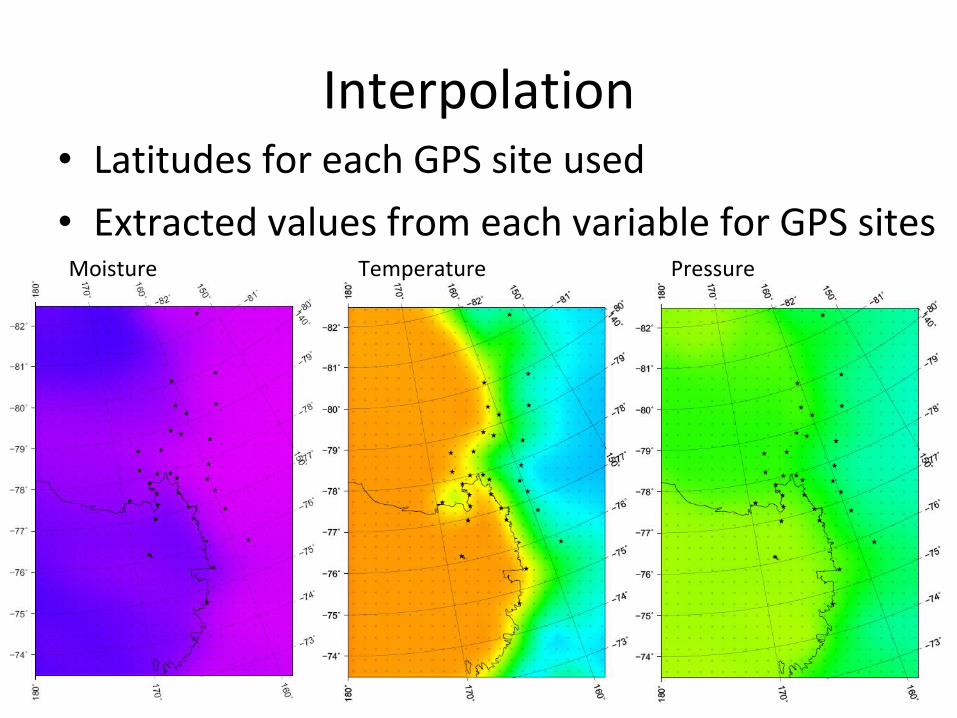
Interpolation• Latitudes for each GPS site used
• Extracted values from each variable for GPS sitesMoisture Temperature Pressure
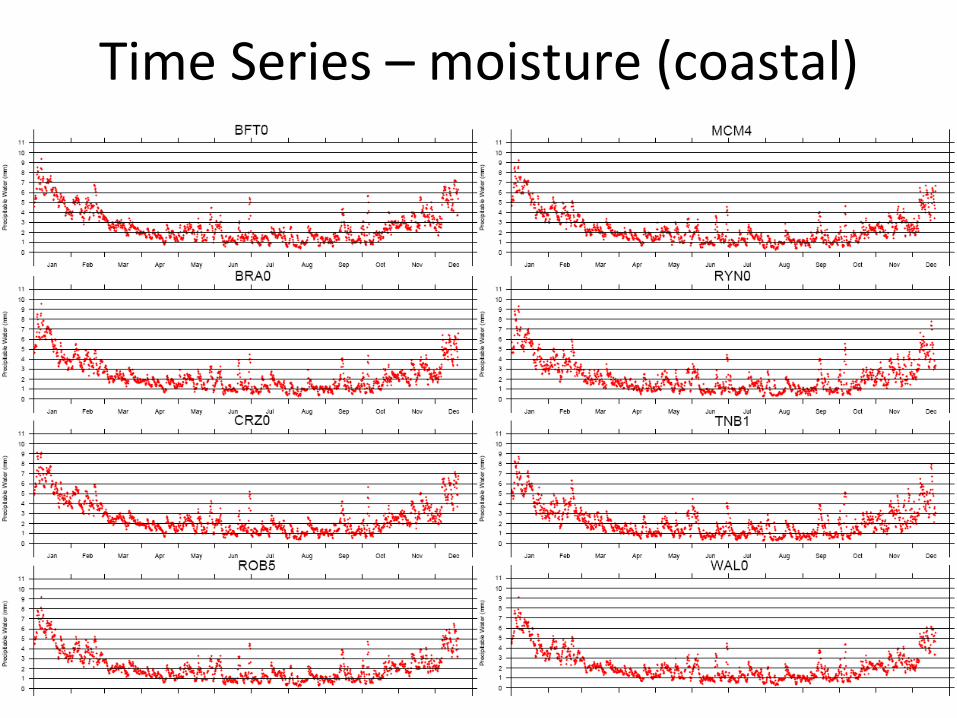
Time Series – moisture (coastal)

Time Series – Moisture (mixed)

Calculations
• ZHD = 2.2779*(Ps/(1-0.00266*COS(2λ)-0.00028*H))
• λ = latitude in radians
• H = height of GPS site above the ellipsoid in km
• Ps = surface pressure in hPa
• ZWD = ZPD - ZHD
• PW = П * ZWD
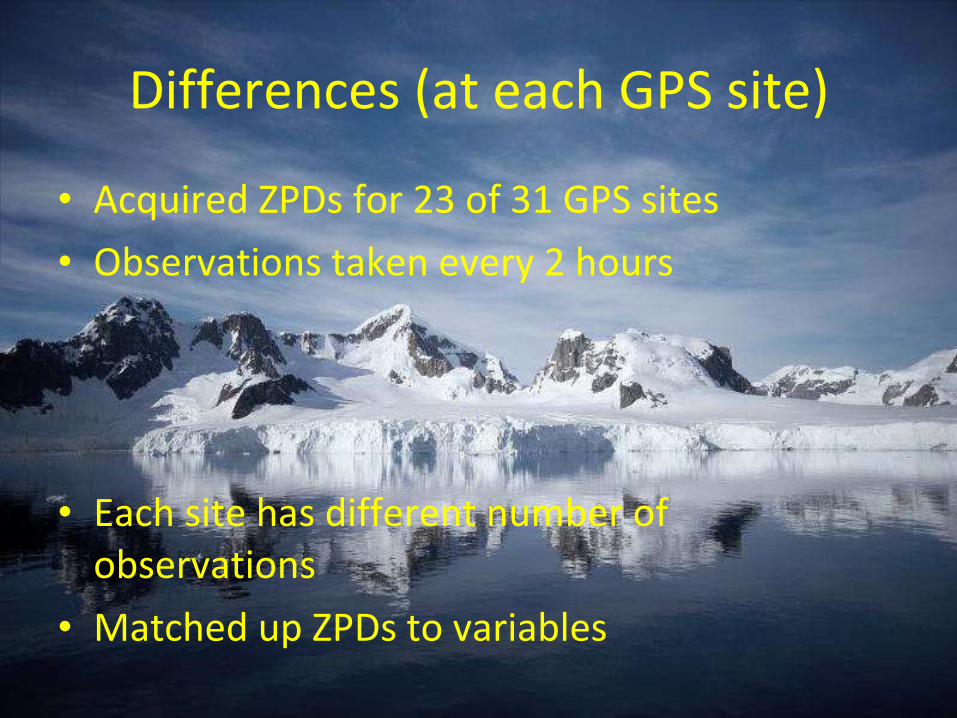
Differences (at each GPS site)
• Acquired ZPDs for 23 of 31 GPS sites
• Observations taken every 2 hours
• Each site has different number of observations
• Matched up ZPDs to variables

Zenith Neutral Delays – Time Series
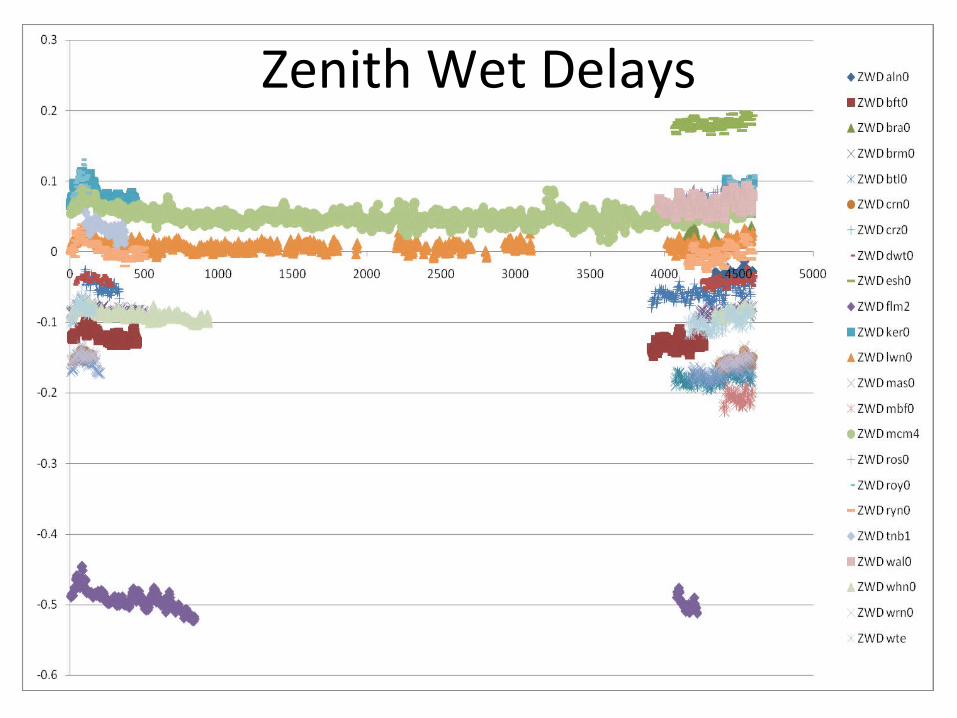
Zenith Wet Delays

Problems & Solutions• Possibly using 2 different ellipsoids• Pressure values could be inaccurate• Zenith Neutral Delays could be of bad quality
• Find out if model values are on a topographical model or ellipsoidal model
• Interpolate model ‘elevations’ and compare to actual height above ellipsoid
• Use interpolated values (if correct) in ZHD equation

Importance?
• More accurate weather forecasts
• Improve current climate models
• Contribute to studies of climate change
• Further insight into any ongoing climate change in Antarctica

Questions?
I would like to thank Dr. Mike Willis for working with me, Dr. Terry Wilson for letting me be a part of her project, Kelly Carroll for his help and support, everyone involved with OSU SROP and especially NSF and POLENET for making this opportunity available.
Thank you!