retrospect and looking forward: a review of two full years of open payments data and media coverage...
TRANSCRIPT
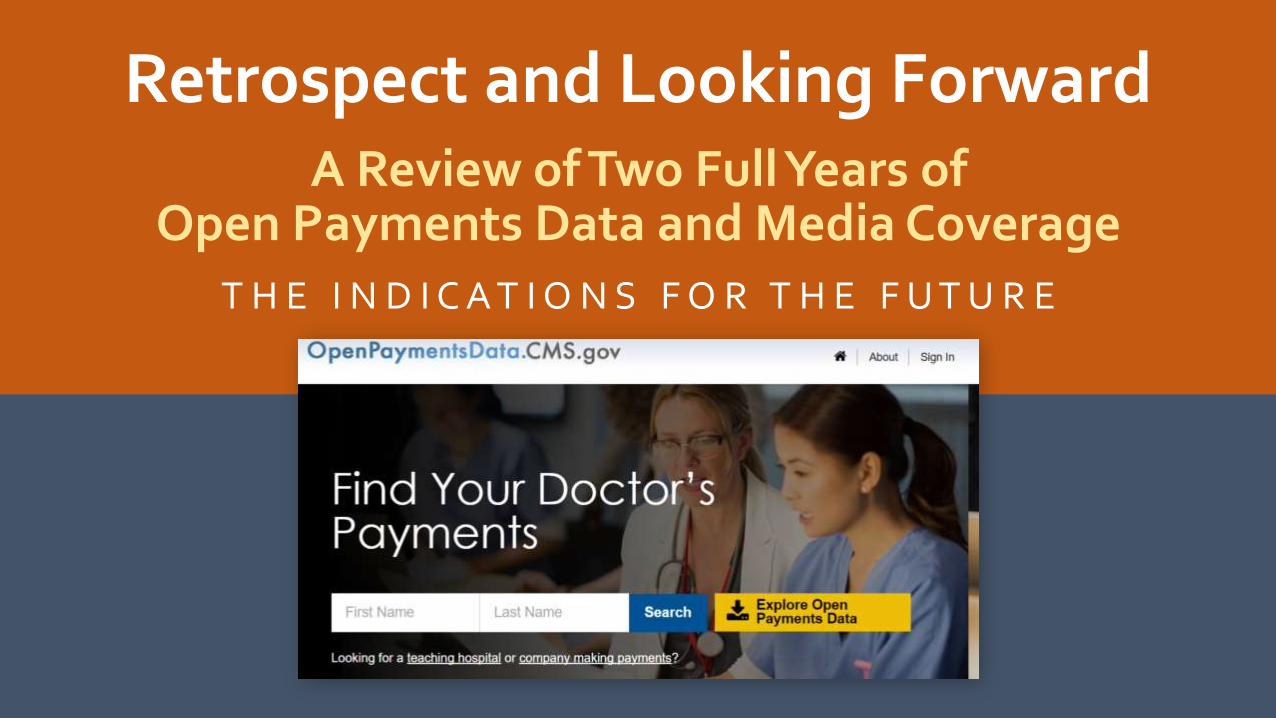
Retrospect and Looking Forward A Review of Two Full Years of
Open Payments Data and Media Coverage
T H E I N D I C A T I O N S F O R T H E F U T U R E
Thomas Sullivan
• Former political consultant who founded Rockpointe, Inc., a bio-medical education company in 1995
• Founder CME Coalition and Co-Founder ACRE
• Editor of Policy and Medicine
• Publisher Life Science Compliance Update
Agenda
• Review 2014-2015 Open Payments Data
• Discuss Media on Open Payments week of 2015 release
• Evaluate Prosecutions Using Open Payments
• Deliberate the CMS Questions on Open Payments
• Assess Congressional Actions on Open Payments
• Global Ag Spend and Media

Google Trends

The Data

Open Payments Data Summary
Overall2013
(5 Months)2014 2015
Difference 2014-2015
General Payments $1,010,000,000 $2,640,000,000 $2,600,000,000 -1.52%
Research Payments $1,810,000,000 $3,790,000,000 $ 3,890,000,000 2.64%
Ownership $1,080,000,000 $1,060,000,000 $1,030,000,000 -2.83%
Total 3,910,000,000 $7,490,000,000 $7,520,000,000 0.40%

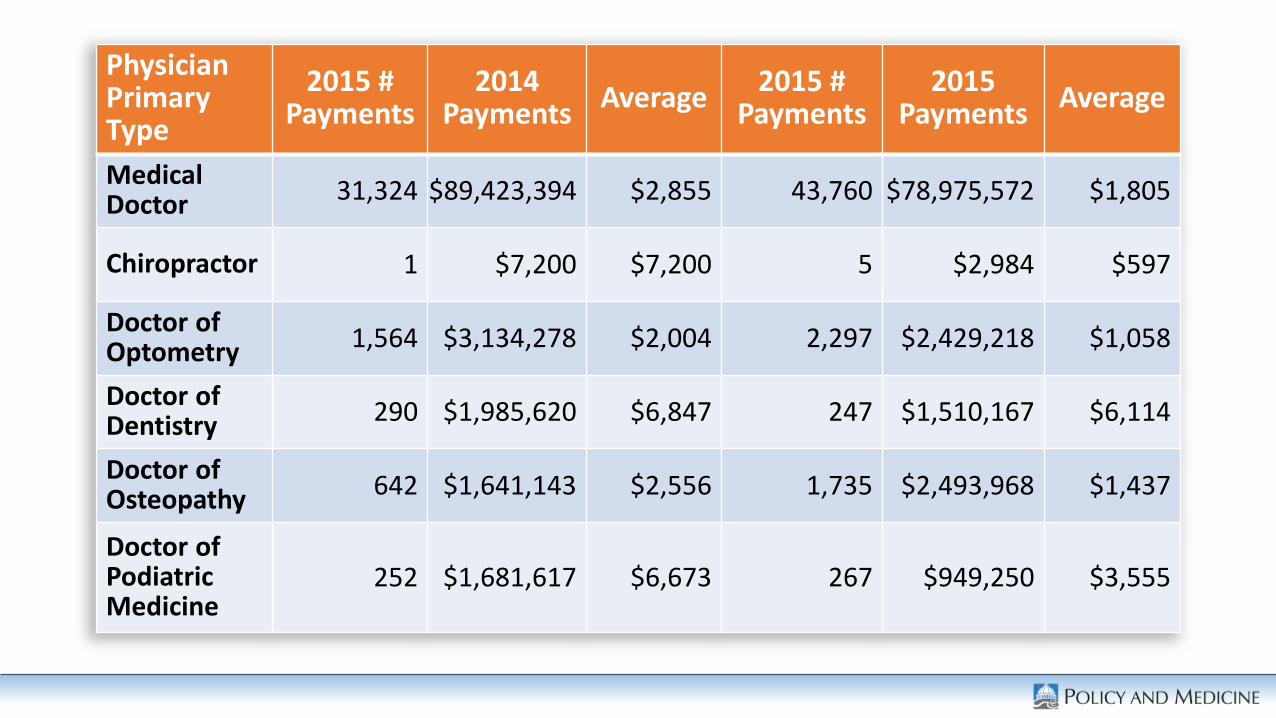
Physician Primary Type
2015 # Payments
2014 Payments
Average2015 #
Payments2015
PaymentsAverage
Medical Doctor 31,324 $89,423,394 $2,855 43,760 $78,975,572 $1,805
Chiropractor 1 $7,200 $7,200 5 $2,984 $597
Doctor of Optometry 1,564 $3,134,278 $2,004 2,297 $2,429,218 $1,058
Doctor of Dentistry 290 $1,985,620 $6,847 247 $1,510,167 $6,114
Doctor of Osteopathy 642 $1,641,143 $2,556 1,735 $2,493,968 $1,437
Doctor of Podiatric Medicine
252 $1,681,617 $6,673 267 $949,250 $3,555

2015 Open Payments Data
• Total payments are effectively the same from 2014 - 2015 at $7.47B v $7.52B
• Number of physicians receiving a payment is static YoY at 618,000
• Total number of records published has shows no growth at 11.9M
• Average payment received by physicians (total payments/no. physicians receiving payment) has no differential at $12,120 in 2014 against $12,168 in 2015
• Only real change is in the number of companies reporting under the Physician Payments Sunshine Act– which has seen a decrease by 8% to 1456

Key Year-on-year Open Payment Data Changes –All Payment Categories
All Payment Categories2013* 2014 2015
Annual Value ($ Billion) 3.91 7.49 7.52Normalized - Monthly Value ($ Billion) 0.78 0.62 0.63% Change YoY in Normalized Monthly Value -20% 0%
No. of Physicians Receiving Payments 480,000 618,000 618,000% Change YoY 29% 0%
Av. Payment per Physician Claiming in $ 8,146 12,120 12,168% Change YoY 49% 0%
No. of Companies Making Payments 1,392 1,580 1456% Change YoY 14% -8%
No. of Records Published in Millions 4.46 11.86 11.9Normalized - Monthly No. of Records Published 0.89 0.99 0.99% Change YoY in Av. Monthly Records Published 11% 0%
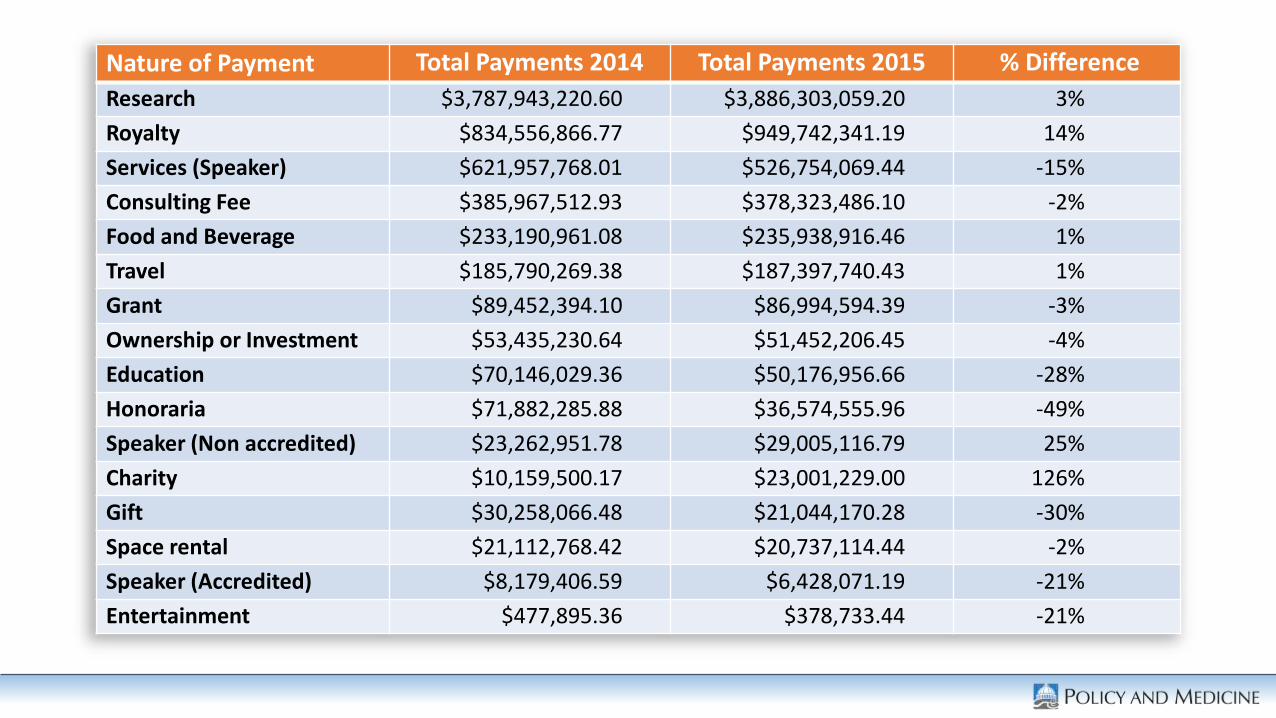
Nature of Payment Total Payments 2014 Total Payments 2015 % Difference
Research $3,787,943,220.60 $3,886,303,059.20 3%
Royalty $834,556,866.77 $949,742,341.19 14%
Services (Speaker) $621,957,768.01 $526,754,069.44 -15%
Consulting Fee $385,967,512.93 $378,323,486.10 -2%
Food and Beverage $233,190,961.08 $235,938,916.46 1%
Travel $185,790,269.38 $187,397,740.43 1%
Grant $89,452,394.10 $86,994,594.39 -3%
Ownership or Investment $53,435,230.64 $51,452,206.45 -4%
Education $70,146,029.36 $50,176,956.66 -28%
Honoraria $71,882,285.88 $36,574,555.96 -49%
Speaker (Non accredited) $23,262,951.78 $29,005,116.79 25%
Charity $10,159,500.17 $23,001,229.00 126%
Gift $30,258,066.48 $21,044,170.28 -30%
Space rental $21,112,768.42 $20,737,114.44 -2%
Speaker (Accredited) $8,179,406.59 $6,428,071.19 -21%
Entertainment $477,895.36 $378,733.44 -21%
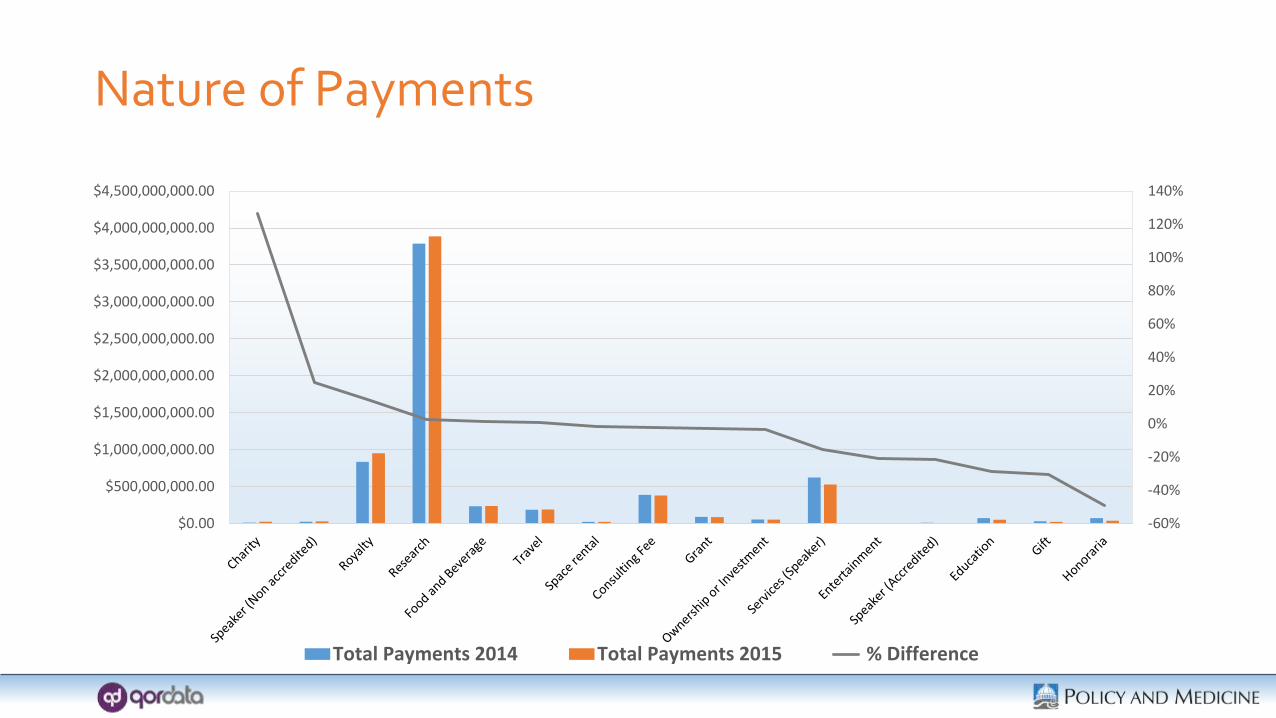
Nature of Payments
-60%
-40%
-20%
0%
20%
40%
60%
80%
100%
120%
140%
$0.00
$500,000,000.00
$1,000,000,000.00
$1,500,000,000.00
$2,000,000,000.00
$2,500,000,000.00
$3,000,000,000.00
$3,500,000,000.00
$4,000,000,000.00
$4,500,000,000.00
Total Payments 2014 Total Payments 2015 % Difference
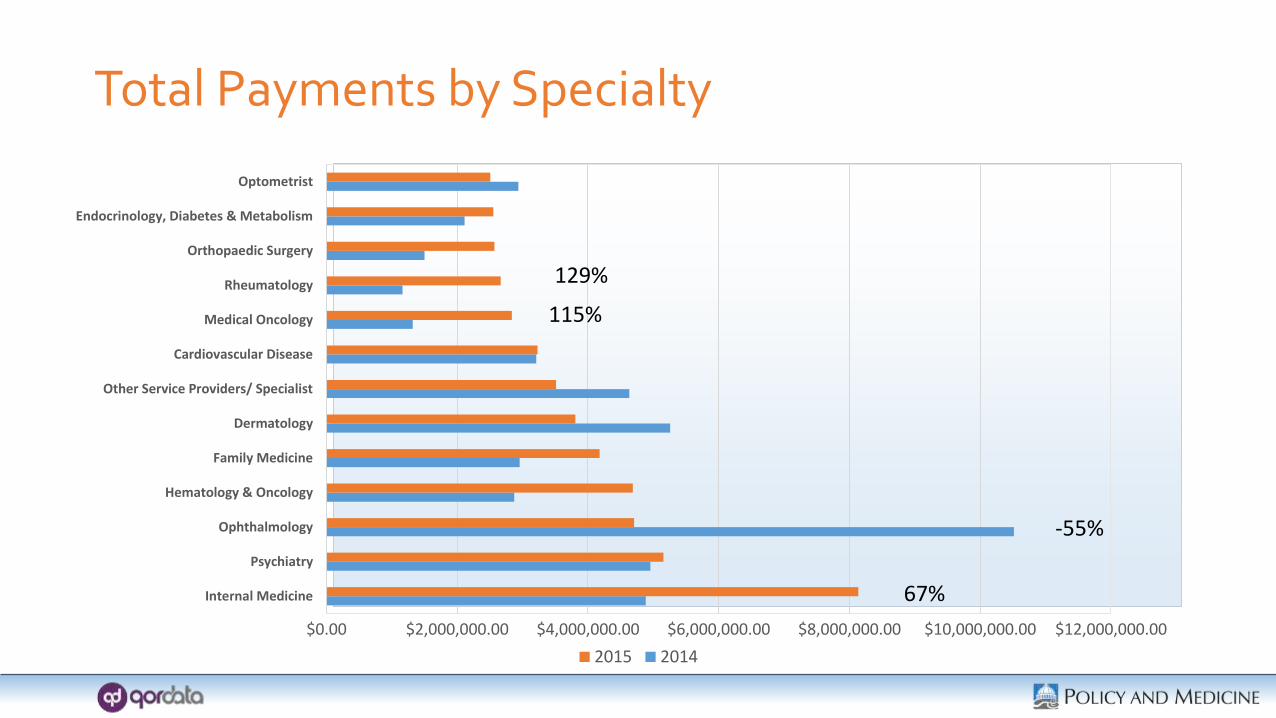
Total Payments by Specialty
$0.00 $2,000,000.00 $4,000,000.00 $6,000,000.00 $8,000,000.00 $10,000,000.00 $12,000,000.00
Internal Medicine
Psychiatry
Ophthalmology
Hematology & Oncology
Family Medicine
Dermatology
Other Service Providers/ Specialist
Cardiovascular Disease
Medical Oncology
Rheumatology
Orthopaedic Surgery
Endocrinology, Diabetes & Metabolism
Optometrist
2015 2014
129%
115%
67%
-55%

Hospitals
Research General
2014 2015Difference2014-2015
2014 2015Difference2014-2015
J&J (Janssen Companies Only)*
$99,175,296 $111,649,444 11.2% $64,840,821 $70,115,410 7.5%
Novartis $281,779,639 $513,394,378 45.1% $20,255,905 $25,719,817 21.2%
Genentech/Roche $110,128,328 $144,510,028 23.8% $274,806,796$325,804,12
515.7%
Pfizer $282,002,287 $391,734,059 28.0% $53,805,657 $44,676,784 -20.4%
Sanofi** $175,088,490 $106,279,034 -64.7% $22,740,225 $29,422,634 22.7%
Merck $107,427,067 $127,975,501 16.1% $26,981,143 $34,391,209 21.5%
Glaxo Smith Kline $179,464,140 $106,563,382 -68.4% $36,280,378 $35,840,379 -1.2%
Astra Zeneca $157,462,850 $222,360,795 29.2% $72,904,958 $54,071,173 -34.8%
Bayer $12,517,096 $21,399,765 41.5% $10,126,449 $11,068,802 8.5%
Giliad $65,944,757 $45,394,349 -45.3% $31,669,797 $36,830,535 14.0%Sanofi - is reported under 2 US entities
Janssen (Biotech, Pharma, Products, R&D, Scientific Affairs)

Research Payments
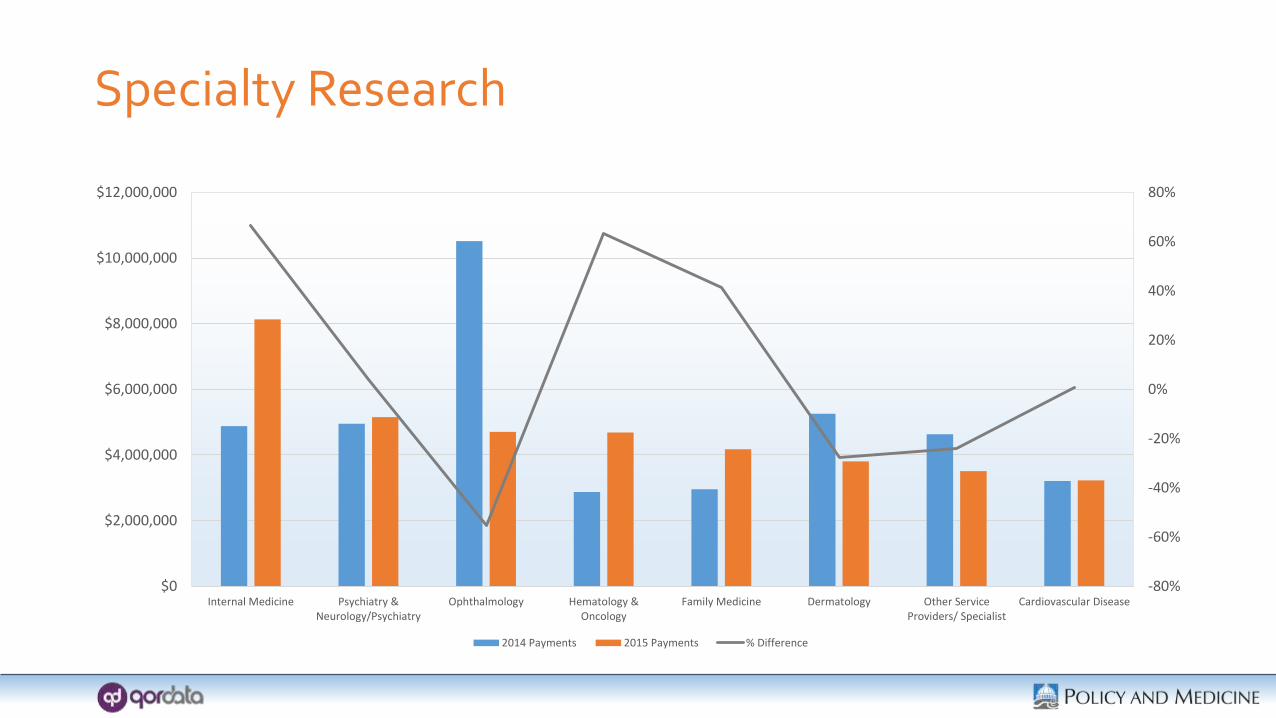
Specialty Research
-80%
-60%
-40%
-20%
0%
20%
40%
60%
80%
$0
$2,000,000
$4,000,000
$6,000,000
$8,000,000
$10,000,000
$12,000,000
Internal Medicine Psychiatry &Neurology/Psychiatry
Ophthalmology Hematology &Oncology
Family Medicine Dermatology Other ServiceProviders/ Specialist
Cardiovascular Disease
2014 Payments 2015 Payments % Difference

Research Payments by State
-20%
-15%
-10%
-5%
0%
5%
10%
15%
20%
25%
$0
$50,000,000
$100,000,000
$150,000,000
$200,000,000
$250,000,000
$300,000,000
$350,000,000
$400,000,000
$450,000,000
$500,000,000
CA TX FL MA NY PA NC OH IL TN MI
2014 Research 2015 Research Percentage
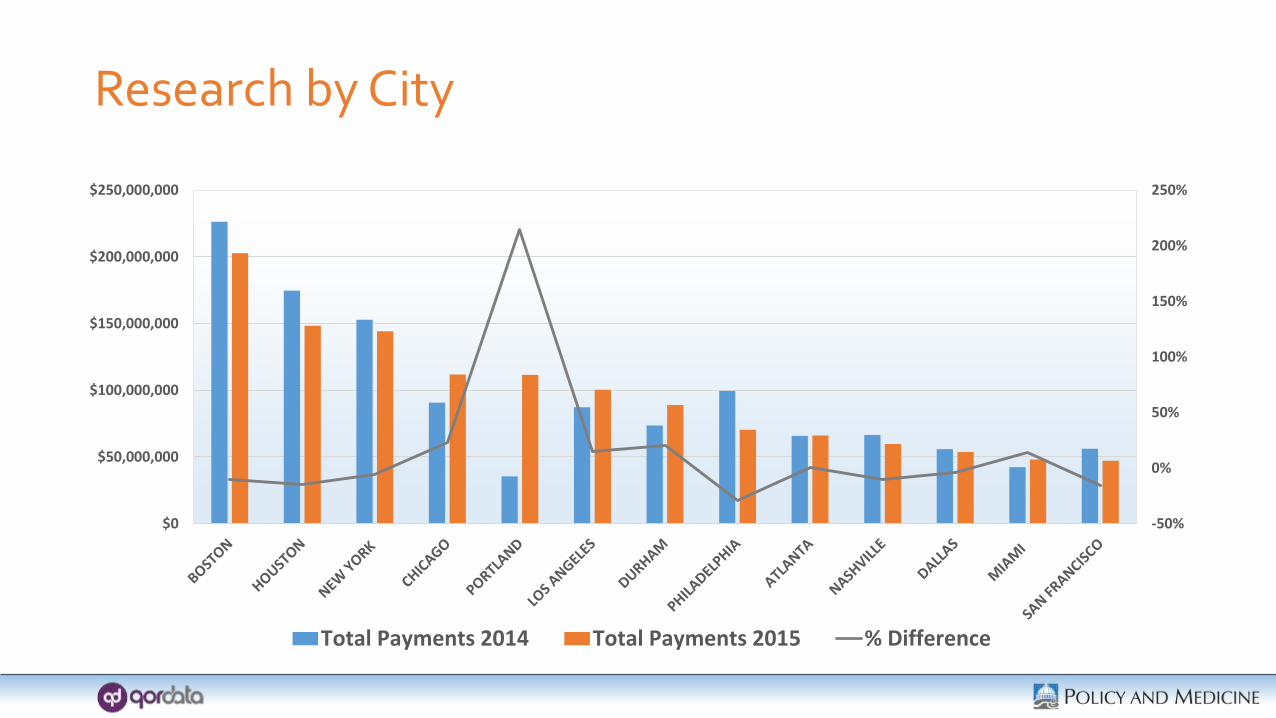
Research by City
-50%
0%
50%
100%
150%
200%
250%
$0
$50,000,000
$100,000,000
$150,000,000
$200,000,000
$250,000,000
Total Payments 2014 Total Payments 2015 % Difference

Research Payments by Company
-60%
-40%
-20%
0%
20%
40%
60%
80%
100%
120%
140%
$0
$100,000,000
$200,000,000
$300,000,000
$400,000,000
$500,000,000
$600,000,000
Total Payments 2014 Total Payments 2015 % Difference
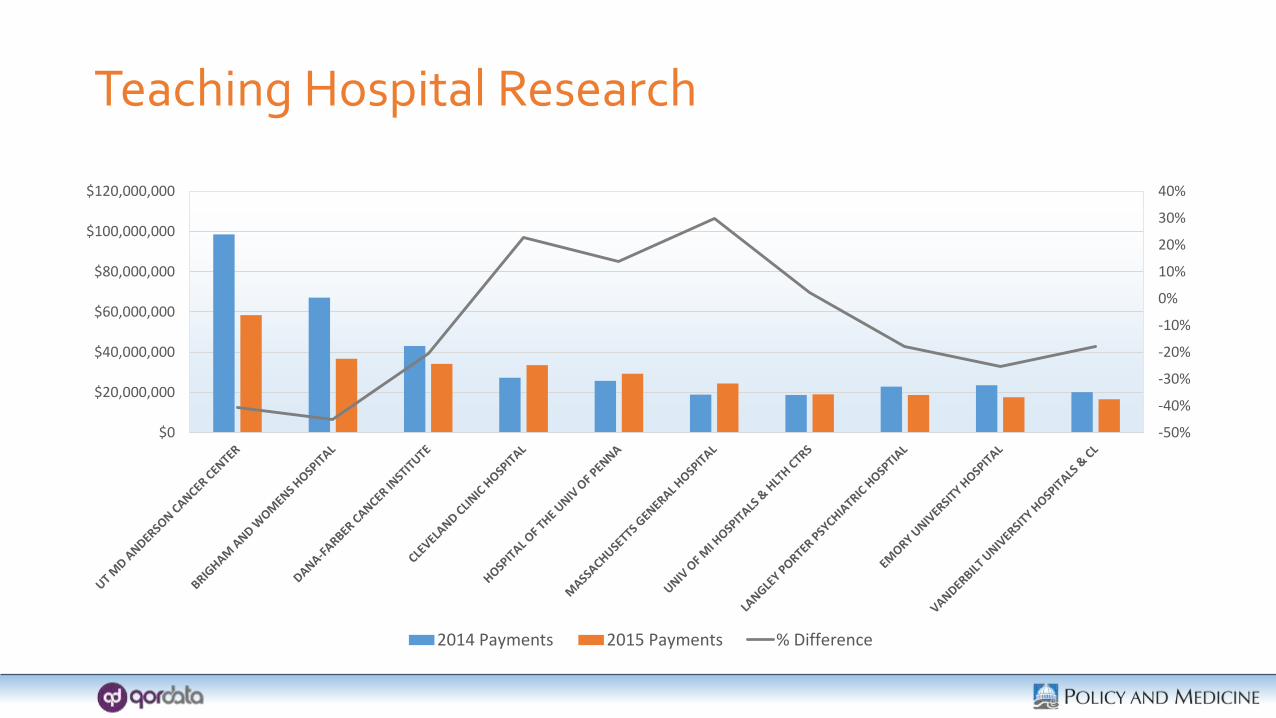
Teaching Hospital Research
-50%
-40%
-30%
-20%
-10%
0%
10%
20%
30%
40%
$0
$20,000,000
$40,000,000
$60,000,000
$80,000,000
$100,000,000
$120,000,000
2014 Payments 2015 Payments % Difference
General Payments

Key Year-on-year Open Payment Data Changes -General Payments
General Payments
2013* 2014 2015
Annual Value ($ Billion) 1.01 2.64 2.6
Normalized Monthly Value ($ Billion) 0.20 0.22 0.22
% Change YoY in Normalized Monthly Value 9% -2%
No. of Records Published ($ Million) 4.16 11.18 11.13
Normalized - Monthly No. of Records Published 0.83 0.93 0.93
% Change YoY 12% 0%
Ratio Disputed/Non-Disputed No. of Payments 0.00022 0.00013 0.00011
% Change YoY Ratio -41% -18%
Ratio Disputed/Non-Disputed $ Values 0.00235 0.00128 0.00287
% Change YoY Ratio -45% 123%
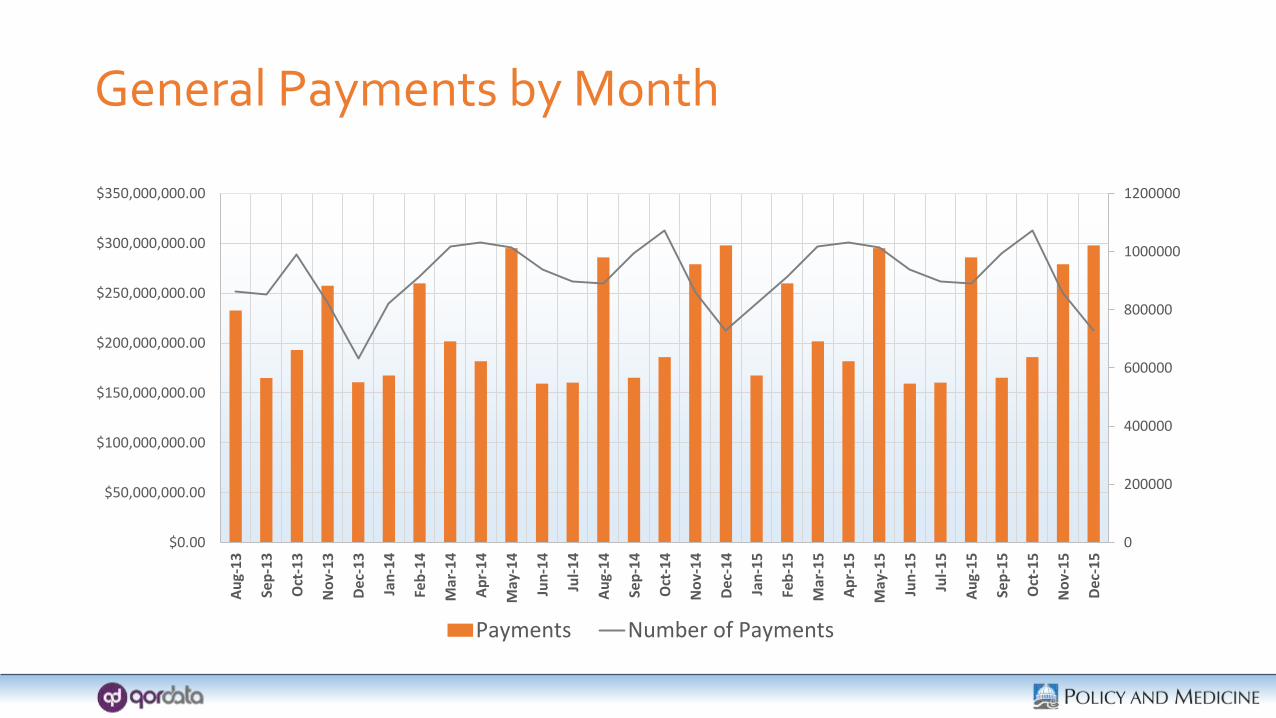
General Payments by Month
0
200000
400000
600000
800000
1000000
1200000
$0.00
$50,000,000.00
$100,000,000.00
$150,000,000.00
$200,000,000.00
$250,000,000.00
$300,000,000.00
$350,000,000.00
Au
g-1
3
Sep
-13
Oct
-13
No
v-13
Dec
-13
Jan
-14
Feb
-14
Mar
-14
Ap
r-1
4
May
-14
Jun
-14
Jul-
14
Au
g-1
4
Sep
-14
Oct
-14
No
v-14
Dec
-14
Jan
-15
Feb
-15
Mar
-15
Ap
r-1
5
May
-15
Jun
-15
Jul-
15
Au
g-1
5
Sep
-15
Oct
-15
No
v-15
Dec
-15
Payments Number of Payments

General Payments by State
-40%
-35%
-30%
-25%
-20%
-15%
-10%
-5%
0%
5%
10%
$0.00
$100,000,000.00
$200,000,000.00
$300,000,000.00
$400,000,000.00
$500,000,000.00
$600,000,000.00
$700,000,000.00
CA NY TX FL MA PA TN OH IL AZ GA NC
2014 Payments 2015 Payments % Difference

General Payments by Company
-50%
0%
50%
100%
150%
200%
250%
$0
$50,000,000
$100,000,000
$150,000,000
$200,000,000
$250,000,000
$300,000,000
$350,000,000
Total Payments 2014 Total Payments 2015 % Difference
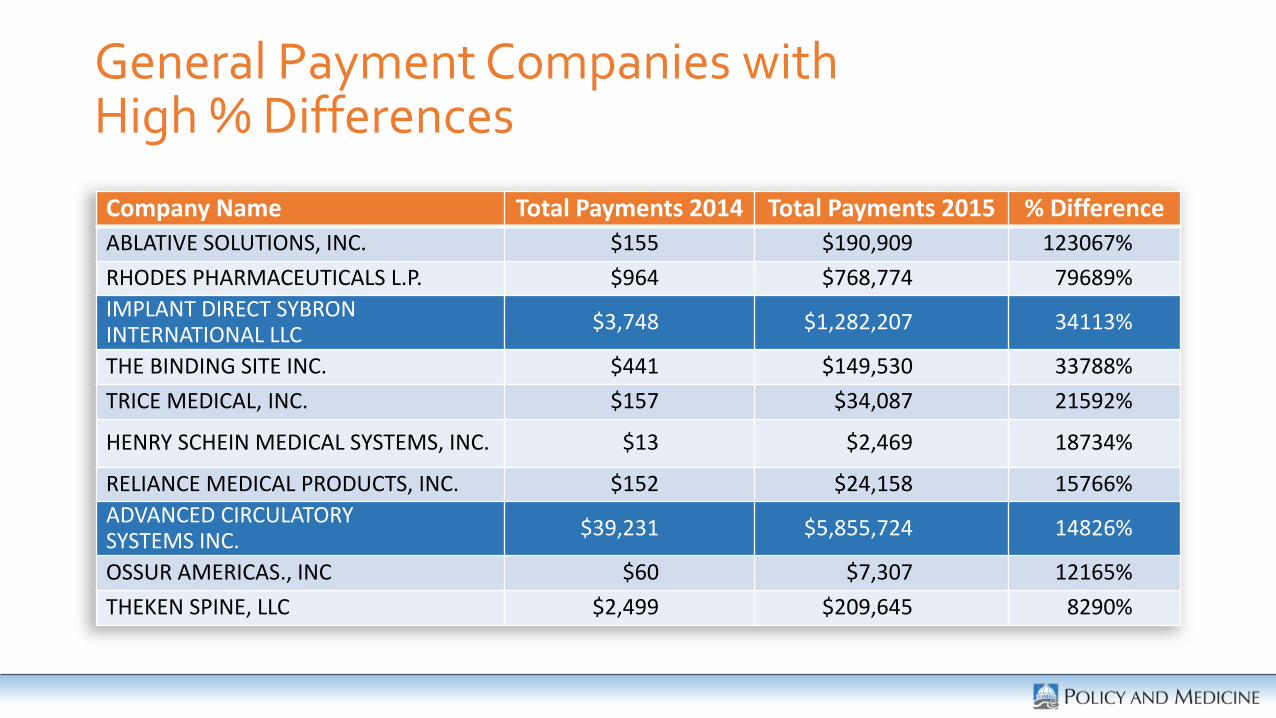
General Payment Companies with High % Differences
Company Name Total Payments 2014 Total Payments 2015 % Difference
ABLATIVE SOLUTIONS, INC. $155 $190,909 123067%
RHODES PHARMACEUTICALS L.P. $964 $768,774 79689%
IMPLANT DIRECT SYBRON INTERNATIONAL LLC
$3,748 $1,282,207 34113%
THE BINDING SITE INC. $441 $149,530 33788%
TRICE MEDICAL, INC. $157 $34,087 21592%
HENRY SCHEIN MEDICAL SYSTEMS, INC. $13 $2,469 18734%
RELIANCE MEDICAL PRODUCTS, INC. $152 $24,158 15766%
ADVANCED CIRCULATORY SYSTEMS INC.
$39,231 $5,855,724 14826%
OSSUR AMERICAS., INC $60 $7,307 12165%
THEKEN SPINE, LLC $2,499 $209,645 8290%
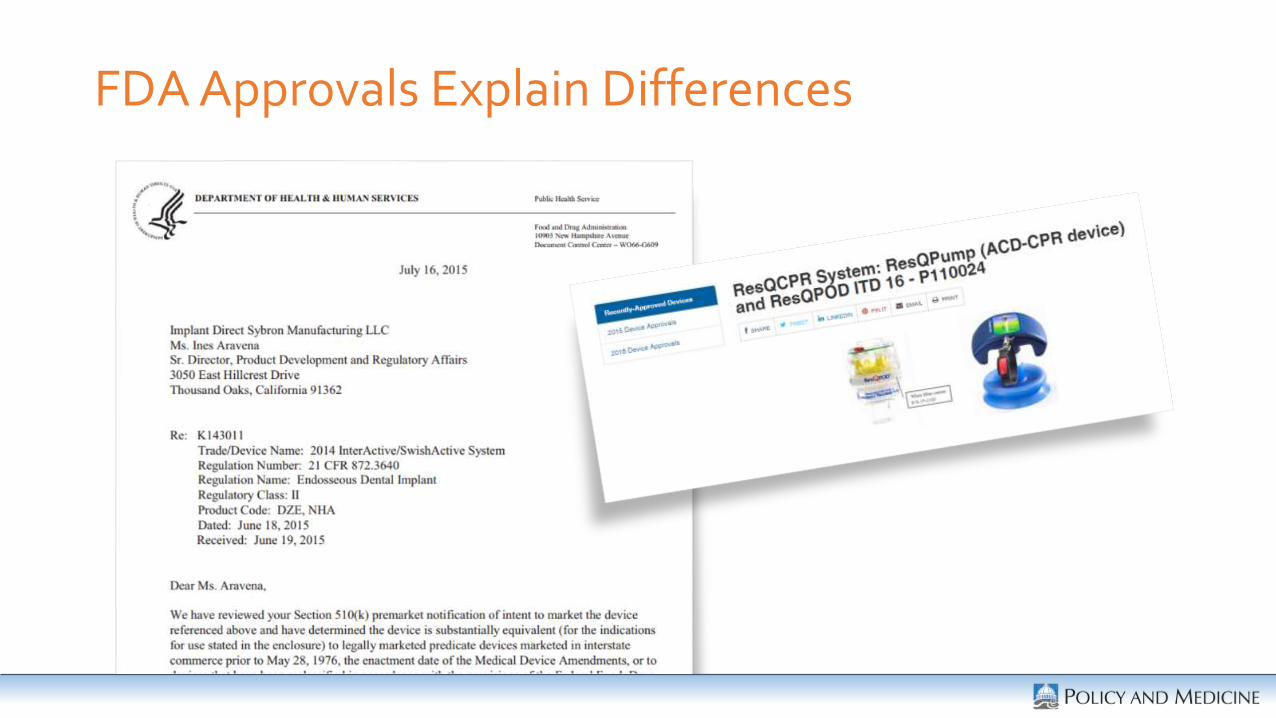
FDA Approvals Explain Differences
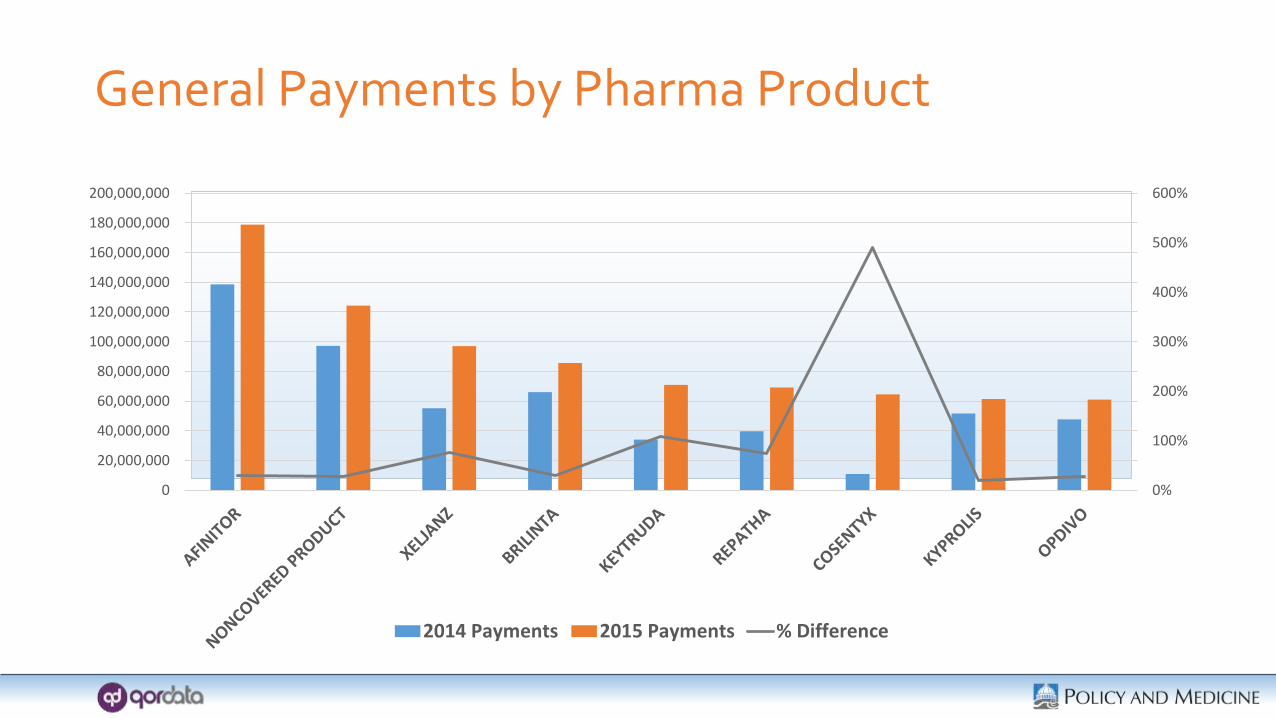
General Payments by Pharma Product
0%
100%
200%
300%
400%
500%
600%
0
20,000,000
40,000,000
60,000,000
80,000,000
100,000,000
120,000,000
140,000,000
160,000,000
180,000,000
200,000,000
2014 Payments 2015 Payments % Difference

Travel by City
-25%
-20%
-15%
-10%
-5%
0%
5%
10%
15%
$0
$1,000,000
$2,000,000
$3,000,000
$4,000,000
$5,000,000
$6,000,000
$7,000,000
$8,000,000
$9,000,000
$10,000,000
2014 Payments 2015 Payments % Difference
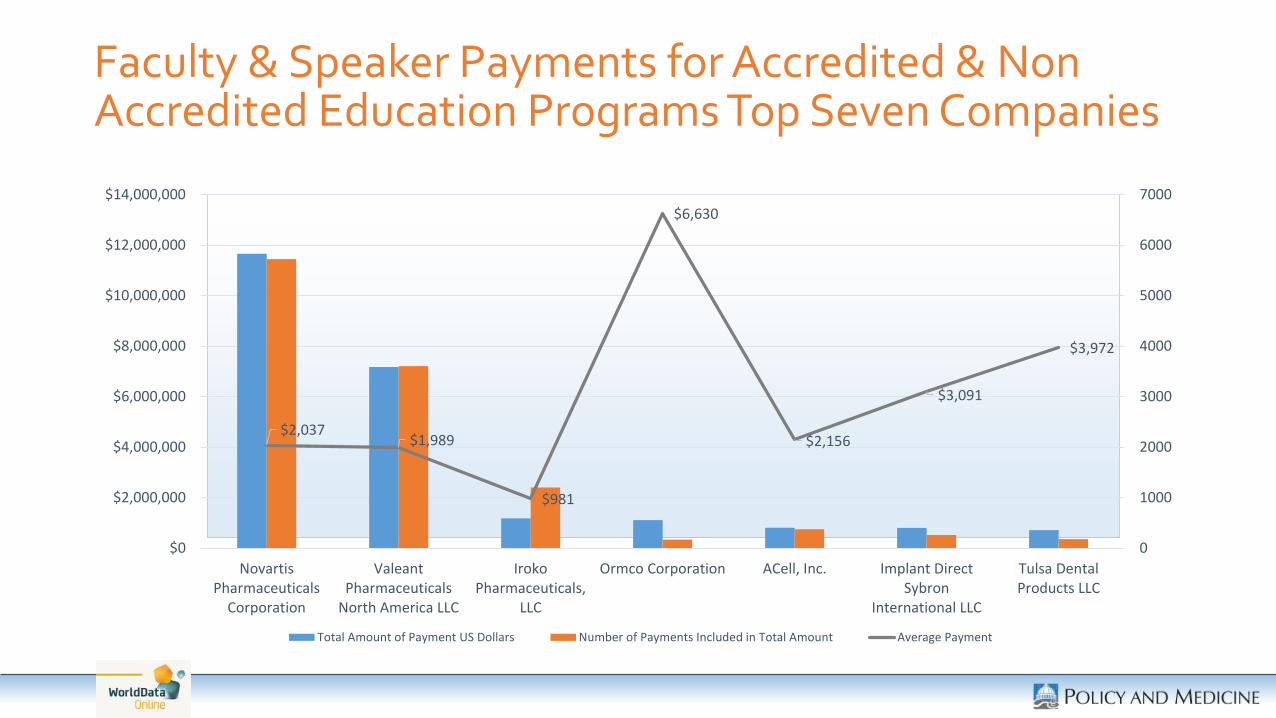
$2,037$1,989
$981
$6,630
$2,156
$3,091
$3,972
0
1000
2000
3000
4000
5000
6000
7000
$0
$2,000,000
$4,000,000
$6,000,000
$8,000,000
$10,000,000
$12,000,000
$14,000,000
NovartisPharmaceuticals
Corporation
ValeantPharmaceuticals
North America LLC
IrokoPharmaceuticals,
LLC
Ormco Corporation ACell, Inc. Implant DirectSybron
International LLC
Tulsa DentalProducts LLC
Total Amount of Payment US Dollars Number of Payments Included in Total Amount Average Payment
Faculty & Speaker Payments for Accredited & Non Accredited Education Programs Top Seven Companies

$4,503$4,372
$3,701
$5,083
$2,858
$3,459$3,528
0
1000
2000
3000
4000
5000
6000
$0
$2,000,000
$4,000,000
$6,000,000
$8,000,000
$10,000,000
$12,000,000
$14,000,000
$16,000,000
$18,000,000
Stryker Corporation Zimmer BiometHoldings, Inc.
Pfizer Inc. DePuy OrthopaedicsInc.
Boston ScientificCorporation
Merck Sharp &Dohme Corporation
Allergan Inc.
Total Amount of Payment US Dollars Number of Payments Included in Total Amount Average Payment
Consulting Fee Payments For Top Seven Companies

$2,193
$1,343 $1,447
$1,009
$1,931$1,750
$756
0
1000
2000
3000
4000
5000
6000
$0
$2,000,000
$4,000,000
$6,000,000
$8,000,000
$10,000,000
$12,000,000
Intuitive Surgical,Inc.
KARLSTORZEndoscopy-America
Arthrex, Inc. Coloplast Corp Smith & Nephew,Inc.
MedaPharmaceuticals,
Inc.
ACell, Inc.
Total Amount of Payment US Dollars Number of Payments Included in Total Amount Average Payment
Education Payments by Top Seven Companies
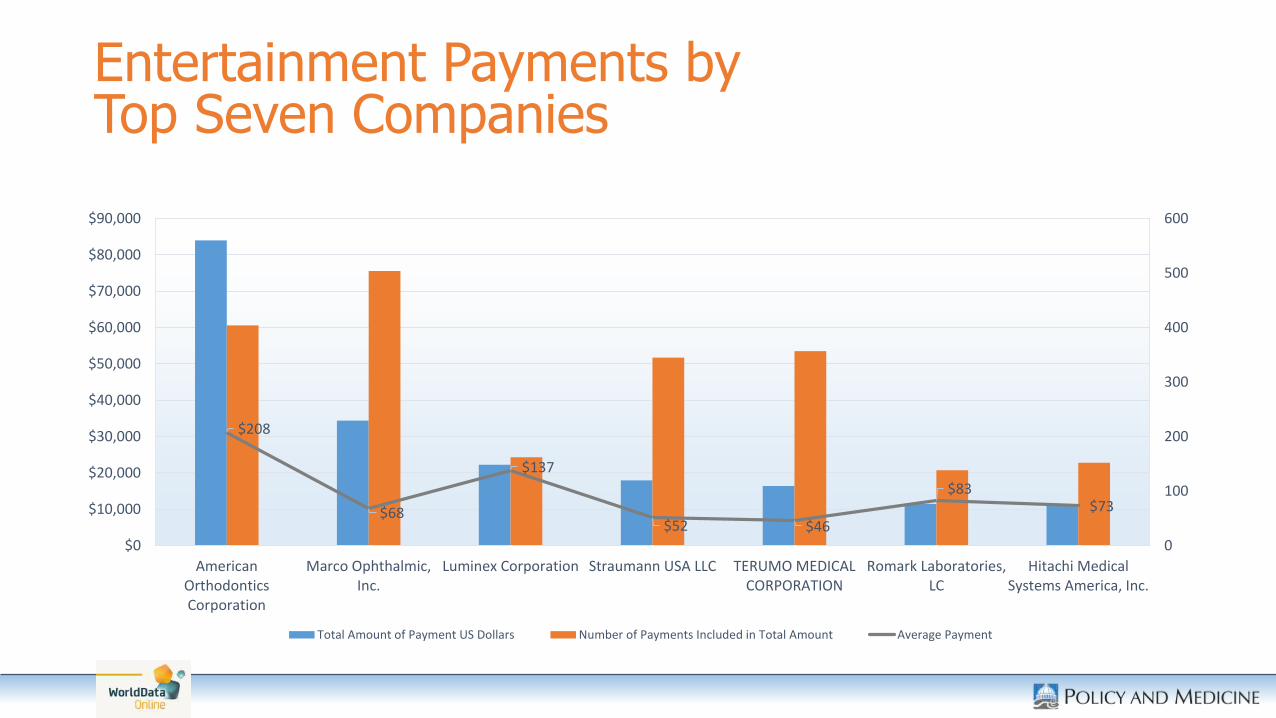
$208
$68
$137
$52 $46
$83$73
0
100
200
300
400
500
600
$0
$10,000
$20,000
$30,000
$40,000
$50,000
$60,000
$70,000
$80,000
$90,000
AmericanOrthodonticsCorporation
Marco Ophthalmic,Inc.
Luminex Corporation Straumann USA LLC TERUMO MEDICALCORPORATION
Romark Laboratories,LC
Hitachi MedicalSystems America, Inc.
Total Amount of Payment US Dollars Number of Payments Included in Total Amount Average Payment
Entertainment Payments by Top Seven Companies
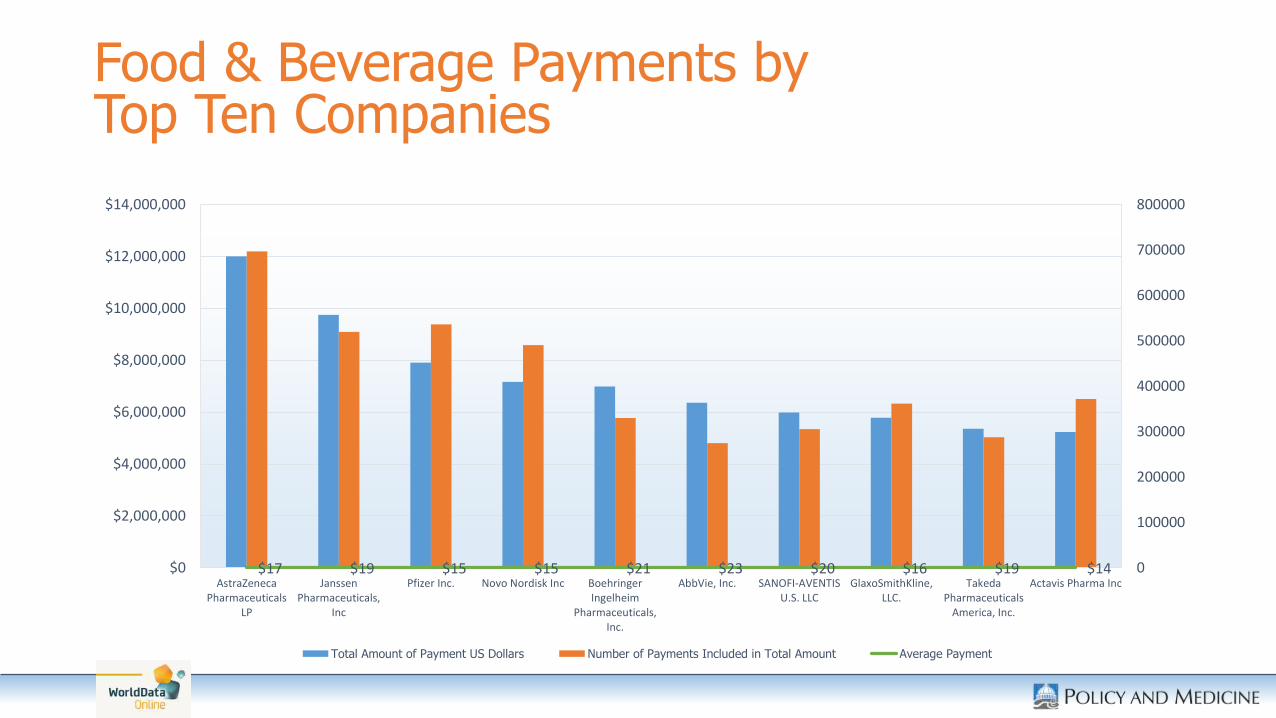
$17 $19 $15 $15 $21 $23 $20 $16 $19 $14 0
100000
200000
300000
400000
500000
600000
700000
800000
$0
$2,000,000
$4,000,000
$6,000,000
$8,000,000
$10,000,000
$12,000,000
$14,000,000
AstraZenecaPharmaceuticals
LP
JanssenPharmaceuticals,
Inc
Pfizer Inc. Novo Nordisk Inc BoehringerIngelheim
Pharmaceuticals,Inc.
AbbVie, Inc. SANOFI-AVENTISU.S. LLC
GlaxoSmithKline,LLC.
TakedaPharmaceuticals
America, Inc.
Actavis Pharma Inc
Total Amount of Payment US Dollars Number of Payments Included in Total Amount Average Payment
Food & Beverage Payments by Top Ten Companies

$2,109
$1,564
$1,970
$2,755
$1,495
$3,103
$5,013
0
1000
2000
3000
4000
5000
6000
$0
$1,000,000
$2,000,000
$3,000,000
$4,000,000
$5,000,000
$6,000,000
Gilead Sciences Inc Lundbeck LLC The Medicines Company Cardiovascular SystemsInc.
Aqua Pharmaceuticals W. L. Gore & Associates,Inc.
Hiossen, Inc.
Total Amount of Payment US Dollars Number of Payments Included in Total Amount Average Payment
Honoraria Payments by Top Seven Companies
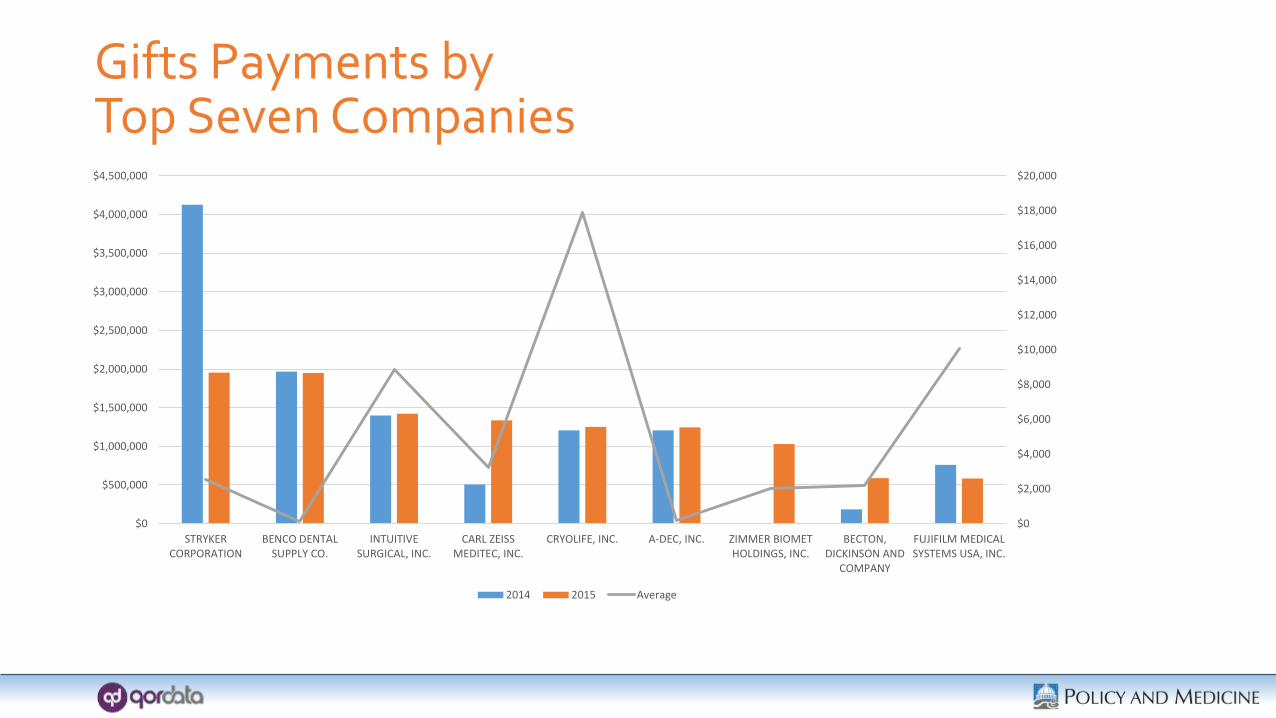
Gifts Payments byTop Seven Companies
$0
$2,000
$4,000
$6,000
$8,000
$10,000
$12,000
$14,000
$16,000
$18,000
$20,000
$0
$500,000
$1,000,000
$1,500,000
$2,000,000
$2,500,000
$3,000,000
$3,500,000
$4,000,000
$4,500,000
STRYKERCORPORATION
BENCO DENTALSUPPLY CO.
INTUITIVESURGICAL, INC.
CARL ZEISSMEDITEC, INC.
CRYOLIFE, INC. A-DEC, INC. ZIMMER BIOMETHOLDINGS, INC.
BECTON,DICKINSON AND
COMPANY
FUJIFILM MEDICALSYSTEMS USA, INC.
2014 2015 Average

Gift Details
Company Name 2014 2015Average
STRYKER CORPORATION $4,127,268 $1,953,868 $2,561
BENCO DENTAL SUPPLY CO. $1,967,700 $1,950,844 $119
INTUITIVE SURGICAL, INC. $1,398,650 $1,421,087 $8,882
CARL ZEISS MEDITEC, INC. $506,523 $1,337,217 $3,230
CRYOLIFE, INC. $1,206,684 $1,253,233 $17,903
A-DEC, INC. $1,207,502 $1,247,216 $185ZIMMER BIOMET HOLDINGS, INC. $0 $1,030,568 $2,029BECTON, DICKINSON AND COMPANY $184,912 $588,629 $2,172FUJIFILM MEDICAL SYSTEMS USA, INC. $761,705 $584,870 $10,084
Gifts – Comment Section Examples
• Customer Loyalty Programs
• Customer Appreciation Events
• Chocolates, Coolers, Cocktails, TV’s
• Xmas Gifts
• Jumpers
• 1 Company – Bottle of Makers Mark

Disputes – General Database
Year Number Total Value % Change
2013 911 $2,370,000
2014 1,435 $3,390,000
2015 1,172 $7,450,000-18% Number120% Amount
Total 3,518 $13,210,000
Percent of Payments
0.0133% 0.2114%

Disputes – Research Database
Year Number Total ValuePercent Change
2013 251 $3,380,000
2014 796 $10,980,000
2015 448 $5,900,000-44% Number-47% Amount
Total 1,495 $20,460,000
Percent of Payments
0.0057% 0.2135%
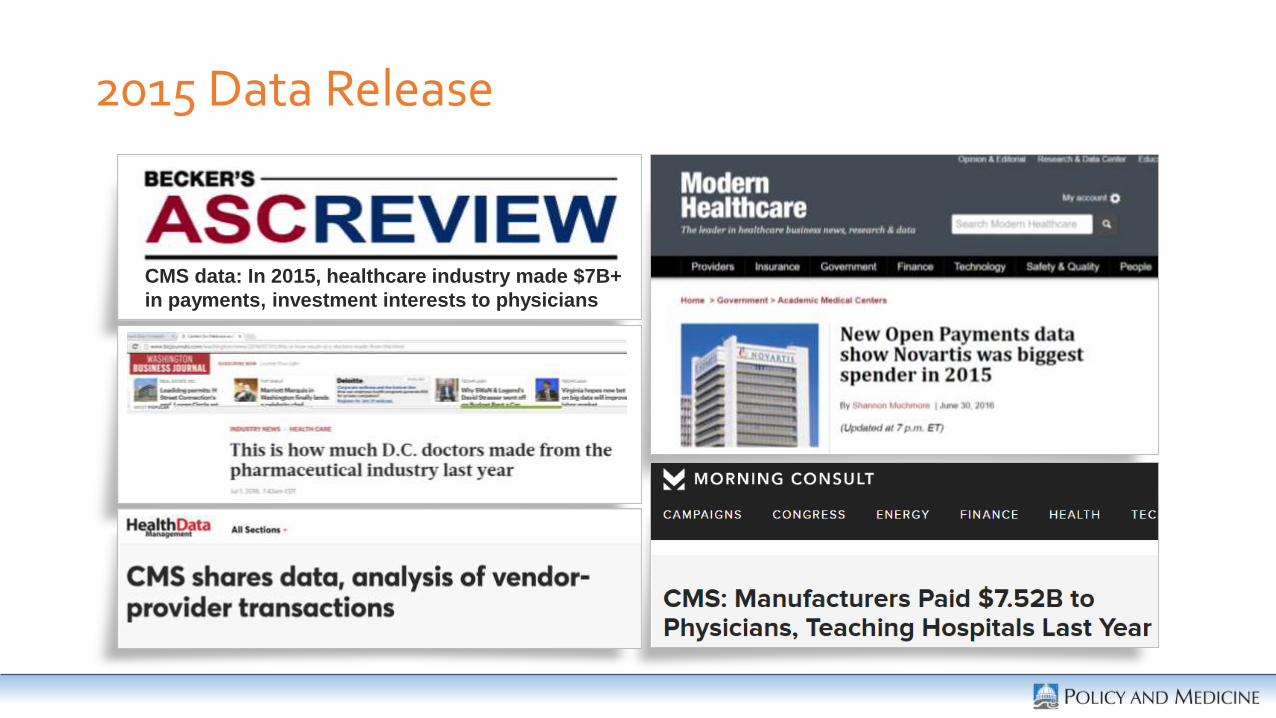
2015 Data Release
CMS data: In 2015, healthcare industry made $7B+
in payments, investment interests to physicians
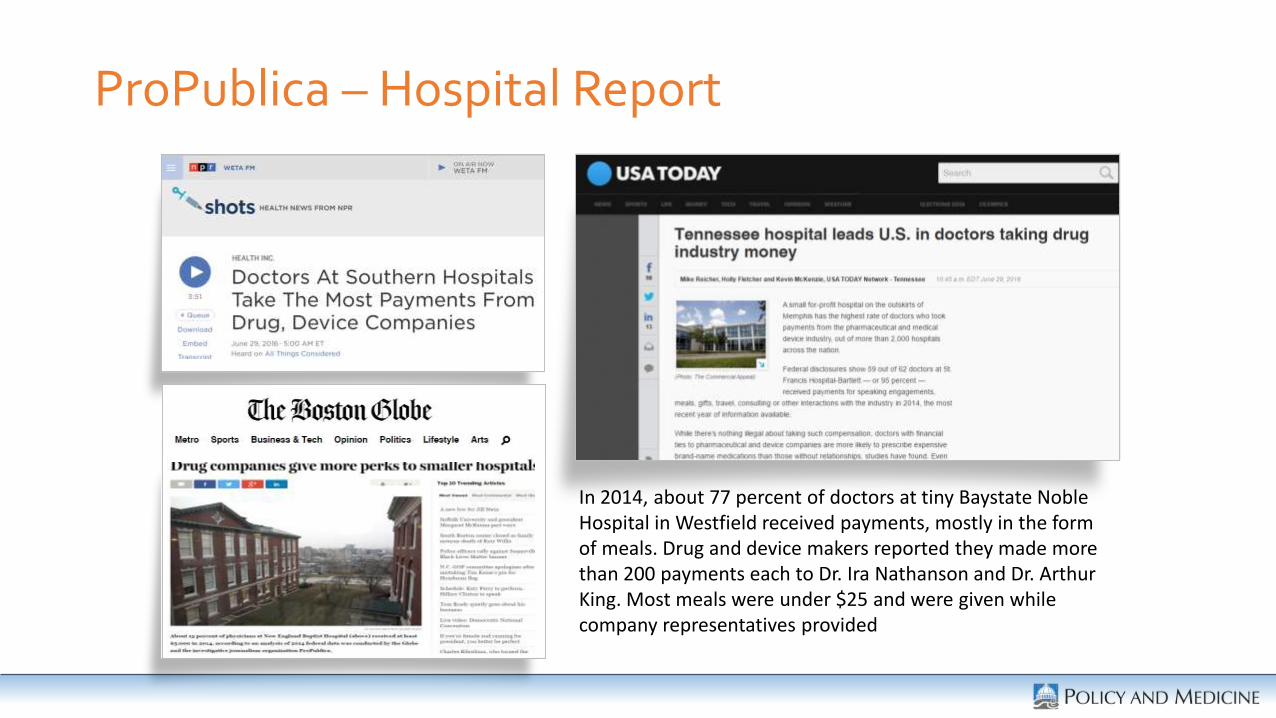
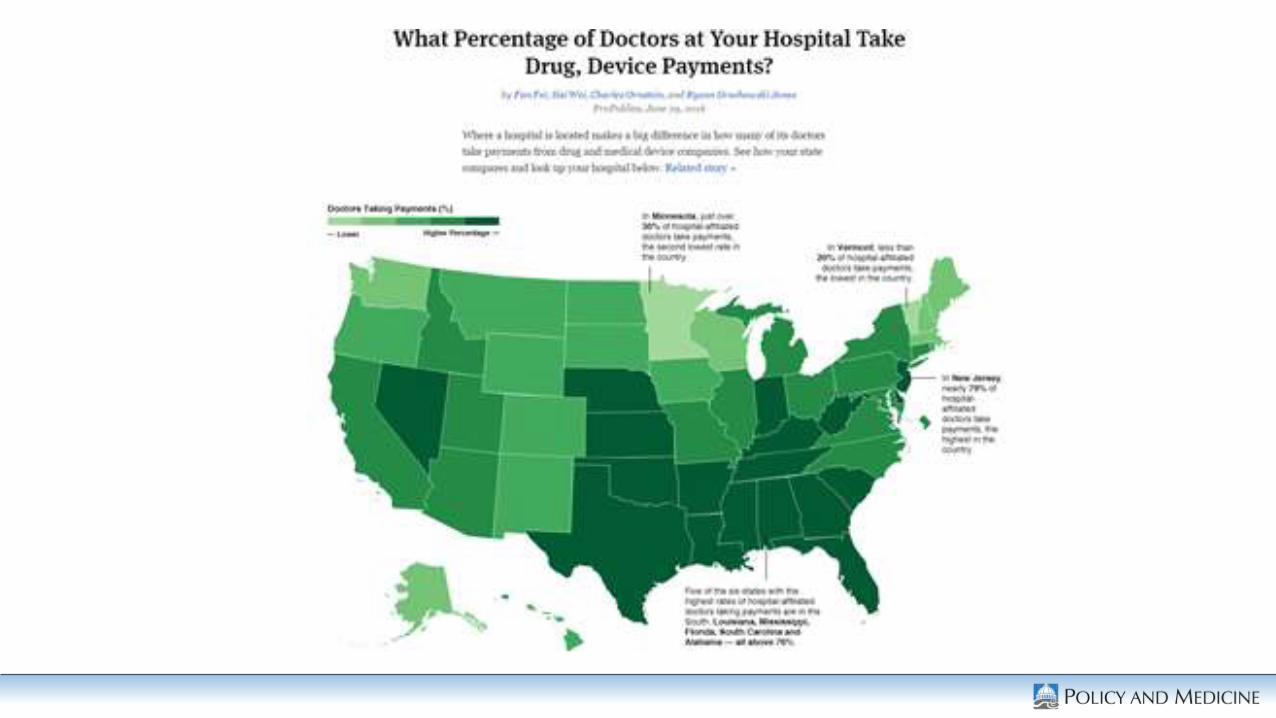
ProPublica – Hospital Report
In 2014, about 77 percent of doctors at tiny Baystate Noble Hospital in Westfield received payments, mostly in the form of meals. Drug and device makers reported they made more than 200 payments each to Dr. Ira Nathanson and Dr. Arthur King. Most meals were under $25 and were given while company representatives provided
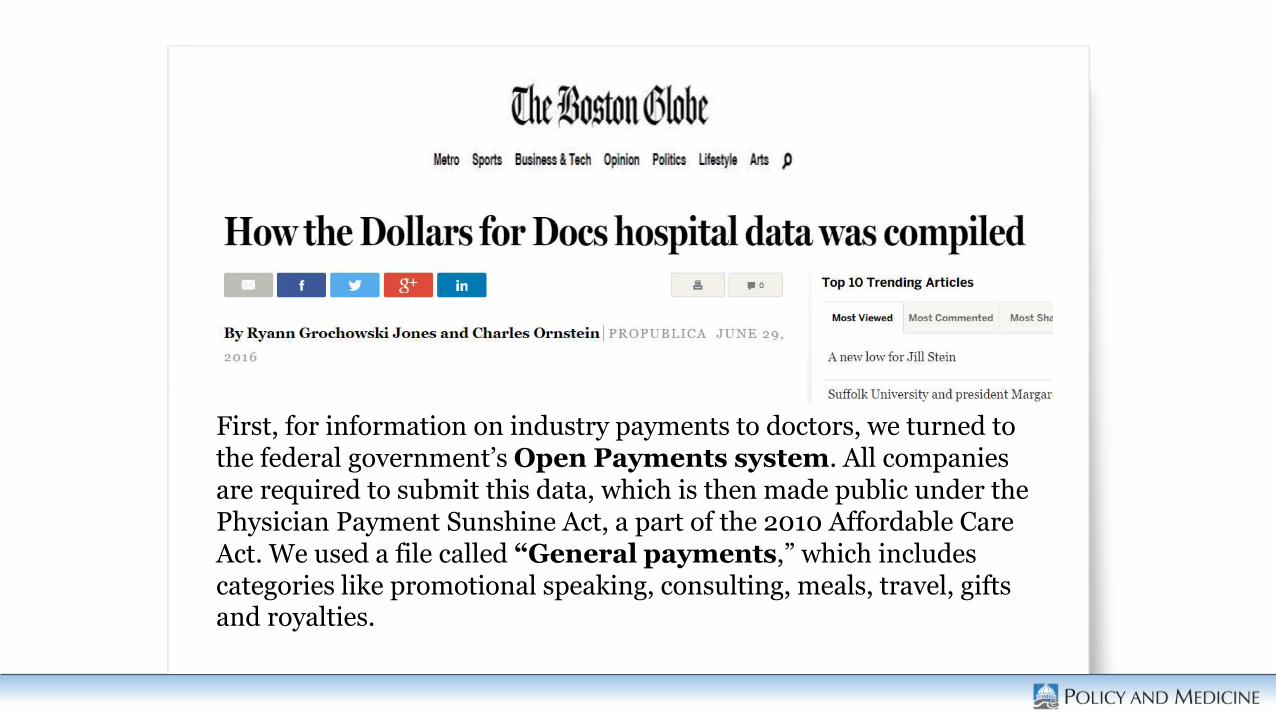
First, for information on industry payments to doctors, we turned to the federal government’s Open Payments system. All companies are required to submit this data, which is then made public under the Physician Payment Sunshine Act, a part of the 2010 Affordable Care Act. We used a file called “General payments,” which includes categories like promotional speaking, consulting, meals, travel, gifts and royalties.

Prosecution, Arrests, Settlements……
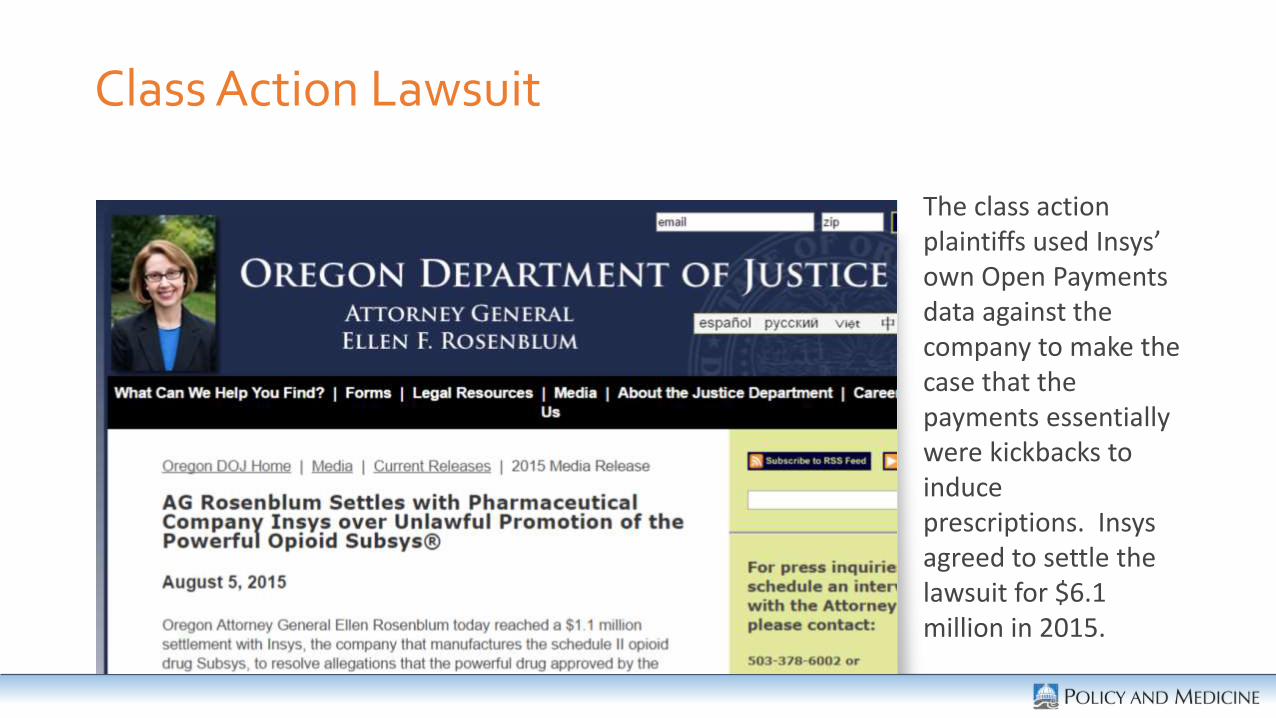
The class action plaintiffs used Insys’ own Open Payments data against the company to make the case that the payments essentially were kickbacks to induce prescriptions. Insysagreed to settle the lawsuit for $6.1 million in 2015.
Class Action Lawsuit
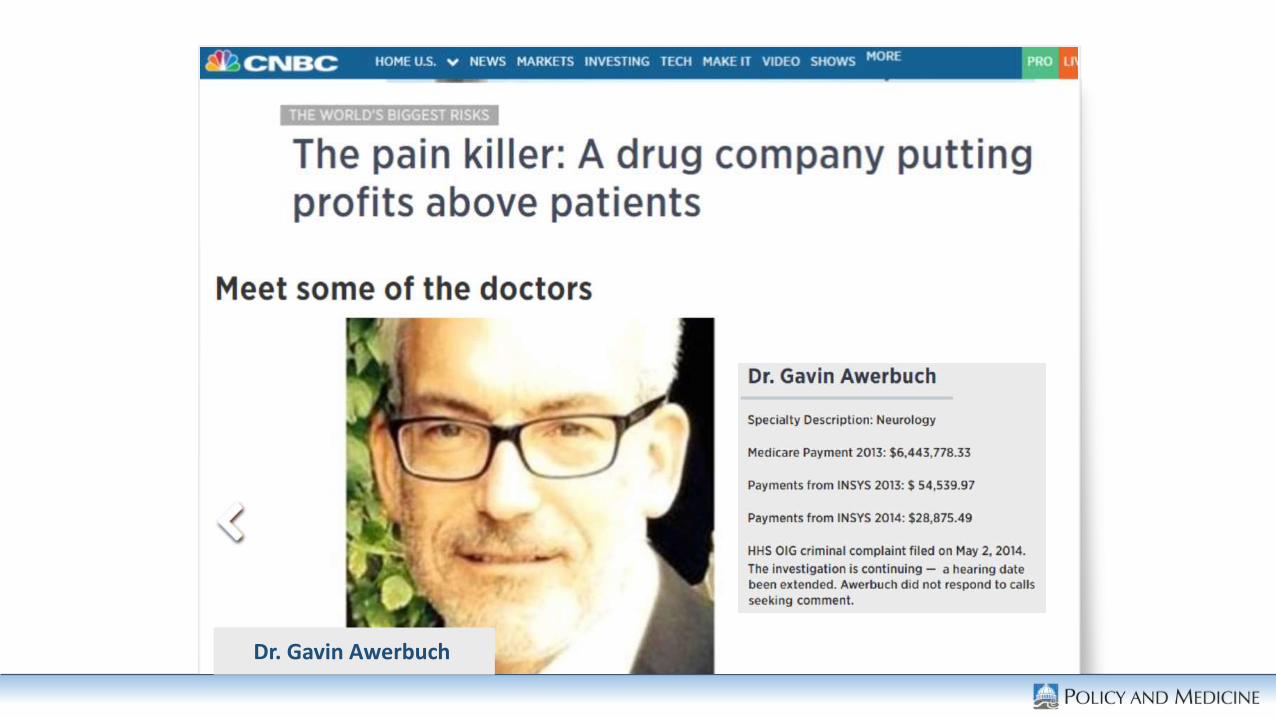
Dr. Gavin Awerbuch

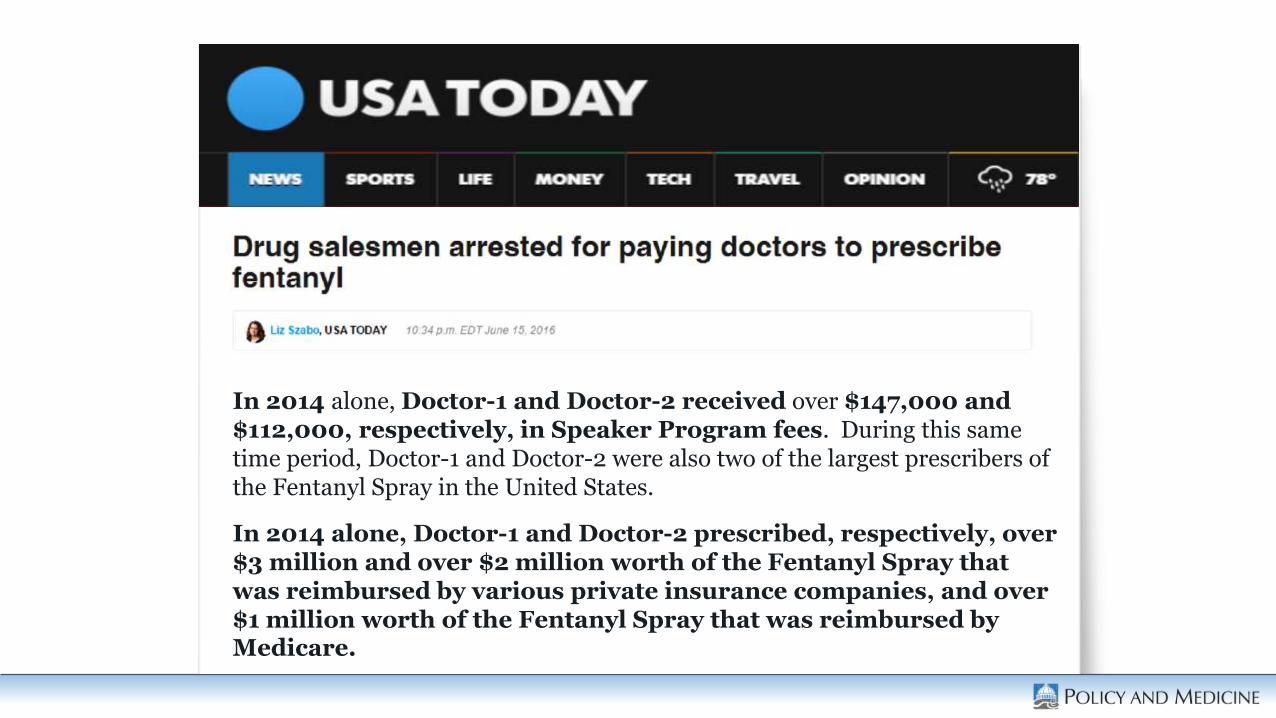
In 2014 alone, Doctor-1 and Doctor-2 received over $147,000 and $112,000, respectively, in Speaker Program fees. During this same time period, Doctor-1 and Doctor-2 were also two of the largest prescribers of the Fentanyl Spray in the United States.
In 2014 alone, Doctor-1 and Doctor-2 prescribed, respectively, over $3 million and over $2 million worth of the Fentanyl Spray that was reimbursed by various private insurance companies, and over $1 million worth of the Fentanyl Spray that was reimbursed by Medicare.
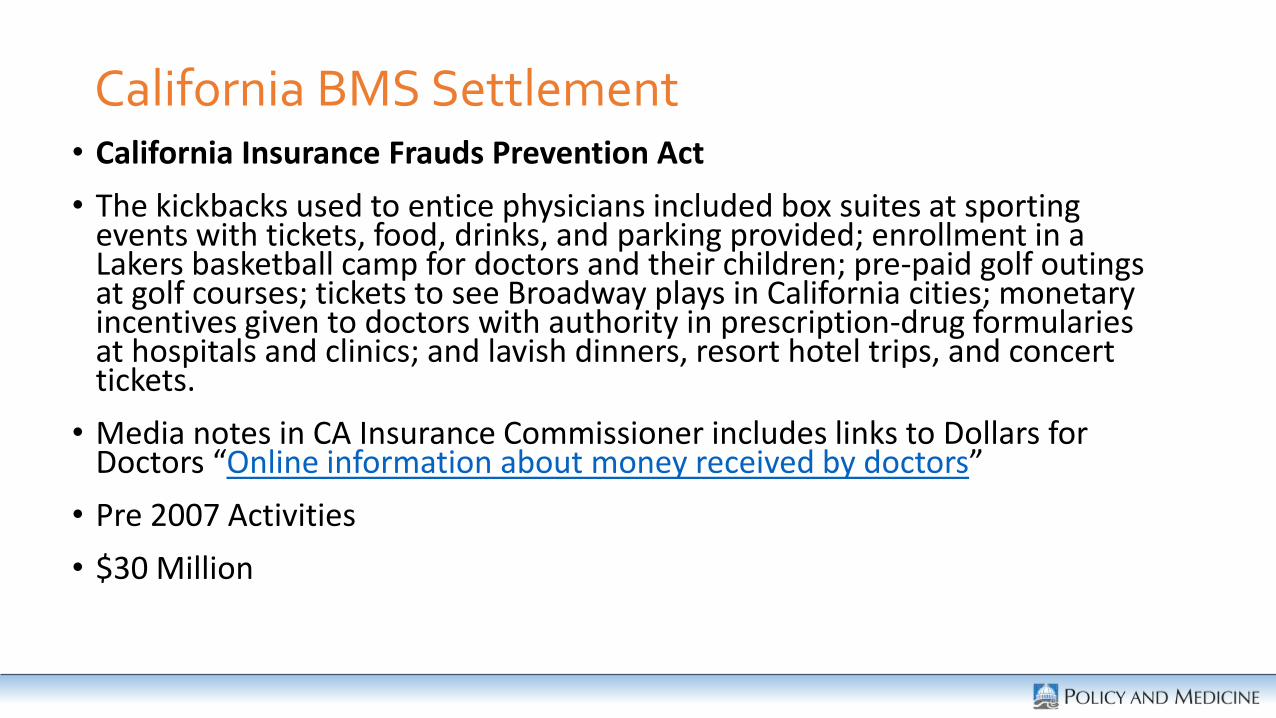
California BMS Settlement• California Insurance Frauds Prevention Act
• The kickbacks used to entice physicians included box suites at sporting events with tickets, food, drinks, and parking provided; enrollment in a Lakers basketball camp for doctors and their children; pre-paid golf outings at golf courses; tickets to see Broadway plays in California cities; monetary incentives given to doctors with authority in prescription-drug formularies at hospitals and clinics; and lavish dinners, resort hotel trips, and concert tickets.
• Media notes in CA Insurance Commissioner includes links to Dollars for Doctors “Online information about money received by doctors”
• Pre 2007 Activities
• $30 Million
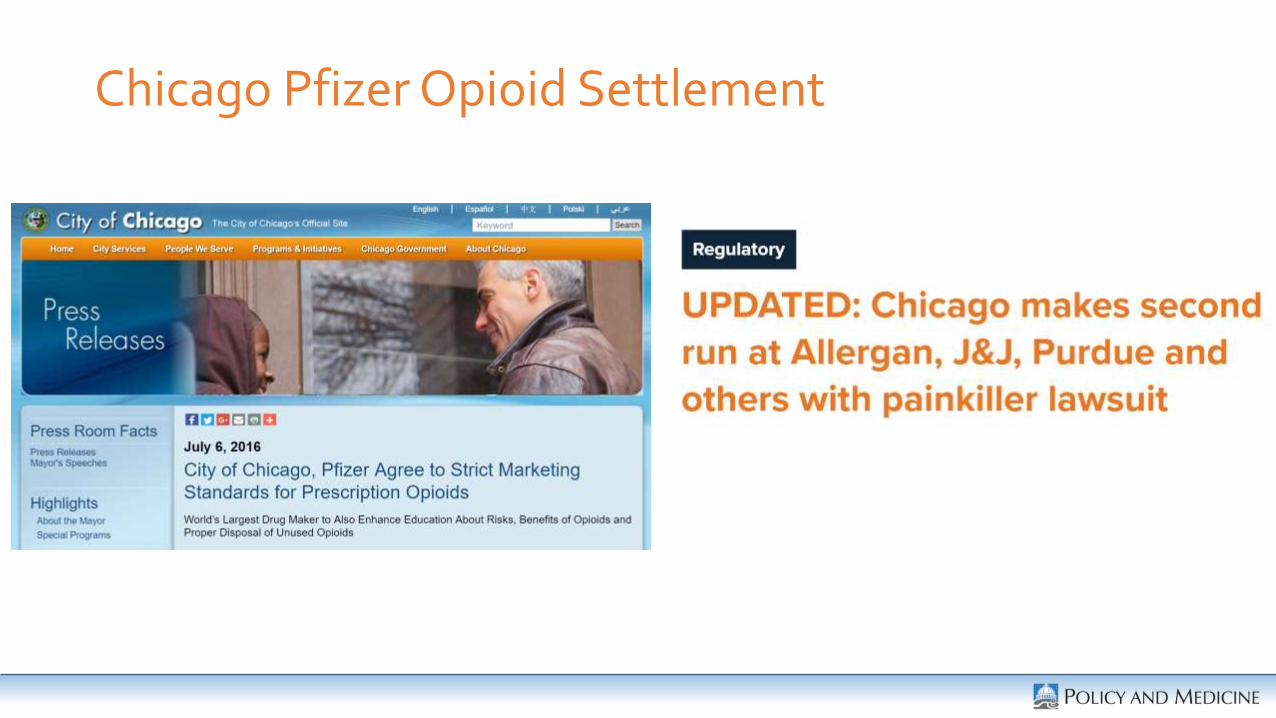
Chicago Pfizer Opioid Settlement
Chicago Referral to Open Payments
• Under the Physician Payment Sunshine Act, passed as Section 6002 of the Affordable Care Act, pharmaceutical companies are required to disclose payments to prescribers and to teaching hospitals, as well as information about the nature, type, and purpose of the payments, for a period starting from August 2013. Data are available through December 2014 on the ProPublica.org website.
Chicago Complaint
• Speakers on ______bureau were among the more prolific prescribers of ______ opioids. PRESCRIBER R received $36,845 in payments from _______from 2011-2013, and his prescriptions resulted in $8,546.37 in payments from the City between 2011 and 2015 for ______opioids. PRESCRIBER CC received $8,250 in speaking fees for 2010, and his prescriptions resulted in $4,193 in claims from Nuc___ and Nuc___ ER.

Chicago - Agreement
• Disclose the risk of addiction to opioids, even when used as directed.
• Disclose that there are no adequate and well-controlled studies of the use of these products longer than 12 weeks. (This is especially important since opioids are frequently prescribed for long-term pain conditions.)
• Not promote opioids for any off-label or unapproved uses.
• Include information on opioid addiction and abuse in connection with its promotional efforts and communications, whether under the Pfizer brand or not.
• Maintain and promote a non-marketing website.
• Upon request, and to the extent it is educating prescribers about opioids, fund continuing medical education programs aimed at increasing prescribers' awareness of the risks of opioid addiction and abuse and helping prescribers identify signs of opioid addiction and abuse.

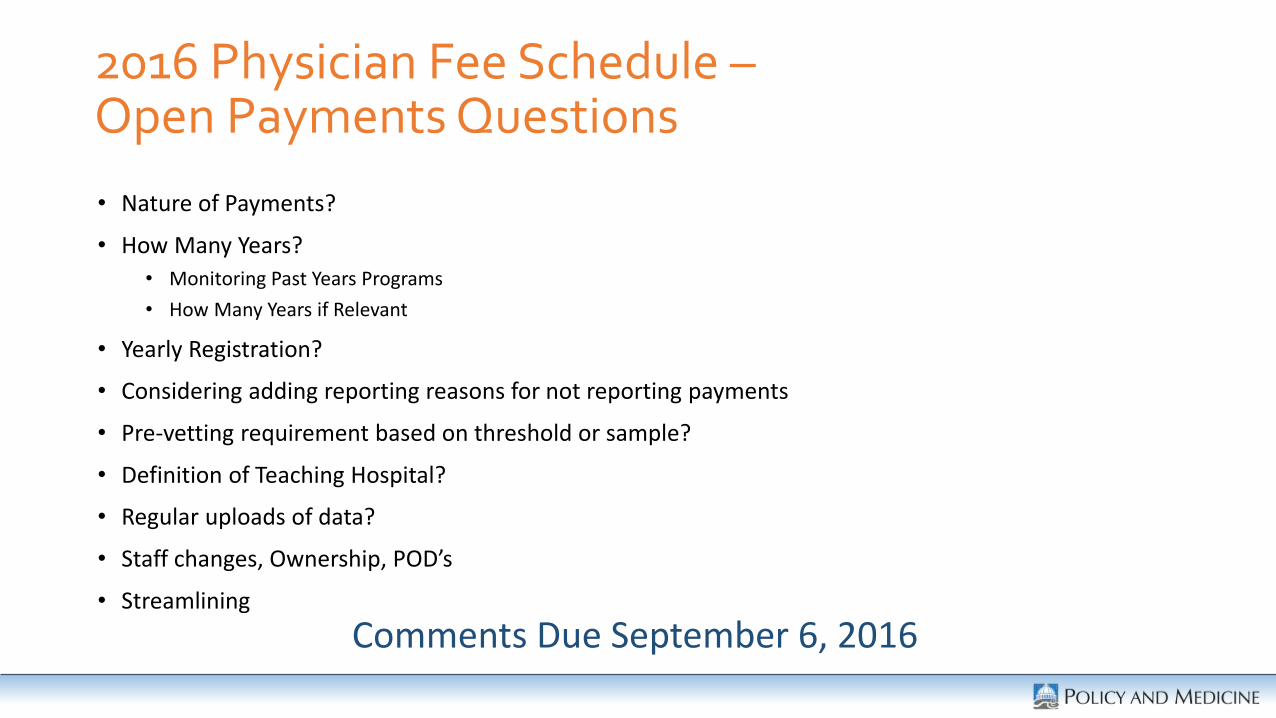
2016 Physician Fee Schedule –Open Payments Questions
• Nature of Payments?
• How Many Years?
• Monitoring Past Years Programs
• How Many Years if Relevant
• Yearly Registration?
• Considering adding reporting reasons for not reporting payments
• Pre-vetting requirement based on threshold or sample?
• Definition of Teaching Hospital?
• Regular uploads of data?
• Staff changes, Ownership, POD’s
• Streamlining
Comments Due September 6, 2016

Brief Look at UK Data

ABPI UK Reporting
2015 UK Pounds US Dollars
Grand Total £80,968,577 $123,072,236
Left Blank £56,580,822 $86,002,849
With Personal Data £24,387,755 $37,069,387
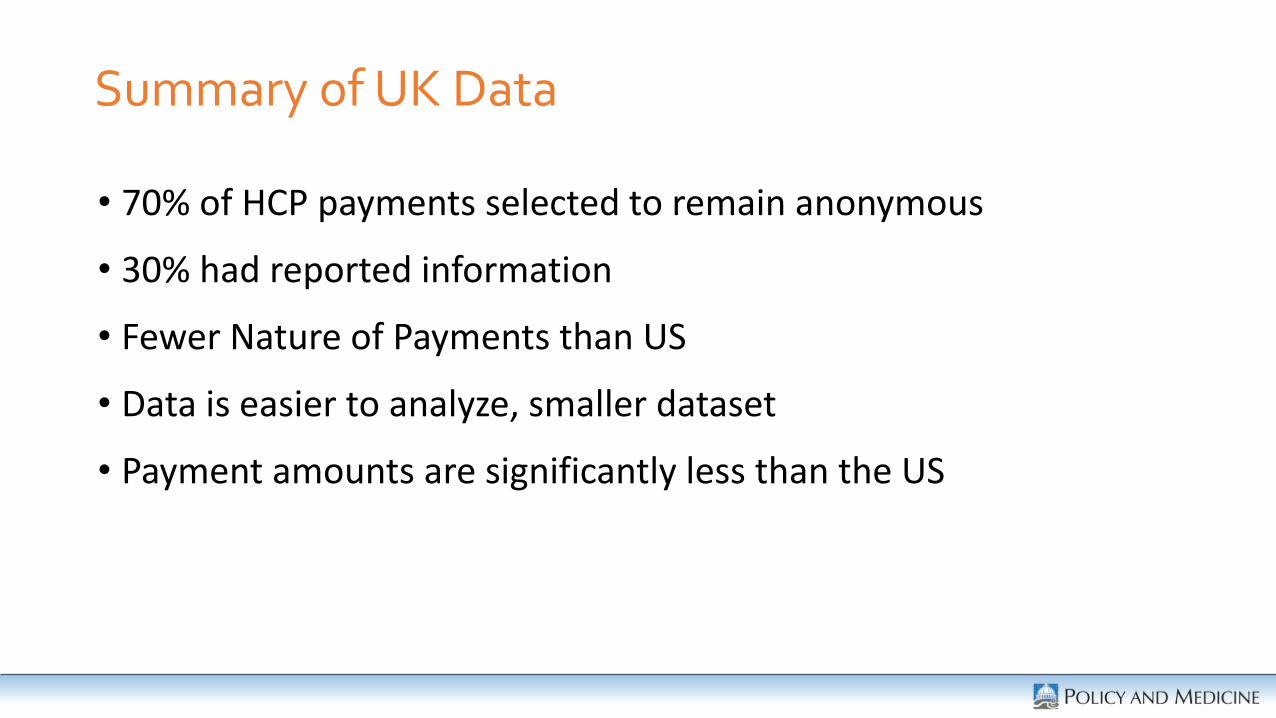
Summary of UK Data
• 70% of HCP payments selected to remain anonymous
• 30% had reported information
• Fewer Nature of Payments than US
• Data is easier to analyze, smaller dataset
• Payment amounts are significantly less than the US
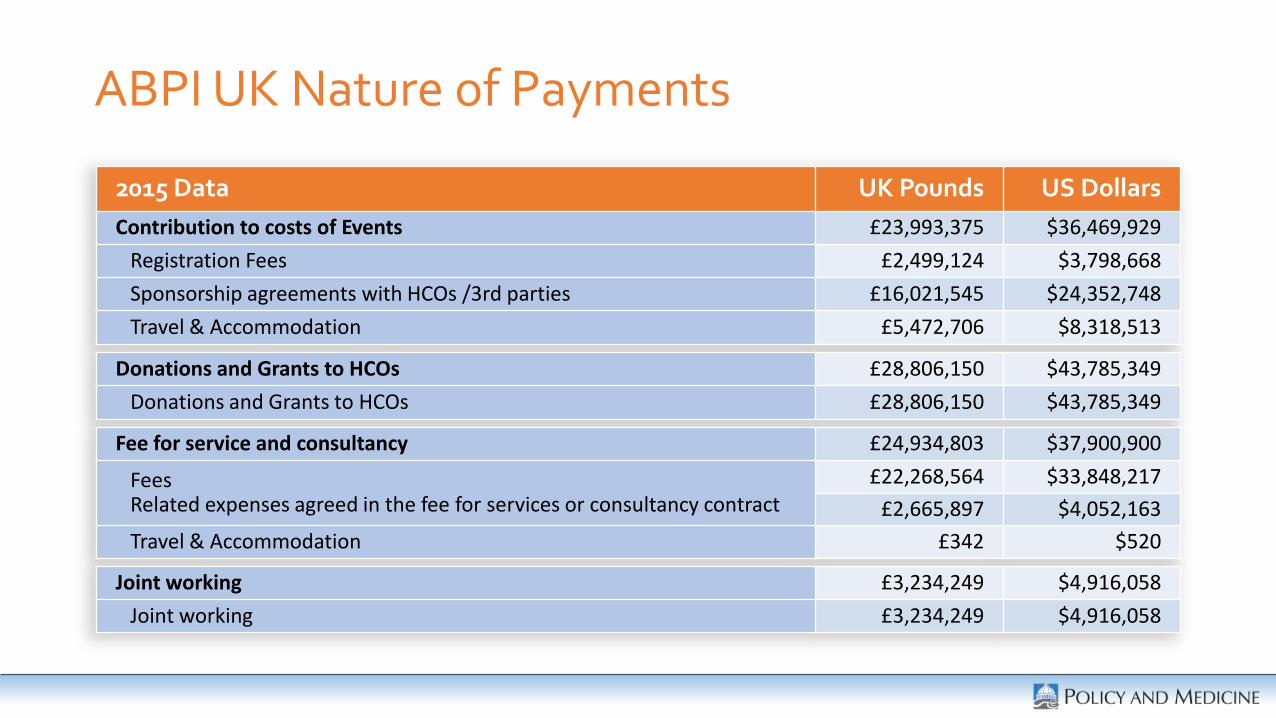
ABPI UK Nature of Payments
2015 Data UK Pounds US Dollars
Contribution to costs of Events £23,993,375 $36,469,929
Registration Fees £2,499,124 $3,798,668
Sponsorship agreements with HCOs /3rd parties £16,021,545 $24,352,748
Travel & Accommodation £5,472,706 $8,318,513
Donations and Grants to HCOs £28,806,150 $43,785,349
Donations and Grants to HCOs £28,806,150 $43,785,349
Fee for service and consultancy £24,934,803 $37,900,900
FeesRelated expenses agreed in the fee for services or consultancy contract
£22,268,564 $33,848,217
£2,665,897 $4,052,163
Travel & Accommodation £342 $520
Joint working £3,234,249 $4,916,058
Joint working £3,234,249 $4,916,058

Specialty UK Pounds US Dollars
Nurse £2,617,309.21 $3,978,310
Oncology £1,887,557.25 $2,869,087
Haematology £1,885,226.91 $2,865,545
Pneumology £1,619,318.92 $2,461,365
Diabetes £1,607,100.83 $2,442,793
General Medicine £1,444,717.02 $2,195,970
Miscellaneous £1,221,357.89 $1,856,464
Cardiology £1,095,473.54 $1,665,120
Rheumatology £938,870.05 $1,427,082
Gastroenterology £929,236.33 $1,412,439
Neurology £806,936.20 $1,226,543
Healthcare Administration £765,535.22 $1,163,614Pharmacist £651,794.81 $990,728Ophthalmology £645,391.80 $980,996Dermatology £602,938.12 $916,466Urology £516,161.53 $784,566Psychiatry £499,500.73 $759,241

Name UK Pounds US Dollars
Ian Pavord £98,703 $150,028
Brian Lipworth £96,647 $146,903
John Gribben £90,109 $136,965
Mark Nelson £75,115 $114,175
Ernest Choy £68,935 $104,781
Marcus Drake £68,897 $104,724
Anita Hill £68,711 $104,441
Ashley Brown £64,847 $98,568
Paul Jones £64,135 $97,485
Anton Pozniak £62,143 $94,457
Lyndon Evans £61,568 $93,583
Sukh Singh £60,480 $91,929
Peter Ratcliffe £55,463 $84,304
Peter Hillmen £52,714 $80,126
Simon Travis £52,401 $79,650
John Harrison £51,740 $78,645
Nicholas Thatcher £51,490 $78,264
Catherine Harmer £51,046 $77,590

Company UK Pounds US Dollars
Pfizer Ltd £6,943,794 $10,554,567GlaxoSmithKline plc £5,704,678 $8,671,111AstraZeneca £5,499,063 $8,358,575Novartis Pharmaceuticals UK Ltd £5,016,062 $7,624,415Janssen-Cilag Ltd £4,862,484 $7,390,976Bayer Plc £4,312,210 $6,554,560Biogen Idec Ltd £3,466,763 $5,269,480UCB Pharma Ltd £2,987,607 $4,541,163Roche Products Limited £2,857,888 $4,343,989Novo Nordisk Limited £2,229,701 $3,389,145Sanofi Aventis £2,217,778 $3,371,022AbbVie Limited £1,857,482 $2,823,372Genzyme £1,678,806 $2,551,786Astellas Pharma Ltd £1,533,248 $2,330,537Gilead £1,468,482 $2,232,093Bristol-Myers Squibb Pharmaceuticals Ltd £1,465,509 $2,227,574Eli Lilly & Company Ltd £1,404,496 $2,134,834Merck Serono Ltd £1,389,132 $2,111,480Merck Sharp & Dohme Ltd £1,347,067 $2,047,543
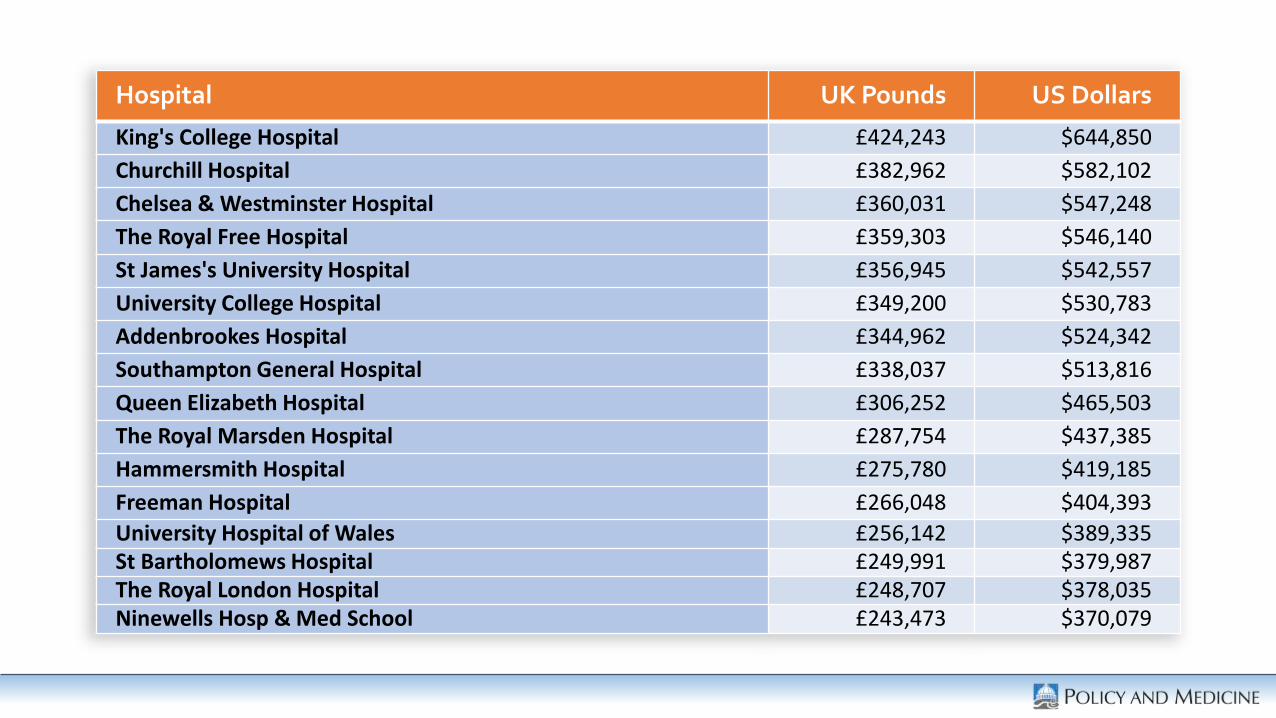
Hospital UK Pounds US Dollars
King's College Hospital £424,243 $644,850
Churchill Hospital £382,962 $582,102
Chelsea & Westminster Hospital £360,031 $547,248
The Royal Free Hospital £359,303 $546,140
St James's University Hospital £356,945 $542,557
University College Hospital £349,200 $530,783
Addenbrookes Hospital £344,962 $524,342
Southampton General Hospital £338,037 $513,816
Queen Elizabeth Hospital £306,252 $465,503
The Royal Marsden Hospital £287,754 $437,385
Hammersmith Hospital £275,780 $419,185
Freeman Hospital £266,048 $404,393
University Hospital of Wales £256,142 $389,335St Bartholomews Hospital £249,991 $379,987The Royal London Hospital £248,707 $378,035Ninewells Hosp & Med School £243,473 $370,079
Summary
• Though the aggregate data remained the same, huge variations in company level data and inter company level data
• Not Much Media will be on just Open Payments – look for more tie in reports
• Look at your data, document your outliers
• More plaintiff attorneys and prosecutors will use open payments
• Look for changes in Open Payments 2017 Fee Schedule
• A bill may be yet passed on Reprints and CME
• The Global Ag Spend Movement is going to be HUGE!!!!

More Information
Thomas Sullivan
www.Rockpointe.com
www.policymed.com
www.lifescicompliance.com
