reuters digital news report 2014 - university of tampere slide presentation and the finnish report...
TRANSCRIPT

Reuters Digital News Report 2014Key Findings: Finland
Agenda
Background and methodology
Overall news consumption
Devices to access news
Digital devices and the news day
Pathways to the news
Social media, sharing and participation
Paying for news
News videos
Trust and partiality
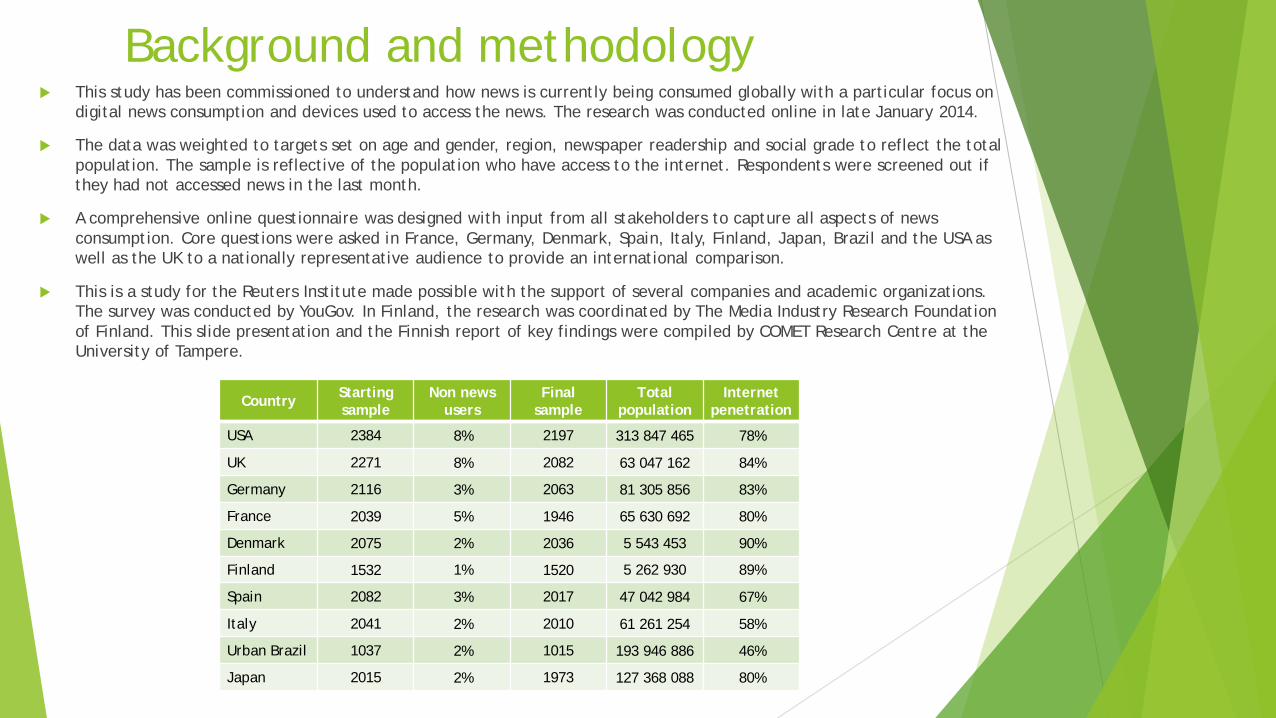
Background and methodologyThis study has been commissioned to understand how news is currently being consumed globally with a particular focus on digital news consumption and devices used to access the news. The research was conducted online in late January 2014.
The data was weighted to targets set on age and gender, region, newspaper readership and social grade to reflect the total population. The sample is reflective of the population who have access to the internet. Respondents were screened out if they had not accessed news in the last month.
A comprehensive online questionnaire was designed with input from all stakeholders to capture all aspects of news consumption. Core questions were asked in France, Germany, Denmark, Spain, Italy, Finland, Japan, Brazil and the USA as well as the UK to a nationally representative audience to provide an international comparison.
This is a study for the Reuters Institute made possible with the support of several companies and academic organizations. The survey was conducted by YouGov. In Finland, the research was coordinated by The Media Industry Research Foundation of Finland. This slide presentation and the Finnish report of key findings were compiled by COMET Research Centre at the University of Tampere.
Country Startingsample
Non news users
Finalsample
Totalpopulation
Internetpenetration
USA 2384 8% 2197 313 847 465 78%
UK 2271 8% 2082 63 047 162 84%
Germany 2116 3% 2063 81 305 856 83%
France 2039 5% 1946 65 630 692 80%
Denmark 2075 2% 2036 5 543 453 90%
Finland 1532 1% 1520 5 262 930 89%
Spain 2082 3% 2017 47 042 984 67%
Italy 2041 2% 2010 61 261 254 58%
Urban Brazil 1037 2% 1015 193 946 886 46%
Japan 2015 2% 1973 127 368 088 80%

OVERALL NEWS CONSUMPTION
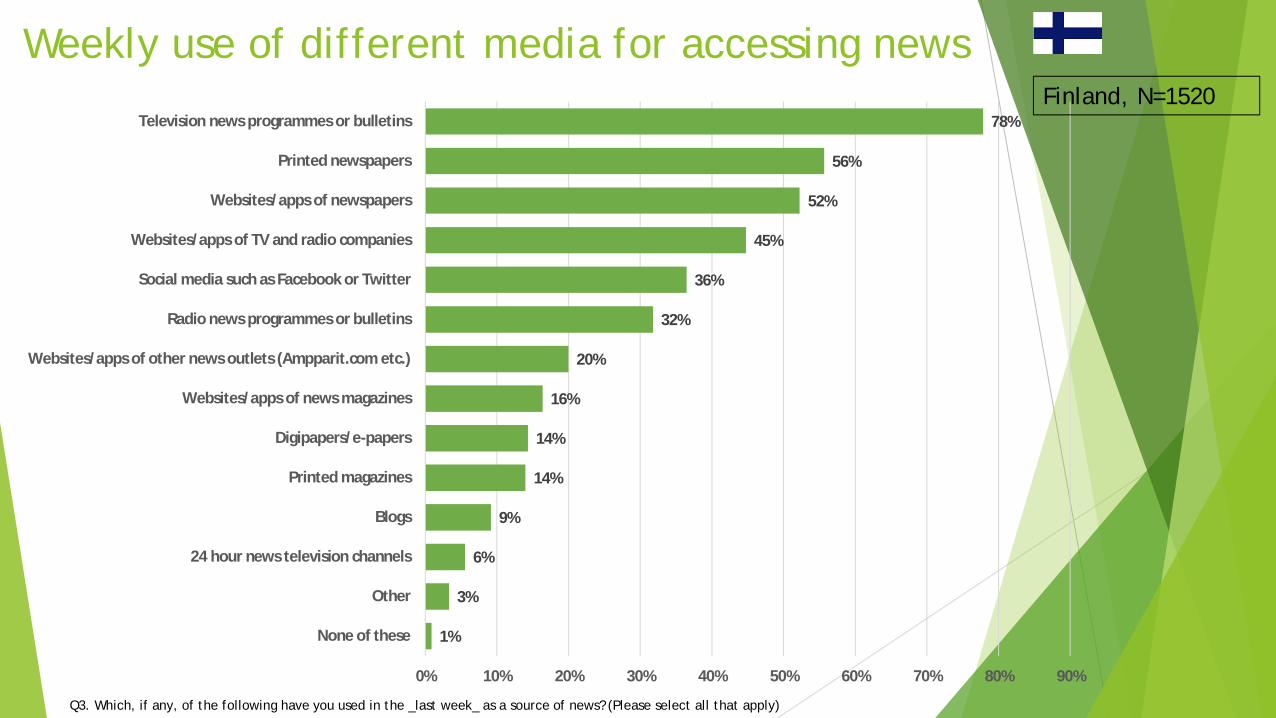
Weekly use of different media for accessing news
1%
3%
6%
9%
14%
14%
16%
20%
32%
36%
45%
52%
56%
78%
0% 10% 20% 30% 40% 50% 60% 70% 80% 90%
None of these
Other
24 hour news television channels
Blogs
Printed magazines
Digipapers/e-papers
Websites/apps of news magazines
Websites/apps of other news outlets (Ampparit.com etc.)
Radio news programmes or bulletins
Social media such as Facebook or Twitter
Websites/apps of TV and radio companies
Websites/apps of newspapers
Printed newspapers
Television news programmes or bulletinsFinland, N=1520
Q3. Which, if any, of the following have you used in the _last week_ as a source of news? (Please select all that apply)
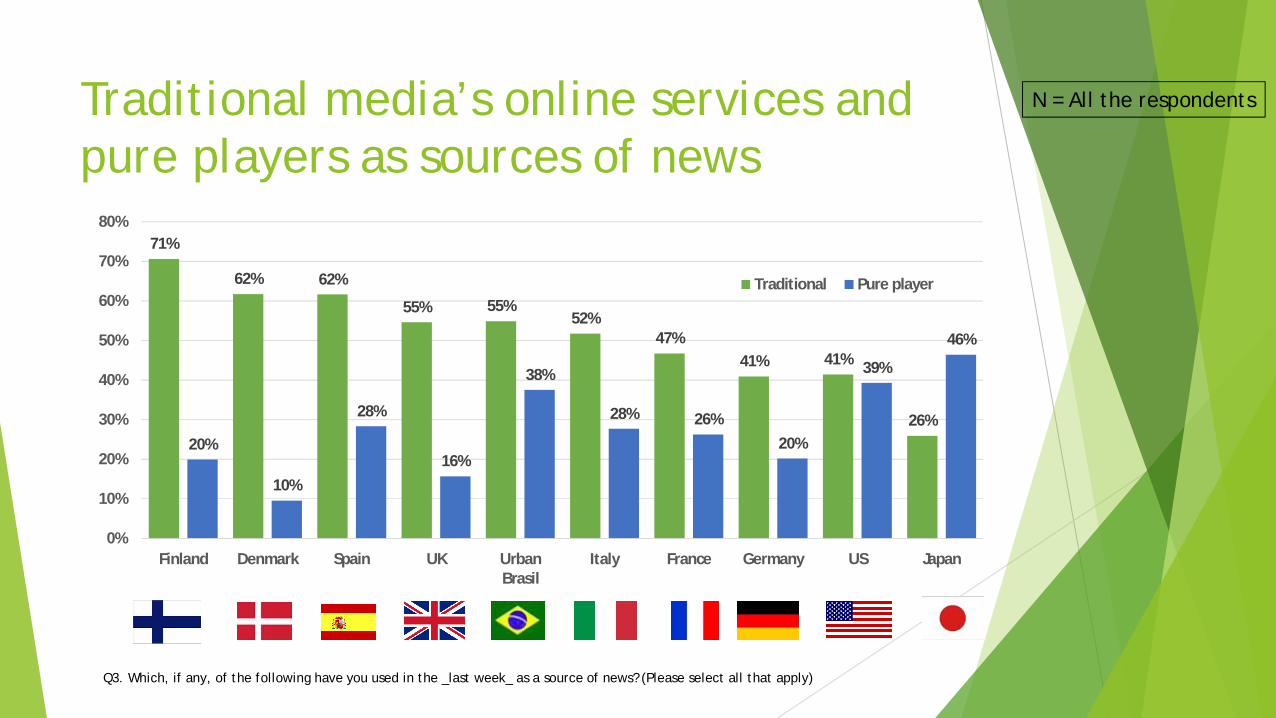
Traditional media’s online services and pure players as sources of news
71%
62% 62%
55% 55%52%
47%41% 41%
26%20%
10%
28%
16%
38%
28% 26%20%
39%
46%
0%
10%
20%
30%
40%
50%
60%
70%
80%
Finland Denmark Spain UK UrbanBrasil
Italy France Germany US Japan
Traditional Pure player
Q3. Which, if any, of the following have you used in the _last week_ as a source of news? (Please select all that apply)
N = All the respondents

Weekly use of printed papers for accessing news
39%43%
54%
60%
73%
13%
7%
17%22%
28%
0%
10%
20%
30%
40%
50%
60%
70%
80%
18-24 25-34 35-44 45-54 55+
News source Most important news source
Q3. Which, if any, of the following have you used in the last week as a source of news? (Please select all that apply) Q4: You say you’ve used these sources of news in the last week, which would you say is your MAIN source of news / Net: printed (newspapers and magazines)
FinlandNews source: N=1520Most important news source: N=1369

8
57%56%
31%27%
22%17%16%15%14%13%
10%8%8%7%7%6%5%
2%2%2%1%
7%
Iltalehti.fiIlta-Sanomat (iltasanomat.fi)
Helsingin Sanomat (hs.fi)MTV uutiset (mtv.fi/uutiset)
Yle TV-uutiset…Maakunta-/paikallislehti verkossa
Taloussanomat.fiKauppalehti.fi
Yle1 (radio) uutiset…Ampparit.com
Aamulehti.fiUlkomaiset sanomalehdet tai TV-…
Uusi Suomi (uusisuomi.fi)Ilmaisjakelulehtien, kuten esim.…
Suomi24.fiMuu
Muut Suomen ulkopuoliset…Kaupalliset radiouutiset verkossa
Google NewsHBL.fi
Dont knowNone of these
Online sources
Q5a. Which, if any, of the following have you used to access news in the last week? Via traditional (Radio/TV/Print) Q5b. Which, if any, of the following have you used to access news in the last week? Via online (computer, mobile, tablet, e-reader)
News sources accessed last week
61%
55%
36%
31%
28%
25%
24%
22%
13%
10%
9%
4%
1%
7%
1%
5%
Yle TV-uutiset
MTV uutiset
Maakunta-/paikallislehti
Ilta-Sanomat
Iltalehti
Helsingin Sanomat
Yle1 (radio) uutiset
Ilmaisjakelulehti, esim. Metro
Kaupalliset radiouutiset
Aamulehti
Kauppalehti
Ulkomaiset sanomalehdet tai TV-…
Hufvudstadsbladet
Other
Dont know
None of these
Traditional sources
9
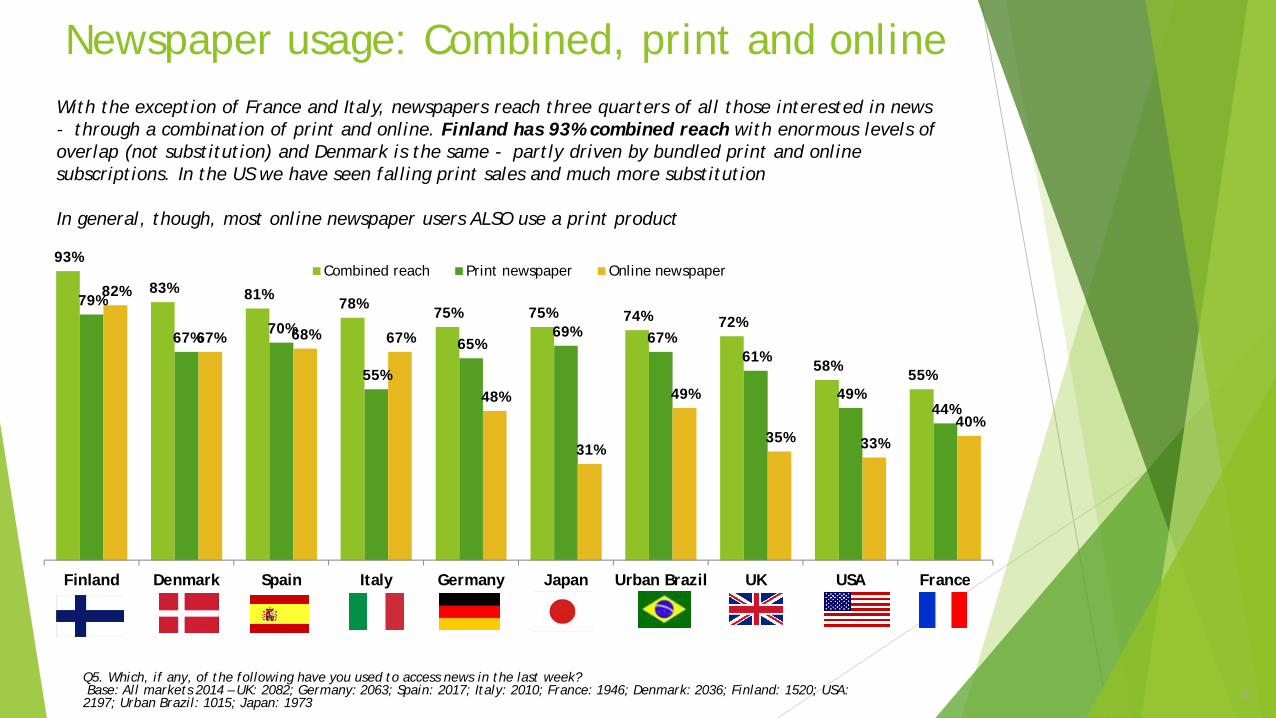
Newspaper usage: Combined, print and online
93%
83% 81%78%
75% 75% 74% 72%
58%55%
79%
67%70%
55%
65%69% 67%
61%
49%44%
82%
67% 68% 67%
48%
31%
49%
35% 33%40%
Finland Denmark Spain Italy Germany Japan Urban Brazil UK USA France
Combined reach Print newspaper Online newspaper
Q5. Which, if any, of the following have you used to access news in the last week?Base: All markets 2014 – UK: 2082; Germany: 2063; Spain: 2017; Italy: 2010; France: 1946; Denmark: 2036; Finland: 1520; USA:
2197; Urban Brazil: 1015; Japan: 1973
With the exception of France and Italy, newspapers reach three quarters of all those interested in news - through a combination of print and online. Finland has 93% combined reach with enormous levels of overlap (not substitution) and Denmark is the same - partly driven by bundled print and online subscriptions. In the US we have seen falling print sales and much more substitution
In general, though, most online newspaper users ALSO use a print product

DEVICES TO ACCESS NEWS
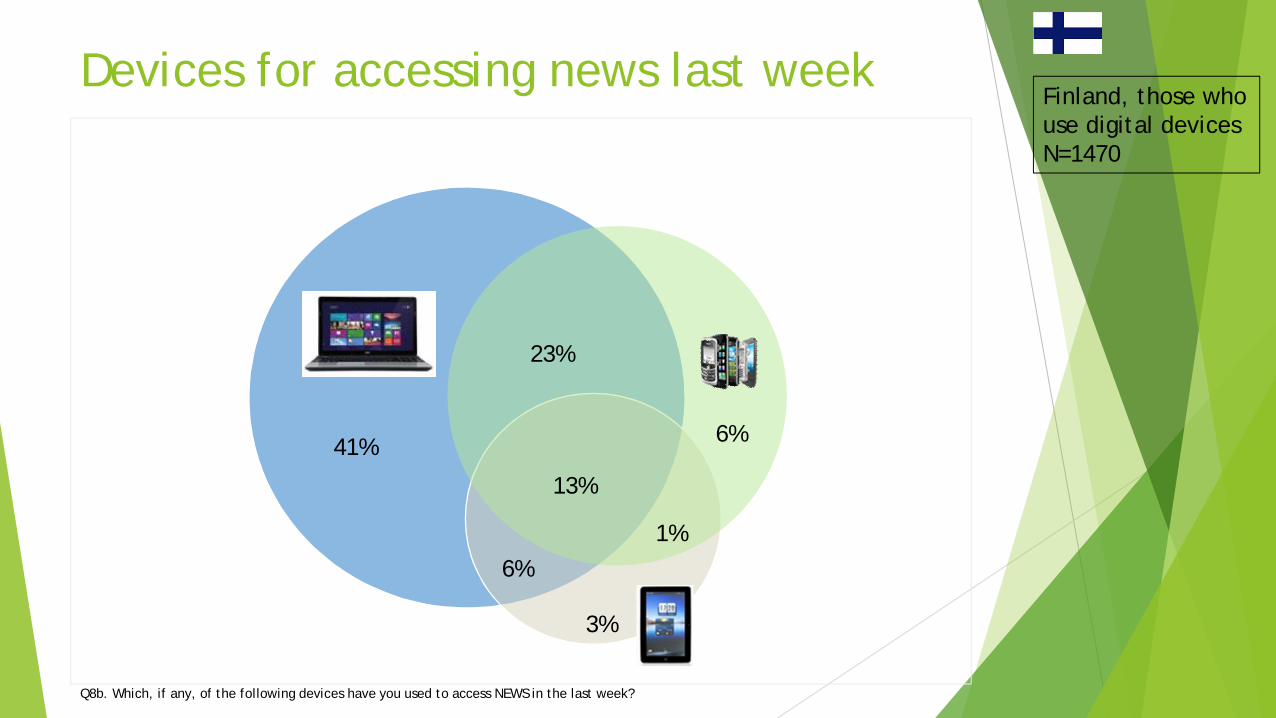
Devices for accessing news last weekFinland, those whouse digital devicesN=1470
41%
23%
6%
13%
1%
3%
6%
Q8b. Which, if any, of the following devices have you used to access NEWS in the last week?
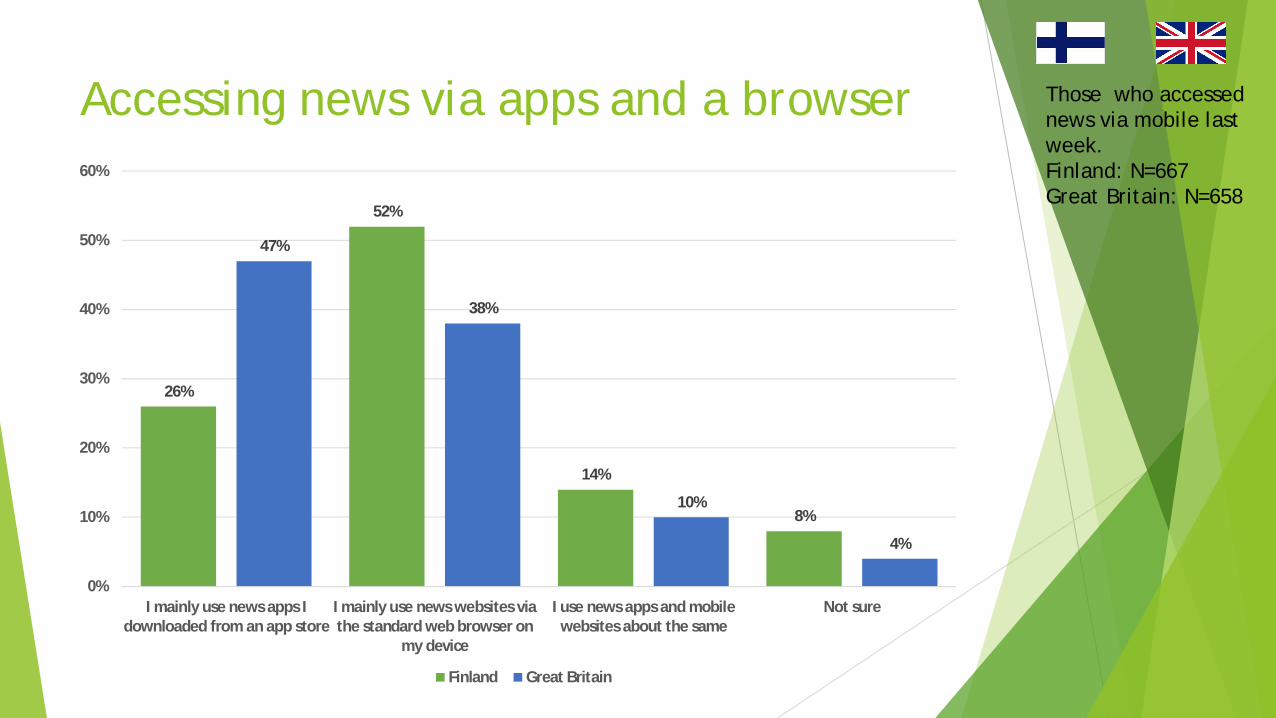
Accessing news via apps and a browser
26%
52%
14%
8%
47%
38%
10%
4%
0%
10%
20%
30%
40%
50%
60%
I mainly use news apps Idownloaded from an app store
I mainly use news websites viathe standard web browser on
my device
I use news apps and mobilewebsites about the same
Not sure
Finland Great Britain
Those who accessednews via mobile lastweek. Finland: N=667 Great Britain: N=658

DIGITAL DEVICES AND THE NEWS DAY

Those accessing news several times in a dayaccording to the use of digital devices
80% 82%85% 85%
72%70%76% 75%
81%
57%
0%
10%
20%
30%
40%
50%
60%
70%
80%
90%
Smart phone Smart phone andcomputer
Smart phone and tablet All three devices All respondents
Q1b:Typically, how often do you access news. By news we mean national, international, regional/local news and other topical events accessed via radio, TV, newspaper or online.
Finland Great Britain

Accessing the news during the day
0%
10%
20%
30%
40%
50%
60%
70%
80%
90%
100%
First thing in themorning
Later in themorning
Lunchtime Afternoon Early evenging Late evening Last thing at night
Q4b: When do you typically access the news? (Please select all that apply)
All 18-24 25-34 35-44 45-54 55+
Finland, N=1520

PATHWAYS TO THE NEWS
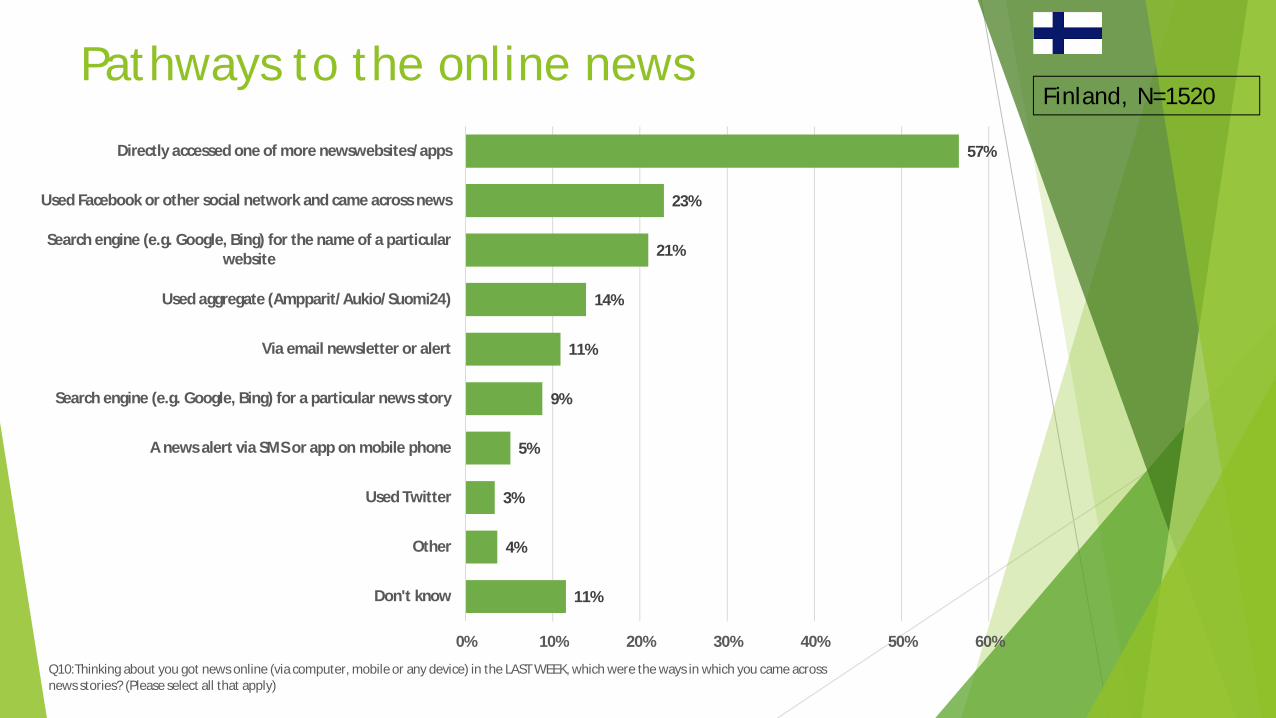
Pathways to the online news
11%
4%
3%
5%
9%
11%
14%
21%
23%
57%
0% 10% 20% 30% 40% 50% 60%
Don't know
Other
Used Twitter
A news alert via SMS or app on mobile phone
Search engine (e.g. Google, Bing) for a particular news story
Via email newsletter or alert
Used aggregate (Ampparit/Aukio/Suomi24)
Search engine (e.g. Google, Bing) for the name of a particularwebsite
Used Facebook or other social network and came across news
Directly accessed one of more newswebsites/apps
Q10:Thinking about you got news online (via computer, mobile or any device) in the LAST WEEK, which were the ways in which you came across news stories? (Please select all that apply)
Finland, N=1520
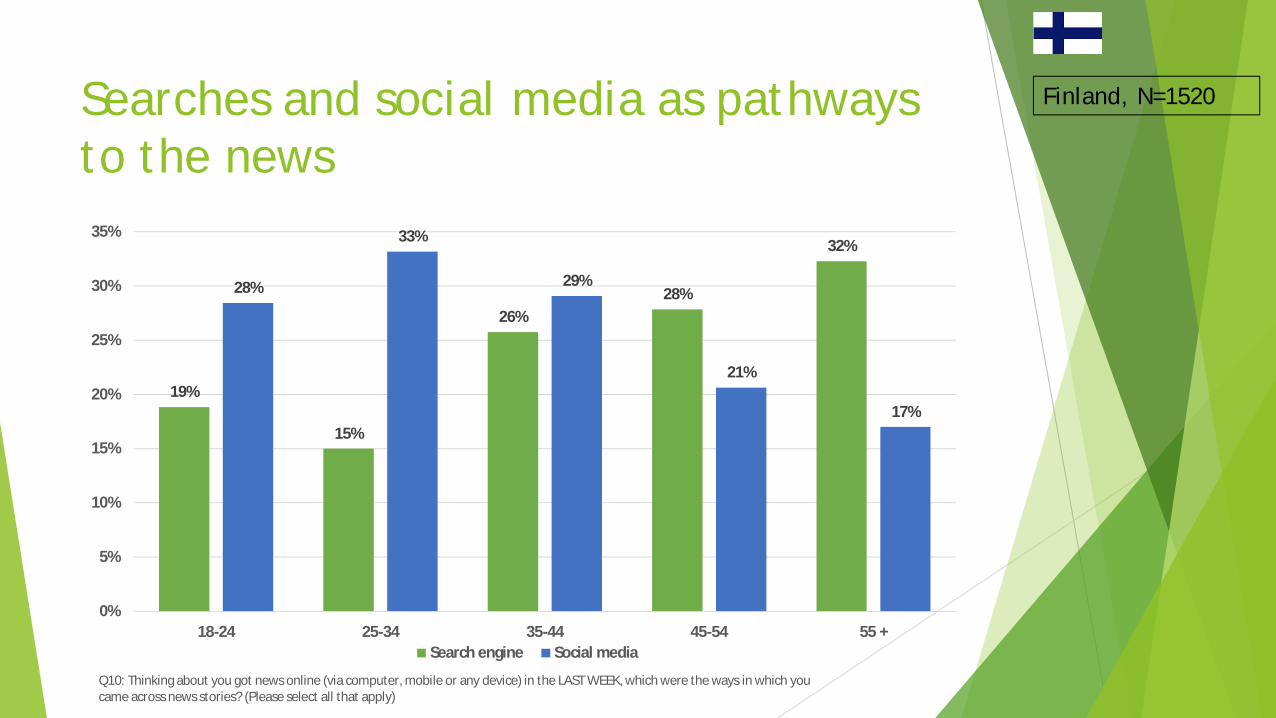
Searches and social media as pathwaysto the news
19%
15%
26%28%
32%
28%
33%
29%
21%
17%
0%
5%
10%
15%
20%
25%
30%
35%
18-24 25-34 35-44 45-54 55 +
Q10: Thinking about you got news online (via computer, mobile or any device) in the LAST WEEK, which were the ways in which you came across news stories? (Please select all that apply)
Search engine Social media
Finland, N=1520

SOCIAL MEDIA, SHARING AND PARTICIPATION
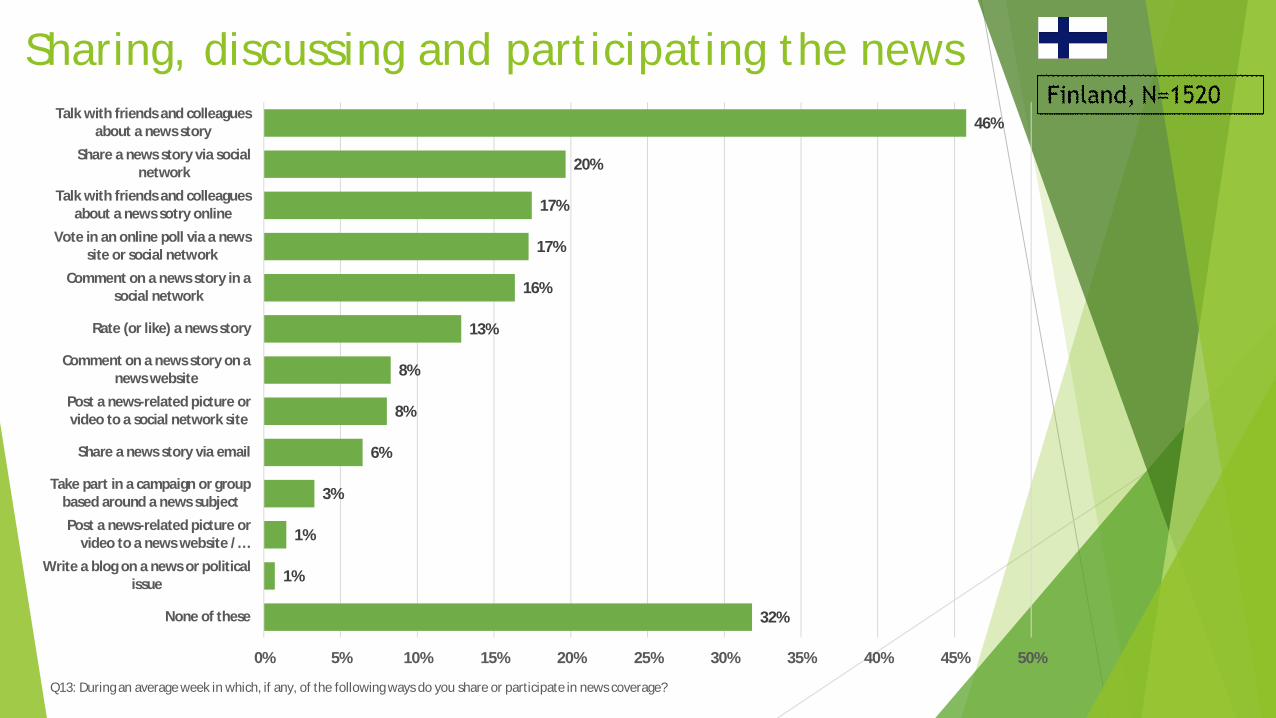
Sharing, discussing and participating the news
32%
1%
1%
3%
6%
8%
8%
13%
16%
17%
17%
20%
46%
0% 5% 10% 15% 20% 25% 30% 35% 40% 45% 50%
None of these
Write a blog on a news or politicalissue
Post a news-related picture orvideo to a news website /…
Take part in a campaign or groupbased around a news subject
Share a news story via email
Post a news-related picture orvideo to a social network site
Comment on a news story on anews website
Rate (or like) a news story
Comment on a news story in asocial network
Vote in an online poll via a newssite or social network
Talk with friends and colleaguesabout a news sotry online
Share a news story via socialnetwork
Talk with friends and colleaguesabout a news story
Q13: During an average week in which, if any, of the following ways do you share or participate in news coverage?

Use of social media services
5%
36%
0%
0%
0%
0%
0%
0%
0%
2%
6%
3%
12%
1%
8%
12%
9%
36%
2%
9%
1%
1%
1%
2%
3%
4%
7%
9%
13%
13%
14%
19%
25%
30%
59%
63%
0% 10% 20% 30% 40% 50% 60% 70%
I can't say
None of these
MySpace
Yahoo Answers
Foursquare
Tumblr
WindowsLive
Ampparit
Spotify
Suomi24
Google+
YouTube
Q12A: Which, if any, of the following have you used for any purpose in the last week? (Please select all that apply)Q12B: Which, if any, of the following have you used for reading, watching, sharing or discussing news in the last week?
Overall
For news

PAYING FOR NEWS
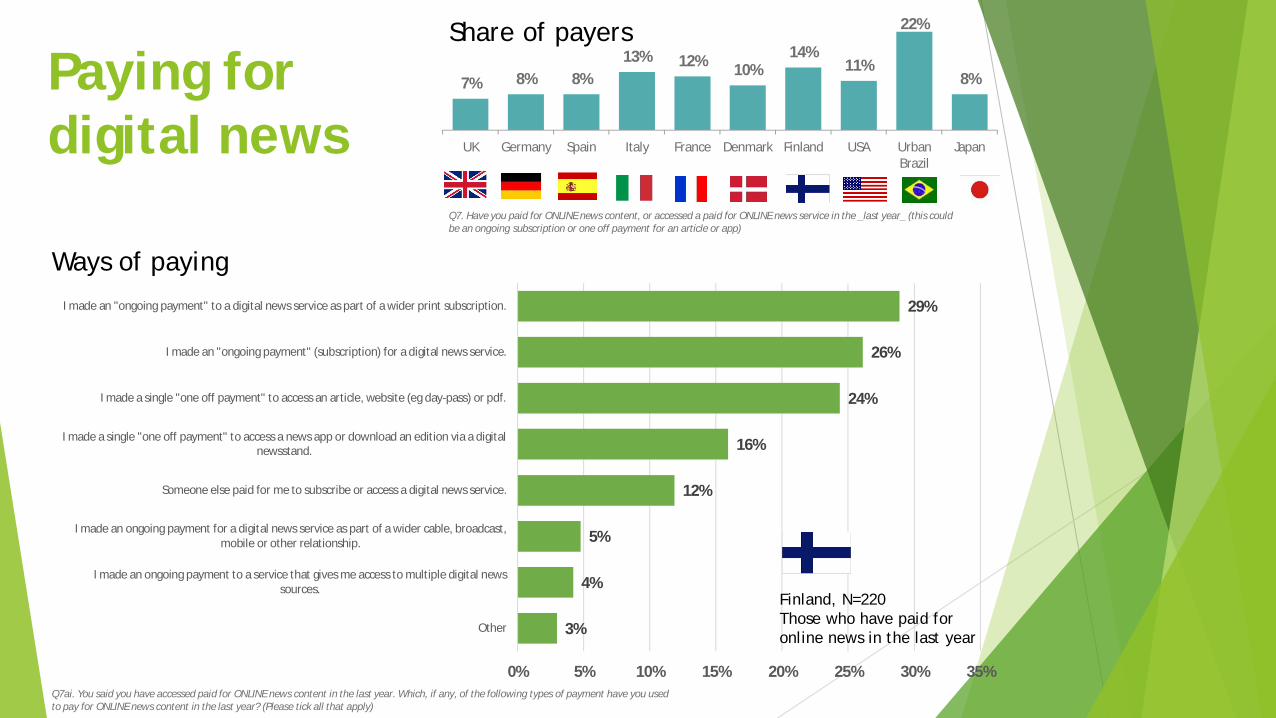
Paying fordigital news
7% 8% 8%13% 12% 10%
14%11%
22%
8%
UK Germany Spain Italy France Denmark Finland USA UrbanBrazil
Japan
Q7. Have you paid for ONLINE news content, or accessed a paid for ONLINE news service in the _last year_ (this could be an ongoing subscription or one off payment for an article or app)
3%
4%
5%
12%
16%
24%
26%
29%
0% 5% 10% 15% 20% 25% 30% 35%
Other
I made an ongoing payment to a service that gives me access to multiple digital newssources.
I made an ongoing payment for a digital news service as part of a wider cable, broadcast,mobile or other relationship.
Someone else paid for me to subscribe or access a digital news service.
I made a single "one off payment" to access a news app or download an edition via a digitalnewsstand.
I made a single "one off payment" to access an article, website (eg day-pass) or pdf.
I made an "ongoing payment" (subscription) for a digital news service.
I made an "ongoing payment" to a digital news service as part of a wider print subscription.
Share of payers
Ways of paying
Q7ai. You said you have accessed paid for ONLINE news content in the last year. Which, if any, of the following types of payment have you used to pay for ONLINE news content in the last year? (Please tick all that apply)
Finland, N=220Those who have paid for online news in the last year

”I made an ’ongoing payment’ to a digital news service as part of a wider print subscription”
31%29%
23%
18%17% 16%
15%13% 12% 12%
0%
5%
10%
15%
20%
25%
30%
35%
Denmark Finland US Japan Spain UK UrbanBrasil
Italy Germany France
Q7ai. You said you have accessed paid for ONLINE news content in the last year. Which, if any, of the following types of payment have you used in the last year? (Please tick all that apply)Base: All who have paid to access online news in the past year – UK=139, Germany=173, US=238, Japan=153, Urban Brazil=233, Italy=267, Denmark=206, Spain=173, Finland=220
Base: Those whohave paid to access online news in the past year
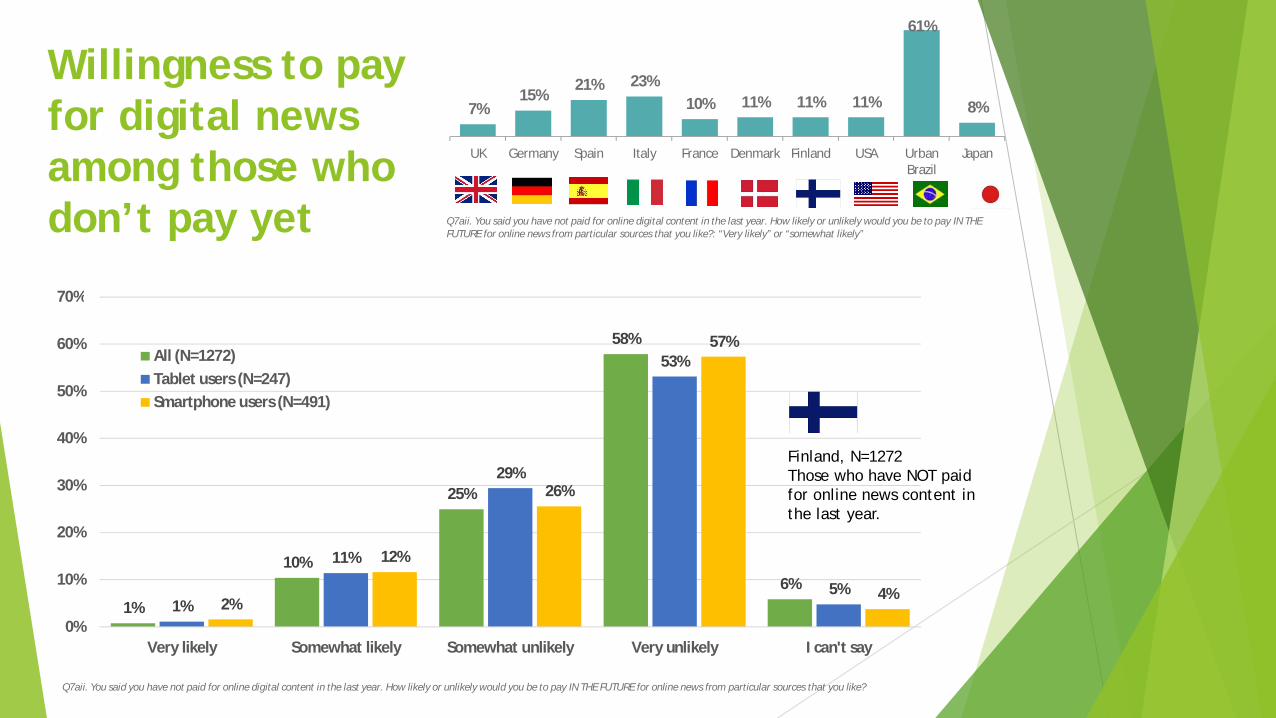
Willingness to payfor digital news among those whodon’t pay yet
7%15%
21% 23%10% 11% 11% 11%
61%
8%
UK Germany Spain Italy France Denmark Finland USA UrbanBrazil
Japan
Q7aii. You said you have not paid for online digital content in the last year. How likely or unlikely would you be to pay IN THEFUTURE for online news from particular sources that you like?: “Very likely” or “somewhat likely”
Q7aii. You said you have not paid for online digital content in the last year. How likely or unlikely would you be to pay IN THE FUTURE for online news from particular sources that you like?
Finland, N=1272Those who have NOT paidfor online news content in the last year.
1%
10%
25%
58%
6%1%
11%
29%
53%
5%2%
12%
26%
57%
4%
0%
10%
20%
30%
40%
50%
60%
70%
Very likely Somewhat likely Somewhat unlikely Very unlikely I can't say
All (N=1272)Tablet users (N=247)Smartphone users (N=491)
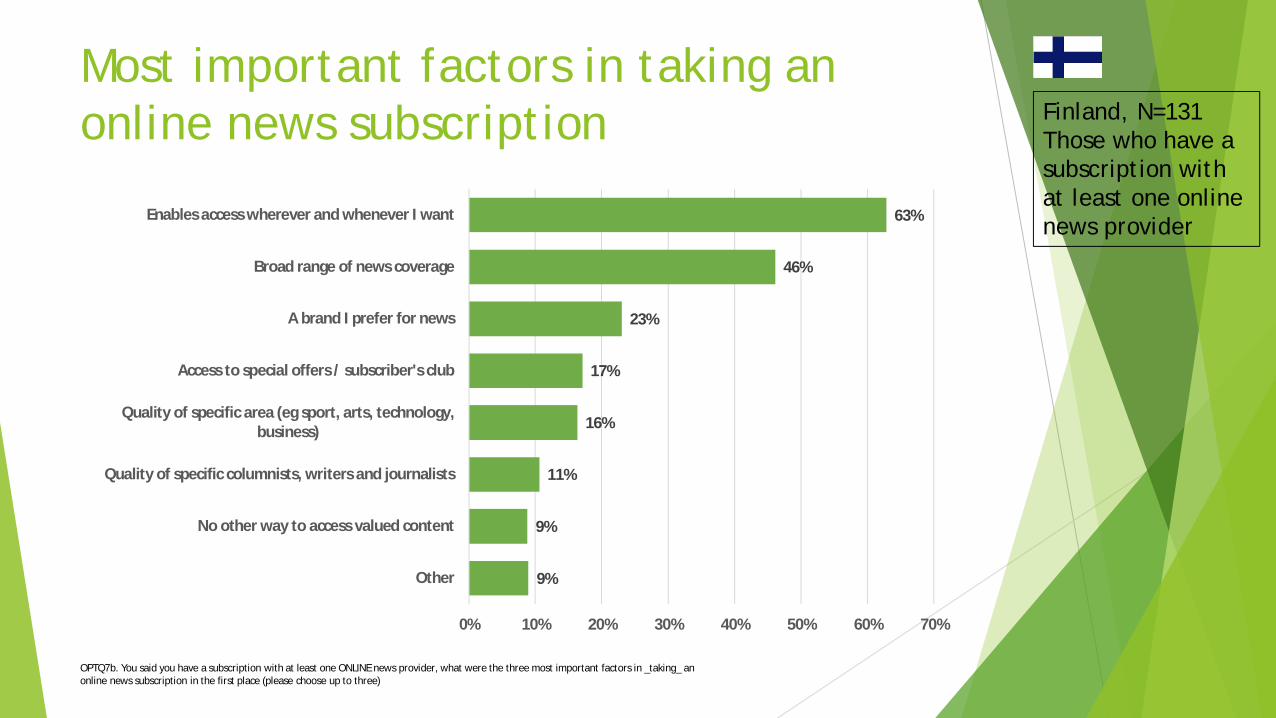
Most important factors in taking an online news subscription
OPTQ7b. You said you have a subscription with at least one ONLINE news provider, what were the three most important factors in _taking_ an online news subscription in the first place (please choose up to three)
9%
9%
11%
16%
17%
23%
46%
63%
0% 10% 20% 30% 40% 50% 60% 70%
Other
No other way to access valued content
Quality of specific columnists, writers and journalists
Quality of specific area (eg sport, arts, technology,business)
Access to special offers / subscriber's club
A brand I prefer for news
Broad range of news coverage
Enables access wherever and whenever I want
Finland, N=131Those who have a subscription withat least one online news provider

NEWS VIDEOS
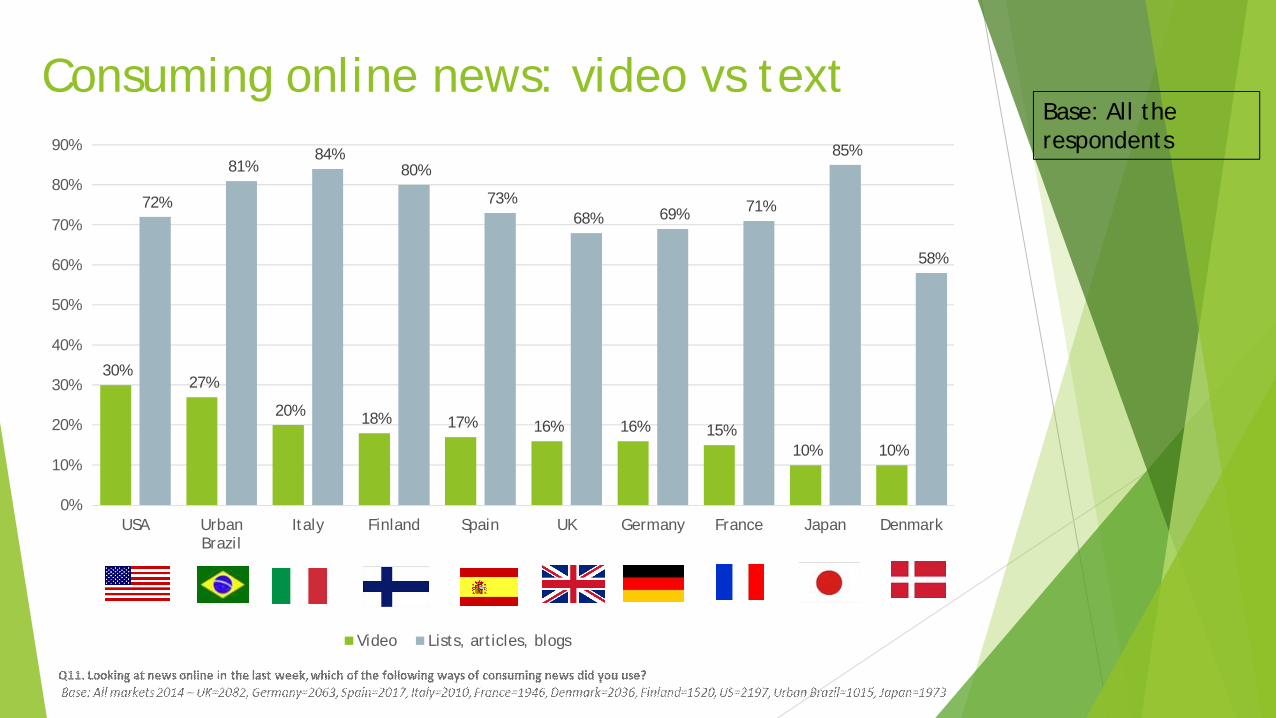
Consuming online news: video vs text
30%27%
20% 18% 17% 16% 16% 15%10% 10%
72%
81%84%
80%
73%68% 69% 71%
85%
58%
0%
10%
20%
30%
40%
50%
60%
70%
80%
90%
USA UrbanBrazil
Italy Finland Spain UK Germany France Japan Denmark
Video Lists, articles, blogs
Base: All therespondents

Watching different types of news videos
3%
4%
18%
24%
40%
44%
54%
0% 10% 20% 30% 40% 50% 60%
Don't know
None of these
Longer news programme accessed on demand (eg a stream ordownload of politics, heatlh, tech, film, food)
Live stream coverage of other scheduled news event (egpolitical speech, tech launch, fashion event etc.)
Live stream coverage of a breakikng news event
News clip that provided context or analysis on a text story egjournalist/politician talking to camera, or a short interview
News clip that adds drama to a text story (eg eyewitnesstestimony, raw footage of a news event)
Q11aii: Which TYPES of news video have you watched online in the last month? (Please select all that apply)
Finland, N=278Those whohave watchednews videos in the last week

TRUST AND PARTIALITY
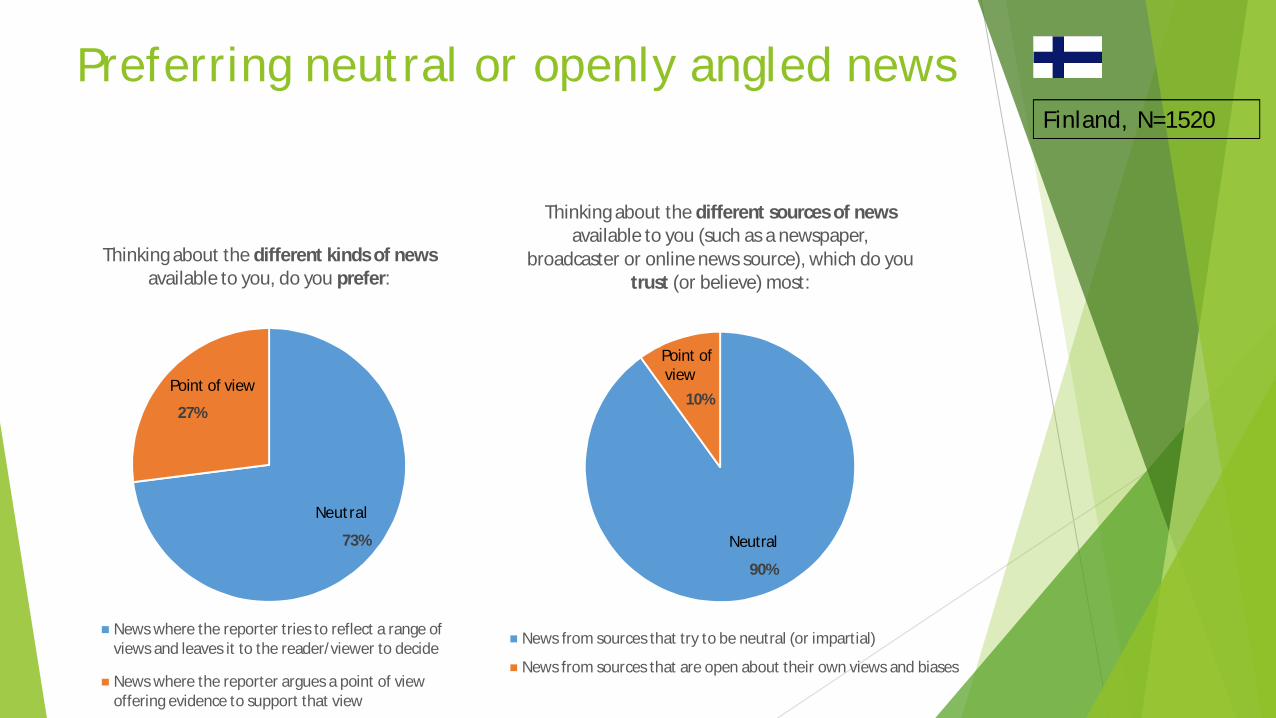
Preferring neutral or openly angled news
73%
27%
Thinking about the different kinds of news available to you, do you prefer:
News where the reporter tries to reflect a range ofviews and leaves it to the reader/viewer to decide
News where the reporter argues a point of viewoffering evidence to support that view
Point of view
90%
10%
Thinking about the different sources of news available to you (such as a newspaper,
broadcaster or online news source), which do you trust (or believe) most:
News from sources that try to be neutral (or impartial)
News from sources that are open about their own views and biases
Neutral
Point ofview
Neutral
Finland, N=1520
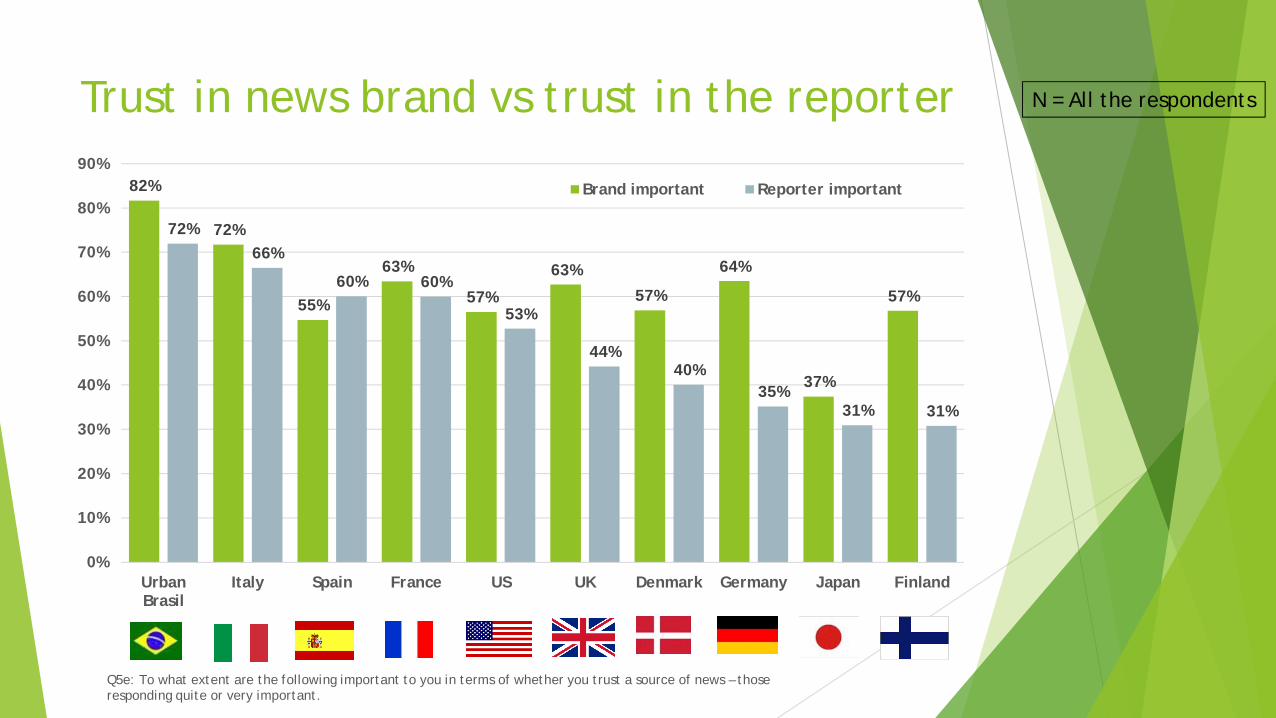
Trust in news brand vs trust in the reporter
82%
72%
55%
63%
57%
63%
57%
64%
37%
57%
72%66%
60% 60%
53%
44%40%
35%31% 31%
0%
10%
20%
30%
40%
50%
60%
70%
80%
90%
UrbanBrasil
Italy Spain France US UK Denmark Germany Japan Finland
Q5e: To what extent are the following important to you in terms of whether you trust a source of news – thoseresponding quite or very important.
Brand important Reporter important
N = All the respondents