revised framework for monitoring progress towards
TRANSCRIPT

Revised Framework for Monitoring Progress towards Universal Health Coverage in Bangladesh
Contents
Introduction .................................................................................................................................................. 1
Tracking of UHC in Bangladesh ..................................................................................................................... 2
Establishment and Role of Independent Reference Group (IRG) to track UHC in Bangladesh ............ Error!
Bookmark not defined.
Rationale for revising the existing Country Monitoring Framework: a Gap Analysis ... Error! Bookmark not
defined.
Modification of the UHC indicators .............................................................................................................. 4
Recommendations towards monitoring progress of UHC in Bangladesh .................................................... 4
Conclusion ................................................................................................................................................... 21
References .................................................................................................................................................. 21
Annexes ....................................................................................................................................................... 21
Introduction Universal health coverage (UHC) has become a major goal for health reform in many countries and a
priority objective of WHO. The UHC is defined as ensuring that all people have access to needed health
services (including prevention, promotion, treatment, rehabilitation and palliation) of sufficient quality
to be effective while also ensuring that the use of these services does not expose the user the financial
hardship [1].
UHC is comprised of two main components; which are quality and essential health service coverage as
well as financial coverage for all population. UHC monitoring has been widely varying in different
countries and reformed over time with the changing health systems. But it has been a process rather
than a product that must be sensitive to constantly evolving demographic, technological, and
epidemiological scenes. Hence, even the countries with the strongest or long established health system
struggle to maintain their status of coverage in the face of constantly changing political, financial, and
epidemiological situation of those countries. [2]
UHC brings hope of better health and protection for everyone in the world regardless of their financial
background in the light of all health related Sustainable Development Goals (SDGs). It is built on the
constitution of health being a fundamental human right declared by WHO in 1948 and the Health for All
agenda declaration of Alma Ata in 1978. The three main objectives of UHC revolve around;
1. Equity in access to health services

2. Quality of services
3. Protection against financial risk.
A broad consensus on the importance of UHC has been building since 58th world health assembly
resolution in 2005. United Nations agencies, development banks, bilateral donors and foundations
providing financial support and capacity building workshops. In parallel to that, a series of consultations
and conferences have improved our knowledge of the challenges regarding UHC and possible solutions
revolving some calls for action.
The Government of Bangladesh has made strong commitment to achieve SDGs and ensure UHC through
a monitoring framework. In case of many indicators, data is not available. In many cases, data produced
by national and sub national surveys are available but there are gaps in the data. It is essential to get the
proper standing of the health estimates at country level to come up with policies and planning. A lack of
coordination between different Government bodies, data collecting from different institutes and
duplication of data collection are held as the major causes for these gaps. Producing reliable and valid
data maintaining the methodology is very important for monitoring progress towards SDGs and UHC.
Therefore, it becomes mandatory to have a standard tracking system at country level through
recommendations and agreement between different stakeholders and policy makers.
Tracking of UHC in Bangladesh Tracking inequalities and targeting disadvantaged groups in health service coverage is central to
monitoring progress towards UHC. Currently national health information systems and periodic surveys
are inadequate for capturing data disaggregated by socio-demographics factors. The SDG target 17.18
emphasizes the importance for countries to improve data and statistics available by multiple equity
dimensions in all sectors, including health. Measuring the degree of inequity in service coverage is not
currently feasible for most indicators, and data is generally only available for indicators in reproductive,
maternal, newborn and child health using data from international household health surveys.
To monitor the progress towards UHC, the Health Economics Unit (HEU) of Ministry of Health and Family
Welfare (MOHFW) of Government of Bangladesh developed a monitoring framework with a set of
health indicators with technical assistance of the WHO country office of Bangladesh. The methodology
involved reviewing different strategic documents, reports and policies and analysis of health information
tools. Multiple discussions with different stakeholders were also used to develop this framework.
However, these indicators were adapted from Millennium Development Goals (MDG). Forty three
indicators were proposed in the previous framework. To align with SDG there was a necessity identified
to revise this country monitoring framework developed by HEU.
Review the existing HEU UHC-Country Monitoring Framework Methodology USAID supported "Research for Decision Maker's (RDM) Activity ", icddr,b, has an 'Independent
Reference Group’ (IRG) for tracking and monitoring progress towards UHC in Bangladesh. Through
several consultative meetings among the relevant stakeholders, the IRG has identified, exercised, and
listed 81 possible indicators from HEU UHC-Country Monitoring Framework, global UHC tracer and
health-related SDGs (Goal 2, 3, 4, 5, 6, 8, and 16) regarding Bangladesh UHC perspective (figure xx). The

IRG has reviewed all the existing data sources, methodologies, and estimates of the selected indicators.
Then, an ‘Indicator Matrix’ has been developed in details including definition, available data sources,
estimate of the sources, methods of estimation, study design and sampling technique, sample size for
measuring the estimates etc.
Gap Analysis
A gap analysis has been performed for the listed 81 indicators through reviewing the ‘Indicator Matrix’.
The major gap was found to be unavailability of the data which was the most frequent bottleneck
among the indicators. Unavailability of the latest data was another shortcoming as well as partial
availability of some data since in this type of situation the data are not often usable.
National data is not available for some of the indicators such as “social HI contribution” (SDG 3.8.1). For
other indicators, there is no national estimates readily available, but it is a minor issue since they can be
produced using the existing data sources.
Some indicators are found to have more than one gap and need clarification in many areas. Lack of
standard definition is observed for a significant number of indicators, where the indicators should be
redefined for country context. For example, in case of prevalence of HIV among Most-At-Risk-Population
(MARP), no standard definition of MARP is provided in the context of Bangladesh. Moreover, estimates
are not available for prisoners in this country.
Threshold levels based on this country’s context are also needed to be clearly defined for many of the
health financing related indicators. However, methodologies should be updated at national level to track
few of the indicators.. Most of the discussed discrepancies are assumed to exist because of the sample

variation primarily, however, detailed investigation is the key to address the gaps and make these
indicators functional to efficiently track progress towards UHC in Bangladesh.
Table 1: Summary of the identified gaps in the previous HEU UHC-Country Monitoring Framework
Need to Redefine
• District/UPZ hospital and below have 1 Obs/Gynae + 1 anesthesiologist • Percentage of hypertensive and diabetic patient taking treatment
Clarification • Share of population (%) lack adequate healthcare due to financial hardship • Share of population (%) fall into poverty due to OOPS • Share of households (%) facing catastrophic health spending • Prevalence of HIV among Most-At-Risk-Population (MARP) • Case fatality rate among hospitalized ARI cases • TB prevalence rate/100,000 population • Tobacco Prevalence Rate
Unavailability of Data Source
• Percentage of health facilities having electronic record (EHR) • Percentage of clients expressing satisfaction with health facilities • Index of service readiness & availability • Median drug price ratio for tracer drug • TB treatment success rate
Others • Social HI contribution (per capita as % of THE)
Revision of the HEU UHC-Country Monitoring Framework After performing the gap analysis, a workshop on “Review of Universal Health Coverage (UHC)
Monitoring Framework” was held on March 4, 2019 under the chairmanship of Director General, HEU,
MOHFW. The workshop was organized by HEU, MOHFW in collaboration with the Independent
Reference Group (IRG) under USAID’s Research for Decision Makers (RDM) Activity of icddr,b.
During this workshop participants were divided in groups under four thematic areas: – Reproductive,
Maternal, Neonatal, and Child Health and Family Planning, , Health System and Health Workforce,
Health Financing and Infectious and Non-communicable Diseases. The groups came up with the specific
recommendations for each of the indicators and other health related indicators for the revised UHC-
country monitoring framework.
Then, the IRG collaboration with HEU has exercised and listed 27 out of 81 possible indicators for the
revised UHC-Country Monitoring Framework. After that, another workshop and a consultative meeting
took place following this workshop to make consensus for the listed 27 possible indicators.
Revised HEU UHC-Country Monitoring Framework for Bangladesh After two workshops and one consultative meeting with the stakeholders hosted by HEU and icddr,b, a
set of 27 indicators have been suggested for monitoring progress towards UHC in Bangladesh. This set of
indicators has addressed the gaps and issues identified in the previous UHC-country monitoring
framework. These indicators have been selected focusing on the current priorities and needs of the
country. Moreover, the availability of data was a consideration for keeping the indicators on this list. If

an indicator is deemed very important for the country context but the data is not readily available the
stakeholders decided to keep this indicator. The indicators in the revised list are further categorized in
three different categories:
1. Service Coverage indicators
2. Financial Risk Protection indicators
3. Impact level indicators
Figure 1 Number of indicators in each sub-category
Table 2: List of indictors for the revised framework for monitoring UHC in Bangladesh
Service Coverage Indicators Financial Risk Protection Indicators Impact Indicators
Number of currently registered doctors per 10,000 population
Public health spending as a % of GDP Percentage of incident TB cases that are detected
Number of currently registered nurses & midwives per 10,000 population
Health insurance coverage Neonatal mortality rate
District and UPZ hospital have at least 1 Obs/Gynae + 1 anaesthesiologist
Share of health spending in total government expenditure
Total fertility rate
Number of Hospital beds per 10,000 population
Health expenditure per capita Maternal mortality ratio
Proportion of public health facilities that have a core set of relevant essential medicines
OOPS for health (as % of THE) % of stunted among under 5
children
% of service provider positions functionally vacant in district and upazila-level public facilities, by category (physician, nurse/midwife)
Proportion of population with catastrophic expenditure on health as a share of total household expenditure or income
Prevalence of HIV among MARP
Service readiness for RMNCH-FP
% of ever married women aged <50 years who received quality ANC care
Measles-Rubella (MR) immunization coverage among children under 12 months
15
6
6 Service Coverage
Financial riskprotection
Impact

Contraceptive prevalence rate for modern method
Percentage of households using improved sanitation facilities
Tobacco: Age-standardized prevalence of adults >=15 years smoking tobacco in last 30 days
Proportion of births attended by skilled health personnel
Percentage of diabetic patients aware,
treating and under control
Percentage of hypertensive patients
aware, treating and under control

Table 3: UHC Monitoring Framework Indicators with data
SL No. Tracer Indicator Available
data source Estimates
Publication
Year
Periodicity of
the survey
Data
Availability
Research
Design/Data
collection
methods
Sampling
technique
1
Number of
currently
registered doctors
per 10,000
population
Health
Bulletin 6.3 2018 1
Readily
available
Records from
HB
Not
applicable
HRH
country
profile
(GHO)
5.3 2017 Not regular Records Not
applicable
2
Number of
currently
registered Nurses
& Midwives per
10,000 population
Health
Bulletin 3.0 2017 1
Readily
available
Records Not
applicable
HRH
country
profile
(GHO)
3.1 2017 Not regular Records Not
applicable
3
District and UPZ
hospital have 1
Obs/Gynae + 1
anaesthesiologist
BHFS TBE 2017 3
Cross sectional
and Facility
assessment
using Service
Provision
Stratified
random
sampling

SL No. Tracer Indicator Available
data source Estimates
Publication
Year
Periodicity of
the survey
Data
Availability
Research
Design/Data
collection
methods
Sampling
technique
Assessment
(SPA) tool
4
Number of
Hospital beds per
10,000 population
Health
Bulletin 8.8 2018 1
Readily
available
Records Not
applicable
GHO 8 2015 Not regular Records Not
applicable
5
Proportion of
public health
facilities that have
a core set of
relevant essential
medicines
Not
available Not available Not available
Not
available
Not
available Not available Not available
6
Health insurance
coverage (to be
revised)
BNHA
1997-2012 TBE 2015
Not
applicable
Readily
available Not applicable
Not
applicable
7 Health expenditure
as % of GDP
BNHA
1997-2012 3.50 2015
Not
applicable
Readily
available Not applicable
Not
applicable

SL No. Tracer Indicator Available
data source Estimates
Publication
Year
Periodicity of
the survey
Data
Availability
Research
Design/Data
collection
methods
Sampling
technique
BNHA
1997-2015 3.00 Not available
Not
applicable
Readily
available Not applicable
Not
applicable
GHO 2.60 2015 Not
applicable
Readily
available Not applicable
Not
applicable
8 Service readiness
for RMNCH-FP BHFS TBE 2017 3
Cross sectional
and Facility
assessment
using Service
Availability and
Readiness
Assessment
(SARA) tool
Multi-stage
stratified
random
sampling
9
Share of health
spending in total
government
expenditure
National
Budget FY
2019-20
5.63 2019 Not
applicable
Not
available Not applicable
Not
applicable
10 Health expenditure
per capita GHO 2,544.00 2015
Not
applicable
Readily
available Not applicable
Not
applicable

SL No. Tracer Indicator Available
data source Estimates
Publication
Year
Periodicity of
the survey
Data
Availability
Research
Design/Data
collection
methods
Sampling
technique
BNHA
1997-2012 2,144.00 2015
Not
applicable
Readily
available Not applicable
Not
applicable
BNHA
1997-2015 2,882.00 Not available
Not
applicable
Readily
available Not applicable
Not
applicable
11
OOPS for health
(per capita as % of
THE)
BNHA
1997-2012 63.31 2015
Not
applicable
Readily
available Not applicable
Not
applicable
BNHA
1997-2015 66.90 Not available
Not
applicable
Readily
available Not applicable
Not
applicable
12
% of ever married
women aged <50
years who received
quality ANC care
BDHS 31.2% 2014
Readily
available
Cross-sectional
and Household
survey
2-Stage
Stratified
cluster
sampling
MICS 24.7% 2013 10
Cross-sectional
and Household
survey
2-Stage
Stratified
cluster
sampling
BMMS 37.2% 2016
Cross-sectional
and Household
survey
2-Stage
Stratified
cluster

SL No. Tracer Indicator Available
data source Estimates
Publication
Year
Periodicity of
the survey
Data
Availability
Research
Design/Data
collection
methods
Sampling
technique
sampling
UESDS 32.0% 2016
Cross-sectional
and Household
survey
2-Stage
Stratified
cluster
sampling
13
% of service
provider positions
functionally vacant
in district and
upzila-level public
facilities, by
category
(physician, nurse/
midwife)
BHFS
Physicians-38% 2014 3
Cross-sectional
and Facility
assessment
using Service
Provision
Assessment
(SPA) tool
Stratified
random
sampling
Nurses/midwifes-
19% 2014 3
Cross-sectional
and Facility
assessment
using Service
Provision
Assessment
Stratified
random
sampling

SL No. Tracer Indicator Available
data source Estimates
Publication
Year
Periodicity of
the survey
Data
Availability
Research
Design/Data
collection
methods
Sampling
technique
(SPA) tool
Paramedics-0.5% 2014 3
Cross-sectional
and Facility
assessment
using Service
Provision
Assessment
(SPA) tool
Stratified
random
sampling
14
Percentage of
incident TB cases
that are detected
(Tuberculosis
incidence per
100,000
population)
NTP
GTBR 287.00 2016 1 year
Partially
available
Patients
registered in
National TB
control
program
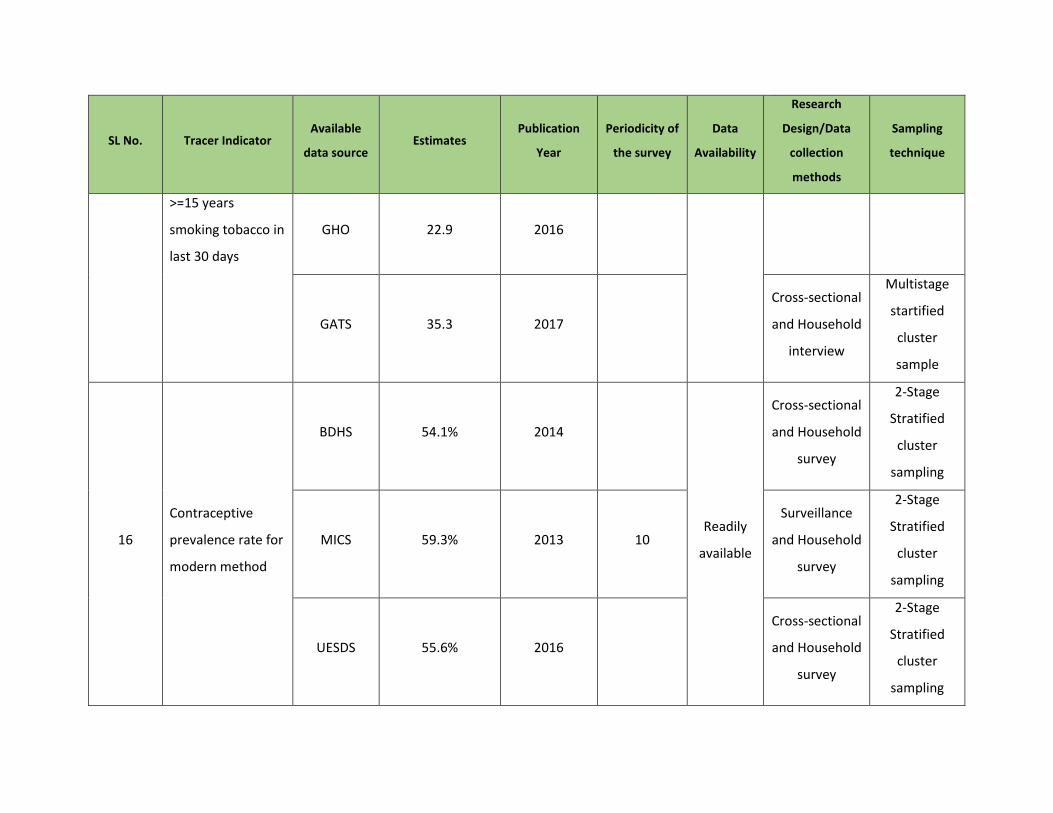
15
Tobacco: Age-
standardized
prevalence of adult
WHO 44.7 2016 Readily
available
SL No. Tracer Indicator Available
data source Estimates
Publication
Year
Periodicity of
the survey
Data
Availability
Research
Design/Data
collection
methods
Sampling
technique
>=15 years
smoking tobacco in
last 30 days
GHO 22.9 2016
GATS 35.3 2017
Cross-sectional
and Household
interview
Multistage
startified
cluster
sample
16
Contraceptive
prevalence rate for
modern method
BDHS 54.1% 2014
Readily
available
Cross-sectional
and Household
survey
2-Stage
Stratified
cluster
sampling
MICS 59.3% 2013 10
Surveillance
and Household
survey
2-Stage
Stratified
cluster
sampling
UESDS 55.6% 2016
Cross-sectional
and Household
survey
2-Stage
Stratified
cluster
sampling

SL No. Tracer Indicator Available
data source Estimates
Publication
Year
Periodicity of
the survey
Data
Availability
Research
Design/Data
collection
methods
Sampling
technique
SVRS 61.6% 2018
World Bank 54.0% 2014
17
Proportion of
births attended by
skilled health
personnel
BDHS 42.10% 2014 3
Readily
available
Cross-sectional
and Household
survey
2-Stage
Stratified
sampling
MICS 43.50% 2013 10
Cross-sectional
and Household
survey
2-Stage
Stratified
cluster
sampling
18
% of HH have using
improved
sanitation
SVRS 78.1% 2018 1
Readily
available
Surveillance
Household
interview
Integrated
Multipurpose
sampling
UESDS 61.4% 2017? (2016) 3
Cross-sectional
and Household
interview
Two-stage
stratified
cluster
sampling

SL No. Tracer Indicator Available
data source Estimates
Publication
Year
Periodicity of
the survey
Data
Availability
Research
Design/Data
collection
methods
Sampling
technique
BDHS 47.8% 2014
MICS 55.9% 2012-2013 3
Cross-sectional
and Household
interview
Two-stage
stratified
cluster
sampling
19
Measles-Rubella
(MR) immunization
coverage among
children under 12
months
BDHS 79.90% 2014 Readily
available
Cross-sectional
and Household
survey
2-Stage
Stratified
sampling
Proportion of
population with
catastrophic
expenditure on
health as a share of
total household
expenditure or
income
HIES 2010 TBE 2011 Not
applicable
Partially
available
Cross-sectional
and Household
interview
Two-stage
stratified
cluster
sampling

SL No. Tracer Indicator Available
data source Estimates
Publication
Year
Periodicity of
the survey
Data
Availability
Research
Design/Data
collection
methods
Sampling
technique
21 Prevalence of HIV
among MARP UNAIDS
Female sex
workers(FSW):
0.2%
Men who have
sex with
men(MWM):0.2%
People who inject
drugs(PWID):
1.1%(2011)
18.1%(2016)
Transgender
people (TG): 1.4%
Prisoners: NA
HIV
Surveillance,
2016 (FSW,
PWID)
Serological
Survey 2015
(unpublished)
(MWM, TG)
National HIV
Serological
Surveillance,
9th Round
Technical
Report,
2011(PWID)
Serological
surveys and
Global AIDS
Monitoring
Serological
survey:
1998-2002:
4 rounds
2003-04:
5th round
2004-07: 6-8
round
2011: 9th
round (last)
HIV
Surveillance:
yeraly
Serological
surveys and
Global AIDS
Monitoring:
1 year
Partially
available
Cross-sectional
Sentinel
Surveillance
and
1. Nationally
representative,
population-
based sample
surveys.
ƒ2. Behavioural
surveillance
surveys.
ƒ3. Specially
designed
surveys and
questionnaires,
including
surveys of
specific
Sentinel site
random
sampling

SL No. Tracer Indicator Available
data source Estimates
Publication
Year
Periodicity of
the survey
Data
Availability
Research
Design/Data
collection
methods
Sampling
technique
2018 (ALL) population
groups (for
example,
specific service
coverage
surveys).
ƒ4. National
HIV estimates
from Spectrum
software
22
Percentage of
hypertensive
patients receiving
treatments (to be
revised)
BDHS 66.04 2011 5 years Partially
available
Cross-sectional
and Household
interview
2-Stage
Stratified
sampling
23
Percentage of
diabetic patients
awrae, treating
and under control
BDHS TBE 2011 5 years Partially
available
Cross-sectional
and Household
interview
2-Stage
Stratified
sampling

SL No. Tracer Indicator Available
data source Estimates
Publication
Year
Periodicity of
the survey
Data
Availability
Research
Design/Data
collection
methods
Sampling
technique
(10-15)
24
Prevalence of
stunting (height for
age <-2 standard
deviation from the
median of the
World Health
Organization
(WHO) Child
Growth Standards)
among children
under 5 years of
age
BDHS 36.1 2014
Readily
available
Cross-sectional
and Household
interview
2-Stage
Stratified
sampling
Food
Security
and
Nutrition
Surveillance
Project
(FSNSP)
35.0 2015
Cross-sectional
and Household
interview
Four-stage
sampling
design
MICS 42.0 2012-2013
Cross-sectional
and Household
interview
2-Stage
Stratified
cluster
sampling

SL No. Tracer Indicator Available
data source Estimates
Publication
Year
Periodicity of
the survey
Data
Availability
Research
Design/Data
collection
methods
Sampling
technique
25 Maternal mortality
ratio
BMMS 196 2016
Readily
available
Cross-sectional
and Household
interview
2-Stage
Stratified
cluster
sampling
SVRS 169 2018 1
Surveillance
and Household
survey
Integrated
Multipurpose
sampling
World Bank 176 2015
26 Neonatal mortality
rate
SVRS 16 2018 1
Readily
available
Surveillance
and Household
survey
Integrated
Multipurpose
sampling
BDHS 28 2014
Cross-sectional
and Household
interview
2-Stage
Stratified
sampling
World Bank 20.1 2016

SL No. Tracer Indicator Available
data source Estimates
Publication
Year
Periodicity of
the survey
Data
Availability
Research
Design/Data
collection
methods
Sampling
technique
27 Total fertility rate
BDHS 2.3 2014
Readily
available
Cross-sectional
and Household
interview
2-Stage
Stratified
sampling
SVRS 2.05 2018 1
Surveillance
and Household
survey
Integrated
Multipurpose
sampling
MICS 2.3 2013 10
Cross-sectional
and Household
interview
2-Stage
Stratified
cluster
sampling
World Bank 2.1 2016
GBD 1.9 2016

Conclusion Bangladesh’s revised UHC monitoring framework adopted the indicators recommended by the global-
level UHC framework and also by country experts. The previously identified gaps have been addressed in
the new framework. This comprehensive set of indicators is expected to help Bangladesh to track its
progress toward achieving UHC.
Recommendations for Monitoring Progress towards UHC
Capacity building of HEU, MOHFW in measurement methods for financial risk protection
Equity analysis should be done for the revised UHC monitoring tools
The Government of Bangladesh (GoB) has established the web portal ‘SDG Tracker’
(www.sdg.gov.bd), aiming to strengthen timely data and enhance achievement and monitoring of
the SDGs. The IRG could feed data regularly to policy maker through the ‘SDG Tracker’ on UHC
progress which help policy maker to take decision.
The IRG could prepare a dashboard of UHC monitoring tools under the USAID supported "Research
for Decision Maker's (RDM) Activity" website
References 1. https://www.who.int/healthsystems/universal_health_coverage/en/
2. The world health report. Health systems financing: the path to universal coverage. Geneva:
World Health Organization; 2010 (http://www.who.int/whr/2010/en/, accessed 20 April 2015).
Annexes Annex 1: Participants List of the workshop on “Review of Universal Health Coverage Monitoring
Framework
Serial Name Designation Organization
1 Dr. Abul Kalam Azad Director General DGHS
2 Dr. Mohd. Shahadt Hossain Mahmud
Director General (Additional Secretary) HEU
3 Dr. Md. Aminul Hasan
Director (Hospital) DGHS
4 Dr. Masud Reza Kabir Line Director, CBHC, DGHS DGHS

5 Dr. Abdus Salam Line Director, CDC, DGHS DGHS
6 Mr. Shukhendu Shekhor Roy System Analyst & DPM, MIS,DGHS DGHS
7 Dr. Md. Khalilur Rahman Deputy Director (Hospital-1) & PM-2, HSM, DGHS
DGHS
8 Dr. Muhshairul Islam Program Manager (PM), MNH, DGHS DGHS
9 Md. Nasmus Sadaf Salim Line Director, MIS, DGFP DGFP
10 Mr. Mehbub Morshed Program Manager (PM), MIS, DGFP DGFP
11 Mr. Golam Faruk Deputy Program Manager (DPM), MIS, DGFP
DGFP
12 Dr. Md. Zainal Haque Program Manager (PM), Maternal, Child, Reproductive and Adolescent Health, DGFP
DGFP
13 Md. Humayun Kabir Program Manager, Planning Unit, DGFP DGFP
14 Dr. Tripti Bala Deputy Director DGFP
15 Md. Jony Hossain ACUITTS MOHFW
16 Dr. Tanveer Ahmed Deputy Director DGHS
17 Professor Dr. Md. Ali Khan DGHS
18 Dr. Md. Shafiqul Islam Assistant Director (Hospital 1), Hospital &
Clinic DGHS
19 Dr. Md. Masud Reza Khan Assistant Director (Hospital 2), Hospital &
Clinic DGHS
20 Dr. Mohammed Eunus Ali Assistant Director (Hospital 2), Hospital &
Clinic DGHS
21 Dr. Dewan Md. Mehedi Hasan Medical Officer (MBPC) DGHS
22 Dr. Emdadul Hoque DGHS
23 Dr. Shaheen Sultana Assistant Director (MBPC) DGHS
24 Dr. Saiful Islam Deputy Director DGHS
25 Mrs. Shahana Sharmin Director (Admin), (DS) HEU

26 Dr. Md. Rafiqul Islam Attachment, HEU (OSD, DGHS) HEU
27 Dr. Mohammad Abul Bashar Sarker
Attachment, HEU (OSD, DGHS) HEU
28 Dr. Subrata Paul
Attachment, BNHA, HEU (OSD, DGHS) HEU
29 Dr. Mohammad Nazmul Haque Attachment, QIS, HEU (OSD, DGHS) HEU
30 Dr. Pranab Kumar Roy Attachment, QIS, HEU (OSD, DGHS) HEU
31 Dr. Mohammad Afzalur Rahman Attachment, QIS, HEU (OSD, DGHS) HEU
32 Dr. Md. Harun Or Rashid
Consultant, QIS, HEU HEU
33 Dr. Md. Hafijul Islam Medical Officer, QIS, HEU HEU
34 Md. Azmal Kaysar National Coordinator HEU
35 Dr. Dilip Kumar Das Director
36 Dr. Laila Akhter Deputy Director HEU
37 Dr. Md. Nurul Amin Deputy Director HEU
38 Fatema Zohara Deputy Director HEU
39 Ms. Shahana Sharmin Director HEU
40 Dr. Nawrin Moni Medical Officer HEU
41 Mr. Aym Ziauddin Director HEU
42 Dr. Md. Anwar Sadat FP-BNHA HEU
43 Mr. Md. Azmal Kabir National Coordinator HEU
44 Dr. Shah Alom Siddiqi Medical officer Hospital
45 Dr. Kanta Jamil Senior Monitoring, Evaluation and
Research Advisor USAID
46 Samina Choudhury Project Management Specialist USAID
47 Dr. Puspita Samina Clinical Services Lead USAID

48 Dr. Shakil Ahmed Sr. Economist (Health) World Bank
49 Tahmina Begum Consultant World Bank
50 Mr. Shayan Ahmed Consultant World Bank
51 Ms. Atia Hossain Consultant World Bank
52 Farzana Akter National Consultant
Planning, Monitoring and Reporting WHO
53 Dr. Md.Touhidul Islam NPO-Health Financing WHO
54 Golam Kibria Measure
Evaluation
55
Dr. Zahedul Quayyum Professor BRAC James P Grant School of Public Health
56 Dr. Ahmed Al-Sabir Independent Health Consultant
57 Dr. Hossain Zillur Rahman Executive Chairman PPRC
58 Dr. Ramiz Uddin Head of Results Management and Data a2i, Prime Minister’s Office
59
Ms. Jinia Alam National Consultant a2i, Prime
Minister’s Office
60 Nazmul Kabir Deputy Director-MIS Save the Children
61 Yukie Yoshimura Expert JICA
62 Zahirul Islam Health Advisor Embassy of Sweden
63 Dr. Mohammad Hussain Marie Stopes
64
Dr. Momena Khan Health Advisor Canadian Field
Survey
65 Md. Alamgir Hossen Deputy Director BBS
66 Dr. Syed Shahadat Hossain Professor ISRT, University of Dhaka
67
Dr. Syed Abdul Hamid Professor IHE, University of
Dhaka

68 Dr. Peter Kim Streatfield Emeritus Scientist HSPSD, icddr,b
69 Dr. Shams El Arifeen Senior Scinetist & Senior Director MCHD, icddr,b
70 Dr. Quamrun Nahar Senior Director (Acting) HSPSD, icddr,b
71 Dr. Mahbub E Elahi Chowdhury Senior Scientist HSPSD, icddr,b
72 Anisuddin Ahmed Assistant Scientist MCHD, icddr,b
73 Md. Moinuddin Haider Research Investigator HSPSD, icddr,b
74 Md. Ashraful Alam Statistician NCSD, icddr,b
75 Ali Ahmed Research Investigator MCHD, icddr,b
76 Aniqa Tasnim Hossain Research Investigator MCHD, icddr,b
77 Fariha Tasnim Senior Statistical Officer MCHD, icddr,b
78 Tania Sultana Tanwi Research Fellow MCHD, icddr,b
79 Dr. Sonia Sultana Research Investigator IDD, icddr,b
Annex 2: Reference Sheet for UHC Indicators:
1. Maternal Mortality Ratio
1. SDG Number: 3.1.1
2. Indicator name: Maternal Mortality Ratio
3. Definition: The annual number of female deaths from any cause related to or aggravated by
pregnancy or its management (excluding accidental or incidental causes) during pregnancy and
childbirth or within 42 days of termination of pregnancy, irrespective of the duration and site of
the pregnancy, expressed per 100,000 live births, for a specifies time period (WHO, 2015). It is
the ratio of maternal deaths to live births over a certain period of time, expressed per 100,000
live births.
4. Associate terms:

a. Maternal death is a death of a woman while pregnant or within 42 days of termination
of pregnancy, irrespective of the duration and the site of the pregnancy, from any cause
related to or aggravated by the pregnancy or its management, but not from accidental
or incidental causes.
b. Live birth refers to complete expulsion or extraction from its mother of a product of
human conception, irrespective of the duration of pregnancy, which, after such
separation, breaths or shows any other evidence of life such as beating of the heart,
pulsation of umbilical cord, or definite movement of voluntary muscles, whether or not
the umbilical cord has been cut or the placenta is attached. Each product of such a birth
is considered live born.
Note: MMR is estimated on the basis of limited exposure time and a small number of events, thus
having large potential sampling errors (95% intervals around each estimate). MMR is different from
MM Rate which is the annual number of maternal deaths occurring among women of reproductive
age (expressed per 100,000 women).
5. Numerator: Number of maternal deaths occurring among ever-married women (ages 15-49
years) within 3-year period preceding the survey X 100,000
6. Denominator: Total number of live births occurring within the same reference period
7. Unit of measure: Deaths per 100,000 live births
8. Data source: The available data sources are Bangladesh Maternal Mortality Survey (BMMS),
Sample Vital Registration System (SVRS) and World Bank.
9. Method of estimation:
a. BMMS: The BMMS used both the sisterhood and the household deaths approaches to
measure maternal mortality and also used both a time of death and a verbal autopsy
approach to identify pregnancy-related or maternal deaths among deaths of women of
reproductive age reported by households. The Household Questionnaire included a
section concerning deaths of usual residents of the household since October 2006. If any
death was reported, further details regarding the name, sex, age at death, and month
and year of death were collected. If the deceased person was a woman age 13-49 at the
time of death, four questions were asked as to whether the woman died while she was
pregnant, giving birth, within 42 days, or after 42 days to one year of the end of the
pregnancy (Figure 3.1a). In addition, a verbal autopsy was conducted subsequently with
household members for all deaths of women age 15 to 49 to try to ascertain whether

the death was maternal. Cause of death was determined from the verbal autopsy by
physician review; two physicians independently reviewed each case, but if they could
not agree, the case was reviewed by a third physician (Figure 3.1b). An expert
committee of obstetricians was also involved to assign a specific cause of maternal
death when the three physicians agreed that the death was maternal but could not
assign a specific cause. The International Classification of Diseases Revision 10 was used
to assign all causes of death.
The Women’s Questionnaire, administered to all ever-married female household
members age 13-49, included a complete sibling history—the name, sex, survival status,
and age (if living) or age at death, and years since death (if dead)—for every live birth
the respondent’s mother had, excluding the respondent herself. Further, for any sisters
who died at age 12 or older, the time of death relative to pregnancy, childbirth, and the
first two months after the end of the pregnancy was also ascertained.
In addition to providing information about maternal mortality, both sets of questions
provide information about overall mortality, at all ages in the case of household deaths
of usual residents and for age 13-49 in the case of data from the sibling history.
b. SVRS: Adopting Integrated Multipurpose Sampling through household survey SVRS
collect information like for births and deaths as and when the events occurred for a
specific year. The local female registrar collects this information. The cause of is self
reported. Considering the annual number of deaths related pregnancy and childbirth (as
per definition) and total number of live births was estimated, and then the MMR was
calculated and expressed as per 100,000 live births.
c. World Bank: Maternal mortality ratio is the number of women who die from pregnancy-
related causes while pregnant or within 42 days of pregnancy termination per 100,000
live births. The data are estimated with a regression model using information on the
proportion of maternal deaths among non-AIDS deaths in women ages 15-49, fertility,
birth attendants, and GDP measured using purchasing power parities (PPPs).
10. Disaggregation: Age, residence (urban/rural), administrative divisions, wealth quintile

11. Comments: The ability to generate country, regional and global estimates with higher precision
and accuracy would be greatly facilitated if country civil registration systems were further
improved. This improvement would reduce the need to conduct special maternal mortality
studies (which are expensive).
12. Further information:
13. Related indicator: Proportion of births attended by skilled health personnel (3.1.2)
2. Total Fertility Rate
1. SDG Number:
2. Indicator name: Total fertility rate
3. Definition: The average number of children a hypothetical cohort of women would have
at the end of their reproductive period if they were subject during their whole lives to
the fertility rates of a given period and if they were not subject to mortality. It is
expressed as children per woman.
4. Associate terms:
5. Numerator:
6. Denominator:
7. Unit of measure:
8. Data source:
9. Method of estimation:
a. BDHS: Cross-sectional and Household interview, 2-Stage Stratified sampling
b. MICS: Cross-sectional and Household interview, 2-Stage Stratified cluster sampling
c. SVRS: Surveillance and Household survey. Integrated Multipurpose sampling
d. World Bank:
e. GBD:
10. Disaggregation:
11. Comments:
12. Further information:

13. Related indicator:
3. Number of currently registered doctors per 10,000 population
1. SDG Number:
2. Indicator name: Number of currently registered doctors per 10,000 population
3. Definition: Number of physicians, including generalists and specialist medical practitioners per
1000 population in the given national and/or subnational area.
4. Associate terms:
5. Numerator:
6. Denominator:
7. Unit of measure: Number of doctors per 10,000 population.
8. Data source:
9. Method of estimation:
a. Health Bulletin
b. HRH country profile
10. Disaggregation:
11. Comments: A small scale survey can be planned to extract information on practicing doctors
from BMDC record
12. Further information: Only registered doctors were considered. Should we consider practicing
doctors
13. Related indicator:

4. Number of currently registered Nurses & Midwives per 10,000 population
1. SDG Number:
2. Indicator name: Number of currently registered Nurses & Midwives per 10,000 population
3. Definition: Number of nursing and midwifery personnel per 1000 population in the given
national and/or subnational area.
4. Associate terms:
5. Numerator:
6. Denominator:
7. Unit of measure:
8. Data source:
9. Method of estimation:
a. Health Bulletin:
b. HRH country profile:
10. Disaggregation:
11. Comments: No gap has been identified yet.
12. Further information:
13. Related indicator:
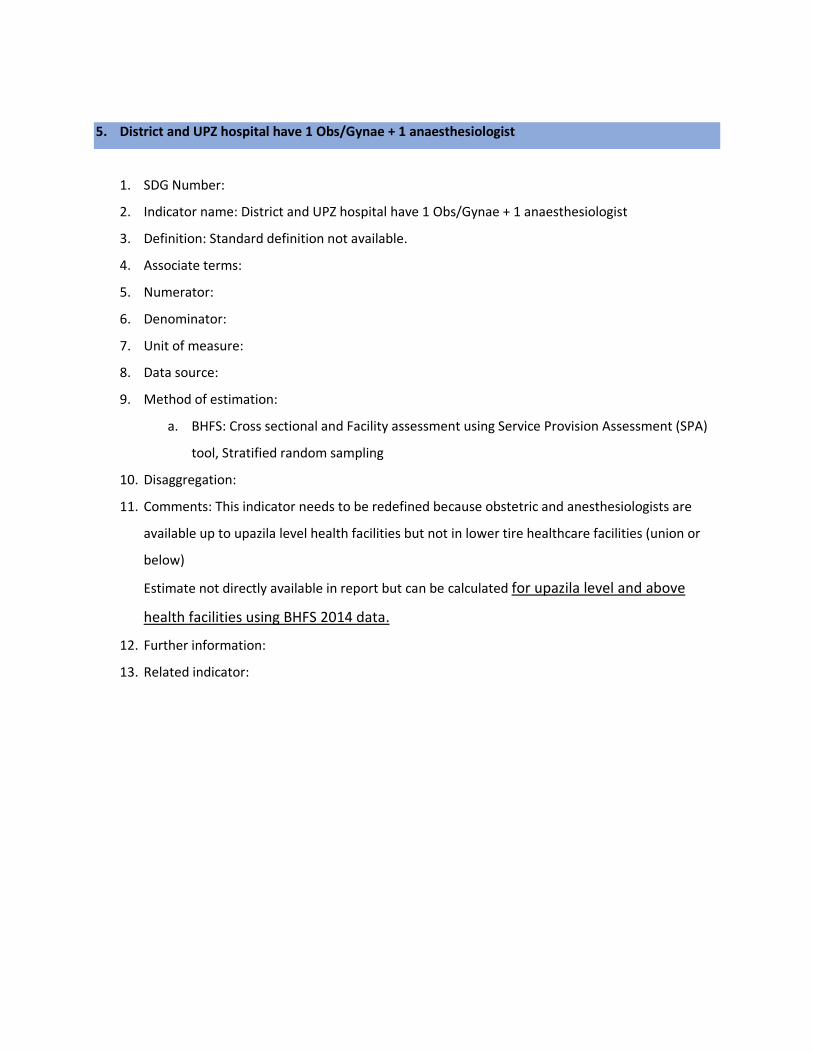
5. District and UPZ hospital have 1 Obs/Gynae + 1 anaesthesiologist
1. SDG Number:
2. Indicator name: District and UPZ hospital have 1 Obs/Gynae + 1 anaesthesiologist
3. Definition: Standard definition not available.
4. Associate terms:
5. Numerator:
6. Denominator:
7. Unit of measure:
8. Data source:
9. Method of estimation:
a. BHFS: Cross sectional and Facility assessment using Service Provision Assessment (SPA)
tool, Stratified random sampling
10. Disaggregation:
11. Comments: This indicator needs to be redefined because obstetric and anesthesiologists are
available up to upazila level health facilities but not in lower tire healthcare facilities (union or
below)
Estimate not directly available in report but can be calculated for upazila level and above
health facilities using BHFS 2014 data.
12. Further information:
13. Related indicator:

6. Number of Hospital beds per 10,000 population
1. SDG Number:
2. Indicator name: Number of Hospital beds per 10,000 population
3. Definition: The number of hospital beds available per every 10,000 inhabitants in a population
(WHO)
4. Associate terms:
5. Numerator:
6. Denominator:
7. Unit of measure:
8. Data source:
9. Method of estimation:
a. Health Bulletin:
b. GHO:
10. Disaggregation:
11. Comments: Can request DGHS to include No. of beds from both public and private health
facilities.
12. Further information: HB 2017 contains information of No. of beds in DGHS-run public hospitals
per 10,000 populations which is 2.89. Private sector hospital bed information was not reported
in 2017.
13. Related indicator:

7. Proportion of public health facilities that have a core set of relevant essential medicines
1. SDG Number:
2. Indicator name: Proportion of public health facilities that have a core set of relevant essential
medicines
3. Definition: The average percentage of medicines outlets, where a selection of essential
medicines is found on the day of the survey (WHO)
4. Associate terms:
5. Numerator:
6. Denominator:
7. Unit of measure:
8. Data source:
9. Method of estimation:
10. Disaggregation:
11. Comments: Need to be estimated from BHFS 2014.
12. Further information: Estimate not directly reported in BHFS 2014
13. Related indicator:

8. Health insurance coverage (to be revised)
1. SDG Number:
2. Indicator name: Health insurance coverage (to be revised)
3. Definition: No standard definition is available.
4. Associate terms:
5. Numerator:
6. Denominator:
7. Unit of measure:
8. Data source:
9. Method of estimation:
a. BNHA:
10. Disaggregation:
11. Comments:
Definition used in matrix is ‘Other Health Insurance expressed as percentage of total
health expenditure’.
Definition of this indicator needs to be specific such as what types of health insurance
will be treated as ‘Other health insurance’
BNHA 1997-2012 has reported overall Voluntary Health Insurance Payment (VHIP) as a
percentage of total health expenditure but did not calculate per capita VHIP as a % of
THE. Need total amount of 'Other Heath insurance' or corresponding raw data to
calculate per capita estimate as percentage of total health expenditure (THE).
The estimate of this indicator might be recalculated by using report of BNHA 1997-2015.
12. Further information: No standard definition is available. No exact estimate is available.
13. Related indicator:

9. Health expenditure as % of GDP
1. SDG Number:
2. Indicator name: Health expenditure as % of GDP
3. Definition: Level of current health expenditure expressed as a percentage of GDP.
4. Associate terms:
5. Numerator:
6. Denominator:
7. Unit of measure:
8. Data source:
Estimate is taken from the report of BNHA 1997-2012.
Estimate is also taken from BNHA 1997-2015 (which has not been published yet)
9. Method of estimation:
a. BNHA:
b. GHO:
10. Disaggregation:
11. Comments: Estimate is readily available
12. Further information:
13. Related indicator:

10. Service readiness for RMNCH-FP
1. SDG Number:
2. Indicator name: Service readiness for RMNCH-FP
3. Definition:
4. Associate terms:
5. Numerator:
6. Denominator:
7. Unit of measure:
8. Data source:
9. Method of estimation:
a. BHFS: Cross sectional and Facility assessment using Service Availability and Readiness
Assessment (SARA) tool, Multi-stage stratified random sampling
10. Disaggregation:
11. Comments:
12. Further information:
13. Related indicator:
11. Share of health spending in total government expenditure
1. SDG Number:
2. Indicator name: Share of health spending in total government expenditure

3. Definition: No standard definition is available.
4. Associate terms:
5. Numerator:
6. Denominator:
7. Unit of measure:
8. Data source:
9. Method of estimation:
a. National Budget FY 2019-20:
10. Disaggregation:
11. Comments:
12. Further information:
Definition used in matrix is ‘Percentage of health spending in total government expenditure’.
This indicator is calculated using total government expenditure as percentage of GDP (2012-2013), total amount of GDP (2012-2013) from National Accounts Statistics of BBS and total health expenditure (2012) from BNHA.
This indicator is also calculated using latest report of BNHA 1997-2015 (which has not been published yet) and National Account Statistics (Provisional Estimates of GDP, 2017-18 and Final Estimates of GDP, 2016-17) of BBS
13. Related indicator:

12. Health expenditure per capita
1. SDG Number:
2. Indicator name: Health expenditure per capita
3. Definition: Per capita current expenditures on health expressed in respective currency
(BDT)
4. Associate terms:
5. Numerator:
6. Denominator:
7. Unit of measure:
8. Data source: BNHA 1997-2012
9. Method of estimation:
a. BNHA:
b. GHO:
10. Disaggregation:
11. Comments:
12. Further information:
13. Related indicator:

13. OOPS for health (per capita as % of THE)
1. SDG Number:
2. Indicator name: OOPS for health (per capita as % of THE)
3. Definition: No standard definition is available.
4. Associate terms:
5. Numerator:
6. Denominator:
7. Unit of measure:
8. Data source: OOPS (2012), amount of total health expenditure (2012) and total population
(2012) from BNHA 1997-2012
9. Method of estimation:
a. BNHA:
10. Disaggregation:
11. Comments:
Definition used in matrix is ‘the indicator estimates how much every person pays out of pocket on average in BDT as percentage of his/her total health expenditure’.
Estimate is calculate by using amount of OOPS (2012), amount of total health expenditure (2012) and total population (2012) from BNHA 1997-2012.
Estimate is also calculated from BNHA 1997-2015 (which has not been published yet)
12. Further information:
13. Related indicator:

14. % of ever married women aged <50 years who received quality ANC care
1. SDG Number:
2. Indicator name: % of ever married women aged <50 years who received quality ANC care
3. Definition:
4. Associate terms:
5. Numerator:
6. Denominator:
7. Unit of measure:
8. Data source:
9. Method of estimation:
a. BDHS:
b. BMMS:
c. UESDS: Cross-sectional and Household survey, 2-Stage Stratified cluster sampling
d. MICS: Cross-sectional and Household survey, 2-Stage Stratified cluster sampling
10. Disaggregation:
11. Comments:
12. Further information:
13. Related indicator:

15. % of service provider positions functionally vacant in district and upzila-level public facilities, by
category (physician, nurse/midwife)
1. SDG Number:
2. Indicator name: % of service provider positions functionally vacant in district and upzila-level
public facilities, by category (physician, nurse/midwife).
3. Definition:
4. Associate terms:
5. Numerator:
6. Denominator:
7. Unit of measure:
8. Data source:
9. Method of estimation:
a. BHFS:
10. Disaggregation:
11. Comments:
12. Further information:
13. Related indicator:

16. Percentage of incident TB cases that are detected (Tuberculosis incidence per 100,000 population)
1. SDG Number:
2. Indicator name: Percentage of incident TB cases that are detected (Tubercolosis incidence per
100,000 population)
3. Definition:
4. Associate terms:
5. Numerator:
6. Denominator:
7. Unit of measure:
8. Data source:
9. Method of estimation:
a. NTP:
b. GTBR
10. Disaggregation:
11. Comments:
12. Further information:
13. Related indicator:

17. Tobacco: Age-standardized prevalence of adult >=15 years smoking tobacco in last 30 days
1. SDG Number:
2. Indicator name: Tobacco: Age-standardized prevalence of adult >=15 years smoking tobacco in
last 30 days
3. Definition:
4. Associate terms:
5. Numerator:
6. Denominator:
7. Unit of measure:
8. Data source:
9. Method of estimation:
a. WHO:
b. GHO:
c. GATS:
10. Disaggregation:
11. Comments:
This indicator is extracted from SDG. So, standard definition is available. To some extent
it is complementary of NCD05 and similar to NCD07 only for not user.
Definition and estimates are available from Global Adult Tobacco Survey (GATS). We can
keep this indicator though it partially reported the NCD07.
12. Further information:
13. Related indicator:

18. Contraceptive prevalence rate for modern method
1. SDG Number:
2. Indicator name: Contraceptive prevalence rate for modern method
3. Definition: The percentage of women aged 15–49 years, married or in-union, who are
currently using, or whose sexual partner is using, at least one modern method of
contraception. Modern methods of contraception include: female and male
sterilization, oral hormonal pills, the intra-uterine device (IUD), the male condom,
injectables, the implant (including Norplant), vaginal barrier methods, the female
condom and emergency contraception
4. Associate terms:
5. Numerator:
6. Denominator:
7. Unit of measure:
8. Data source:
9. Method of estimation:
a. BDHS:
b. MICS:
c. SVRS:
d. UESDS:
e. World Bank:
10. Disaggregation:
11. Comments: In Bangladesh context, we should not consider “in-union” couple as the proportion
is very small. Hence, BDHS did not consider them in their estimate.
12. Further information:
13. Related indicator:

19. Proportion of births attended by skilled health personnel
1. SDG Number:
2. Indicator name: Proportion of births attended by skilled health personnel
3. Definition: The proportion of births attended by skilled health personnel. The proportion of
births attended by skilled health personnel (doctors, nurses or midwives) trained in providing
lifesaving obstetric care, including giving the necessary supervision, care and advice to women
during pregnancy, childbirth and the post-partum period; to conduct deliveries on their own;
and to care for newborns among the total number of live births in the same period.
4. Associate terms:
5. Numerator:
6. Denominator:
7. Unit of measure:
8. Data source:
9. Method of estimation:
a. BDHS:
b. MICS:
10. Disaggregation:
11. Comments:
Source tracer indicator means "Medically Trained Provider" instead of "Skilled health
personnel". Source definition doesn't match with Meta Data definition. Global estimate

only represents "Doctor, nurse and midwives". In Bangladesh, medically trained
provider includes doctor, nurse, midwife, paramedic, FWV, and CSBA.
WB uses the same estimate to report on their website (source: UNICEF, State of the
World's Children, Childinfo, and Demographic
12. Further information:
13. Related indicator:
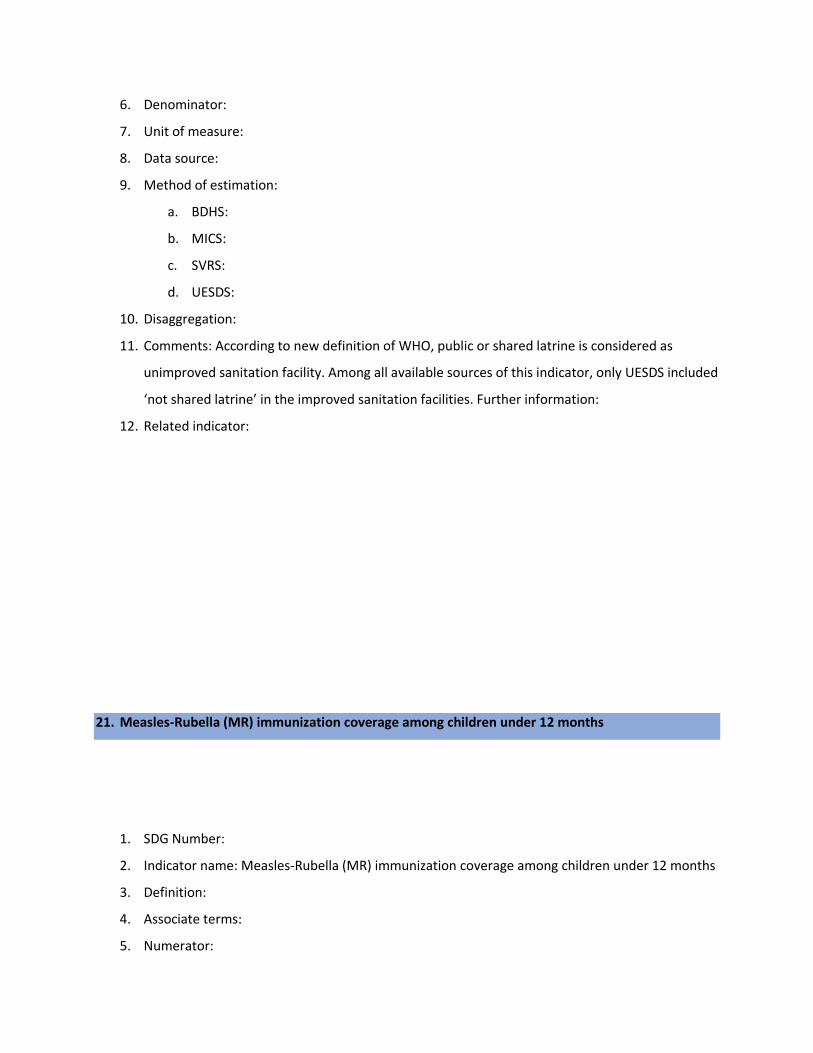
20. % of HH have using improved sanitation
1. SDG Number:
2. Indicator name: % of HH have using improved sanitation
3. Definition: The Proportion of population using safely managed sanitation services, including a
hand-washing facility with soap and water is currently being measured by the proportion of the
population using a basic sanitation facility which is not shared with other households and where
excreta is safely disposed in situ or treated off-site.
‘Improved’ sanitation facilities include: flush or pour flush toilets to sewer systems, septic tanks
or pit latrines, ventilated improved pit latrines, pit latrines with a slab, and composting toilets.
Population with a basic handwashing facility: a device to contain, transport or regulate the flow
of water to facilitate handwashing with soap and water in the household
4. Associate terms:
5. Numerator:
6. Denominator:
7. Unit of measure:
8. Data source:
9. Method of estimation:
a. BDHS:
b. MICS:
c. SVRS:
d. UESDS:
10. Disaggregation:
11. Comments: According to new definition of WHO, public or shared latrine is considered as
unimproved sanitation facility. Among all available sources of this indicator, only UESDS included
‘not shared latrine’ in the improved sanitation facilities. Further information:
12. Related indicator:
21. Measles-Rubella (MR) immunization coverage among children under 12 months
1. SDG Number:
2. Indicator name: Measles-Rubella (MR) immunization coverage among children under 12 months
3. Definition:
4. Associate terms:
5. Numerator:

6. Denominator:
7. Unit of measure:
8. Data source:
9. Method of estimation:
a. BDHS:
b. MICS:
c. SVRS:
d. UESDS:
10. Disaggregation:
11. Comments:
12. Further information:
13. Related indicator:
22. Proportion of population with catastrophic expenditure on health as a share of total household
expenditure or income
1. SDG Number:
2. Indicator name: Proportion of population with catastrophic expenditure on health as a share of
total household expenditure or income
3. Definition: Proportion of the population with catastrophic household expenditure on health as a
share of total household expenditure or income. Two thresholds are used to define

“catastrophic household expenditure on health”: greater than 10% and greater than 25% of
total household expenditure or income.
4. Associate terms:
5. Numerator:
6. Denominator:
7. Unit of measure:
8. Data source:
9. Method of estimation:
a. HIES:
10. Disaggregation:
11. Comments:
No exact estimate is available
This indicator can be estimated from HIES data. To estimate this indicator, need to
calculate catastrophic health spending and therefore, need OOPS of respective
household. But estimation procedure of OOPS in HIES report has not been disclosed.
The amount of OOPS is measured for per patient whereas consumption expenditure is
measured for per household in HIES. Key person corresponded with HIES might be
approached in this regard. Two thresholds are used to define “large household
expenditure on health” in SDG metadata: greater than 10% and greater than 25% of
total household expenditure or income. Which threshold level should be adopted in our
country context need to be fixed.
12. Further information:
13. Related indicator:
23. Prevalence of HIV among MARP

1. SDG Number:
2. Indicator name: Prevalence of HIV among MARP
3. Definition: Percentage of specific key populations living with HIV (standard definition not
available
4. Associate terms:
5. Numerator:
6. Denominator:
7. Unit of measure:
8. Data source:
9. Method of estimation:
a. HIV Surveillance, 2016 (FSW, PWID), Serological Survey 2015 (unpublished) (MWM, TG)
National HIV Serological, Surveillance, 9th Round Technical, Report, 2011(PWID)
Serological surveys and Global AIDS Monitoring 2018 (ALL)
b. UNAIDS: Serological survey: 1998-2002: 4 rounds, 2003-04: 5th round, 2004-07: 6-8
round, 2011: 9th round (last), HIV Surveillance: yearly Serological surveys and Global
AIDS Monitoring: 1 year.
a. Cross-sectional Sentinel Surveillance and 1. Nationally representative, population-based
sample surveys. ƒ2. Behavioural surveillance surveys. ƒ3. Specially designed surveys and
questionnaires, including surveys of specific population groups (for example, specific
service coverage surveys). ƒ4. National HIV estimates from Spectrum software
10. Disaggregation:
11. Comments:
Published report available only for 2011 serological survey. Last Serological
survey was done in 2015 but no published report /data available.
Required expert opinion whether the estimate needs to be a pooled estimate for MARP or kept segregated sub-indicator wise.
Standard definition is not available. Estimates are not available for prisoners
12. Further information:
13. Related indicator:

24. Percentage of hypertensive patients receiving treatments (to be revised)
1. SDG Number:
2. Indicator name: Percentage of hypertensive patients receiving treatments (to be revised)
3. Definition: A person who reported that he/she was currently taking antihypertensive medication
to lower blood pressure was considered to be under treatment for hypertension.
4. Associate terms:
5. Numerator:
6. Denominator:
7. Unit of measure:
8. Data source:
9. Method of estimation:
a. BDHS:
10. Disaggregation:
11. Comments:
This indicator extracted from country monitoring framework (CMF), so no standard
definition is available.
BDHS is the only source, where data was collected for 35 years and older.
Partially available
Definition for the indicator can be defined as; number of patients taking medication to
lower the hyperextension (numerator) divided by the number of respondents told they
have high blood pressure by a doctor or nurse (denominator).
12. Further information:
13. Related indicator:

25. Percentage of diabetic patients aware, treating and under control
1. SDG Number:
2. Indicator name: Percentage of diabetic patients aware, treating and under control
3. Definition: A person who reported that he/she was taking medication to keep blood sugar under
control was considered to be under treatment for diabetes.
4. Associate terms:
5. Numerator:
6. Denominator:
7. Unit of measure:
8. Data source:
9. Method of estimation:
a. BDHS:
10. Disaggregation:
11. Comments:
Definition for the indicator can be defined as; number of patients taking medication to
control diabetes (numerator) divided by the number of respondents told they have
diabetes by a doctor or nurse (denominator).
This indicator extracted from country monitoring framework (CMF), so no standard
definition is available.
BDHS is the only source, where data was collected for 35 years and older.
12. Further information:
13. Related indicator:

26. Prevalence of stunting (height for age <-2 standard deviation from the median of the World
Health Organization (WHO) Child Growth Standards) among children under 5 years of age
1. SDG Number:
2. Indicator name: Prevalence of stunting (height for age <-2 standard deviation from the median
of the World Health Organization (WHO) Child Growth Standards) among children under 5
years of age
3. Definition: Prevalence of stunting (height-for-age <-2 standard deviation from the median of the
World Health Organization (WHO) Child Growth Standards) among children under 5 years of age
4. Associate terms:
5. Numerator:
6. Denominator:
7. Unit of measure:
8. Data source:
9. Method of estimation:
a. BDHS:
b. MICS:
c. Food Security and Nutrition Surveillance Project (FSNSP): Cross-sectional and Household
interview. Four-stage sampling design
10. Disaggregation:
11. Comments: • No gap has been identified to track this indicator. Estimate is also readily
available.
12. Further information:
13. Related indicator:

27. Neonatal mortality rate
1. SDG Number:
2. Indicator name: Neonatal mortality rate
3. Definition: Probability (expressed as a rate per 1000 live births) of a child born in a specific year
or period dying in the first 30 days of life, if subject to age-specific mortality rates of that period.
4. Associate terms:
5. Numerator:
6. Denominator:
7. Unit of measure:
8. Data source:
9. Method of estimation:
a. BDHS:
b. SVRS:
c. World Bank:
10. Disaggregation:
11. Comments:
The estimate is readily available in three different sources.
The estimates have large difference in different year’s estimates. While SVRS is
suggesting the neonatal mortality rate 17 in 2017, BDHS is providing the estimate 28 in
2014.
12. Further information:
13. Related indicator: