rimrock business plan draft redacted - - get a free
TRANSCRIPT

Rimrock Stages
2011 Draft Business PlanJune 27, 2011
5044 Midland Road
PO Box 988
Billings, MT 59103‐0988
406‐245‐5392 (p) 406‐245‐7696 (f)
www.rimrocktrailways.com

Photo: KFreon. “Busiest Time of the Day at Butte.” 11 June 2010. Online image. Flickr. 15 Jan 2011.
http://www.flickr.com/photos/kfreon/4695532552/in/set‐72157612390064794/. Edited by Lisa Ballard.

Acknowledgements i
Acknowledgements
This plan was developed by a team led by Current Transportation Solutions, Bozeman, Montana,
as part of a project funded in part by the Montana Transportation Department Transit Section.
Project participants and their roles are listed below.
Lisa Ballard, P.E., Kimberly Brown, and Ted Lange, Current Transportation Solutions,
Bozeman, MT – project management, technical analysis, documentation, and overall
project implementation.
Barb Beck, Beck Consulting, Red Lodge, MT – public outreach.
Aaron Antrim, Trillium Solutions, Portland, OR – technology assessment and technical
writing.
Karen Capuano, The Open Book‐keeper, Bozeman, MT – business planning, financial
planning.
Stephanie Millar, Lawson‐Millar, Portland, OR – compilation of survey results
Steve Earle, The Bus Man, Missoula, MT – input on operations and maintenance

ii Rimrock Stages Business Plan ‐ DRAFT
Table of Contents
Acknowledgements .................................................................................................................. i
Table of Contents ..................................................................................................................... ii
Table and Figures .................................................................................................................... iv
1 Company Profile ............................................................................................................. 1‐1
1.1 Operational Entity ..................................................................................................... 1‐1
1.2 Organizational History .............................................................................................. 1‐1
1.3 Purpose ..................................................................................................................... 1‐2
2 Company Mission, Vision, and Goals .............................................................................. 2‐1
2.1 Summary of Goals ..................................................................................................... 2‐1
2.2 Goal 1‐ Increase Ridership ........................................................................................ 2‐2
Objective 1.a. Improve knowledge of existing services ....................................................... 2‐2
Objective 1.b. Increase Ridership by College Students ........................................................ 2‐3
Objective 1.c. Increase Ridership by People with Disabilities .............................................. 2‐3
Objective 1.d. Improve coordination with other operators ................................................. 2‐4
Objective 1.e. Improve customer service ............................................................................. 2‐4
2.3 Goal 2 ‐ Improved Management ............................................................................... 2‐4
Objective 2.a. Improve Maintenance Shop Performance .................................................... 2‐4
Objective 2.b. Provide needed staff, tools, and training ...................................................... 2‐5
Objective 2.c. Attract and retain high quality staff .............................................................. 2‐5
Objective 2.d. Anticipate trends and act in advance ............................................................ 2‐5
2.4 Goal 3 ‐ Expand and Optimize Service Options for Montanans ............................... 2‐5
Objective 3.a. Optimizing Scheduling of Current Routes ..................................................... 2‐6
Objective 3.b. Consider expanded service when comfortable with current operations ..... 2‐6
2.5 Implementation Plan ................................................................................................ 2‐6
Year One Summary ............................................................................................................... 2‐6
Goal 1 – Increase Ridership .................................................................................................. 2‐8
Goal 2 – Improve Management Systems and Culture ........................................................ 2‐10
Goal 3 – Create New and Expanded Service Options ......................................................... 2‐11

Table of Contents iii
3 Definition of the Market ................................................................................................. 3‐1
3.1 Residents ................................................................................................................... 3‐1
3.2 College Students ....................................................................................................... 3‐2
3.3 Visitors ...................................................................................................................... 3‐2
3.4 Customers ................................................................................................................. 3‐2
Charter .................................................................................................................................. 3‐2
Shop ...................................................................................................................................... 3‐3
Intercity ................................................................................................................................ 3‐3
3.5 Competition .............................................................................................................. 3‐4
4 Description of Services ................................................................................................... 4‐1
4.1 Routes ....................................................................................................................... 4‐1
4.2 Level and Use of Service ........................................................................................... 4‐5
4.3 Stations and Ticket Agents ........................................................................................ 4‐5
4.4 Other Organizations .................................................................................................. 4‐6
4.5 Transportation Advisory Committee (TAC) Meetings............................................... 4‐7
4.6 Coordination ............................................................................................................. 4‐8
5 Organization and Management ...................................................................................... 5‐1
5.1 Control Processes...................................................................................................... 5‐3
5.2 Regulatory Environment ........................................................................................... 5‐5
6 Marketing and Sales ....................................................................................................... 6‐1
6.1 Positioning Strategy .................................................................................................. 6‐1
6.2 Sales Process ............................................................................................................. 6‐2
6.3 A Marketing Framework for Goal Setting ................................................................. 6‐2
6.4 Marketing Budget as Percent of Sales ...................................................................... 6‐3
6.5 Initial Marketing Strategies ....................................................................................... 6‐3
7 Financial Management ................................................................................................... 7‐1
7.1 Annual Income Target ............................................................................................... 7‐1
7.2 Income and Balance Statements .............................................................................. 7‐3
7.3 Budget Assumptions ................................................................................................. 7‐6
Revenue ................................................................................................................................ 7‐6
Costs ..................................................................................................................................... 7‐6
7.4 Sensitivity Analysis .................................................................................................... 7‐7
7.5 Cost Allocation Model ............................................................................................... 7‐7
7.6 Implications of Greyhound Service Termination ...................................................... 7‐9
7.7 Financial Projections for Implementation Plan Alternatives .................................. 7‐15
Appendix A: Methodology for Cost Model ............................................................................ A‐1

iv Rimrock Stages Business Plan ‐ DRAFT
Table and Figures
Table 3‐1: Montana’s Largest Colleges ......................................................................................... 3‐2
Table 4‐1: Summary of Routes (with new services) ..................................................................... 4‐2
Table 4‐2: Rimrock Schedule of Services as of June 21, 2011 ...................................................... 4‐4
Table 4‐3: Depots in Large Montana Communities ...................................................................... 4‐6
Table 5‐1: Board of Directors ....................................................................................................... 5‐1
Table 5‐2: Employees by MDT‐Defined Categories ...................................................................... 5‐1
Table 5‐3: Rimrock Wage Scale .................................................................................................... 5‐1
Table 5‐4: Rimrock Vehicle Inventory .......................................................................................... 5‐4
Table 7‐1: Income Statement (with Expanded Services)Table 7‐2: Balance Sheet (with Expanded
Services) ........................................................................................................................................ 7‐4
Table 7‐3: Revenue per Mile Summary ........................................................................................ 7‐6
Table 7‐4: Increases in Facility Costs by Location ......................................................................... 7‐7
Table 7‐5: Comparison of Cost and Revenue Under Differing Assumptions ................................ 7‐7
Table 7‐6: Cost Models Based on Rimrock Financial Reports (Rimrock FY 2010) ........................ 7‐8
Table 7‐7: Cost Model with New Services .................................................................................... 7‐8
Table 7‐8: Annual Service Hours and Miles by Route (status quo) ............................................ 7‐10
Table 7‐9: Annual Service Hours and Miles by Route (expanded service) ................................. 7‐11
Table 7‐10: Cost and Revenue by Route (Status Quo) ............................................................... 7‐12
Table 7‐11: Cost and Revenue by Route (New services) ............................................................ 7‐13
Table 7‐12: Target Passenger Revenue per Mile for Expanded Services ................................... 7‐14
Figure 4‐1: New Rimrock routes as of June 21, 2011 ................................................................... 4‐3
Figure 5‐1: Rimrock organization chart ........................................................................................ 5‐2
Figure 7‐1: Historical and projected company net worth (status quo). ....................................... 7‐2
Figure 7‐2: Historical and projected company net worth (with expanded services). .................. 7‐2
Figure 7‐3: Annual profit margin (status quo) .............................................................................. 7‐3
Figure 7‐4: Annual profit margin (with expanded services) ......................................................... 7‐3

Company Profile 1‐1
1 Company Profile
1.1 Operational Entity
Rimrock Stages, Inc. is a family owned for‐profit corporation located in Billings, Montana that
operates intercity scheduled routes in Montana and North Dakota and provides chartered
contracts for bus services throughout the United States and Canada. The company operates a
bus repair shop located in Billings, Montana.
Rimrock is currently owned and operated by Thorm Forseth, President and CEO and Eric
Forseth, vice President and COO. Eide Bailley, LLP serves as the Certified Public Accountant.
Legal Representation is provided by William O’Connor of O’Connor & O’Connor. The company
operates on a fiscal year that starts October 1. Rimrock’s Tax ID number is 810345421.
Rimrock is a member of Trailways, an association of independent motorcoach companies
providing public scheduled route, charter and tour transportation services in the United States
and Canada. Rimrock is also a member of the American Bus Association and the Montana
Transit Association.
Rimrock Stage’s intercity operations are partially subsidized by funding available through the
Federal Transit Administrations 5311(f) Rural Intercity program. Montana Department of
Transportation, Transit Section administers this program in Montana. In the past Rimrock has
received funding for vehicles from North Dakota Department of Transportation.
1.2 Organizational History
Rimrock Stages, Inc. was founded in July 1972 by
Thorm Forseth utilizing one new Dodge van
operating a route between Billings and Helena.
Routes have changed over the years as the
company adapted to significant upheaval in the
bus industry. Rimrock Stages joined the
Trailways system in 1993 to strengthen its
identity within a nationally recognized brand.
Expansion into Eastern Montana and North
Dakota occurred in 2004 when Greyhound lines
stopped service for that route.
On June 21, 2011 Rimrock expanded Montana
services when Greyhound discontinued its
routes between Missoula and Billings.

1‐2 Rimrock Stages Business Plan ‐ DRAFT
1.3 Purpose
The purpose of this business plan is to create a document that will guide the direction of
Rimrock Stages, identify short and long‐term goals, and provide a context for business decisions
to be measured.
This project is funded in part through the Montana Department of Transportation. As such,
efforts and analysis are focused on Rimrock’s intercity operations in Montana.
Rimrock executive and operations management will review and update this plan at least once
per year to adapt to changing business and market conditions, to maintain stability within the
company, and to focus on leading Rimrock in the right direction.
The financial manager will use this plan and the goals established within to evaluate fiscal
reports, set budgets, and prioritize expenditures under the guidance of management.
Finally, this document will support Rimrock requests for operating assistance from Montana and
North Dakota Departments of Transportation, as well as funding from lenders.
The importance of regularly updating this plan is illustrated by the significant change in
Montana’s intercity bus service that occurred as this plan was nearing completion. Greyhound’s
May 2011 decision to drop its Billings to Missoula routes resulted in extensive revisions to the
working draft for this plan, and the business planning process helped guide Rimrock in its
decision to expand its services to fill the gap left by Greyhound. This business plan now fully
incorporates the financial, management and marketing implications of this expansion of
Rimrock’s intercity service. However, the projections contained in this plan will need to be
updated as implementation of this expansion provides new data and new issues and
opportunities inevitably arise as a result of this significant change.

Company Mission, Vision, and Goals 2‐1
2 Company Mission, Vision, and Goals
As part of the 2011‐2016 Transportation Development Plan, Rimrock refined its mission
statement and also developed a vision statement for future business success.
Mission Statement:
Rimrock Stages provides quality, environmentally conscious transportation at a reasonable
cost. We are passionate about customer service, safety and comfort. Rimrock will remain
the largest carrier in Montana and North Dakota, covering the most area.
Vision Statement:
In 2016, Rimrock is a profitable business enterprise because people who have a need for
intercity bus transportation in Montana and North Dakota know about Rimrock’s services
and choose to ride on Rimrock when it is an option that meets their needs.
Rimrock Stages owners envision that in ten years Rimrock has systems in place which allow the
business to be run efficiently. All equipment is up to date, the operation is staffed and run by
quality employees, and the business is well on its way toward achieving financial stability.
Furthermore, the expansion of services and improved profitability allow Rimrock Stages to
relocate operations to company owned property and buildings.
2.1 Summary of Goals
In support of the mission and vision, Rimrock has identified three major areas of focus:
1. Increase Ridership ‐ More people want and choose to use Rimrock’s intercity bus
service. Improved customer service makes Rimrock Stages a safer and more enjoyable
experience, earning repeat customers.
2. Improve Management ‐ Rimrock is running more smoothly and efficiently, enabling the
business to operate more profitably and to respond to market changes. The company is
able to attract and maintain high‐quality staff and has created an operation in which
roles and expectations are clearly defined. Staff is invested in their jobs because they
have opportunities for advancement.
3. Expand and Optimize Service Options for Montanans ‐ Montanans use Rimrock to
travel within Montana, and to nearby places, and are able to make day trips using the
state’s intercity bus network and its connections to rail service. Rimrock has strategically
expanded service options while maintaining or improving profitability.

2‐2 Rimrock Stages Business Plan ‐ DRAFT
This business plan includes a condensed version of materials presented more thoroughly in the
Transportation Development Plan that accompanies this business plan. That document presents
alternatives encompassing marketing initiatives, changes to existing routes, implementation of
new routes, and coordination activities that will help Rimrock be a more efficient business.
2.2 Goal 1‐ Increase Ridership
More people want and choose to use Rimrock’s intercity bus service. Improved customer
service makes Rimrock Stages a safer and more enjoyable experience, earning repeat
customers.
Increasing ridership is central to achieving profitability, and to providing the best possible
service to benefit Montana residents, visitors and benefiting the economies of Montana
communities. A number of strategies offer potential for increasing ridership. These include
improving public awareness of existing services, increasing ridership by specific demographics,
improved coordination, and improving customer service. Marketing should be targeted toward
populations with the greatest potential for increased ridership. These populations of potential
customers include young adults, seniors, people with low incomes, people with disabilities,
college students, and tourists.
Objective 1.a. Improve knowledge of existing services
Lack of awareness of Rimrock Stages services is a barrier to increasing ridership. The consultant
team conducted a review of current service information materials including printed information,
and online information at www.rimrocktrailways.com.
As revealed through the public workshops process, Rimrock Trailways’ present brand
recognition is low. Lack of awareness of Rimrock’s services is a significant barrier to increasing
ridership. Before potential customers are able to even consider Rimrock Trailways, they need to
be aware of its existence as a travel option.
The TDP presents recommendations to enhance the Rimrock Trailways brand and improve its
recognition in the travel marketplace. These include engaging a marketing and branding firm to
redesign the Rimrock Trailways logo and associated branded image. Following the development
of this foundation, awareness of the Rimrock Trailways brand and service would be developed
through the development of partnerships with universities, local transit agencies, and other key
strategic partners. Awareness would also be increased with eye‐catching bus wraps, an email
list, traditional marketing, and other tactics.
Most customers appear to be satisfied with the schedule information that is currently
available.68% of customers were “satisfied” or “very satisfied” with the ease of understanding

Company Mission, Vision, and Goals 2‐3
the schedule. However, the consultant team believes opportunity for improving this
fundamentally important customer information remains.
On‐board and online survey asked customers what information they wished to see presented on
the website.81% of online respondents reported they would like to see schedules included on
the website.70% of online respondents reported they would like to see route maps included on
the website.
Suggested Performance Measures ‐ Improved customer survey responses regarding ease of use
of schedules, increased traffic to website, and increased online ticket sales.
Objective 1.b. Increase Ridership by College Students
College students, especially in Missoula and Bozeman, are one of the Montana populations
offering the greatest market potential for Rimrock Stages. Several examples offer instructive
strategies for accessing this market.
Developing strong cooperative relationships with key individuals within University
administrations and staff will be essential for Rimrock Stage’s success in targeting student
populations. The potential of marketing to college students is demonstrated by Salt Lake
Express, which runs a profit‐making service between Rexburg and Salt Lake City. This success is
supported by Salt Lake Express’s excellent relationship with Brigham Young University‐Idaho.
Student populations at the University of Montana and Montana State University are a key
customer base for many local businesses. Recognizing this, many local advertising firms have
developed expertise and experience at targeting students in communities like Missoula and
Bozeman. These alternatives focus on students from MSU and U of M but if successful should
be expanded to include students at other campuses.
Suggested Performance Measures ‐ Loadings and debarkings in Missoula and Bozeman increase
25% by June 2012.
Objective 1.c. Increase Ridership by People with Disabilities
People with disabilities are one of the populations with the greatest potential to increase
ridership on Rimrock’s intercity buses, however results from our public workshops indicated
there is minimal awareness that many of Rimrock’s coaches are equipped with lifts for
wheelchairs.
Suggested Performance Measures ‐ Ridership by people with disabilities increase by 10%.
2‐4 Rimrock Stages Business Plan ‐ DRAFT
Objective 1.d. Improve coordination with other operators
Coordination with other operators offers significant opportunities to increase ridership through
cooperative marketing simply by ensuring that customers are provided with good information
and the most seamless and efficient service possible.
Suggested Performance Measures – Overall ridership is increased 10% by June 2012. Net
operating deficit for each route improves 10% by June 2012.
Objective 1.e. Improve customer service
Customer service covers many aspects of Rimrock’s operations and offers obvious opportunities
for increasing ridership by improving the company’s reputation and customers’ willingness to
recommend Rimrock to others. Moreover, good customer service is essential to overcoming the
generally negative perception of bus travel among most populations that meet the criteria of
“choice riders”.
Overall, results from our passenger surveys and public workshops indicated that Rimrock
customers are fairly satisfied. Seventy‐two percent of on‐board respondents said they were
likely or very likely to recommend Rimrock to their friends. However, there are a number of
areas where responses clearly showed opportunities for improvement.
Suggested Performance Measures – Improved customer satisfaction scores on surveys and
positive comments from focus group participants.
2.3 Goal 2 ‐ Improved Management
Rimrock is running more smoothly and efficiently, enabling the business to operate more
profitably and to respond to market changes. The company is able to attract and maintain
high‐quality staff and has created an operation in which roles and expectations are clearly
defined. Staff is invested in their jobs because they have opportunities for advancement.
Objective 2.a. Improve Maintenance Shop Performance
When this project started, overtime pay for shop staff was excessive, the shop was sending vehicles to outside shops for some maintenance items that could have been completed in house, and staff was not using the maintenance management database owned by Rimrock. When breakdowns occurred on the road the Vice President held responsibility for finding a replacement bus and recovering the vehicle. Improving performance will save money and time. Performance Measures ‐ Improved shop manager accountability reduces number of hours the
Vice President spends responding to maintenance breakdowns. Overtime and outside shop
expenditures are reduced. Maintenance expenditures align with industry standards.
Company Mission, Vision, and Goals 2‐5
Objective 2.b. Provide needed staff, tools, and training
During the development of this TDP, one theme continued to occur. While Rimrock does have
systems in place to track ridership and important business metrics, those systems are not
typically compatible so information cannot be analyzed in an efficient or effective manner.
Implementing upgraded software will reduce duplication and make evaluating changes to the
business more straightforward.
Performance Measures – Reduced data entry time among management team, and improved job
satisfaction from President and Vice President.
Objective 2.c. Attract and retain high quality staff
There is an overall concern at present with employee retention and forecasted retirements in
the organization. Rimrock should put a plan in place that will attract new employees who are
well trained in anticipation of future needs.
Performance measures ‐ Improved qualifications among applicant pool and improved employee
satisfaction.
Objective 2.d. Anticipate trends and act in advance
The management team should convene at least semi‐annually to discuss trends observed that
could affect profitability and develop a strategy to address in advance. We recommend these
meetings be held in January/February and July/August to coincide with funding application due
dates and fiscal year end.
Performance Measures ‐ Increased accuracy in budget and ridership estimates
2.4 Goal 3 ‐ Expand and Optimize Service Options for Montanans
Montanans use Rimrock to travel within Montana, and to nearby places, and are able to
make day trips using the state’s intercity bus and rail network. Rimrock has strategically
expanded service options while maintaining or improving profitability.
Our needs assessment shows that Rimrock’s service plays an important role in access to services
and economic opportunities within Montana’s borders and in our region, carrying many people
who begin or end their trips in Montana and North Dakota. However, service is limited for
Montana residents, especially for riders seeking to make day trips between Montana’s seven
largest cities. While Rimrock’s routes provide service to these seven cities as well as the two
largest cities in North Dakota, services are limited to the major corridors of I‐90, I‐94, I‐15, and
US 93, and the frequency and/or timing of service is not adequate for many to make trips on

2‐6 Rimrock Stages Business Plan ‐ DRAFT
these routes. Furthermore, there is no direct service to the state capital in Helena from
Missoula, Billings, or Bozeman.
Objective 3.a. Optimizing Scheduling of Current Routes
Several of Rimrock’s current routes have schedules that make it difficult for riders to make
reasonable day trips or connections. Optimizing these schedules will likely increase ridership.
The timeliness of connections with other intercity bus routes was noted as “very important” by
46% of on board respondents and “important” by an additional 20%. Only 32% were “very
satisfied” and 26% “satisfied” with those connections.
Objective 3.b. Consider expanded service when comfortable with current operations
If Rimrock meets ridership projections and/or Rimrock receives additional funding from the
federal 5311(f) program, Rimrock can expand services to better meet the needs of Montanans.
2.5 Implementation Plan
The following tables summarize the alternatives presented in the TDP. Dates reflect the target
for systems to be in place. Implementation dates are staggered to accommodate a reasonable
workload for the Rimrock staff.
Year One Summary
Through Fiscal Year 2011 (October 1, 2010‐September 30, 2011) the following tasks should be
initiated. These tasks have been identified by riders, stakeholders, and the Current
Transportation team as those deserving immediate attention by Rimrock.
June 2011
Recruit high quality staff
Define job descriptions for all company positions
Assess and address bus cleanliness and maintenance
Implement new routes as necessitated by Greyhound’s decision to reduce Montana service
Create easy to understand schedules and brochures
July 2011
Communicate through TACs and intercity carrier meetings
August 2011
Increase marketing skills at management level
Work with university staff to implement on‐campus actions
Implement a marketing campaign to appeal to students

Company Mission, Vision, and Goals 2‐7
September 2011
Set up regular communication mechanism with all employees to disperse information and
collect suggestions and/or complaints
Upgrade office software
Provide staff with customer service training
Targeted promotion of Rimrock’s services
2‐8 Rimrock Stages Business Plan ‐ DRAFT
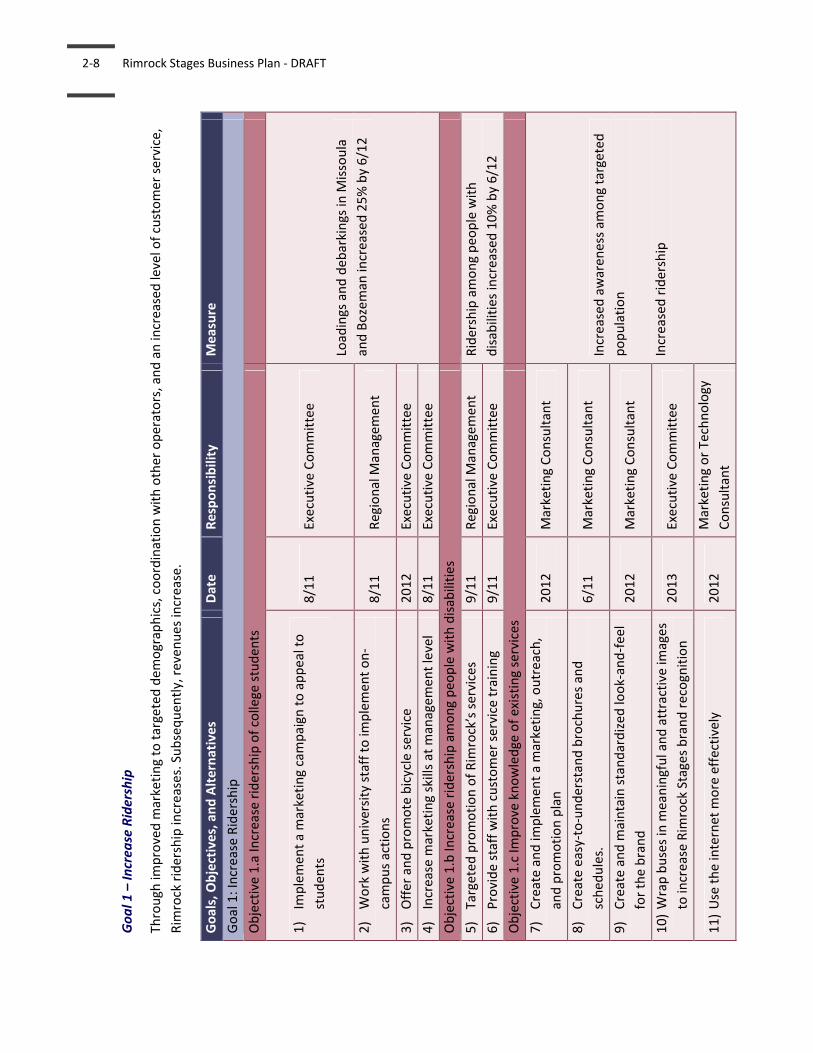
Goal 1
– In
crea
se Ridership
Through
improved m
arketing to targeted demographics, coordination with other operators, and an increased level of customer service,
Rim
rock ridership increases. Subsequen
tly, reven
ues increase.
Goals, Objectives, and Alternatives
Date
Responsibility
Measure
Goal 1: Increase Ridership
Objective 1.a Increase ridership of college studen
ts
1)
Implemen
t a marketing campaign
to appeal to
studen
ts
8/11
Executive Committee
Loadings and deb
arkings in
Missoula
and Bozeman
increased 25% by 6/12
2)
Work with university staff to im
plemen
t on‐
campus actions
8/11
Regional M
anagem
ent
3)
Offer and promote bicycle service
2012
Executive Committee
4)
Increase m
arketing skills at m
anagem
ent level
8/11
Executive Committee
Objective 1.b Increase ridership among peo
ple with disabilities
5)
Targeted promotion of Rim
rock’s services
9/11
Regional M
anagem
ent
Ridership among peo
ple with
disabilities increased 10% by 6/12
6)
Provide staff with customer service training
9/11
Executive Committee
Objective 1.c Im
prove knowledge of existing services
7)
Create and im
plemen
t a marketing, outreach,
and promotion plan
2012
Marketing Consultant
Increased awaren
ess am
ong targeted
population
Increased ridership
8)
Create easy‐to‐understand brochures and
sched
ules.
6/11
Marketing Consultant
9)
Create and m
aintain standardized
look‐and‐feel
for the brand
2012
Marketing Consultant
10) Wrap buses in m
eaningful and attractive im
ages
to increase Rim
rock Stages brand recognition
2013
Executive Committee
11) Use the internet m
ore effectively
2012
Marketing or Technology
Consultant

Company Mission, Vision, and Goals 2‐9
Goals, Objectives, and Alternatives
Date
Responsibility
Measure
12) Pilot innovative services to expand m
arket share
of choice riders
2012
Marketing Consultant
Objective 1.d Im
prove coordination with other operators
13) Communicate through
TACs and intercity carrier
meetings
7/11
Local M
anagem
ent/
Rep
resentative
Overall ridership increased 10% by 6/12
Net operating deficit for each route
improves 10% by 6/12
14) Coordinate through
Linx
Ongoing
Executive Committee
15) Assign coordination responsibilities to m
anagers
and ticket agen
ts
2012
Executive Committee
16) Im
prove depot experience
2013
Regional M
anagem
ent
Objective 1.e Im
prove customer service
17) Provide real tim
e traveler inform
ation
2013
Technology Consultant
Improved customer satisfaction
18) Assess and address on‐tim
e perform
ance
2012
Executive Committee
19) Assess and address safety perceptions
2012
Executive Committee
20) Assess and address bus cleanliness and
maintenance
6/11
Maintenance and Driver
Supervisor
21) Offer ticket price incentives
2013
Executive Committee
22) Assess and address phone service
2012
Executive Committee
23) Im
prove ride comfort
Ongoing
Executive Committee /
MDT
2‐10 Rimrock Stages Business Plan ‐ DRAFT
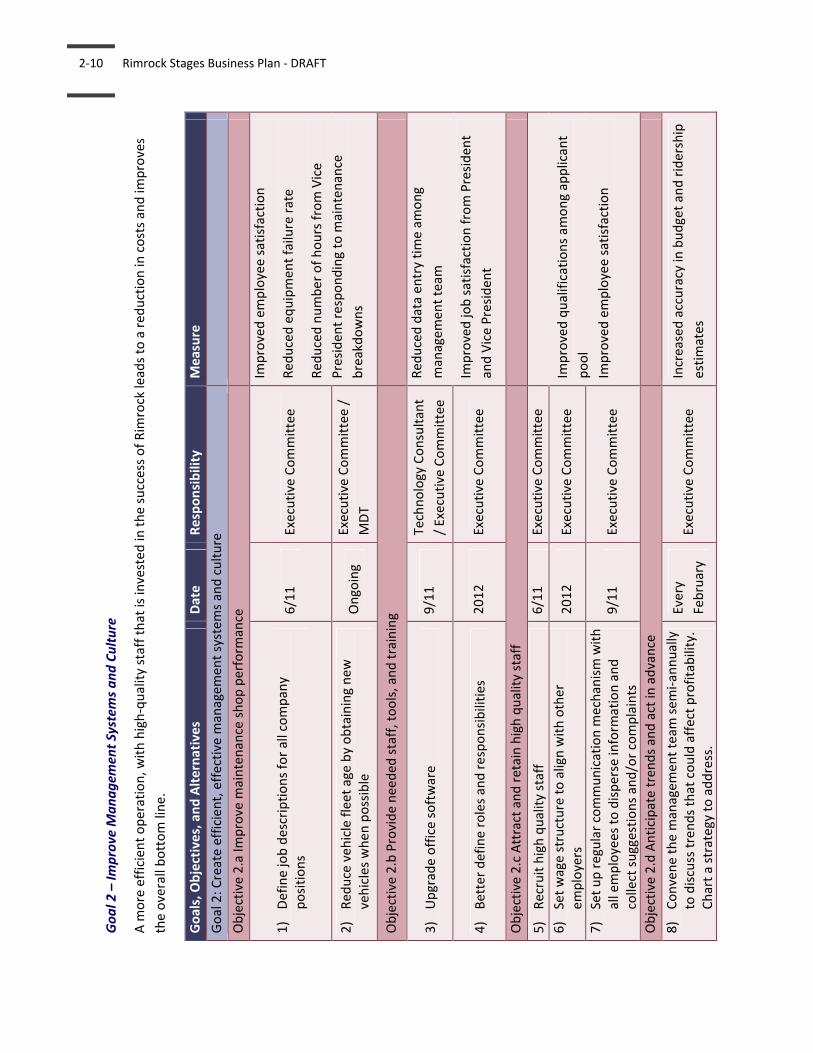
Goal 2
– Im
prove M
anagem
ent System
s and Culture
A m
ore efficient operation, w
ith high‐quality staff that is invested
in the success of Rim
rock leads to a red
uction in
costs and im
proves
the overall bottom line.
Goals, Objectives, and Alternatives
Date
Responsibility
Measure
Goal 2: C
reate efficien
t, effective m
anagem
ent system
s and culture
Objective 2.a Im
prove m
aintenance shop perform
ance
1)
Define job descriptions for all company
positions
6/11
Executive Committee
Improved employee satisfaction
Red
uced equipmen
t failure rate
Red
uced number of hours from Vice
Presiden
t responding to m
aintenance
breakdowns
2)
Red
uce veh
icle fleet age by obtaining new
vehicles when possible
Ongoing
Executive Committee /
MDT
Objective 2.b Provide needed
staff, tools, and training
3)
Upgrade office software
9/11
Technology Consultant
/ Executive Committee
Red
uced data en
try time am
ong
managem
ent team
Improved job satisfaction from Presiden
t
and Vice Presiden
t 4)
Better define roles and responsibilities
2012
Executive Committee
Objective 2.c Attract and retain high quality staff
5)
Recruit high quality staff
6/11
Executive Committee
Improved qualifications am
ong applicant
pool
Improved employee satisfaction
6)
Set wage structure to align with other
employers
2012
Executive Committee
7)
Set up regular communication m
echanism with
all employees to disperse inform
ation and
collect suggestions and/or complaints
9/11
Executive Committee
Objective 2.d Anticipate tren
ds and act in
advance
8)
Convene the managem
ent team
sem
i‐annually
to discuss trends that could affect profitability.
Chart a strategy to address.
Every
February
Executive Committee
Increased accuracy in
budget and ridership
estimates

Company Mission, Vision, and Goals 2‐11
Goal 3
– Create New
and Expanded
Service Options
By expanding existing service options and creating new routes, Rim
rock is better able to serve the need
s of Montanans in targeted areas
leading to increased ridership in
curren
tly underserved
communities.
Goals, Objectives, and Alternatives
Date
Responsibility
Measure
Goal 3: C
reate new
and expanded
service options for Montanans
Objective 3.a. Consider altering existing routes to create new service to better serve needs of target customer populations
9)
Modify Missoula‐W
hitefish route for
better connectivity to the west.
2012 (Scen
ario 1)
Executive Committee
Increased ridership Unduplicated
service
No net loss in
reven
ue
10) Change M
issoula‐Billings route to travel
through
Helena and continue operating
routes form
erly served by Greyhound
6/11 (Scen
ario
2,4)
Executive Committee
11) Coordinate on service‐specific issues
2012 (Scen
ario 1)
Executive Committee
Objective 3.b. Consider expanded
service when
comfortable with curren
t operations
12) Summer service to and through
Yellowstone
2012
(Scenario 1)
Executive Committee
Increased number of Montanans with
service
Decreased
travel tim
es for most
Montanans
Improved hours of service
Decreased
layovers
Maintain or decrease overall operating
deficit
Positive net reven
ue on defined
routes
by end of trial period
13) Summer service W
hitefish‐Apgar Transit
Cen
ter, W
est Glacier
2013
(Scenario 1)
Executive Committee
14) More direct services betw
een
Montana’s major cities and nearby
metropolitan
areas
2014
(Scenario 2)
Executive Committee
15) Add stops at m
ajor airports
2014 (Scen
ario 2)
Executive Committee
16) Instate service betw
een Great Falls and
Calgary
2016 (Scen
ario 3)
Executive Committee

Definition of the Market 3‐1
3 Definition of the Market
Rimrock is the primary intercity bus operator in Montana and North Dakota with connections to
other services linking to the rest of the country. The routes Rimrock provides hold national
significance because they carry people across the country along one of only four cross‐country
corridors.
On the east coast and other high‐density corridors, the intercity bus service is rapidly growing.
While we expect most corridors in Montana and North Dakota to continue needing FTA funding
to meet societal goals for access to rural services, we predict the trends from the more
populated areas to carry through to Rimrock’s service area, especially if Rimrock ties into the
mobile communications framework.
The residential, student, and visitor patterns in Montana offer an understanding of the market
for Rimrock Trailways.
3.1 Residents
Montana, the fourth largest state geographically in the United States, has a population of
974,989 people and a population density of around seven people per square mile.1 Montana has
three metropolitan areas (Billings, Missoula, and Great Falls) and four micropolitan areas
(Bozeman, Kalispell, Helena, and Butte). Sixty‐four percent of Montanans live in these seven
areas. While statewide population growth between 2000 and 2009 has been slower than the
country as a whole (8.1% vs. 9.1%), the seven largest counties have experienced dramatic
growth. The heaviest growth is in Bozeman’s Gallatin County, which has increased by 78% since
1990. By contrast, the eastern and northern parts of the state have lost population. (U.S. Census
Bureau, 2010)
Montana and North Dakota, the states that Rimrock serves, have changing populations and
evolving needs. Montana is projected to have one of the highest percentages of elderly
populations in the United States, with the number of Montana residents 65 years and older
projected to grow to 269,558 by 2030. (U.S. Census Bureau, 2005) Transit services will be vital
for elderly residents to receive goods and services, including necessary medical care, and for
visiting family and friends.
Seven Indian reservations are located in Montana. The American Indian population is
disproportionately low income and isolated and will use intercity bus service if it is available.
Currently, the Flathead reservation is served by Rimrock’s Missoula‐Whitefish routes; the Crow
1 U.S. Census Bureau, 2009 estimate: 974,989; Land area: 145,552 square miles; population density: 6.7 people per square mile.
3‐2 Rimrock Stages Business Plan ‐ DRAFT
and Northern Cheyenne can access Rimrock services if members can find transportation to
Billings.
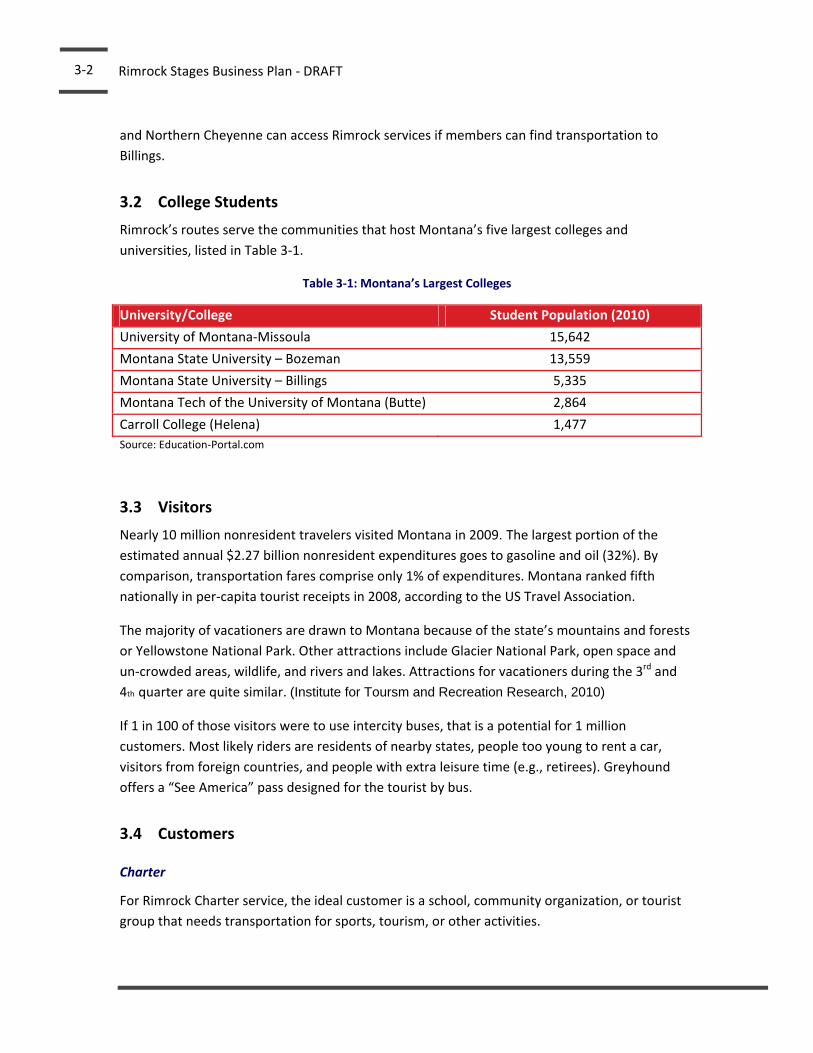
3.2 College Students
Rimrock’s routes serve the communities that host Montana’s five largest colleges and
universities, listed in Table 3‐1.
Table 3‐1: Montana’s Largest Colleges
University/College Student Population (2010)
University of Montana‐Missoula 15,642
Montana State University – Bozeman 13,559
Montana State University – Billings 5,335
Montana Tech of the University of Montana (Butte) 2,864
Carroll College (Helena) 1,477
Source: Education‐Portal.com
3.3 Visitors
Nearly 10 million nonresident travelers visited Montana in 2009. The largest portion of the
estimated annual $2.27 billion nonresident expenditures goes to gasoline and oil (32%). By
comparison, transportation fares comprise only 1% of expenditures. Montana ranked fifth
nationally in per‐capita tourist receipts in 2008, according to the US Travel Association.
The majority of vacationers are drawn to Montana because of the state’s mountains and forests
or Yellowstone National Park. Other attractions include Glacier National Park, open space and
un‐crowded areas, wildlife, and rivers and lakes. Attractions for vacationers during the 3rd and
4th quarter are quite similar. (Institute for Toursm and Recreation Research, 2010)
If 1 in 100 of those visitors were to use intercity buses, that is a potential for 1 million
customers. Most likely riders are residents of nearby states, people too young to rent a car,
visitors from foreign countries, and people with extra leisure time (e.g., retirees). Greyhound
offers a “See America” pass designed for the tourist by bus.
3.4 Customers
Charter
For Rimrock Charter service, the ideal customer is a school, community organization, or tourist
group that needs transportation for sports, tourism, or other activities.

Definition of the Market 3‐3
Shop
For the bus repair shop, the ideal customer is a school district, charter bus, or intercity bus
carrier that doesn’t have the resources in or near Billings to repair the buses in the area.
Intercity
Data from the 1995 American Travel Survey found that bus riders are more likely to be young
adults or seniors, have lower incomes, and lack alternative personal transportation. Previous
users of bus, rail, or shared van are more likely to choose a bus for future trips.
The 2001 National Household Travel Survey provides some characteristics on trips over 50 miles
in length. The national statistics indicate that people using scheduled bus service over 50 miles
are more likely to be traveling for leisure or personal business, are more likely to be female, and
are making longer trips than users of train or personal vehicle, but shorter trips than airline
passengers. The median trip length for intercity bus is 287 miles. This data is in line with
Greyhound’s descriptions of its customers, and with a recent study in North Dakota.
The Mattson et al recent study in North Dakota and Northwest/West Central Minnesota North
Dakota (Mattson, 2010) found that 80% of responders preferred travel by automobile, 6.7 % by
van, 5.4% by rail, 4.0% by air, and 3.5% by bus. Results vary by cost, distance, age, gender,
income, and trip purpose. The mode choice of bus fared better as gas prices increased to
$6/gallon, and for trips between 30 and 240 miles. Income was also a factor, with those making
less than $30,000/year being more likely to choose bus.
The study asked respondents to agree or disagree with a series of statements. The top 10
statements respondents agreed with are:
If my travel options are delayed, I want to know the cause and length of delay.
It is important to have comfortable seats when I travel.
When traveling, I like to keep as close as possible to my departure schedules.
A clean vehicle is important to me.
I prefer a travel option that has a predictable travel time.
Having a stress‐free trip is more important than reaching my destination quickly.
I would like to make productive use of my time when traveling.
I would change my form of travel if it would save me some time.
Having privacy is important to me when I travel.
I avoid traveling at certain times because it is too stressful.
The following are the five statements respondents were likely NOT to agree with are:
People who travel alone should pay more to help improve the environment.
The people who ride intercity buses are like me.

3‐4 Rimrock Stages Business Plan ‐ DRAFT
I worry about getting in an accident when I travel.
The people who use intercity rail service are like me.
I would be willing to pay more when I travel if it would help the environment.
Looking at these responses, several conclusions can be drawn about factors that impact
passenger mode choice:
Passengers desire clear information and communication, including information about
problems.
On‐time, reliable and consistent service is important.
Passenger amenities such as wireless internet, comfortable seating, and clean vehicles
have a positive impact on passenger satisfaction.
Decreasing environmental impact is not a goal that passengers value significantly
enough to change their choices about transportation services.
Increasing ridership by choice riders will improve the economics of providing service to
communities and populations with the greatest need. While the traditional bus rider has limited
travel choices because of income or disability, trends point towards attracting a wider customer
base. Time Magazine reported in its November 23, 2009 edition, bus travel, at least in the
Northeast and Midwest, has become a hip, affordable mode of transportation. Operators are
attracting a new demographic of riders by offering amenities such as power outlets, free Wi‐Fi,
or movies. Travel time is not competitive with air travel for the longer trips, but Time reports
the bus competes well for trips less than 300 miles. This distance is probably a bit longer in the
mountain west, where few trains exist and a flight between Missoula and Billings requires a
stopover in Salt Lake City. That trip by bus, which is 344 miles, becomes more competitive when
service is frequent and priced well.
3.5 Competition
Competition varies between intercity, charter, and shop services.
For intercity transportation, travelers have the choice between taking a private automobile,
renting a vehicle, flying, taking a train, or taking another intercity bus. For much of the area
Rimrock serves, Amtrak is a viable alternative only if the rider is travelling through the region
since Rimrock’s east‐west corridor is along I‐90 and I‐94, while Amtrak’s Empire Builder serves
the high line. Commercial air also is limited in its competition with intercity bus service given the
cost, the limitation of cities with airports, and the routing through out‐of‐state hubs to travel
between communities in North Dakota and Montana. If the Amtrak southern route, currently
under study were to return, that service would compete with Rimrock.

Definition of the Market 3‐5
Intercity bus companies, while competitors in some sense, build the greatest ridership when
they coordinate to allow transfers between different routes.
One group of potential “competitors” is other organizations committed to providing services to
people in need in the community. This includes churches, service clubs, assistance groups that
provide food, help with paying bills, family counseling, and local/federal aid programs. Other
potential competition could arise if other intercity operators serving Montana, described in the
Rimrock TDP, choose to expand service. The concern we should have with the existence of these
“competitors” is to ensure that we are not working at cross purposes and, where possible,
determining how we can work together to achieve a common objective.
Rimrock’s charter market focuses on Billings. Powder River Transportation and First Student
offer charter service from Billings. Other regional competitors include Karst Stage, offering
charters out of Bozeman, Tucker Transportation out of Butte, and Beach Transportation located
in Missoula.


Description of Services 4‐1
4 Description of Services
Rimrock Stages operates three types of service:
Scheduled intercity service, marketed as Rimrock Trailways
Charter service, including transportation for Billings school activities
Bus service and repair for other intercity, charter, and school buses
This section provides a brief summary of intercity services. More details can be found in Section
5 of the Transit Development Plan.
In Montana, Rimrock Stages is the primary intercity operator. Rimrock Trailways provides
scheduled service across Montana and North Dakota with connections to other services linking
to the rest of the country. In spite of the remoteness and low population density of Rimrock’s
service area, the routes Rimrock provides hold national significance because they carry people
across the country along one of only four cross‐country corridors. Rimrock also allows
Montanans to connect to communities within Montana and also to communities outside the
state.
As of January 2011 the system has 17 vehicles, providing 47,700 passenger trips per year in the
state of Montana. Rimrock operate 365 days per year, cancelling service only when travel
conditions are dangerous.
4.1 Routes
As of June 21, 2011, Rimrock operates the routes described in Table 4‐1. Those routes in blue
italics are new. The list includes routes 15 and 16 between Whitefish and Missoula that have not
yet begun but are proposed within the next year if there is adequate MDT funding and/or
passenger revenue. A map of routes is shown in Figure 4‐1; schedules are in Table 4‐2.
Scheduled transportation serves the following counties in Montana: Flathead, Lake, Missoula,
Granite, Powell, Dear Lodge, Silver Bow, Jefferson, Cascade, Lewis & Clark, Broadwater, Gallatin,
Park, Sweet Grass, Stillwater, Yellowstone (headquarters), Treasure, Rosebud, Custer, Prairie,
Dawson, Wibaux.
Based on 2010 estimates, 619,000 Montanans (63%) live within 10 miles of a Rimrock bus
station; 733,000 (74%) live within 25 miles.
Ridership and the volume of service have remained constant between 2009 and 2010 while
ticket revenue increased by 8%. The passenger trip length for Rimrock riders is among the
highest in the country.

4‐2 Rimrock Stages Business Plan ‐ DRAFT
Rimrock connects with urban and rural fixed route public transportation. In Whitefish
connections to Amtrak are available.
Table 4‐1: Summary of Routes (with new services)
Route Corridor Description Dir
0001 Billings‐Fargo Fargo to Miles City to Billings 13:15 Departure WB 0002 Billings‐Fargo Billings to Miles City to Fargo 06:30 Departure EB 0003 Billings‐Fargo Fargo to Miles City to Billings 01:45 Departure WB 0004 Billings‐Fargo Billings to Miles City to Fargo 17:45 Departure EB 0005 Missoula‐Helena‐Billings Billings to Helena to Missoula 8:45 Departure WB 0006 Missoula‐Billings Missoula to Butte to Billings 16:00 Departure EB 0007 Missoula‐Billings Billings to Butte to Missoula 13:45 Departure WB 0008 Missoula‐Helena‐Billings Missoula to Helena to Billings 11:15 Departure EB 0009 Missoula‐Billings Billings to Butte to Missoula 1:15 Departure WB 0010 Missoula‐Billings Missoula to Butte to Billings 23:10 Departure EB 0011 Helena‐Great Falls Great Falls to Helena 11:45 Departure SB 0012 Helena‐Great Falls Helena to Great Falls 13:30 Departure NB 0013 Butte‐Great Falls Great Falls to Butte 14:50 Departure SB 0014 Butte‐Great Falls Butte to Great Falls 18:30 Departure NB 0015 Whitefish‐Missoula (future) Missoula to Kalispell 15:45 Departure NB 0016 Whitefish‐Missoula (future) Kalispell to Missoula 18:40 Departure SB 0017 Whitefish‐Missoula Missoula to Whitefish 08:15 Departure NB 0018 Whitefish‐Missoula Whitefish to Missoula 11:55 Departure SB

Description of Services 4‐3
Figure 4‐1: New Rimrock routes as of June 21, 2011

4‐4 Rimrock Stages Business Plan ‐ DRAFT
Table 4‐2: Rimrock Schedule of Services as of June 21, 2011 MISSOULA ‐ ‐BILLINGS ‐‐ FARGO GREAT FALLS ‐‐ HELENA ‐‐ BUTTE
Effective 6/21/2011 Revision 6/15/2011 Revision 6/15/2011
Read Down Read Up Read Down Read Up
GL 1276 GL 1274 LOCATION GL 1277 GL1275 RRS 0013 RRS 0011 RRS 0012 RRS 0014
11:30p 10:40a LV Seattle AR 7:30a 5:35p 3:15p 11:45A LV GREAT FALLS AR 3:00p 9:45p
5:45a 5:10p LV Spokane AR 1:20a 11:20a 3:30p 12:00p Ulm 2:40p 9:25p
11:00a 10:25p AR Missoula LV 10:00p 8:00a 3:50p 12:15p Cascade 2:27p 9:00p
RRS 0006 RRS 0008 RRS 0010 RRS 0007 RRS 0009 RRS 0005 4:15p 12:35p Craig Jct 2:07p 8:50p
4:00p 11:15a 11:10p LV MISSOULA AR 9:20p 7:35a 3:30p 4:25p 12:42p Wolf Creek 2:00p 8:40p
5:05p 12:10p 12:10a Drummond 8:25p 6:40a 2:25p 4:55p 1:15p AR HELENA LV 1:30p 8:10p
5:35p 12:40a Deer Lodge 7:40p 6:10a 5:00p LV HELENA AR 8:05p
5:55p 1:00a Warm Springs 7:20p 5:50a 5:30p Boulder 7:30p
6:15p 1:15a AR Butte LV 7:00p 5:35a 5:40p Basin 6:55p
6:45p 1:30a LV Butte AR 6:15p 5:20a 6:15p AR BUTTE LV 6:45p
1:15p AR Helena LV 1:30p
1:30p LV Helena AR 1:15p Light Print am
2:15p Townsend 12:30p Dark Print pm
7:15p NS 2:00a Whitehall 5:40p 4:50a On Call Stop‐Reservation Required
7:40p 2:45p 2:25a Three Forks 4:55p 4:15a 12:00a
/ 2:55p 2:35a Manhattan 4:45p 4:05a 11:50a
8:00p 3:05p 2:45a Belgrade 4:35p 3:55a 11:40a
8:25p 3:20p 3:05a AR Bozeman LV 4:25p 3:45a 11:30a
8:30p 3:25p 3:10a LV Bozeman AR 4:15p 3:40a 11:25a WHITEFISH ‐‐ KALISPELL ‐‐ MISSOULA
9:05p 4:00p 3:45a Livingston 3:45p 3:05a 11:00a
10:00p 4:40p 4:25a Big Timber 3:10p 2:30a 10:25a Read Down Read Up
10:35p 5:15p 5:00a Columbus 2:15p 1:40a 9:30a RRS 0018 RRS 0017
11:00p 5:40p 5:35a Laurel 1:50p 1:20a 9:05a 1155a LV Whitefish AR 1140a
11:15p 6:00p 6:00a AR BILLINGS LV 1:30p 1:00a 8:45a 1220p AR Kalispell 1110a
RRS 0004 RRS 0002 RRS 0003 RRS 0001 1250p LV Kalispell 1100a
6:25p 6:30a LV BILLINGS AR 11:45a 11:35p 105p Lakeside 1040a
7:40p 7:45a Hysham 10:30a 10:20p 150p Polson 955a
8:05p 8:05a Forsyth 10:05a 9:55p 200p Pablo 942a
8:45p 8:45a AR Miles City 9:25a 9:15p 210p Ronan 935a
9:00p 9:00aa LV Miles City 9:10a 9:00p 245p St. Ignatius 915a
9:40p 9:45a Terry 8:20a 8:20p 250p Ravalli 900a
10:20p 10:25a Glendive 7:45a 7:40p 300p Arlee 845a
10:50p 10:55a Wibaux,MT 7:15a 7:10p 310p Evaro 835a
11:00p 11:05a Beach,ND 7:05a 7:00p 330p AR Missoula LV 815a
1125p 11:30a Medora 6:40a 6:35p
1140p 11:45a Belfield 6:25a 6:20p Light Print am
11:55p 12:10p AR Dickinson LV 6:00 5:55p Dark Print pm
12:10a 12:40p LV Dickinson AR 5:35a 5:25p On Call Stop‐Reservation Required
12:35a 1:05p Richardton 5:10a 5:00p
2:45a 3:10p AR Bismarck 4:55 4:45p
2:50a 3:30p LV Bismarck 4:50 4:30p
3:05a 3:55p Sterling Corner 4:25a 4:00p
3:20a 4:10p Steele 4:10a 3:45p
4:25a 5:20p Jamestown 3:10 2:45p
4:55a 5:50p Valley City 2:45 2:15p
5:55a 6:50p AR FARGO, ND LV 1:45 1:15p
JL 0932 JL 0934 JL 0931 JL 0933
6:15a 7:20p LV FARGO AR 1:20a 12:45p
10:55a 11:40p AR MINNEAPOLIS LV 9:00p 8:00a
GL 4737 GL 4901 GL 4916 GL 4952
1:10p 12:54a LV MINNEAPOLIS AR 7:26p 7:41a
10:40p 9:00a AR CHICAGO LV 11:29a 11:44p
Light Print am Italics show connecting carriers
Dark Print pm RRS ‐ Rimrock Stages ‐ 800‐255‐7655
On Call Stop‐Reservation Required GL ‐ Greyhound Lines
JL ‐ Jefferson Lines
RRS Schedules 0008 & 0005 go through Helena.
RRS Schedules 0006, 0010, 0007, 0009 go through Butte, MT
Schedules subject to change for weather, connections or other conditions
Description of Services 4‐5
4.2 Level and Use of Service
In Calendar Year 2010, Rimrock provided 46,671 rides in Montana, or 131 rides per day. These
values are approximately the same as 2009. Passenger types are categorized as:
20% Elderly (60 and over)
10% Disabled
70% Under 60
Rimrock serves all people regardless of race or ethnicity, with a higher percentage of minorities
than the Montana population as a whole.
Rimrock buses are on the road 24 hours per day, 365 days per year. Rimrock cancels service only
when travel conditions are dangerous, which occurred on 3 days in 2010.
Annual mileage of all vehicles on Montana scheduled services prior to the June 21 changes is
859,546 miles. In North Dakota, Rimrock operates 543,000 miles per year. The service changes
will increase Montana miles by 69% to 1,450,000 miles per year.
4.3 Stations and Ticket Agents
Rimrock’s stations have been co‐located with Greyhound’s stations where possible, and some
Rimrock stations are co‐located with city bus services. Outside Montana’s largest cities, stations
are staffed through ticket agents in their place of business. For example, the Drummond agents
also operate a restaurant, and in Polson, Rimrock’s stop is at a flower shop. Most agents are
paid based on ticketing commission, while Missoula agents are Rimrock employees and are
salaried. As of June 21, Bozeman and Billings stations transitioned from Greyhound to Rimrock;
agents at both are independent contractors operating on commission.

4‐6 Rimrock Stages Business Plan ‐ DRAFT
Table 4‐3: Depots in Large Montana Communities
City Depot
Owner
Agents Notes
Billings Greyhound Contrated to
Rimrock (formerly
Greyhound)
shared terminal with Greyhound, Jefferson Lines,
Black Hills Stage Lines ; two blocks from MET transfer
center
Butte Butte‐Silver
Bow
Rimrock contract
agents
shared terminal with Salt Lake Express and Butte‐
Silver Bow Transit ; Butte‐Silver Bow wants intercity
carriers to stay out of loop between 7am and 7pm but
grass‐covered drop area is snow covered or muddy
much of the year.
Bozeman Leased by
Rimrcok
Contracted to
Rimrock (formerly
Greyhound)
Streamline stops at terminal ; High rent; Rimrock
wants to find new space
Great
Falls
Great Falls
Transit
Great Falls Transit shared terminal with Great Falls Transit;
connections available to Shelby via Northern
Transit Interlocal; connections available to Havre
via North Central Transit
Helena Helena Area
Transit
Helena Area
Transit
shared terminal with HATS ; new facility opened in
June 2011
Kalispell Store front Ticket agent connections available to Shelby via Northern
Transit Interlocal
Missoula Greyhound Rimrock
employees
shared terminal with Greyhound; riders can
connect with Bitteroot Bus; Mountain Line stop at
terminal
Whitefish Amtrak Amtrak shared terminal with Amtrak
4.4 Other Organizations
In Montana, Rimrock Stages is the primary intercity operator. Other intercity services include:
Connections east to Minneapolis Jefferson Lines
Connections west to Spokane Greyhound Lines
Connections south to Denver Black Hills & Jefferson Lines
Connections south to Salt Lake City Salt Lake Express
Connections to Havre and the Highline North Central Transit
Connections to Shelby and the Highline Northern Transit Interlocal
Amtrak and the state’s commercial airports also connect Montanans to the rest of the country.
Routes and schedules for Rimrock and other intercity carriers are included in attachments to the
TDP.

Description of Services 4‐7
4.5 Transportation Advisory Committee (TAC) Meetings
Since Rimrock Trailways serves most of the State of Montana, it does not participate exclusively
with one local Transportation Advisory Committee. It is a member of the Billings Transportation
Advisory Committee.
In the future, Rimrock Trailways will coordinate more extensively with local TACs and other
intercity carriers. For the next year, we propose the following enhanced coordination efforts.
Work with MDT to organize meetings of all Montana intercity carriers twice per year.
To balance travel between carriers and encourage growth of the Montana Transit
Association, meetings can be split between the east and west of the state. One meeting
could be the day before or after the spring Montana Transit Association meeting; the
second fall meeting could be in Billings (or Helena or Butte if the MTA meeting is
scheduled in Billings that year.)
Participate in TAC meetings in the 7 largest markets once per year.
Communicate via email, electronic newsletters, and phone with the other TACs.

4‐8 Rimrock Stages Business Plan ‐ DRAFT
4.6 Coordination
Between November 2010 and January 2011, Rimrock conducted outreach meetings across
Montana. The following groups had representation at one or more of the workshops. In addition
to participating more frequently with local TAC’s, Rimrock should continue to conduct outreach
meetings and coordinate with the groups listed below.
Associated Students of the University of
Montana
Active Transportation Alternatives
Big Sky Economic Development
Bitterroot Bus
Bozeman, Mayor’s Task Force on
Climate Change
Bozeman Transportation Incorporated
City of Billings
City of Helena
City of Missoula
Eagle Transit
Easter Seals
Helena Area Transportation System
(HATS)
Homeword
Kalispell Agency on Aging
Karst Stages
Linx
Living Independently for Today &
Tomorrow
MET Transit
Missoula Aging Services
Missoula in Motion
Missoula Mountain Line
Missoula Office of Planning and Grants ‐
Transportation
Montana Association for the Blind
Montana Business Enterprises
Montana Department of Corrections
Montana Department of Public Health
and Human Services
Montana Department of Transportation
Montana Independent Living Project
Montana League of Women Voters
Montana Orientation and Mobility
Program
Montana State University‐Bozeman
Montana Vocational Rehabilitation
Missoula Ravalli Transportation
Management Association/Montana
Transit Association
North Central Independent Living
North Central Transit
Office of Senator Jon Tester
Opportunity Link
private citizens
Red Lodge Area Chamber of Commerce
Roberts Fire Department
RSS
Salt Lake Express
Summit Independent Living Center
Transportation for America
U.S. Department of Housing and Urban
Development
Western Transportation Institute
Yellowstone Business Partnership
Workshops included discussion about how to work together more effectively, and key strategic
work partnerships. The following list addresses the key groups, in alphabetical order.

Description of Services 4‐9
Bicycle groups
Climate change task forces and efforts (Blue Skies Green Pockets)
Colleges and universities
Local transit providers—include brochures on city buses and link websites
Confederated Salish and Kootenai Tribes
Greyhound
Other intercity bus services
Linx
Major health centers and hospitals
Montana Association for the Blind
Montana Department of Public Health and Human Services
Montana Department of Transportation
State and federal elected officials
Independent Living Centers
Transportation Advisory Committees (TACs)
Tourism and travel groups such as Travel Montana


Organization and Management 5‐1
5 Organization and Management
Rimrock Stages, Inc. is a privately held, owned and operated company. The Board of Directors,
as listed in Table 5‐1, is the same as the management team. In Fiscal Year 2010, the President
worked part time with a salary of $43,225, and the Vice President worked full time with a salary
of $54,769. There were no further distributions. Thorm Forseth owns the majority of the shares
in the company.
Table 5‐1: Board of Directors
Name Term of Office Affiliation
Thorm R Forseth 38 years President
Eric B Forseth 15 years Vice President
Jon Phillips Controller
The organization chart shown in Figure 5‐1 illustrates the relationship between employees.
Employees of Rimrock are not union members, and are categorized in the MDT application for
funding as shown in Table 5‐2. Drivers and mechanics are paid according to the scale shown in
Table 5‐3.
Table 5‐2: Employees by MDT‐Defined Categories
Number Full
Time
Part Time
Executive 2 2 0
Office Staff 7 5 2
Drivers 21 14 7
Dispatch 1 0 0
Mechanics 3 3 0
Janitorial 4 2 2
Table 5‐3: Rimrock Wage Scale
Drivers Lead
Mechanic Time Period Grade
Level
Driving
Rate (per
hour)
Cushion
Rate (per
hour)
0‐6 months 5 $12.00 $9.00 Around
$23 per
hour
7‐12 months 4 $12.25 $9.25
13‐18
months
3 $12.50 $9.50
19‐24
months
2 $12.75 $9.75
25+ months 1 $13.00 $10.00

5‐2
Rim
rock Stages B
usin
ess Plan
‐ DRAFT
Rimrock Stages, Inc., dba Rimrock TrailwaysOrganizational Chart
Jennifer ForsethAdministrative Assistant
MissoulaTicket Agents
1 Full Time2 Part Time
Kalispell-MSO-ButtteSchedule Drivers
3 Full Time
Francis BellDepot Manager
Missoula
Great Falls - ButteSchedule Drivers
1 Full Time1 Part Time
Dave CookDriver Coordinator
Great Falls
Billings - ButteSchedule Drivers
2 Full Time
Billings - Miles CitySchedule Drivers
2 Full Time
Charters & Schedule6 Part Time
Charter Drivers3 Full Time4 Part Time
Billings
Miles City - FargoSchedule Drivers
6 Full Time
Miles City
Floyd KirkhamSafety & Driver Supervisor
Dispatch
Mechanics4 Full ime
Bus Cleaners1 Full Time3 Part Time
Donald OlsonShop Foreman
LaDonna BearclawReceptionist,
Depot Reports,Customer Service
R ChappleReclaims,
Partial Fuel Report
Joh PhillipsController
Eric B. ForsethVice President, Chief Operating Officer
Thorm R. ForsethPresident, Chief Executive Officer
Figure 5‐1: Rimrock organization chart

Organization and Management 5‐3
5.1 Control Processes
Rimrock Stages implements procedures to minimize fraud and theft within the organization.
Cash is handled by drivers, ticket agents, and management. Cash fares collected by drivers
averaged $600 per month in FY 2010. Drivers turn in fares collected along with ticket stubs at
the end of each shift. The Missoula depot is the only depot that has Rimrock employees
processing cash. Each employee has their own cash drawer. The drawers are closed out each
day at the end of the employee’s shift and are balanced to the computer report of sales.
Management maintains a petty cash box to pay small expenses and process driver per diem
distributions. A receipt book records transactions and collects supporting documentation. The
petty cash box is balanced at the end of each month.
Inventory is limited to shop parts. As an inventory check, there is a manager walk through count
each year on September 30th, the end of Rimrock’s fiscal year.
Access to payroll records is limited to management. Payroll records are maintained by Jennifer
Forseth and kept in a lockable file cabinet in Eric Forseth’s office. Records are updated every
time that payroll is processed.
Overtime is primarily limited to shop personnel. Hours are approved by the shop manager as
necessary to complete business then reviewed by management for each payroll. Overtime is
captured by the time clock.
Operational equipment consists primarily of buses. The shop equipment is fairly limited and has
a long useful life. The only significant office equipment would be EDP items that are replaceable
on an individual basis.
Rimrock obtains buses on a limited budget as best as possible. Due to the financial burden of the
lost contract and following lawsuit, securing financing has been difficult. However, a concerted
effort to reduce the company debt led to improvements in FY2010.
Rimrock has partnered with MDT and NDDOT to purchase new buses with FTA assistance, but
because of the limited funding, the vehicles are mid‐duty compared to the heavy duty buses
Rimrock prefers to purchase. The buses purchased through the low‐bid process have been
troublesome, leading to a current approach of purchasing used motorcoaches with wheelchair
lifts.
Rimrock States, Inc. is a tightly held, non traded, family owned business. Management is the
family. There have not been any borrowing covenants developed by the owners.
The company holds a $5,000,000 liability policy.
Secured assets are represented by buses listed in Table 5‐4.

5‐4
Table 5‐4: Rimrock Vehicle Inventory
BUS # MAKE YEAR SERIAL # #
PASS. LIC. # PRESENT VALUE LIENHOLDER OWED GVW IFTA Decal
Shop Tr FORD 1999 1FTYR10C0WTA75510 SVC LIAB. ONLY
2034 MCI 1984 1TUAAH9A4ER004406 47 S10941 Liab. Only RRS $0.00 28K‐44K YES
2121 Prevost 2001 2PCH3349211013956 56 S13109 150,000 Advantage 32K‐50K YES
2120 Prevost 1999 2PCH3341XX1012850 50 S12033 $130,000.00 Advantage 35K‐50K YES
2119 102DL3 1996 1M8PDMPA7TP047984 55 S12514 $120,000.00 RRS $0.00 32.5K‐50K YES
2061 MC‐12 1994 1M8RCM7A7RP046659 47 S10407 LIAB. ONLY RRS $0.00 28K‐44K YES
2062 MCI‐ 12 1994 1M8RCM7A5RP046661 47 S10408 LIAB. ONLY RRS $0.00 28K‐44K YES
2063 MCI‐ 12 1994 1M8RCM7A9RP046663 47 S10409 LIAB. ONLY RRS $0.00 28K‐44K YES
2064 MCI‐ 12 1994 1M8RCM7A4RP046649 47 S10410 LIAB. ONLY RRS $0.00 28K‐44K YES
2066 MCI‐ 12 1994 1M8RCM7A3RP046657 47 S11188 LIAB. ONLY RRS $0.00 28K‐44K YES
2102 PREVOST 1999 2PCH33491X1012788 56 S07374 $150,000.00 VOLVO $0.00 33K‐50K YES
2103 PREVOST 1999 2PCH33491X1012791 56 S07375 $150,000.00 Advantage 60000? 33K‐52K YES
2113 PREVOST 2000 2PCH3349XY1013309 56 S08409 $160,000.00 VOLVO $12,000.00 33K‐52K YES
2114 VAN HOOL
2000 YE2CC13B8Y2045037 57 S08936 $175,000.00 RRS $0.00 31.2K‐50K YES
2201 PREVOST 2000 2PCH33415Y1013549 46 S08023 $175,000.00 VOLVO $10,000.00 35K‐50K YES
2202 VAN HOOL
2001 YE2CC23B512045220 57 S11003 $175,000.00 Random $35,000.00 31.2K‐50K YES
2203 MCI 1996 1M8PDMPA5TP048718 55 S13110 $45,000.00 FIB $40,000.00 32.5K‐50K YES
2204 MCI 1996 1M8PDMPA5TP048719 55 S13111 $45,000.00 FIB $40,000.00 32.5K‐50K YES
2205 Synergy 2011 New 37 ST of MT $0.00
2206 Synergy 2011 New 37 ST of MT $0.00
2207 Synergy 2011 New 37 ST of MT $0.00

Organization and Management 5‐5
5.2 Regulatory Environment
As a motorcoach operator that crosses state lines, Rimrock Stages is subject to the regulations
of the Federal Motor Carrier Safety Administration.
“The Federal Motor Carrier Safety Administration (FMCSA) issues, administers, and enforces the Federal
Motor Carrier Safety Regulations (FMCSRs) and Commercial Regulations that apply to commercial motor
vehicles transporting passengers. FMCSA sets minimum safety standards that motorcoach companies
must follow for the buses/vehicles they operate and the physical qualifications and operating rules for
their drivers.” (Federal Motor Carrier Safety Administration, 2011)
As an intercity carrier, Rimrock is eligible for the Federal Transit Administration 5311(f) program.
Funds are allowable under this program for intercity routes that are not profitable. FTA defines
the goal of Section 5311(f) funds to support providers operating regularly scheduled bus service
for the general public, with:
Limited stops over fixed routes
Connectivity between two or more urban areas not in close proximity
Capacity to transport baggage carried by passengers
Meaningful connections with scheduled intercity bus service to more distant points, if
that service is available
5311(f) funds are available for intercity routes that are not profitable. A measure of a successful
program would be an increase in ridership and revenue on funded routes, resulting over time in
a reduced need for funding.
Because Rimrock receives funding from Montana Department of Transportation, Rimrock
reports to the MDT Transit Section.
Charter and other commuter services may fall under the authority of the Montana Public Service
Commission, but interstate routes operated by Rimrock Stages are not.

Marketing and Sales 6‐1
6 Marketing and Sales
Rimrock plans to expand upon its current marketing practices. At this time, people know about
Rimrock’s intercity services by:
Seeing Rimrock buses and signs at stations and on the road
Yellow pages
Rimrock web page
Booking tickets through Greyhound and other intercity carriers that contain a leg in
Montana and North Dakota (using the TRIPS system)
Trailways national marketing
Community meetings
Using Rimrock’s charter buses
Word of mouth
6.1 Positioning Strategy
A positioning strategy results in the image Rimrock wants to draw in the mind of customers, the
picture the customer visualizes of what Rimrock offers, in relation to the market situation, and
the competition. For Rimrock’s intercity passenger service, it can be summarized as:
“You relax while we drive”
Rimrock has very little direct competition for intercity services in Montana and is well positioned
to profit from the recent withdrawal of Greyhound from the market. As the only carrier
providing service across the state of Montana the routes Rimrock runs provide vital linkages to
residents of the many small communities.
Rimrock’s scheduled services offers the following benefits compared to other forms of
transportation:
Rimrock’s bus service is more affordable than flying, taking the train, or renting a car.
Rimrock is more affordable than driving when considering the entire cost of automobile
ownership, although many consider only the cost of fuel when calculating travel cost by car. Riding the bus can be less stressful than driving, especially in winter driving conditions. Accident rates are far lower among buses than private vehicles. The time in the vehicle can be spent doing something other than driving. People who cannot drive can use Rimrock. Social service agents can put their clients on Rimrock instead of setting up their own
transportation system.

6‐2 Rimrock Stages Business Plan ‐ DRAFT
In many cases, the bus offers more direct service than commercial air. It also serves more
communities. Rimrock offers friendlier customer service and better on‐time performance compared to
national bus carriers.
A Rimrock rider is helping the environment since intercity buses are among the most energy
efficient forms of transportation. Over the next five years, technology will make riding Rimrock even more convenient and
attractive since people will know exactly when their bus will arrive, and riders will have
internet access onboard the buses wherever cell coverage is available.
Rimrock’s freight service benefits customers by providing same‐day shipping in Montana and
North Dakota at a lower price than Fed Ex, UPS, or the postal service.
Charter services offer many of the same benefits as scheduled services. Compared to the
competition in the Billings area, Rimrock buses are comfortable; drivers are friendly; and guided
services are highly regarded.
Shop services offered by Rimrock are unique within the Billings market. Rimrock mechanics
know how to fix and maintain buses, and do so with a high level of integrity.
6.2 Sales Process
Rimrock sells tickets in multiple ways. Principally tickets are purchased over the phone or in
person from ticket agents at its bus stations. The ticket agents use the Greyhound TRIPS/MAX
system, which ties Rimrock into the national intercity network and tracks the number of seats
sold on a vehicle. Passengers can also purchase tickets online through Rimrock’s website or
through Greyhound.com.
Most freight business is through ongoing accounts with organizations such as tire dealerships,
local governments testing water, libraries moving books, and the American Red Cross moving
blood. Ticket agents across Rimrock’s service area are asked to develop new accounts, but
agents would benefit from more direction and tools from management.
Rimrock sells charter services over the phone or online based on ongoing relationships with
potential customers and reputation.
Shop services similarly are based primarily on reputation and relationships.
6.3 A Marketing Framework for Goal Setting
Achieving the goals set forward in this document will require marketing strategies focusing on
the “Five‐Ps” of marketing included in the widely‐used “Marketing Mix” model. The marketing

Marketing and Sales 6‐3
mix combines the roles different marketing elements play in promoting products and services
and delivering those products and services to customers.
1) Product – The products or services offered to your customer: Their physical attributes, what they do, how they differ from your competitors and what benefits they provide.
2) Price – How you price your product or service so that your price remains competitive but allows you to make a good profit.
3) Place (Also referred to as Distribution) – Where your business sells its products or services and how it gets those products or services to your customers.
4) Promotion – The methods used to communicate the features and benefits of your products or services to your target customers.
5) People – the level of service and the expertise and skills of the people who work for you, and how they can be used to set you apart from your competitors.
These Five‐Ps are addressed through the goals listed above, and through the objectives and
alternatives detailed in the TDP, and discussed previously. These goals, objectives and
alternatives are refined and expanded from the goals and objectives summary presented in the
Rimrock Stages Coordination Plan for Fiscal Year 2012 submitted to MDT on March 1, 2011.
6.4 Marketing Budget as Percent of Sales
Rimrock Stages has a need for more effective promotion, communication and advertising.
Current investments to achieve this objective are minimal. Annual expenditures for advertising
run approximately $5,500. We recommend increasing the level of effort and resources
dedicated towards marketing Rimrock services to $100,000 (2.5% of revenue) in Year 1.
Following the development of a plan, a reduction of this budgeted amount to $75,000 may be
desirable in subsequent years. Establishing a budget for marketing will enable funds to be spent
on these efforts.
6.5 Initial Marketing Strategies
A marketing budget would, at a minimum, allow for the cost of developing a marketing plan,
designing and printing marketing materials, and implementing core elements of a marketing
plan. The recommended approach for the marketing plan is to follow a strategy that starts by
implementing small, manageable projects to address fundamental information and promotion
needs. A first step is to develop collateral such as printed timetables, maps and other essential
service information. The next step is to communicate this information online. The third step is
to leverage these fundamental information elements in the process of seeking new customers,
with publicity, advertising, and public relations strategies. Missoula, Bozeman, Billings, Helena,
Kalispell and Great Falls are markets that make sense to target because of the presence of
universities, tourist destinations, and population centers.


Financial Management 7‐1
7 Financial Management
The overall budget for all Rimrock Stages services is approximately $4 million per year. Intercity
expenses make up $3.2 million of that budget. Rimrock reported $2,098,972 of expenses to
MDT during state Fiscal Year 2010 for expenses associated with Montana services.
Rimrock is currently recovering from a period of economic hardship, where the company went
into debt when a large service contract was cancelled after Rimrock purchased the equipment
to operate the contract. Most significant among the impacts of this situation is a note payable
with a balance of $1,049,386 as of September 30, 2010. As a compromise in the amount and
timing of payment, the Company agreed to pay a sum of $300,000 in monthly payments of
$5,000 until the sum is paid in full. If the Company makes these payments, the debtor has
agreed to defer on the note payable and interest. Rimrock is on schedule to complete the
payments by September 2011 when the debt is scheduled to be removed from the balance
sheet.
7.1 Annual Income Target
One purpose of this business plan is to set a course for Rimrock to have a positive net worth by
2016. As of the end of Rimrock’s fiscal year 2010 (September 30, 2010), Rimrock carried a deficit
of $1.3 million. This is down from $2.4 million at the end of FY 2005. At the end of FY 2011 the
deficit is scheduled to decrease to $300,000 when Rimrock completes payment on the
settlement. The Company is on schedule to have a positive net worth in 2012, as shown in
Figure 7‐1
Based on the financial situation, Rimrock’s net income must exceed expenses by $75,000 to
become profitable by September 30, 2015. Rimrock will exceed this target if it continues on its
current trajectory. Average net income over the past five years has been $161,655 per year,
including 5311(f) funds averaging $192,106, and the amount of the budget dedicated to paying
interest and related expenses has decreased dramatically over the past five years.
Figure 7‐2 shows the actual balance at the end of the past six fiscal years, and projects the net
worth five years into the future based on some assumptions with the new services. A
comparison against Figure 7‐1 shows the future costs and revenues associated with expanded
services results in a greater net worth than the status quo. Similarly, the profit margins shown in
Figure 7‐3 and Figure 7‐4 show a better projected outcome with the expanded services. Note
that these projections reflect a simplified five year projection. The first year of new services can
be more unreliable, with potentially higher costs and lower revenue.
7‐2 Rimrock Stages Business Plan ‐ DRAFT
[redacted proprietary information]
Figure 7‐1: Historical and projected company net worth (status quo).
[redacted proprietary information]
Figure 7‐2: Historical and projected company net worth (with expanded services).
Financial Management 7‐3
[redacted proprietary information]
Figure 7‐3: Annual profit margin (status quo)
[redacted proprietary information]
Figure 7‐4: Annual profit margin (with expanded services)
7.2 Income and Balance Statements
The income statements and balance sheets for Rimrock are included on the following pages for
the scenario with Greyhound changes.

7‐4 Rimrock Stages Business Plan ‐ DRAFT
Table 7‐1: Income Statement (with Expanded Services)
[redacted proprietary information]

Financial Management 7‐5
Table 7‐2: Balance Sheet (with Expanded Services)
[redacted proprietary information]

7‐6 Rimrock Stages Business Plan ‐ DRAFT
7.3 Budget Assumptions
Projections are based on a series of conservative assumptions. The status quo forecast assumes
costs and revenue increase at a rate of inflation of 3.5% per year. In addition, the budget for
new service assumes the following.
Revenue
Billings‐Fargo ridership and revenue per mile increases over 2010 revenue per mile as
shown in Table 7‐3; Great Falls‐Butte/Helena and Missoula‐Whitefish remain constant.
Missoula‐Billings revenue per mile based on calculations combining Greyhound and
Rimrock riders; assumes ridership remains constant.
Package express revenue per mile decreases slightly; commissions revenue per mile
remains constant.
Future maintenance shop revenue will decrease to $50,000 due to a competitor taking
some of the market share and management decision to focus on maintaining Rimrock
vehicles.
Table 7‐3: Revenue per Mile Summary
Corridor Current Revenue per Mile (2010) New
Passenger Package Express
Commissions Earned
Passenger Package Express
Commissions Earned
Billings‐Fargo $1.77 $0.22 $0.05 $1.97 $0.15 $0.05
Missoula – Billings $2.07 $0.22 $0.05 $2.46 $0.18 $0.05
Butte‐Great Falls $1.86 $0.22 $0.05 $1.86 $0.18 $0.05
Whitefish‐Missoula $1.15 $0.22 $0.05 $1.15 $0.18 $0.05
Costs
Costs per hour remain the same.
Costs per mile remains the same.
Future years' costs and revenue increase at an inflation rate of 3.5%.
Fixed costs increase 5% with the following exceptions:
Additional equipment
3 buses at $250,000 per bus, 9% APR, 5‐year loan
Annual cost per bus $62,275
Annual cost (3 buses) $186,825
Additional operating and lease costs on facilities
$30,200 per year as shown in Table 7‐4

Financial Management 7‐7
Table 7‐4: Increases in Facility Costs by Location
Location Current New Additional Costs
Billings Costs paid through commissions and fees $40,000 per year divided by provider
revenue; assume 50% of costs will be
Rimrock
$20,000
Missoula $100/yr + first $500 of maintenance Same $0
Bozeman $1,700 per month, split between
Rimrock and Greyhound ($10,200 per
year each)
$20,200 per year $10,200
Great Falls $6,274 $6,274 $0
Miles City $400 $400 $0
Butte Costs paid through commissions and fees Costs paid through commissions and fees $0
Helena Costs paid through commissions and fees Costs paid through commissions and fees $0
Total $30,200
Marketing
Increase to $50,000
7.4 Sensitivity Analysis
In any budgeting process there are always variables that are uncertain. For the expansion of
Rimrock Stages, the largest uncertainty is in revenue estimates. Cost estimates have uncertainty
based on fuel prices, vehicle maintenance, inflation rates, administrative costs, and exposure to
liability. Sensitivity analysis answers the question, "if these variables deviate from expectations,
what will the effect be?" Table 7‐5 summarizes the output for four different scenarios. The
Baseline Assumptions reflect the calculations under the budget assumptions discussed in
Section 7.3. The second scenario reflects higher costs, while the third reflects lower revenue.
The final scenario compares the new services against projections without the Greyhound
changes. All scenarios show an improvement against the current conditions.
Table 7‐5: Comparison of Cost and Revenue Under Differing Assumptions
Scenario Costs Pax
Revenue
Net Operating Deficit
Total Revenue
Total Profit (Loss)
Expanded services $4,294,669 $4,206,239 $(106,473) $4,637,160 $342,491
Using 2010 Cost Allocation model (7% higher costs) $4,592,393 $4,206,239 $(386,154) $4,637,160 $44,767
10% drop in former Greyhound ridership on Missoula‐Billings $4,294,669 $4,011,954 $(300,758) $4,442,875 $148,206
Current Conditions (status quo) $3,212,734 $2,506,898 $(705,836) $3,194,146 $(327,148)
7.5 Cost Allocation Model
The forecasts over the next five years are based on an assessment of previous costs and the
development of a cost allocation model. A fully allocated cost model allows Rimrock to know the

7‐8 Rimrock Stages Business Plan ‐ DRAFT
true cost of a service and allows an assessment of service alternatives. It is used to evaluate
service performance and to know the cost of any component of a service. A valuable tool in
developing contracts for services and coordination strategies, it is required for Rimrock to
comply with FTA policy.
A model that accounts for both hours and miles provides the most accurate measurement of
costs when average number of miles per hour varies between services. This would be the best
model when Rimrock is estimating the costs for services such as within Yellowstone or over the
Chief Joseph Highway where speed limits are lower than on major highways. However, for most
services Rimrock operates, a cost per hour or cost per mile can be used accurately, and have the
advantage of being easier to visualize and quicker to calculate.
Developing the cost allocation model requires a budget or statement of operating funds, the
miles of service, and the hours of service for a year. During this project we developed two cost
allocation models. Both follow standard transportation cost allocation models. The first model,
included in the appendix uses only operating costs. It is based on reported costs and miles to
MDT for calendar year 2010 and calculated service hours from existing schedules. The second
cost model is based on Rimrock’s chart of accounts for federal Fiscal Year 2010, and includes all
intercity costs. This second model is used in the financial analysis in the business plan.
The second cost model based on the company financial statements served as a data quality
check and a tool to document the translation between company financial statements and MDT
budgets and cost reimbursements. This model is based on Rimrock’s fiscal year, October 1 –
September 30. The methodology is documented in the appendix. The resulting equations,
shown in Table 7‐6, are in line with the cost allocations from data reported to MDT.
Table 7‐6: Cost Models Based on Rimrock Financial Reports (Rimrock FY 2010)
hours + miles Cost = 1.76 ($27.67 x # of hours in service + $0.83 x # of miles in
service)
Cost per hour Cost = $133 x # of hours in service
Cost per mile Cost = $2.29 x # of miles of service
The expansion of services should result in an efficiency of overhead and administrative costs.
Based on the income statements previously shown in Table 7‐1, the new services should operate
under the following cost allocation. Note, these models are based on 2010 costs and are
budgeted to increase 3.5% per year due to inflation.
Table 7‐7: Cost Model with New Services
hours + miles Cost = 1.65 ($27.67 x # of hours in service + $0.83 x # of miles in service)
Cost per hour Cost = $122 x # of hours in service
Cost per mile Cost = $2.18 x # of miles of service

Financial Management 7‐9
7.6 Implications of Greyhound Service Termination
On June 21, 2011 Greyhound dropped its service in Montana. This change presents a significant
opportunity for Rimrock to expand and improve its service and increase profits. Table 7‐8
through Table 7‐11 compare the levels of service, revenues, and costs for the new services
against the current services. Based on these projections, Rimrock’s passenger revenue per mile
should increase from $1.79 per mile to $2.11 per mile. In order to track performance, Rimrock
can refer to Table 7‐12, which translates the annual passenger revenue per mile to monthly
values.

7‐10
Table 7‐8: A
nnual Service Hours and M
iles by Route (status quo)
Annual
Route
Corridor
Dir
Hours M
T Hours ND
Total H
ours
Bus Mi M
T Bus Mi N
D
Total Bus Mi
Billings‐Fargo
0001
Billings‐Fargo
WB
1,539
2,082
3,620
93,034
135,750
228,784
0002
Billings‐Fargo
EB
1,539
2,082
3,620
93,034
135,750
228,784
0003
Billings‐Fargo
WB
1,629
1,901
3,530
93,034
135,750
228,784
0004
Billings‐Fargo
EB
1,629
1,901
3,530
93,034
135,750
228,784
Billings‐Fargo
Total
6,335
7,964
14,299
372,136
543,000
915,136
Missoula‐Billings
3
Missoula‐Billings
WB
2,639
0
2,639
133,588
0133,588
6
Missoula‐Billings
EB
2,639
0
2,639
133,588
0133,588
Missoula‐Billings Total
5,278
0
5,278
267,176
0267,176
Butte‐Great Falls
13
Butte‐Great Falls
SB
998
0
998
59,169
059,169
14
Butte‐Great Falls
NB
1,086
0
1,086
59,006
059,006
Butte‐Great Falls Total
2,084
0
2,084
118,175
0118,175
Whitefish‐M
issoula
17
Whitefish‐M
issoula
NB
1,274
0
1,274
50,960
050,960
18
Whitefish‐M
issoula
SB
1,278
0
1,278
51,100
051,100
Whitefish‐M
issoula Total
2,552
0
2,552
102,060
0102,060
Grand Total
16,249
7,964
24,213
859,547
543,000
1,402,547

7‐11
Table 7‐9: A
nnual Service Hours and M
iles by Route (expan
ded
service)
Annual
Route
Corridor
Dir
Hours M
T Hours ND
Total H
ours
Bus Mi M
T Bus Mi N
D
Total Bus Mi
Billings‐Fargo
0001
Billings‐Fargo
WB
1,539
2,082
3,620
93,034
135,750
228,784
0002
Billings‐Fargo
EB
1,539
2,082
3,620
93,034
135,750
228,784
0003
Billings‐Fargo
WB
1,629
1,901
3,530
93,034
135,750
228,784
0004
Billings‐Fargo
EB
1,629
1,901
3,530
93,034
135,750
228,784
Billings‐Fargo
Total
6,335
7,964
14,299
372,136
543,000
915,136
Missoula‐Billings
0005
Missoula‐Helena‐Billings
WB
2,457
0
2,457
128,492
0128,492
0007
Missoula‐Billings
WB
2,639
0
2,639
133,588
0133,588
0009
Missoula‐Billings
WB
2,639
0
2,639
133,588
0133,588
0006
Missoula‐Billings
EB
2,639
0
2,639
133,588
0133,588
0008
Missoula‐Helena‐Billings
EB
2,457
0
2,457
128,492
0128,492
0010
Missoula‐Billings
EB
2,639
0
2,639
133,588
0133,588
Missoula‐Billings Total
15,470
0
15,470
791,336
0791,336
Butte‐Great Falls
0011
Helena‐Great Falls
SB
581
0
581
33,033
033,033
0012
Helena‐Great Falls
NB
581
0
581
33,033
033,033
0013
Butte‐Great Falls
SB
998
0
998
59,169
059,169
0014
Butte‐Great Falls
NB
1,089
0
1,089
59,169
059,169
Butte‐Great Falls Total
3,249
0
3,249
184,404
0184,404
Whitefish‐M
issoula
0015
Whitefish‐M
issoula (future)
NB
946
0
946
44,044
044,044
0016
Whitefish‐M
issoula (future)
SB
971
0
971
44,165
044,165
0017
Whitefish‐M
issoula
NB
1,274
0
1,274
50,960
050,960
0018
Whitefish‐M
issoula
SB
1,278
0
1,278
51,100
051,100
Whitefish‐M
issoula Total 1
(planned
)
2,552
0
2,552
102,060
0102,060
Whitefish‐M
issoula Total (with future)
4,469
0
4,469
190,269
0190,269
Grand Total
29,523
7,964
37,487
1,538,145
543,000
2,081,145
Grand Total w
ithout Whitefish‐M
issoula future routes
27,605
7,964
35,569
1,449,936
543,000
1,992,936

7‐12
Table 7‐10: Cost and Revenue by Route (Status Quo)
[red
acted proprietary inform
ation]

7‐13
Table 7‐11: Cost and Revenue by Route (New services)
[red
acted proprietary inform
ation]

7‐14
Table 7‐12: Target Passenger Revenue per Mile
for Expan
ded Services
Billings‐Fargo
Butte‐Great Falls
Missoula‐Billings
Whitefish‐M
issoula
Total R
evenue/Mile
Current RPM
New RPM Current RPM
New RPM
Current RPM
New RPM
Current RPM
New RPM
Current RPM
New RPM
Jan
$1.56
$1.75
$1.87
$1.87
$1.96
$2.32
$1.14
$1.14
$1.63
$1.93
Feb
$1.24
$1.38
$1.70
$1.70
$1.70
$2.02
$0.91
$0.91
$1.34
$1.59
Mar
$1.45
$1.62
$1.61
$1.61
$1.86
$2.21
$0.91
$0.91
$1.50
$1.77
Apr
$1.33
$1.48
$1.62
$1.62
$1.75
$2.08
$0.88
$0.88
$1.40
$1.66
May
$1.54
$1.72
$1.83
$1.83
$1.75
$2.08
$0.94
$0.94
$1.56
$1.85
Jun
$2.14
$2.39
$1.88
$1.88
$2.30
$2.73
$1.17
$1.17
$2.08
$2.45
Jul
$2.46
$2.74
$2.19
$2.19
$2.50
$2.97
$1.46
$1.46
$2.37
$2.80
Aug
$2.37
$2.65
$1.95
$1.95
$2.47
$2.93
$1.54
$1.54
$2.30
$2.71
Sep
$1.73
$1.93
$1.50
$1.50
$1.84
$2.18
$0.96
$0.96
$1.67
$1.97
Oct
$1.62
$1.81
$1.55
$1.55
$1.83
$2.17
$0.85
$0.86
$1.60
$1.89
Nov
$1.57
$1.75
$2.36
$2.36
$2.38
$2.82
$1.35
$1.35
$1.77
$2.09
Dec
$2.14
$2.39
$2.28
$2.28
$2.51
$2.98
$1.68
$1.68
$2.19
$2.59
Grand
Total
$1.77
$1.97
$1.86
$1.86
$2.07
$2.46
$1.15
$1.15
$1.79
$2.11

Financial Management 7‐15
7.7 Financial Projections for Implementation Plan Alternatives
The TDP presents extensive recommendations for alternatives to achieve Rimrock’s goals of
increasing ridership, improving management and creating new and expanded service options.
Achieving these goals should improve Rimrock’s business performance. However implementing
these alternatives will incur costs. The budget presented above reflects the projected cost and
revenue implications of investing $50,000 for the year one implementation strategies identified
in the TDP.
Beyond the $50,000 budget in year 1, Rimrock will need to consider costs compared to benefits.
Many of the alternatives are difficult to directly associate with accurate revenue increases,
therefore, the key consideration is based on a revenue target. In the most basic terms, in a 2
million mile per year business, for every $100,000 in increased costs, revenue must increase by
$0.05 per mile.


Appendix A: Methodology for Cost Model A‐1
Appendix A: Methodology for Cost Model
In future years, we recommend that Rimrock develop a budget based on the procedures
developed for this project. Costs and revenues must be divided in two ways:
Between different parts of the business
Intercity costs and revenue must be divided between the states.
The Rimrock chart of accounts allows for easy distribution of revenues between different parts
of the business. Cost accounts are not as easily attributed. Table A‐ shows the Chart of Accounts
used by Rimrock. For each Account, it notes how the expenses for that account were distributed
between the three different sectors of the business; it also shows which line item on the
Montana Department of Transportation application for funding and quarterly report the
account is associated with.
Each Rimrock account is associated with no more than one MDT line item except for salaries. For
a recommended translation of payroll expenses into the categories on the MDT forms, we
analyzed the pay schedule by category. The payroll for each employee was allocated in two
ways. Like the other items in Rimrock Chart of Accounts, the employee was allocated across the
different business categories. Additionally, since MDT has different line items for drivers,
mechanics, dispatch, and administrative functions, each employee was allocated across those
items as well. The percent allocations by employee are shown in Table A‐1, and the resulting
allocation by business sector and MDT employee type is shown in Table A‐2.
Table A‐1: Chart of Accounts with Distribution by Business Category
Account
Associated M
DT
Line Item
Notes
Sched
ule %
Charter %
Shop %
Operating Revenue
Passengers 6d2 100% 0% 0%
Charters n/a 0% 100% 0%
State of MT Operating Assistance 6d11 100% 0% 0%
Express n/a 100% 0% 0%
Shop n/a 0% 0% 100%
Total Revenue 78% 18% 5%
Cost of Operations
Salaries/Wages 1a,1b schedule drivers, charter drivers, mechanics 76% 20% 4%
Payroll Taxes 1d 82% 14% 4%
Workers' Comp 1d 82% 14% 4%
Pension plan 1d 82% 14% 4%
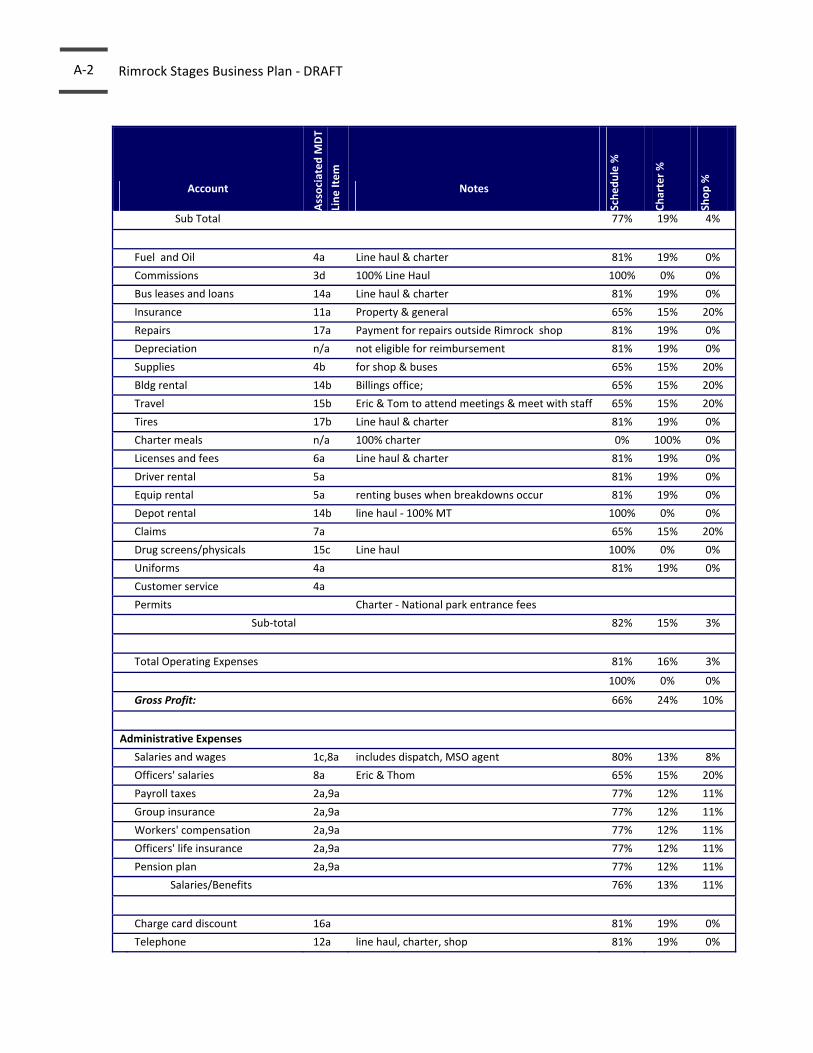
A‐2 Rimrock Stages Business Plan ‐ DRAFT
Account
Associated M
DT
Line Item
Notes
Sched
ule %
Charter %
Shop %
Sub Total 77% 19% 4%
Fuel and Oil 4a Line haul & charter 81% 19% 0%
Commissions 3d 100% Line Haul 100% 0% 0%
Bus leases and loans 14a Line haul & charter 81% 19% 0%
Insurance 11a Property & general 65% 15% 20%
Repairs 17a Payment for repairs outside Rimrock shop 81% 19% 0%
Depreciation n/a not eligible for reimbursement 81% 19% 0%
Supplies 4b for shop & buses 65% 15% 20%
Bldg rental 14b Billings office; 65% 15% 20%
Travel 15b Eric & Tom to attend meetings & meet with staff 65% 15% 20%
Tires 17b Line haul & charter 81% 19% 0%
Charter meals n/a 100% charter 0% 100% 0%
Licenses and fees 6a Line haul & charter 81% 19% 0%
Driver rental 5a 81% 19% 0%
Equip rental 5a renting buses when breakdowns occur 81% 19% 0%
Depot rental 14b line haul ‐ 100% MT 100% 0% 0%
Claims 7a 65% 15% 20%
Drug screens/physicals 15c Line haul 100% 0% 0%
Uniforms 4a 81% 19% 0%
Customer service 4a
Permits Charter ‐ National park entrance fees
Sub‐total 82% 15% 3%
Total Operating Expenses 81% 16% 3%
100% 0% 0%
Gross Profit: 66% 24% 10%
Administrative Expenses
Salaries and wages 1c,8a includes dispatch, MSO agent 80% 13% 8%
Officers' salaries 8a Eric & Thom 65% 15% 20%
Payroll taxes 2a,9a 77% 12% 11%
Group insurance 2a,9a 77% 12% 11%
Workers' compensation 2a,9a 77% 12% 11%
Officers' life insurance 2a,9a 77% 12% 11%
Pension plan 2a,9a 77% 12% 11%
Salaries/Benefits 76% 13% 11%
Charge card discount 16a 81% 19% 0%
Telephone 12a line haul, charter, shop 81% 19% 0%
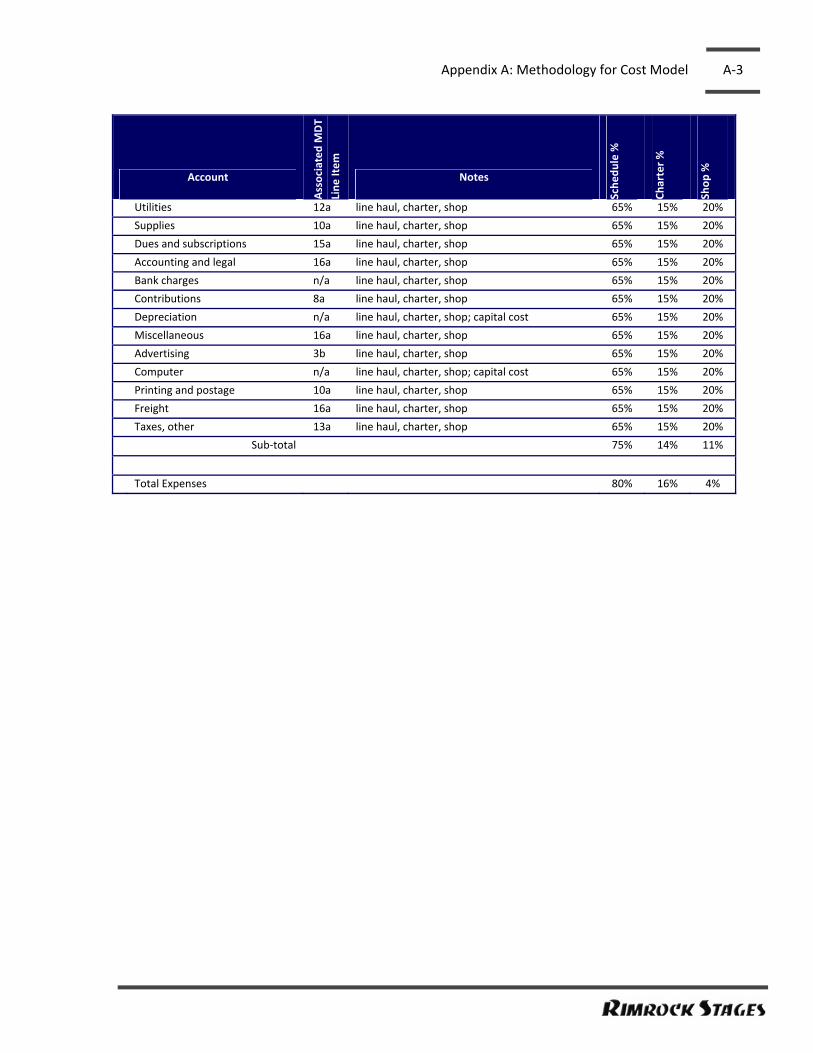
Appendix A: Methodology for Cost Model A‐3
Account
Associated M
DT
Line Item
Notes
Sched
ule %
Charter %
Shop %
Utilities 12a line haul, charter, shop 65% 15% 20%
Supplies 10a line haul, charter, shop 65% 15% 20%
Dues and subscriptions 15a line haul, charter, shop 65% 15% 20%
Accounting and legal 16a line haul, charter, shop 65% 15% 20%
Bank charges n/a line haul, charter, shop 65% 15% 20%
Contributions 8a line haul, charter, shop 65% 15% 20%
Depreciation n/a line haul, charter, shop; capital cost 65% 15% 20%
Miscellaneous 16a line haul, charter, shop 65% 15% 20%
Advertising 3b line haul, charter, shop 65% 15% 20%
Computer n/a line haul, charter, shop; capital cost 65% 15% 20%
Printing and postage 10a line haul, charter, shop 65% 15% 20%
Freight 16a line haul, charter, shop 65% 15% 20%
Taxes, other 13a line haul, charter, shop 65% 15% 20%
Sub‐total 75% 14% 11%
Total Expenses 80% 16% 4%

A‐4 Rimrock Stages Business Plan ‐ DRAFT
Table A‐2: Allocation of Pay Schedule by Business Category
Allocation
Job Duty Sched
ule Driver
Charter Driver
Mechanic ‐
Sched
ule
Mechanic ‐
Charter
Mechanic ‐
Reven
ue
Dispatch ‐
Sched
ule
Admin ‐ Sched
ule
Admin ‐ Charter
Admin ‐ Shop
SCH DRIVER: MSLA‐WHITEFISH, MSLA‐BUTTE 100% SCH DRIVER: MLS CITY‐FARGO, ND 100% SCH DRIVER: MSLA‐WHITEFISH, MSLA‐BUTTE 100% CHARTER DRIVER 100% CHARTER DRIVER 100% SCH DRIVER: BLGS‐BUTTE, MT 100% SCH DRIVER: MLS CITY‐FARGO, ND 100% SCH DRIVER: MLS CITY‐FARGO, ND 100% SCH DRIVER: MSLA‐WHITEFISH, MSLA‐BUTTE 100% SCH DRIVER: BLGS‐MLS CITY, MT 100% SCH DRIVER: BLGS‐BUTTE, MT 100% SCH DRIVER: MLS CITY‐FARGO, ND 100% SCH DRIVER: BLGS‐MLS CITY, MT 100% SCH DRIVER: GTF‐BUTTE, MT 100% SCH DRIVER: MLS CITY‐FARGO, ND 100% CHARTER DRIVER 100% SCH DRIVER: MLS CITY‐FARGO, ND 100%
CHARTER DRIVER 100% CHARTER DRIVER 100% CHARTER DRIVER 100% CHARTERS & SCHEDULE 50% 50% SCH DRIVER: GTF‐BUTTE, MT 100% CHARTER DRIVER 100% CHARTERS & SCHEDULE 50% 50% CHARTERS & SCHEDULE 50% 50% CHARTERS & SCHEDULE 50% 50% CHARTERS & SCHEDULE 50% 50% CHARTERS & SCHEDULE 50% 50%
RECEPTIONIST, DEPOT REPORTS, CUST SERVICE 70% 30% MISSOULA BUS DEPOT MANAGER 100% TICKET AGENT ‐ MISSOULA DEPOT 100% SAFETY SUPERVISOR, DISPATCH 100% SHOP FOREMAN 70% 15% 15% CONTROLLER, CUST SERVICE 70% 15% 15%ADMIN ASSISTANT, HR, CUST SERVICE 70% 15% 15%
RECLAIMS, PARTIAL FUEL REPORTING 70% 15% 15%DRIVER COORDINATOR ‐ GTF, MT 100% TICKET AGENT ‐ MISSOULA DEPOT 100% TICKET AGENT ‐ MISSOULA DEPOT 100%

Appendix A: Methodology for Cost Model A‐5
Allocation
Job Duty Sched
ule Driver
Charter Driver
Mechanic ‐
Sched
ule
Mechanic ‐
Charter
Mechanic ‐
Reven
ue
Dispatch ‐
Sched
ule
Admin ‐ Sched
ule
Admin ‐ Charter
Admin ‐ Shop
MECHANIC 70% 15% 15% MECHANIC 70% 15% 15% MECHANIC 70% 15% 15% MECHANIC (HIRED AT $16.50 PER HOUR, $35,000)NEW HIRE 70% 15% 15% BUS CLEANER 70% 15% 15%
BUS CLEANER 70% 15% 15% BUS CLEANER 70% 15% 15% BUS CLEANER 70% 15% 15%
VICE PRESIDENT, DISPATCH, ALL CO. OPERATIONS 70% 15% 15%PRESIDENT, RECLAIMS, GLI 70% 15% 15%
Table A‐3: Payroll by Business Sector and Functions
Salaries Benefits Total Payroll
Schedule Driver $466,216 $44,919 $511,134
Charter Driver $131,794 $6,812 $138,606
Mechanic ‐ Schedule $146,757 $12,743 $159,501
Mechanic ‐ Charter $31,448 $2,731 $34,179
Mechanic ‐ Revenue $31,448 $2,731 $34,179
Dispatch ‐ Schedule $33,350 $9,894 $43,244
Admin ‐ Schedule $176,014 $21,808 $197,822
Admin ‐ Charter $36,674 $4,799 $41,473
Admin ‐ Shop $30,532 $4,547 $35,079
Total $1,084,233 $110,983 $1,195,216
Given the percentages shown in Table A‐1, the revenues and costs for Rimrock FY 2010 were
distributed by business sector as shown in Table A‐3. The next step was to distribute the costs
and revenues shown in the Schedule business sector according to costs associated with vehicle‐
hours, vehicle‐miles, or fixed costs Table A‐4). Finally the costs in the miles and hours categories
are divided by the total number of miles and hours in a year; the fixed costs are calculated as a
percentage of the total costs. The result is the cost allocation model:
hours + miles Cost = 1.76 ($27.67 x # of hours in service + $0.83 x # of miles in service)
Cost per hour Cost = $133 x # of hours in service
Cost per mile Cost = $2.29 x # of miles of service
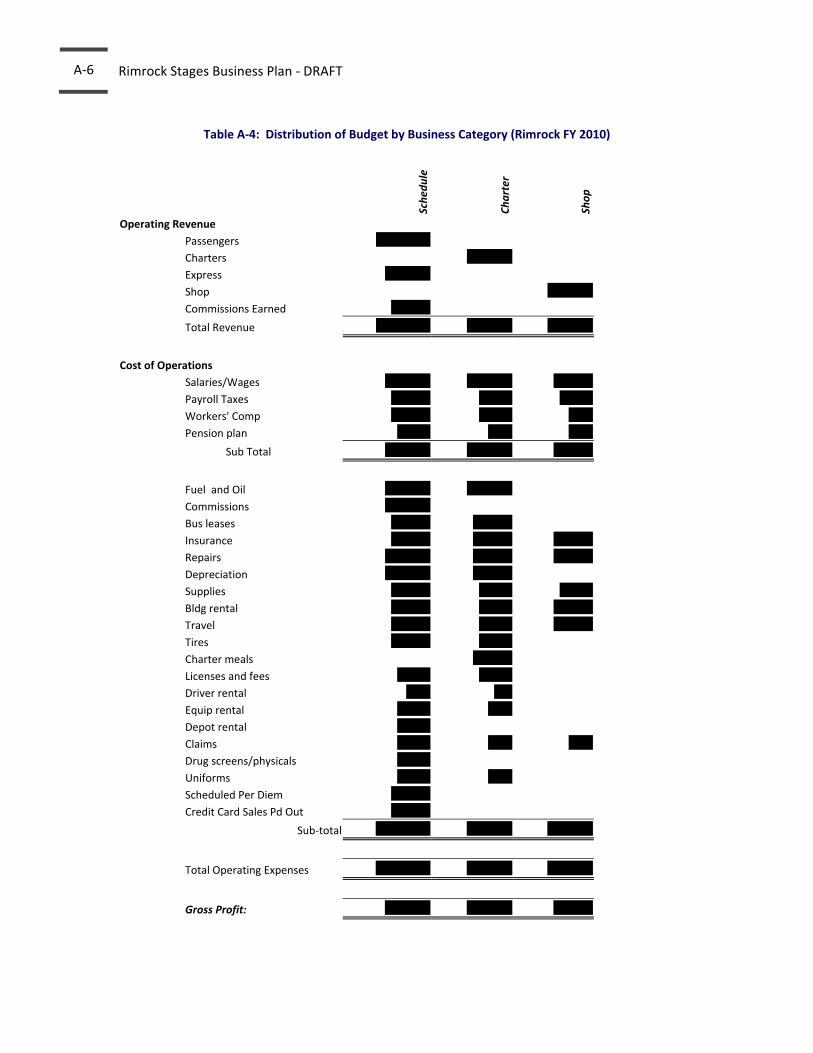
A‐6 Rimrock Stages Business Plan ‐ DRAFT
Table A‐4: Distribution of Budget by Business Category (Rimrock FY 2010)
Sched
ule
Charter
Shop
Operating Revenue
Passengers $2,670,424
Charters $771,983
Express $282,708
Shop $195,533
Commissions Earned $69,099
Total Revenue $3,022,230 $771,983 $195,533
Cost of Operations
Salaries/Wages $580,885 $154,697 $29,802
Payroll Taxes $59,460 $9,840 $2,816
Workers' Comp $20,533 $3,398 $972
Pension plan $5,310 $879 $251
Sub Total $666,189 $168,814 $33,841
Fuel and Oil $677,021 $156,236
Commissions $610,391
Bus leases $51,090 $11,790
Insurance $79,668 $18,385 $24,513
Repairs $241,726 $55,783 $50,000
Depreciation $135,610 $31,295
Supplies $12,784 $2,950 $3,934
Bldg rental $42,265 $9,753 $13,005
Travel $34,575 $7,979 $10,639
Tires $42,887 $9,897
Charter meals $24,205
Licenses and fees $5,662 $1,307
Driver rental $156 $36
Equip rental $4,001 $923
Depot rental $8,153
Claims $2,245 $518 $691
Drug screens/physicals $3,102
Uniforms $1,407 $325
Scheduled Per Diem $30,797
Credit Card Sales Pd Out $39,886
Sub‐total $2,023,426 $331,381 $102,781
Total Operating Expenses $2,689,615 $500,195 $136,622
Gross Profit: $332,615 $271,788 $58,910

Appendix A: Methodology for Cost Model A‐7
Sched
ule
Charter
Shop
Administrative Expenses
Salaries and wages $205,857 $32,548 $19,796
Officers' salaries $63,165 $14,577 $19,435
Payroll taxes $25,862 $3,915 $3,710
Group insurance $65,678 $9,943 $9,421
Workers' compensation $9,033 $1,368 $1,296
Officers' life insurance $3,098 $469 $444
Pension plan $0 $0 $0
Salaries/Benefits $372,693 $62,819 $54,102
Bank charges $6,733 $1,554 $2,072
Charge card discount $34,862 $8,045
Accounting and legal $8,996 $2,076 $2,768
Telephone $20,234 $4,669
Utilities $10,999 $2,538 $3,384
Supplies $10,766 $2,484 $3,312
Advertising $3,535 $816 $1,088
Dues and subscriptions $9,720 $2,243 $2,991
Freight $1,313 $303 $404
Contributions $5,525 $1,275 $1,700
Depreciation $3,992 $921 $1,228
Taxes, other $782 $180 $241
Computer $3,365 $777 $1,035
Printing and postage $1,950 $450 $600
Miscellaneous $3,965 $915 $1,220
Sub‐total $499,429 $92,065 $76,145
Net Income/(Loss) ($166,815) $179,723 ($17,235)
Total Expenses $3,189,045 $592,260 $212,767

A‐8 Rimrock Stages Business Plan ‐ DRAFT
Table A‐5:Cost Allocation Model 2 ‐ Distribution of Schedule Bus Income Statement by Cost Allocation Category
Schedule Revenue and Cost by Category
Vehicle‐Hours Vehicle‐Miles Fixed
Operating Revenue
Passengers $2,670,424
State of MT Operating Assistance $350,001
Express $351,807
Total Revenue $ ‐ $ 3,372,232 $ ‐
Cost of Operations
Salaries/Wages $580,885
Payroll Taxes $63,437
Workers' Comp $21,687
Pension plan $3,852
Sub Total $ 669,862 $ ‐ $ ‐
Fuel and Oil $677,112
Commissions $650,275
Bus leases and loans $51,091
Insurance $120,456
Repairs $282,350
Depreciation $156,945
Supplies $12,784
Bldg rental $42,265
Travel $34,574
Tires $42,887
Licenses and fees $5,562
Driver rental $156
Equip rental $4,000
Depot rental $8,153
Claims $2,245
Drug screens/physicals $3,102
Uniforms $1,407
Sub‐total $ 156 $ 1,159,295 $ 935,916
Total Operating Expenses $ 670,018 $ 1,159,295 $ 935,916
Gross Profit: $ (670,018) $ 2,212,937 $ (935,916)

Appendix A: Methodology for Cost Model A‐9
Schedule Revenue and Cost by Category
Vehicle‐Hours Vehicle‐Miles Fixed
Administrative Expenses
Salaries and wages $205,857
Officers' salaries $63,165
Payroll taxes $22,136
Group insurance $17,215
Workers' compensation $7,953
Officers' life insurance $3,098
Pension plan $1,434
Salaries/Benefits $ ‐ $ ‐ $320,858
Charge card discount $34,862
Telephone $20,234
Utilities $10,999
Supplies $10,766
Dues and subscriptions $9,688
Accounting and legal $8,996
Bank charges $6,733
Contributions $5,525
Depreciation $3,992
Miscellaneous $3,949
Advertising $3,535
Computer $3,365
Printing and postage $1,951
Freight $1,313
Taxes, other $741
Sub‐total $ ‐ $ ‐ $447,506
Total Expenses $ 670,018 $ 1,159,295 $ 1,383,422
Vehicle‐Hours Vehicle‐Miles Fixed Cost
Hours 24,213
Miles 1,402,547
Fixed Cost Factor $27.67 $0.83 $1.76
Cost per hour; cost per mile $132.69 $2.29
This model presents different results from Cost Allocation Model 1, yet they are in line with each
other. Contributing to those differences are the calendars; the exclusion of capital costs; and
differences in processes between the two methods of assigning costs to Montana intercity
services.

A‐10 Rimrock Stages Business Plan ‐ DRAFT
Table A‐6: Cost Allocation Model 1 per MDT Quarterly Reports (2010 Calendar Year)
Cost by Category
Operating Costs CY 2010 Costs
Vehicle‐Hours
Vehicle‐Miles
Fixed Costs
1. Labor a. Operator's wages $338,995 $338,995 b. Mechanic's wages $55,273 $55,273 c. Dispatcher's wages $15,174 $15,174
2. Fringe Benefits a. Operator's/Mechanic/Dispatcher Fringe $59,282 $59,282
3. Services a. Professional and technical services $15,929 $15,929 b. Advertising fees $5,956 $5,956 c. Custodial services $5,520 $5,520 d. Other services $0 $0
4. Materials & Supplies Consumed a. Fuel and Oil $434,454 $434,454 b. Other materials and supplies $21,284 $21,284
5. Purchased Transportation Services a. Purchased transportation services $4,390 $4,390
6. Taxes a. Vehicle Licensing and registration fees $6,235 $6,235
7. Other Operating Expenses a. Other Expenses $273,105 $273,105
Administrative Costs 8. Labor
a. Other salaries (Manager and Administrative personnel)
$218,173
$218,173
9. Fringe Benefits a. Other salaries fringe benefits distribution $39,811 $39,811
10. Materials and Supplies a. Office Supplies $14,582 $14,582
11. Casualty & Liability Costs a. Casualty and Liability Costs $72,520 $72,520
12. Utilities a. Utilities (Gas, Electric, Sewer, Phone and Internet)
$27,197
$27,197
13. Taxes a. Property tax $648 $648
14. Leases and Rentals a. Vehicle $0 b. Facilities $79,576 $79,576
15. Miscellaneous Expense a. Dues and subscriptions $6,062 $6,062 b. Travel and meetings $3,199 $3,199 c. Drug Testing $3,514 $3,514 d. Promotional/Coordination Ridesharing $0 $0 e. Indirect Cost (Attach plan from Grantee) $0 $0
16. Other Administrative Expenses a. Other expenses (personnel, admin) $713 $713
Maintenance Costs 17. Maintenance Costs
a. Vehicle maintenance parts & service $168,439 $168,439 b. Tires and tubes $32,310 $32,310
Total System Operating Costs $1,902,342 $473,115 $635,204 $794,024

Appendix A: Methodology for Cost Model A‐11
Vehicle‐Hours
Vehicle‐Miles
Fixed Cost
Hours 16,291
Miles 847,456
Fixed Cost Factor 1.72 Average Unit Cost $29.04 $0.75 Cost per Hour $116.77 Cost per mile 2.24
Table A‐7: Alternative Views of Cost Models 1 Based on MDT Quarterly Reports (CY 2010)
hours + miles Cost = 1.72 ($29.04 x # of hours in service + $0.75 x # of miles in service)
Cost per hour Cost = $117 x # of hours in service
Cost per mile Cost = $2.24 x # of miles of service