risc-v debugger - lauterbach.com · processor architecture manuals ... risc-v debugger ... brief...
TRANSCRIPT

RISC-V Debugger
TRACE32 Online Help
TRACE32 Directory
TRACE32 Index
TRACE32 Documents ......................................................................................................................
ICD In-Circuit Debugger ................................................................................................................
Processor Architecture Manuals ..............................................................................................
RISC-V ......................................................................................................................................
RISC-V Debugger ................................................................................................................. 1
Introduction ....................................................................................................................... 4
Brief Overview of Documents for New Users 4
Demo and Start-up Script 4
Warning .............................................................................................................................. 5
Quick Start of the JTAG Debugger .................................................................................. 6
Troubleshooting ................................................................................................................ 8
SYStem.Up Errors 8
FAQ ..................................................................................................................................... 9
RISC-V Specific Implementations 11
Debug Specification for External Debug Support 11
Breakpoints 12
Software Breakpoints 12
On-chip Breakpoint Resources 12
On-chip Breakpoints for Instructions 12
On-chip Breakpoints for Data 12
Examples for On-Chip Breakpoints 13
Access Classes 14
CPU specific SYStem Commands ................................................................................... 15
SYStem.CONFIG.state Display target configuration 15
SYStem.CONFIG Configure debugger according to target topology 16
<parameters> describing the “DebugPort” 17
<parameters> describing the “JTAG” scan chain and signal behavior 19
SYStem.CPU Select the used CPU 22
SYStem.CpuAccess Run-time memory access (intrusive) 22
SYStem.JtagClock Define JTAG frequency 23
SYStem.LOCK Tristate the JTAG port 23
SYStem.MemAccess Run-time memory access (non-intrusive) 24
RISC-V Debugger 1 ©1989-2018 Lauterbach GmbH

SYStem.Mode Establish the communication with the target 25
SYStem.Option Address32 Define address format display 25
SYStem.Option EnReset Allow the debugger to drive nRESET (nSRST) 26
SYStem.Option IMASKASM Disable interrupts while single stepping 26
SYStem.Option TRST Allow debugger to drive TRST 26
SYStem.state Display SYStem.state window 27
Target Adaption ................................................................................................................. 28
Connector Type and Pinout 28
RISC-V Debug Cable with 20 pin Connector 28
Converter ARM-20 to ALTERA-10/RISCV-10 29
Support ............................................................................................................................... 30
Available Tools 30
Compilers 30
Products ............................................................................................................................. 31
Product Information 31
Order Information 31
RISC-V Debugger 2 ©1989-2018 Lauterbach GmbH

RISC-V Debugger
Version 22-Mar-2018
04-Sep-17 New manual.
RISC-V Debugger 3 ©1989-2018 Lauterbach GmbH

Introduction
This manual serves as a guideline for debugging one or multiple RISC-V cores via TRACE32.
Please keep in mind that only the Processor Architecture Manual (the document you are reading at the moment) is CPU specific, while all other parts of the online help are generic for all CPUs supported by Lauterbach. So if there are questions related to the CPU, the Processor Architecture Manual should be your first choice.
Brief Overview of Documents for New Users
Architecture-independent information:
• “Debugger Basics - Training” (training_debugger.pdf): Get familiar with the basic features of a TRACE32 debugger.
• “T32Start” (app_t32start.pdf): T32Start assists you in starting TRACE32 PowerView instances for different configurations of the debugger. T32Start is only available for Windows.
• “General Commands” (general_ref_<x>.pdf): Alphabetic list of debug commands.
Architecture-specific information:
• “Processor Architecture Manuals”: These manuals describe commands that are specific for the processor architecture supported by your debug cable. To access the manual for your processor architecture, proceed as follows:
- Choose Help menu > Processor Architecture Manual.
• “RTOS Debuggers” (rtos_<x>.pdf): TRACE32 PowerView can be extended for operating system-aware debugging. The appropriate RTOS manual informs you how to enable the OS-aware debugging.
PRACTICE Script Language:
• “Training Script Language PRACTICE” (training_practice.pdf)
• “PRACTICE Script Language Reference Guide” (practice_ref.pdf)
Demo and Start-up Script
tbd.
RISC-V Debugger 4 ©1989-2018 Lauterbach GmbH

Warning
NOTE: To prevent debugger and target from damage it is recommended to connect or disconnect the debug cable only while the target power is OFF.
Recommendation for the software start:
1. Disconnect the debug cable from the target while the target power is off.
2. Connect the host system, the TRACE32 hardware and the debug cable.
3. Power ON the TRACE32 hardware.
4. Start the TRACE32 software to load the debugger firmware.
5. Connect the debug cable to the target.
6. Switch the target power ON.
7. Configure your debugger e.g. via a start-up script.
Power down:
1. Switch off the target power.
2. Disconnect the debug cable from the target.
3. Close the TRACE32 software.
4. Power OFF the TRACE32 hardware.
RISC-V Debugger 5 ©1989-2018 Lauterbach GmbH

Quick Start of the JTAG Debugger
Starting up the debugger is done as follows:
1. Select the device prompt for the ICD Debugger and reset the system.
The device prompt B:: is normally already selected in the command line. If this is not the case enter B:: to set the correct device prompt. The RESet command is only necessary if you do not start directly after booting the TRACE32 development tool.
2. Specify the CPU specific settings.
The default values of all other options are set in such a way that it should be possible to work without modification. Please consider that this is probably not the best configuration for your target.
3. Inform the debugger about read-only address ranges (ROM, FLASH).
The B(reak)Onchip information is necessary to decide where on-chip breakpoints must be used. On-chip breakpoints are necessary to set program breakpoints to FLASH/ROM.
4. Specify ranges where the access width is restricted.
If a memory location can only be accessed with a certain bus width you can use MAP.BUS8 / MAP.BUS16 / MAP.BUS32 to force the debugger to use solely the according load or store instructions. This allows for example to have a byte-by-byte dump of a 32 bit wide memory area, where a byte access would cause an exception.
5. Enter debug mode.
This command resets the CPU and enters debug mode. After this command is executed it is possible to access memory and registers.
B::
RESet
SYStem.CPU <cputype>
MAP.BOnchip 0x060000000++3FFFF
MAP.BUS32 0x060000000++1FFFF
SYStem.Up
RISC-V Debugger 6 ©1989-2018 Lauterbach GmbH

6. Load the program.
The format of the Data.LOAD command depends on the file format generated by the compiler. Refer to Supported Compilers to find the command that is necessary for your compiler.
A detailed description of the Data.LOAD command and all available options is given in the “General Commands Reference”.
A simple start sequence without EPROM simulator is shown below. This sequence can be written to a PRACTICE script (*.cmm, ASCII file format) and executed with the command DO <filename>.
*) These commands open windows on the screen. The window position can be specified with the WinPOS command.
Data.LOAD <file> /LONG ;load the compiler output.;the option /LONG tells the;debugger to use 32 bit accesses
B:: ; Select the ICD device prompt
WinCLEAR ; Clear all windows
MAP.BOnchip 0x60000000++0xfffff ; Specify where FLASH/ROM is
MAP.BUS32 0x50000000++0x1ffff ; Force the debugger to access this ; area 32 bit wide
SYStem.Up ; Reset the target and enter debug; mode
Data.LOAD.elf xtensa_project ; Load the application
Register.Set PC _ResetVector ; Set the PC to start point
Register.Set a1 0x63FFFFFC ; Set the stack pointer to address ; 0x63FFFFFC
Data.List ; Open source code window *)
Register /SpotLight ; Open register window *)
Frame.view /Locals /Caller ; Open the stack frame with ; local variables *)
Var.Watch %SpotLight flags ast ; Open watch window for variables *)
Break.Set 0x60100000 /Program ; Set software breakpoint to address; 0x60100000 (address 0x60100000 ; outside of BOnchip range)
Break.Set 0x60001000 /Program ; Set on-chip breakpoint; to address 0x60001000 (address; 0x60001000 is within BOnchip range)
RISC-V Debugger 7 ©1989-2018 Lauterbach GmbH

Troubleshooting
SYStem.Up Errors
The SYStem.Up command is the first command of a debug session where communication with the target is required. If you receive error messages while executing this command, this may have the following reasons:
• The target has no power.
• The target is in reset.
• The core is not enabled.
• There is logic added to the JTAG state machine.
• There are additional loads or capacities or serial resistors on the JTAG lines.
• There is a short circuit on at least one of the output lines of the core.
• There are stubs on the signal line.
RISC-V Debugger 8 ©1989-2018 Lauterbach GmbH

FAQ
Debugging via VPN
Ref: 0307
The debugger is accessed via Internet/VPN and the performance is very slow. What can be done to improve debug performance?
The main cause for bad debug performance via Internet or VPN are low data throughput and high latency. The ways to improve performance by the debugger are limited:
In PRACTICE scripts, use "SCREEN.OFF" at the beginning of the scriptand "SCREEN.ON" at the end. "SCREEN.OFF" will turn off screenupdates. Please note that if your program stops (e.g. on error) without exe-cuting "SCREEN.OFF", some windows will not be updated.
"SYStem.POLLING SLOW" will set a lower frequency for target statechecks (e.g. power, reset, jtag state). It will take longer for the debugger torecognize that the core stopped on a breakpoint.
"SETUP.URATE 1.s" will set the default update frequency ofData.List/Data.dump/Variable windows to 1 second (the slowest possiblesetting).
prevent unneeded memory accesses using "MAP.UPDATEONCE[address-range]" for RAM and "MAP.CONST [address--range]" forROM/FLASH. Address ranged with "MAP.UPDATEONCE" will read thespecified address range only once after the core stopped at a breakpoint ormanual break. "MAP.CONST" will read the specified address range onlyonce per SYStem.Mode command (e.g. SYStem.Up).
RISC-V Debugger 9 ©1989-2018 Lauterbach GmbH

Setting a Software Breakpoint fails
Ref: 0276
What can be the reasons why setting a software breakpoint fails?
Setting a software breakpoint can fail when the target HW is not able to implement the wanted breakpoint. Possible reasons:
The wanted breakpoint needs special features that are only possible torealize by the trigger unit inside the controller.
Example: Read, write and access (Read/Write) breakpoints ("type" in Break.Set window). Breakpoints with checking in real-time for data-values ("Data"). Breakpoints with special features ("action") like TriggerTrace, TraceEnable, TraceOn/TraceOFF.
TRACE32 can not change the memory.Example: ROM and Flash when no preparation with FLASH.Create, FLASH.TARGET and FLASH.AUTO was made. All type of memory if the memory device is missing the necessary control signals like WriteEnable or settings of registers and SpecialFunctionRegisters (SFR).
Contrary settings in TRACE32.Like: MAP.BOnchip for this memory range. Break.SELect.<breakpoint-type> Onchip (HARD is only available for ICE and FIRE).
RTOS and MMU:If the memory can be changed by Data.Set but the breakpoint doesn't work it might be a problem of using an MMU on target when setting the breakpoint to a symbolic address that is different than the writable and intended memory location.
RISC-V Debugger 10 ©1989-2018 Lauterbach GmbH

RISC-V Specific Implementations
Debug Specification for External Debug Support
The Lauterbach debug driver for RISC-V is developed according to the RISC-V debug specification for external debug support. The latest version can be found at https://www.sifive.com/documentation/risc-v/risc-v-external-debug-support/
RISC-V Debugger 11 ©1989-2018 Lauterbach GmbH

Breakpoints
For information about setting breakpoints, refer to the Break.Set command.
Software Breakpoints
If a software breakpoint is used, the original code at the breakpoint location is temporarily patched by a breakpoint code. There is no restriction in the number of software breakpoints.
On-chip Breakpoint Resources
If on-chip breakpoints are used, the resources to set the breakpoints are provided by the hardware of the core itself.
For this purpose, a RISC-V core can have generic on-chip triggers that can either be used for on-chip instruction breakpoints or on-chip data breakpoints. These generic triggers are called “address/data match triggers”. The availability of such triggers is optional, and the number of triggers that are available depends on the respective core.
This means that on-chip instruction and on-chip data breakpoints share the number of available trigger resources among each other.
Example: On a core with five address/data match triggers, we can either set five on-chip instruction breakpoints, or we could set three instruction breakpoints and two data breakpoints.
On-chip Breakpoints for Instructions
On-chip breakpoints for instructions are used to stop the core when an instruction at a certain address is executed.
The resources to set instruction breakpoints are provided by the core. For details about the implementation and number of these breakpoints, see chapter On-chip Breakpoint Resources.
On-chip instruction breakpoints are particularly useful in scenarios where the program code lies in read-only memory regions such as ROM or flash, as software breakpoints cannot be used in such scenarios.
On-chip Breakpoints for Data
On-chip breakpoints for data are used to stop the core after a read or write access to a memory location.
The resources to set data breakpoints are provided by the core. For details about the implementation and number of these breakpoints, see chapter On-chip Breakpoint Resources.
RISC-V Debugger 12 ©1989-2018 Lauterbach GmbH

On-chip data breakpoints with address range
Some RISC-V on-chip data breakpoint triggers allow to set triggers for address ranges. However, RISC-V only supports address ranges that conform to the following pattern:
Let the address range be from address A to address B, with A < B.Let X = A XOR B (infix operator XOR: “exclusive or”).Then all bits in X that equal to one have to be in consecutive order, starting from the least significant bit.
Examples:
Examples for On-Chip Breakpoints
The following shows various examples for setting standard on-chip breakpoints:
Break.Set 0x0000--0x0FFF /Read ; valid address range
Break.Set 0x0100--0x01FF /Read ; valid address range
Break.Set 0x3080--0x30BF /Write ; valid address range
Break.Set 0xA000--0xB0FF /Write ; invalid address range
Break.Set 0xA000--0xA0FD /Write ; invalid address range
Break.Set 0x40 /Program ; On-chip instruction breakpoint
Break.Set 0x101000 /Read ; On-chip data breakpoint (read)
Break.Set 0x102000 /Write ; On-chip data breakpoint (write)
Break.Set 0x103000 /ReadWrite ; On-chip data breakpoint (read and ; write)
Break.Set 0x101000--0x101FFF /Read ; On-chip data breakpoint (read,; address range)
RISC-V Debugger 13 ©1989-2018 Lauterbach GmbH

Access Classes
For background information about the term access class, see “TRACE32 Glossary” (glossary.pdf).
The following RISC-V specific access classes are available.
To perform an access with a certain access class, write the class in front of the address.
Example:
Access Class Description
P Program memory access
D Data memory access
E Run-time memory access(see SYStem.CpuAccess and SYStem.MemAccess)
Data.dump D:0x0--0x3
RISC-V Debugger 14 ©1989-2018 Lauterbach GmbH
CPU specific SYStem Commands
SYStem.CONFIG.state Display target configuration
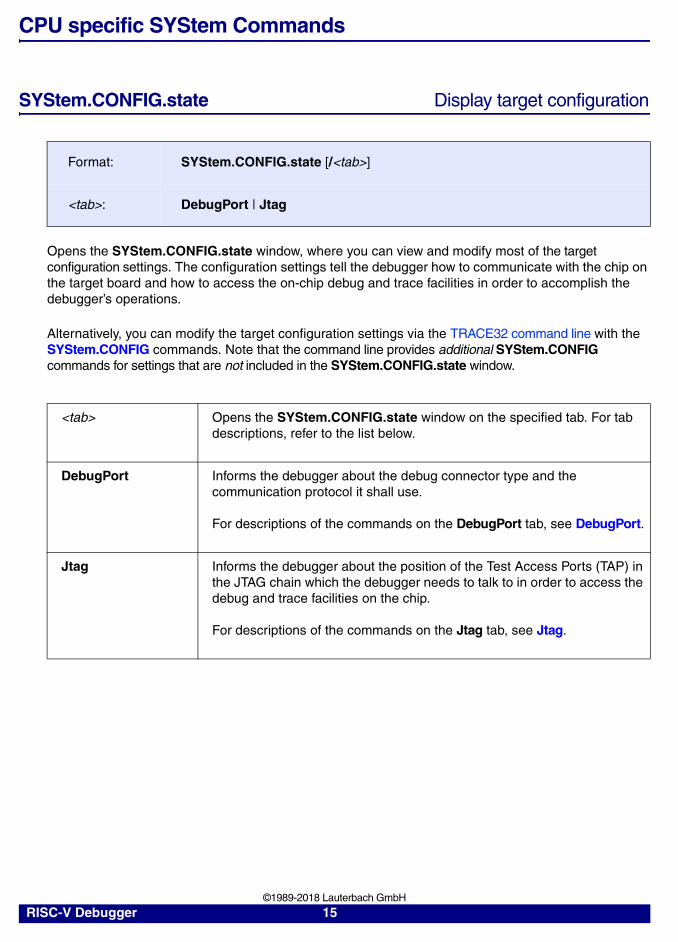
Opens the SYStem.CONFIG.state window, where you can view and modify most of the target configuration settings. The configuration settings tell the debugger how to communicate with the chip on the target board and how to access the on-chip debug and trace facilities in order to accomplish the debugger’s operations.
Alternatively, you can modify the target configuration settings via the TRACE32 command line with the SYStem.CONFIG commands. Note that the command line provides additional SYStem.CONFIG commands for settings that are not included in the SYStem.CONFIG.state window.
Format: SYStem.CONFIG.state [/<tab>]
<tab>: DebugPort | Jtag
<tab> Opens the SYStem.CONFIG.state window on the specified tab. For tab descriptions, refer to the list below.
DebugPort Informs the debugger about the debug connector type and the communication protocol it shall use.
For descriptions of the commands on the DebugPort tab, see DebugPort.
Jtag Informs the debugger about the position of the Test Access Ports (TAP) in the JTAG chain which the debugger needs to talk to in order to access the debug and trace facilities on the chip.
For descriptions of the commands on the Jtag tab, see Jtag.
RISC-V Debugger 15 ©1989-2018 Lauterbach GmbH
SYStem.CONFIG Configure debugger according to target topology
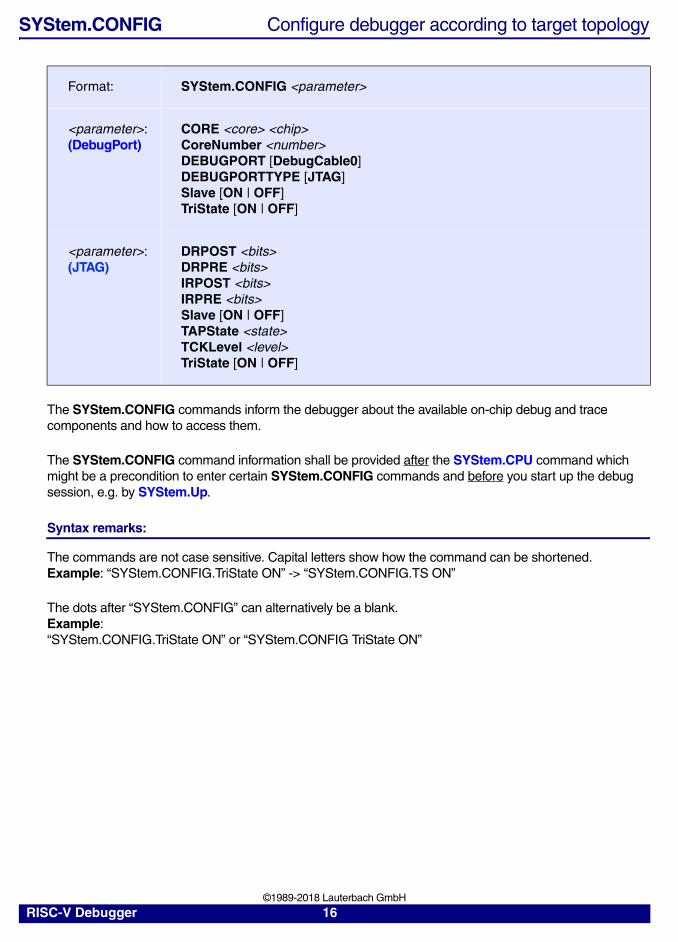
The SYStem.CONFIG commands inform the debugger about the available on-chip debug and trace components and how to access them.
The SYStem.CONFIG command information shall be provided after the SYStem.CPU command which might be a precondition to enter certain SYStem.CONFIG commands and before you start up the debug session, e.g. by SYStem.Up.
Syntax remarks:
The commands are not case sensitive. Capital letters show how the command can be shortened.Example: “SYStem.CONFIG.TriState ON” -> “SYStem.CONFIG.TS ON”
The dots after “SYStem.CONFIG” can alternatively be a blank.Example: “SYStem.CONFIG.TriState ON” or “SYStem.CONFIG TriState ON”
Format: SYStem.CONFIG <parameter>
<parameter>:(DebugPort)
CORE <core> <chip>CoreNumber <number>DEBUGPORT [DebugCable0]DEBUGPORTTYPE [JTAG]Slave [ON | OFF]TriState [ON | OFF]
<parameter>:(JTAG)
DRPOST <bits>DRPRE <bits>IRPOST <bits>IRPRE <bits>Slave [ON | OFF]TAPState <state>TCKLevel <level>TriState [ON | OFF]
RISC-V Debugger 16 ©1989-2018 Lauterbach GmbH

<parameters> describing the “DebugPort”
CORE <core> <chip>
The command helps to identify debug and trace resources which are commonly used by different cores. The command might be required in a multicore environment if you use multiple debugger instances (multiple TRACE32 PowerView GUIs) to simultaneously debug different cores on the same target system.
Because of the default setting of this command
debugger#1: <core>=1 <chip>=1debugger#2: <core>=1 <chip>=2...
each debugger instance assumes that all notified debug and trace resources can exclusively be used.
But some target systems have shared resources for different cores. For example a common trace port. The default setting causes that each debugger instance will control the (same) trace port. Sometimes it does not hurt if such a module will be controlled twice. So even then it might work. But the correct specification which might be a must is to tell the debugger that these cores sharing resources are on the same <chip>. Whereby the “chip” does not need to be identical with the device on your target board:
debugger#1: <core>=1 <chip>=1debugger#2: <core>=2 <chip>=1
CORE <core> <chip>
(cont.)
For cores on the same <chip> the debugger assumes they share the same resource if the control registers of the resource has the same address.
Default:<core> depends on CPU selection, usually 1.<chip> derives from the CORE= parameter in the configuration file (config.t32), usually 1. If you start multiple debugger instances with the help of t32start.exe you will get ascending values (1, 2, 3,...).
CoreNumber <number>
Number of cores to be considered in an SMP (symmetric multiprocessing) debug session. There are RISC-V core types which can be used as a single core processor or as a scalable multicore processor of the same type. If you intend to debug more than one such core in an SMP debug session you need to specify the number of cores you intend to debug.
Default: 1.
RISC-V Debugger 17 ©1989-2018 Lauterbach GmbH

DEBUGPORT [DebugCable0]
It specifies which probe cable shall be used e.g. “DebugCable0”. At the moment only the CombiProbe allows to connect more than one probe cable.
Default: depends on detection.
DEBUGPORTTYPE[JTAG]
It specifies the used debug port type “JTAG”. It assumes the selected type is supported by the target.
Default: JTAG.
Slave [ON | OFF] If several debuggers share the same debug port, all except one must have this option active.
JTAG: Only one debugger - the “master” - is allowed to control the signals nTRST and nSRST (nRESET). The other debuggers need to have the setting Slave OFF.
Default: OFF.Default: ON if CORE=... >1 in the configuration file (e.g. config.t32).
TriState [ON | OFF] TriState has to be used if several debug cables are connected to a common JTAG port. TAPState and TCKLevel define the TAP state and TCK level which is selected when the debugger switches to tristate mode. Please note: • nTRST must have a pull-up resistor on the target.• TCK can have a pull-up or pull-down resistor.• Other trigger inputs need to be kept in inactive state.
Default: OFF.
RISC-V Debugger 18 ©1989-2018 Lauterbach GmbH

<parameters> describing the “JTAG” scan chain and signal behavior
With the JTAG interface you can access a Test Access Port controller (TAP) which has implemented a state machine to provide a mechanism to read and write data to an Instruction Register (IR) and a Data Register (DR) in the TAP. The JTAG interface will be controlled by 5 signals: nTRST(reset), TCK (clock), TMS (state machine control), TDI (data input), TDO (data output). Multiple TAPs can be controlled by one JTAG interface by daisy-chaining the TAPs (serial connection). If you want to talk to one TAP in the chain you need to send a BYPASS pattern (all ones) to all other TAPs. For this case the debugger needs to know the position of the TAP it wants to talk to. The TAP position can be defined with the first four commands in the table below.
DRPOST <bits> Defines the TAP position in a JTAG scan chain. Number of TAPs in the JTAG chain between the TDI signal and the TAP you are describing. In BYPASS mode each TAP contributes one data register bit. See example below.
Default: 0.
DRPRE <bits> Defines the TAP position in a JTAG scan chain. Number of TAPs in the JTAG chain between the TAP you are describing and the TDO signal. In BYPASS mode each TAP contributes one data register bit. See example below.
Default: 0.
IRPOST <bits> Defines the TAP position in a JTAG scan chain. Number of Instruction Register (IR) bits of all TAPs in the JTAG chain between TDI signal and the TAP you are describing. See example below.
Default: 0.
IRPRE <bits> Defines the TAP position in a JTAG scan chain. Number of Instruction Register (IR) bits of all TAPs in the JTAG chain between the TAP you are describing and the TDO signal. See example below.
Default: 0.
Slave [ON | OFF] If several debuggers share the same debug port, all except one must have this option active.
JTAG: Only one debugger - the “master” - is allowed to control the signals nTRST and nSRST (nRESET). The other debuggers need to have the setting Slave OFF.
Default: OFF.Default: ON if CORE=... >1 in the configuration file (e.g. config.t32).
RISC-V Debugger 19 ©1989-2018 Lauterbach GmbH

TAPState <state> This is the state of the TAP controller when the debugger switches to tristate mode. All states of the JTAG TAP controller are selectable.
0 Exit2-DR1 Exit1-DR2 Shift-DR3 Pause-DR4 Select-IR-Scan5 Update-DR6 Capture-DR7 Select-DR-Scan8 Exit2-IR9 Exit1-IR10 Shift-IR11 Pause-IR12 Run-Test/Idle13 Update-IR14 Capture-IR15 Test-Logic-Reset
Default: 7 = Select-DR-Scan.
TCKLevel <level> Level of TCK signal when all debuggers are tristated. Normally defined by a pull-up or pull-down resistor on the target.
Default: 0.
TriState [ON | OFF] TriState has to be used if several debug cables are connected to a common JTAG port. TAPState and TCKLevel define the TAP state and TCK level which is selected when the debugger switches to tristate mode. Please note: • nTRST must have a pull-up resistor on the target.• TCK can have a pull-up or pull-down resistor.• Other trigger inputs need to be kept in inactive state.
Default: OFF.
NOTE: If you are not sure about your settings concerning IRPRE, IRPOST, DRPRE, and DRPOST, you can try to detect the settings automatically with the SYStem.DETECT.DaisyChain command.
RISC-V Debugger 20 ©1989-2018 Lauterbach GmbH

Example:
This example shows four TAPs in a JTAG daisy chain. The relevant TAP for RISC-V debugging is the Debug Transport Module (DTM) TAP. In order to address this TAP, the following settings are necessary:
SYStem.CONFIG IRPRE 10.SYStem.CONFIG IRPOST 5.SYStem.CONFIG DRPRE 2.SYStem.CONFIG DRPOST 1.
TAP 0
IR: 5 bits
TAP 2
IR: 4 bits
TAP 3
IR: 6 bits
TAP 1RISC-V DTMIR: 4 bits
TDI TDO
RISC-V Debugger 21 ©1989-2018 Lauterbach GmbH
SYStem.CPU Select the used CPU
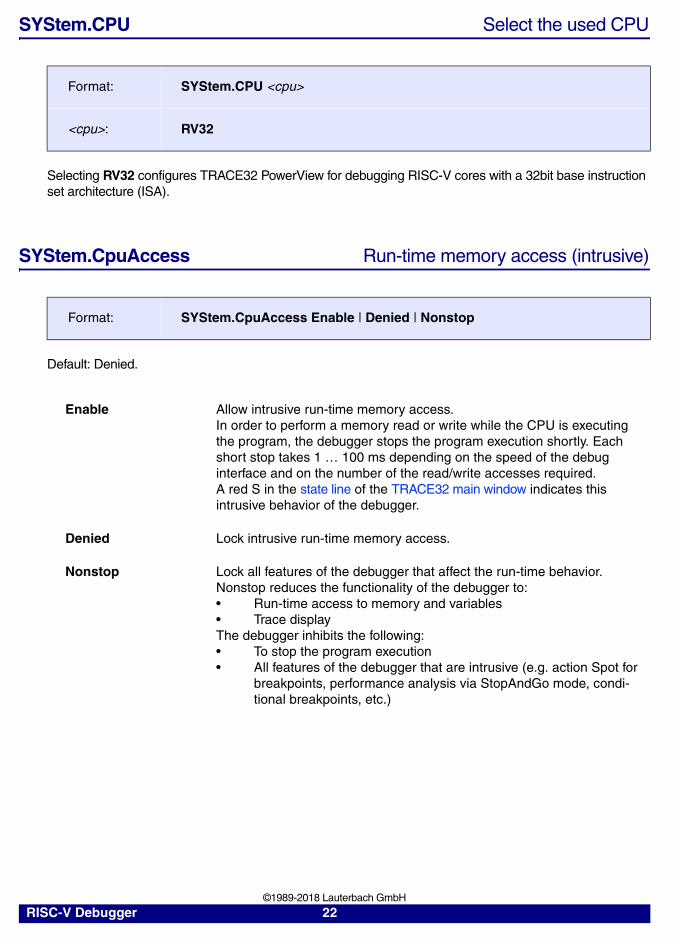
Selecting RV32 configures TRACE32 PowerView for debugging RISC-V cores with a 32bit base instruction set architecture (ISA).
SYStem.CpuAccess Run-time memory access (intrusive)
Default: Denied.
Format: SYStem.CPU <cpu>
<cpu>: RV32
Format: SYStem.CpuAccess Enable | Denied | Nonstop
Enable Allow intrusive run-time memory access.In order to perform a memory read or write while the CPU is executing the program, the debugger stops the program execution shortly. Each short stop takes 1 … 100 ms depending on the speed of the debug interface and on the number of the read/write accesses required.A red S in the state line of the TRACE32 main window indicates this intrusive behavior of the debugger.
Denied Lock intrusive run-time memory access.
Nonstop Lock all features of the debugger that affect the run-time behavior. Nonstop reduces the functionality of the debugger to:• Run-time access to memory and variables• Trace displayThe debugger inhibits the following:• To stop the program execution• All features of the debugger that are intrusive (e.g. action Spot for
breakpoints, performance analysis via StopAndGo mode, condi-tional breakpoints, etc.)
RISC-V Debugger 22 ©1989-2018 Lauterbach GmbH
SYStem.JtagClock Define JTAG frequency
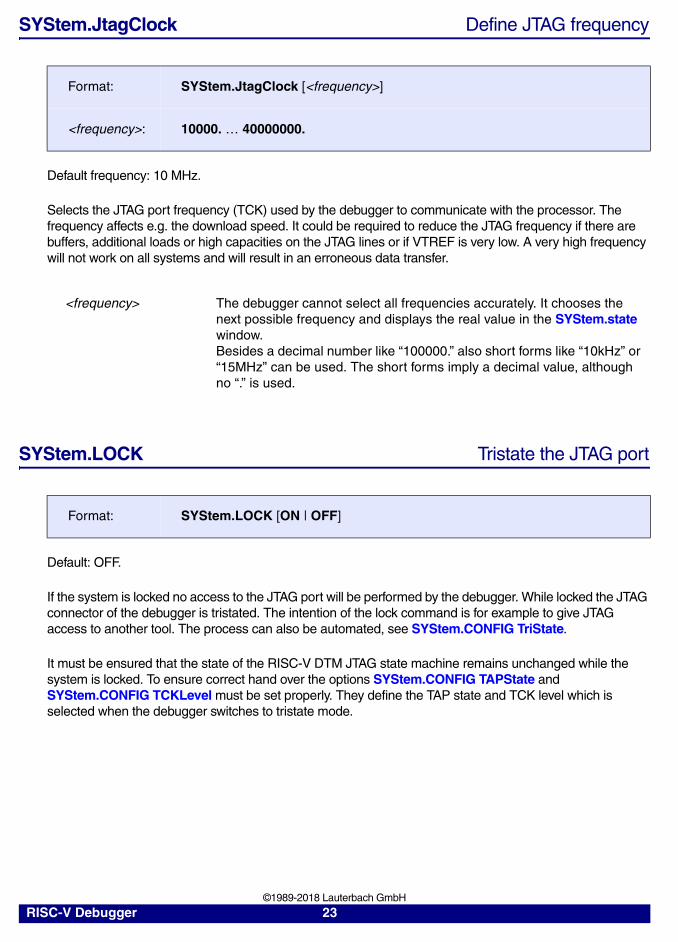
Default frequency: 10 MHz.
Selects the JTAG port frequency (TCK) used by the debugger to communicate with the processor. The frequency affects e.g. the download speed. It could be required to reduce the JTAG frequency if there are buffers, additional loads or high capacities on the JTAG lines or if VTREF is very low. A very high frequency will not work on all systems and will result in an erroneous data transfer.
SYStem.LOCK Tristate the JTAG port
Default: OFF.
If the system is locked no access to the JTAG port will be performed by the debugger. While locked the JTAG connector of the debugger is tristated. The intention of the lock command is for example to give JTAG access to another tool. The process can also be automated, see SYStem.CONFIG TriState.
It must be ensured that the state of the RISC-V DTM JTAG state machine remains unchanged while the system is locked. To ensure correct hand over the options SYStem.CONFIG TAPState and SYStem.CONFIG TCKLevel must be set properly. They define the TAP state and TCK level which is selected when the debugger switches to tristate mode.
Format: SYStem.JtagClock [<frequency>]
<frequency>: 10000. … 40000000.
<frequency> The debugger cannot select all frequencies accurately. It chooses the next possible frequency and displays the real value in the SYStem.state window.Besides a decimal number like “100000.” also short forms like “10kHz” or “15MHz” can be used. The short forms imply a decimal value, although no “.” is used.
Format: SYStem.LOCK [ON | OFF]
RISC-V Debugger 23 ©1989-2018 Lauterbach GmbH
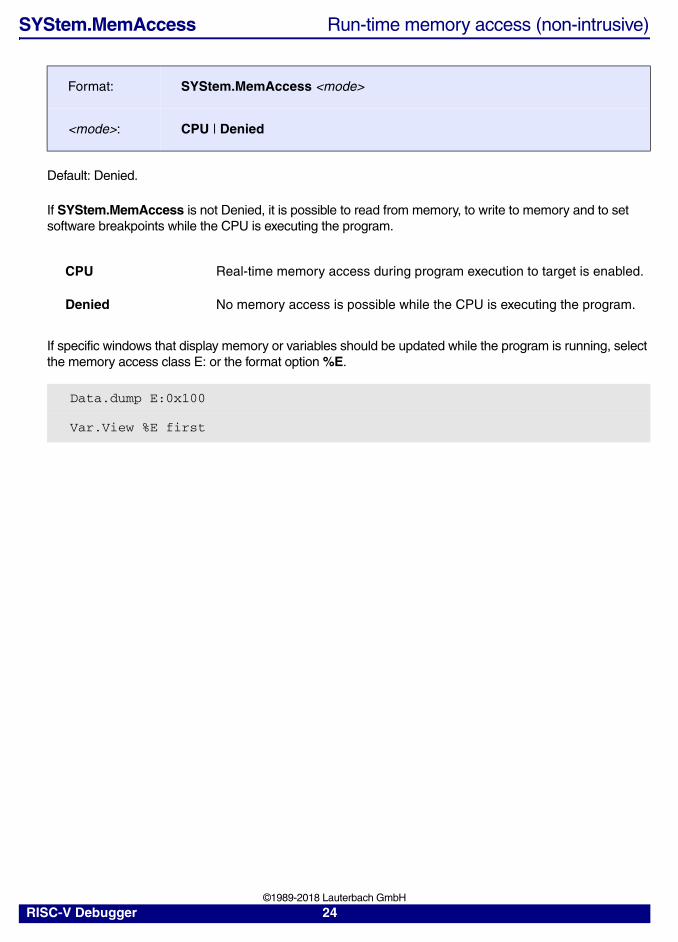
SYStem.MemAccess Run-time memory access (non-intrusive)
Default: Denied.
If SYStem.MemAccess is not Denied, it is possible to read from memory, to write to memory and to set software breakpoints while the CPU is executing the program.
If specific windows that display memory or variables should be updated while the program is running, select the memory access class E: or the format option %E.
Format: SYStem.MemAccess <mode>
<mode>: CPU | Denied
CPU Real-time memory access during program execution to target is enabled.
Denied No memory access is possible while the CPU is executing the program.
Data.dump E:0x100
Var.View %E first
RISC-V Debugger 24 ©1989-2018 Lauterbach GmbH

SYStem.Mode Establish the communication with the target
SYStem.Option Address32 Define address format display
Default: Depending on the CPU selected with the SYStem.CPU command.
Selects the number of displayed address digits in various windows, e.g. List.auto or Data.dump.
Format: SYStem.Mode <mode>
<mode>: DownGoAttachUp
Down(default)
Disables the debugger . The state of the CPU remains unchanged. The JTAG port is tristated.
Go Initializes a debug connection, resets the target and lets the CPU run from its reset vector.
Attach Initializes a debug connection. The target is not reset, i.e. the state of the target is not changed. Consequently the user program stays running if it was running, or stays stopped if it was stopped.
Up Initializes a debug connection, resets the target, sets the CPU to debug mode and stops the CPU at its reset vector.
Format: SYStem.Option Address32 [ON | OFF | AUTO]
ON Display all addresses as 32bit values. 64bit addresses are truncated.
OFF Display all addresses as 64bit values.
AUTO Number of displayed digits depends on address size.
RISC-V Debugger 25 ©1989-2018 Lauterbach GmbH

SYStem.Option EnReset Allow the debugger to drive nRESET (nSRST)[SYStem.state window> EnReset]
Default: ON.
If this option is disabled the debugger will never drive the nRESET (nSRST) line on the JTAG connector. This is necessary if nRESET (nSRST) is no open collector or tristate signal.Instead, during a SYStem.Up, the debugger will only assert a soft system reset via the “non-debug module reset” bit (ndmreset) of the dmcontrol register.
If this option is enabled the debugger will perform both reset options (assert nRESET line and set ndmreset bit) during a SYStem.Up.
SYStem.Option IMASKASM Disable interrupts while single stepping
Default: ON.
If enabled, the Step Interrupt Enable Bit will be cleared during assembler single-step operations. The interrupt routine is not executed during single-step operations.
SYStem.Option TRST Allow debugger to drive TRST[SYStem.state window > TRST]
Default: ON.
If this option is disabled, the nTRST line is never driven by the debugger (permanent high). Instead five consecutive TCK pulses with TMS high are asserted to reset the TAP controller which have the same effect.
Format: SYStem.Option EnReset [ON | OFF]
Format: SYStem.Option IMASKASM [ON | OFF]
Format: SYStem.Option TRST [ON | OFF]
RISC-V Debugger 26 ©1989-2018 Lauterbach GmbH

SYStem.state Display SYStem.state window
Displays the SYStem.state window for system settings that configure debugger and target behavior.
Format: SYStem.state
RISC-V Debugger 27 ©1989-2018 Lauterbach GmbH

Target Adaption
Connector Type and Pinout
The Debugger for RISC-V is shipped with a debug cable that supports the standard “RISC-V JTAG Debug Transport Module (DTM)”. This debug cable consists of two parts:
• RISC-V debug cable with 20 pin connector
• Converter ARM-20 to ALTERA-10/RISCV-10
The RISC-V debug cable can either be used alone or it can be extended with the ARM-20 to ALTERA-10/RISCV-10 converter. The target side of the converter conforms to the recommended JTAG interface of the RISC-V debug specification (For more details, see chapter Debug Specification for External Debug Support).
RISC-V Debug Cable with 20 pin Connector
Adaption for RISC-V Debug Cable: See www.lauterbach.com/adriscv.html
Signal Pin Pin SignalVREF-DEBUG 1 2 N/CTRST- 3 4 GNDTDI 5 6 GNDTMS 7 8 GNDTCK 9 10 GNDRTCK 11 12 GNDTDO 13 14 GNDRESET- 15 16 GNDN/C 17 18 GNDN/C 19 20 GND
Pin 2, pin 17 and pin 19 must under no circumstances be connected on the target side. Otherwise the hardware of the debugger can get damaged.
RISC-V Debugger 28 ©1989-2018 Lauterbach GmbH

Converter ARM-20 to ALTERA-10/RISCV-10
Signal Pin Pin SignalTCK 1 2 GNDTDO 3 4 VREF-DEBUGTMS 5 6 [RESET-]N/C 7 8 [TRST-]TDI 9 10 GND
NOTE: Pin 6 and pin 8 are optional and can be selected/deselected by jumpers.
RISC-V Debugger 29 ©1989-2018 Lauterbach GmbH

Support
Lauterbach technical support is available via www.lauterbach.com/tsupport.html.
For support requests that concern RISC-V, contact [email protected]
Available Tools
Compilers
CP
U
ICE
FIR
E
ICD
DE
BU
G
ICD
MO
NIT
OR
ICD
TR
AC
E
PO
WE
RIN
TE
GR
ATO
R
INS
TR
UC
TIO
NS
IMU
LA
TOR
E31 YESE51 YESN25 YES
Language Compiler Company Option Comment
C++ GCC Free Software Foundation, Inc.
ELF/DWARF2
RISC-V Debugger 30 ©1989-2018 Lauterbach GmbH

Products
Product Information
Order Information
OrderNo Code Text
LA-2717 JTAG-RISC-V
Debugger for RISC-V (ICD)supports RISC-Vincludes software for Windows, Linux and MacOSXrequires Power Debug Module
LA-2717A JTAG-RISC-V-A
JTAG Debugger for RISC-V Add.supports RISC-Vonly suitable for debug cables newer than 07/2008includes software for Windows, Linux and MacOSX
Order No. Code Text
LA-2717 JTAG-RISC-V Debugger for RISC-V (ICD)LA-2717A JTAG-RISC-V-A JTAG Debugger for RISC-V Add.
RISC-V Debugger 31 ©1989-2018 Lauterbach GmbH