risk and economic impact of phylloxera - vinehealth … · executive summary ... bill wilden (brl...
TRANSCRIPT

The Risk and Economic Impact of Phylloxera in South Australia’s
Viticultural Regions
Volume 1, Main Report
A report prepared for
Prepared by
and
March, 2002
EconSearch Pty Ltd PO Box 746
Unley BC SA 5061 Tel: 08 8357 9560 Fax: 08 8357 2299

PGIBSA The Risk and Economic Impact of Phylloxera in SA’s Viticultural Regions
EconSearch Pty Ltd Page: ii
Contents
List of Tables.................................................................................................................. iv List of Figures ................................................................................................................. v Abbreviations ................................................................................................................. vi Acknowledgements ........................................................................................................vii Executive Summary ......................................................................................................viii 1. Introduction ..............................................................................................................1
1.1 Background to Study........................................................................................1 1.2 Key Viticultural Regions in South Australia ......................................................2
1.2.1 Description .............................................................................................2 1.2.2 Statistical information.............................................................................4
1.3 Classification of Grape Growing Regions in Australia Based on Phylloxera Status .............................................................................................6
2. Assessment of the Relative Probability of Phylloxera Infestation and Spread in SA’s Viticultural Regions ......................................................................................8 2.1 Factors Considered..........................................................................................8 2.2 Method of Assessment.....................................................................................9
3. Probability of infestation With Phylloxera in SA’s Viticultural Regions (External Factors)...................................................................................................10 3.1 Proximity of Regions to an Interstate PIZ.......................................................10 3.2 Importation of Planting Material into SA.........................................................11 3.3 Importation of Grape Juice or Must into SA Regions from PIZ or PRZ
Areas .............................................................................................................12 3.4 Machinery Movements from Interstate into SA Regions ................................13 3.5 Interstate Visitors to Wine Regions ................................................................14 3.6 Other Movements of People from PIZs to Viticultural Regions of SA ............15 3.7 Recent Plantings of Vineyards in SA’s Viticultural Regions ...........................16 3.8 Overall Probability of Phylloxera Infestation in SA’s Viticultural Regions.......16
4. Probability of Spread of Phylloxera in SA’s Viticultural Regions after an Infestation (Internal Factors) ..................................................................................18 4.1 Soil Type ........................................................................................................18 4.2 Vineyard Concentration..................................................................................20 4.3 Vineyards Grafted on Resistant Rootstocks ..................................................22 4.4 Movement of Grapes and Must Between and Within SA’s Viticultural
Regions ..........................................................................................................23 4.5 Overall Probability of Spread of Phylloxera in SA’s Viticultural Regions........25
5. Approach to the Economic Impact Analysis...........................................................26 5.1 Impact on Individual Vineyards ......................................................................26 5.2 Impact on Regional Grape and Wine Production...........................................26 5.3 Impact on the Regional Economy ..................................................................27 5.4 Impact on the South Australian Grape and Wine Industry .............................29 5.5 Impact on the South Australian Economy ......................................................29
6. The ‘Representative Vineyard’ Financial Model.....................................................30 6.1 Background ....................................................................................................30 6.2 The Basic Premise of the Model ....................................................................32
6.2.1 The ‘without phylloxera’ scenario.........................................................32 6.2.2 The ‘with phylloxera’ scenario..............................................................32
7. The Impact of a Phylloxera Outbreak on Individual Vineyards ..............................40

PGIBSA The Risk and Economic Impact of Phylloxera in SA’s Viticultural Regions
EconSearch Pty Ltd Page: iii
7.1 Group Variation in Vineyard-Level Results ....................................................41 7.2 Regional Variation in Vineyard-Level Results ................................................42
8. The Impact of a Phylloxera Outbreak on the Regional Grape and Wine Industry and the Broader Regional Economy ........................................................44 8.1 Background and Assumptions .......................................................................44
8.1.1 The number of growers quarantined by a hypothetical PIZ .................45 8.1.2 The number of growers in the PIZ with phylloxera-infested
vineyards by 2010................................................................................45 8.2 The Impact of a Phylloxera Outbreak on Regional Grape Production ...........50 8.3 The Results of the Economic Impact Analysis at the Regional Level ............52
9. The Impact of a Phylloxera Outbreak on the South Australian Grape and Wine Industry and South Australian Economy.......................................................55
10. The Risk of Phylloxera in South Australia’s Viticultural Regions............................57 10.1 Vineyard Level Risk of Phylloxera..................................................................57 10.2 Regional Level Risk of Phylloxera..................................................................58
11. Conclusions and Recommendations......................................................................60 12. References.............................................................................................................62 Appendix 1 Tender Specifications ..........................................................................64 Appendix 2 Input-Output Methodology....................................................................65 Appendix 3 Glossary of Input-Output Terminology .................................................68

PGIBSA The Risk and Economic Impact of Phylloxera in SA’s Viticultural Regions
EconSearch Pty Ltd Page: iv
List of Tables
Table 1.1 Key Viticultural Regions of South Australia .................................................2 Table 1.2 Number of Growers and Property Size by Viticultural Region in SA ...........4 Table 1.3 2001 Vintage, Source of Fruit by Viticultural Region in SA .........................5 Table 1.4 2001 Crush Compared with 2006 Estimated Demand – By Viticultural
Region in SA................................................................................................5 Table 3.1 Probability of Phylloxera Infestation in a Region due to Proximity to a
PIZ in Other States ....................................................................................11 Table 3.2 Importation of Planting Material into SA Viticultural Regions from
Interstate between 1998 and 2001 ............................................................12 Table 3.3 Volume of Juice and Must Moved from PIZ and PRZ Regions into
Regions under ICA Protocols ....................................................................13 Table 3.4 The Probability of Phylloxera Infestation by Vineyard Machinery in
SA’s Viticultural Regions ...........................................................................14 Table 3.5 Movements of Vineyard Equipment from Interstate and Within
Regions .....................................................................................................14 Table 3.6 Main Points of Entry into South Australia ..................................................14 Table 3.7 Number of Interstate Visitors to Cellar Doors Outlets in Wine Regions
of South Australia, 1999 ............................................................................15 Table 3.8 Total Vineyard Area by Viticultural Region in 2000 and Increase
Since 1997.................................................................................................16 Table 3.9 Factors Affecting the Overall Relative Probability of a Phylloxera
Infestation in SA’s Viticultural Regions ......................................................17 Table 4.1 Surface Soil Texture in SA’s Key Viticultural Regions...............................20 Table 4.2 Concentration of Vineyards in Selected Areas of GI where Vineyards
are Mainly Located ....................................................................................22 Table 4.3 Area of Rootstocks Planted by Viticultural Region in SA, 2000.................23 Table 4.4 Grapes Crushed in Regions that are Sourced from Outside the
Region, 2001 .............................................................................................24 Table 4.5 Grapes Sent to Other Regions for Crushing, 2001....................................24 Table 4.6 Factors Affecting Overall Probability of Spread of Phylloxera in SA’s
Key Viticultural Regions.............................................................................25 Table 5.1 Regional Economic Models and Viticultural Regions ................................28 Table 6.1 Selected Model Assumptions for the ‘Representative Vineyard’ by
Viticultural Region......................................................................................30 Table 6.2 Key Model Assumptions With Respect to the Impact of Phylloxera ..........33 Table 6.3 Predominant Surface Soil Texture in the ‘Representative Vineyard’
by Viticultural Region.................................................................................33 Table 6.4 Potential Loss of Production from a Phylloxera Infestation in 2001 for
the Representative Vineyard, by Viticultural Region .................................35 Table 6.5 Price Penalty for Grapes from a Phylloxera Infested Zone........................36 Table 6.6 Degree of Inter-Regional Grape Substitutability by Viticultural Region .....37 Table 6.7 Key Model Assumptions With Respect to the Vineyard–Level
Response With Phylloxera ........................................................................39 Table 7.1 The Impact of a Phylloxera Outbreak on Profitability for the
Representative Vineyard for the Period 2002 to 2021...............................40

PGIBSA The Risk and Economic Impact of Phylloxera in SA’s Viticultural Regions
EconSearch Pty Ltd Page: v
Table 7.2 The Impact of a Phylloxera Outbreak on Total Capital Expenditure by the Representative Vineyard for the Period 2002 to 2021.........................41
Table 8.1 The Intra-Regional Probability of Spread of a Phylloxera Infestation Within a PIZ, by Viticultural Region ...........................................................46
Table 8.2 An Estimate of the Relationship Between the Probability of Spread of a Phylloxera Infestation and the Best and Worst-Case Scenarios ............47
Table 8.3 Estimates of the Number of Growers in each Phylloxera Group in the ‘Best-Case’ Phylloxera Outbreak Scenario ...............................................48
Table 8.4 Estimates of the Number of Growers in each Phylloxera Group in the ‘Worst-Case’ Phylloxera Outbreak Scenario .............................................49
Table 8.5 Estimates of the Net Impact on Regional Grape Production of a Hypothetical Phylloxera Outbreak .............................................................51
Table 8.6 The Net Turnover, Employment, Household Income and Value Added Impacts of the Best-Case Phylloxera Outbreak Scenario, 2010...........................................................................................................53
Table 8.7 The Net Turnover, Employment, Household Income and Value Added Impacts of the Worst-Case Phylloxera Outbreak Scenario, 2010...........................................................................................................54
Table 10.1 A Risk Estimation Matrix for Phylloxera in South Australia’s Viticultural Regions: Vineyard Level Assessment .....................................57
Table 10.2 A Risk Estimation Matrix for Phylloxera in South Australia’s Viticultural Regions: Regional Assessment ...............................................58
List of Figures
Figure 1.1 Key Viticultural Regions of South Australia .................................................3 Figure 1.2 Phylloxera Management Zones in Australia ................................................7 Figure 4.1 Surface Soil Texture in South Australia’s Key Viticultural Regions ...........19 Figure 4.2 Relative Concentration of Vineyard Plantings in the McLaren Vale
and Fleurieu Peninsula Regions................................................................21 Figure 6.1 Regional Variables Used in the Representative Vineyard Model ..............31

PGIBSA The Risk and Economic Impact of Phylloxera in SA’s Viticultural Regions
EconSearch Pty Ltd Page: vi
Abbreviations
AWBC Australian Wine and Brandy Corporation
CRCV Cooperative Research Centre for Viticulture
DNRE Department of Natural Resources and Environment (Victoria)
GI Geographical Indications
ICA Interstate Certification Assurance
NVHSC National Vine Health Steering Committee
PGIBSA Phylloxera and Grape Industry Board of South Australia
PIRSA Primary Industries and Resources South Australia
SA South Australia
SATC South Australian Tourism Commission
PEZ Phylloxera Exclusion Zone
PIZ Phylloxera Infested Zone
PRZ Phylloxera Risk Zone
Phy Phylloxera
SRHS Scholefield Robinson Horticultural Services

PGIBSA The Risk and Economic Impact of Phylloxera in SA’s Viticultural Regions
EconSearch Pty Ltd Page: vii
Acknowledgements
The input and feedback from members of the project steering committee was greatly appreciated: David Cartwright (PIRSA), Don Lester (Orlando Wyndham), Richard Hamilton (SouthCorp), Jim Hardie (CRC for Viticulture), Peter Stephens (Simeon Wines), Bill Wilden (BRL Hardy), Jim Caddy and Peter Hackworth (PGIBSA). The assistance provided by Jane Edwards and Sandy Hathaway (PGIBSA), Kimberley Green (PIRSA), Ross Heinze and Kym Anderson (University of Adelaide) is gratefully acknowledged. We also wish to acknowledge the contribution made by Mike Kinsella as a team member for this consultancy and for his role in managing phylloxera outbreaks in Victoria while Chief Quarantine Officer. Mike died in January 2002 and we will all miss his wise counsel and positive outlook on life.

PGIBSA The Risk and Economic Impact of Phylloxera in SA’s Viticultural Regions
EconSearch Pty Ltd Page: viii
Executive Summary Background The PGIBSA commissioned this study to:
• assess each of South Australia’s key viticultural regions and determine the probability of an infestation with phylloxera;
• undertake a detailed analysis of the economic impact of a phylloxera outbreak1 in each of these regions; and
• assess the risk2 of an outbreak of phylloxera in each region. The key South Australian (SA) viticultural regions that were assessed in this study are:
• Riverland
• Barossa and Eden Valleys
• McLaren Vale
• Coonawarra
• Langhorne Creek
• Padthaway
• Clare Valley
• Adelaide Hills
• Wrattonbully
• Mt Benson/Robe
• Fleurieu Other
The Probability of Phylloxera Infestation and Spread in South Australia’s Key Viticultural Regions A number of factors likely to lead to an infestation of phylloxera were assessed for each region to provide an overall relative probability of infestation. The following factors were considered.
• Proximity of the region to the nearest Phylloxera Infested Zone (PIZ) • Importation of grape planting material to the region from interstate • Importation of must or juice from interstate for processing in SA • Vineyard machinery movement into SA • Movement of visitors and industry personnel between PIZs and Phylloxera
Exclusion Zones (PEZs) in SA • Recent plantings of new vineyards
These factors were given a weighting of low, medium or high for their likely contribution to the overall probability of a phylloxera infestation.
1 Note that an infestation refers to the initial establishment of phylloxera while an outbreak refers to the
situation once phylloxera has been detected. 2 The ‘risk’ of phylloxera can be defined as a product of the probability of a phylloxera infestation and the
consequences (economic impact) of an outbreak.

PGIBSA The Risk and Economic Impact of Phylloxera in SA’s Viticultural Regions
EconSearch Pty Ltd Page: ix
The rate at which phylloxera will spread in a region after infestation has occurred is likely to be affected by a number of factors. The following factors were assessed for each region to provide an overall relative probability of spread.
• Soil type • Vineyard concentration • Movement of grapes into region for crushing • Rootstocks
These factors were also given a weighting of low, medium or high for their likely contribution to the probability of spread of phylloxera. The results of the analysis are presented in Table 1. Table 1 The Overall Relative Probability of Infestation and Spread of Phylloxera
in SA’s Key Viticultural Regions a
Region
Overall Relative Probability of
Infestation With Phylloxera
Overall Relative Probability of
Spread of Phylloxera
Riverland H M Barossa and Eden Valleys H H McLaren Vale H H Coonawarra M H Langhorne Creek M H Padthaway M H Clare Valley H L Adelaide Hills M L Wrattonbully L M Mt Benson/Robe M L Fleurieu Peninsula L L
a L = Low relative probability, M = Medium, H = High.
Source : SRHS analysis. The regions estimated to have the highest relative probability of infestation with phylloxera were Riverland, Barossa and Eden Valleys, McLaren Vale, and Clare Valley. The factors that determined the high relative probability of infestation with phylloxera varied between regions. For the Riverland, the entry of planting material from interstate and the level of vineyard expansion since 1997 were the main factors. For the Barossa and Eden Valleys, the main factors were the number of interstate visitors and the level of vineyard expansion since 1997. The regions estimated to have the highest relative probability of spread were Barossa and Eden Valleys, McLaren Vale, Coonawarra, Langhorne Creek, and Padthaway. The factors that determined the high probability spread of phylloxera also varied between regions. For Coonawarra, the main factors were heavy surface soil texture, high concentration of vineyards and the low use of rootstocks, while in the Barossa and Eden Valleys, it was the high movement of grapes into the region for crushing.
PGIBSA The Risk and Economic Impact of Phylloxera in SA’s Viticultural Regions
EconSearch Pty Ltd Page: x
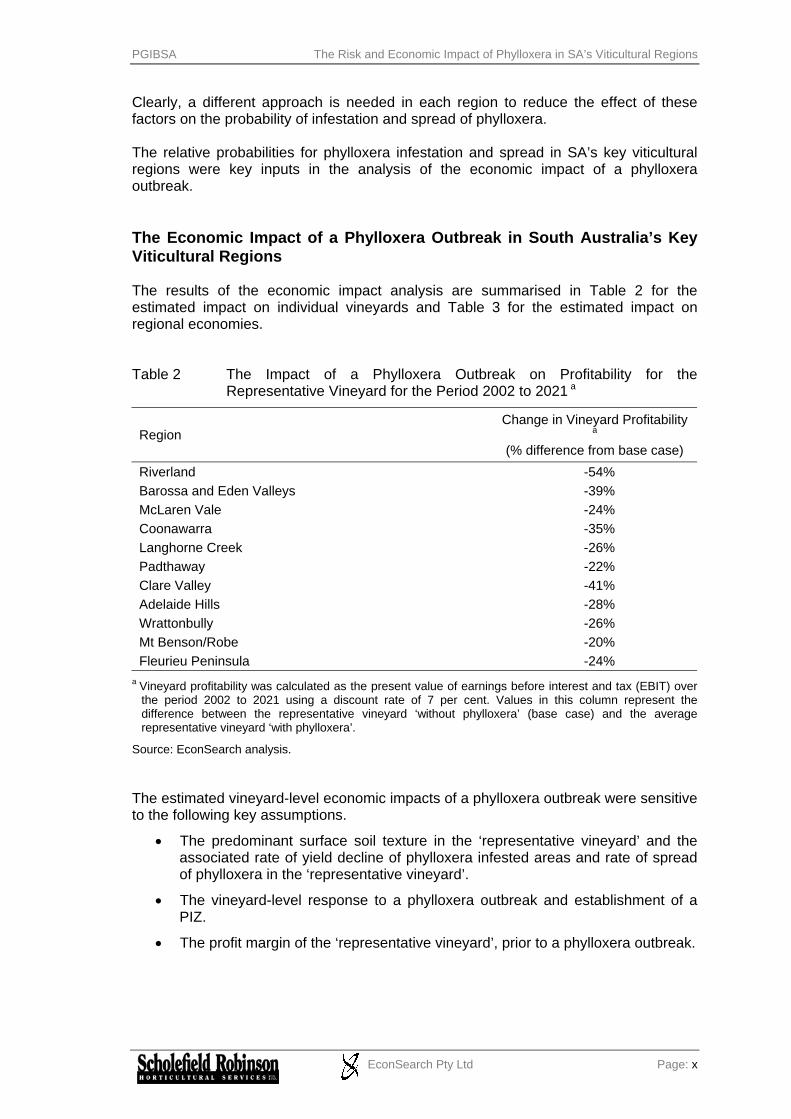
Clearly, a different approach is needed in each region to reduce the effect of these factors on the probability of infestation and spread of phylloxera. The relative probabilities for phylloxera infestation and spread in SA’s key viticultural regions were key inputs in the analysis of the economic impact of a phylloxera outbreak. The Economic Impact of a Phylloxera Outbreak in South Australia’s Key Viticultural Regions The results of the economic impact analysis are summarised in Table 2 for the estimated impact on individual vineyards and Table 3 for the estimated impact on regional economies. Table 2 The Impact of a Phylloxera Outbreak on Profitability for the
Representative Vineyard for the Period 2002 to 2021 a
Region Change in Vineyard Profitability
a
(% difference from base case) Riverland -54% Barossa and Eden Valleys -39% McLaren Vale -24% Coonawarra -35% Langhorne Creek -26% Padthaway -22% Clare Valley -41% Adelaide Hills -28% Wrattonbully -26% Mt Benson/Robe -20% Fleurieu Peninsula -24%
a Vineyard profitability was calculated as the present value of earnings before interest and tax (EBIT) over the period 2002 to 2021 using a discount rate of 7 per cent. Values in this column represent the difference between the representative vineyard ‘without phylloxera’ (base case) and the average representative vineyard ‘with phylloxera’.
Source: EconSearch analysis. The estimated vineyard-level economic impacts of a phylloxera outbreak were sensitive to the following key assumptions.
• The predominant surface soil texture in the ‘representative vineyard’ and the associated rate of yield decline of phylloxera infested areas and rate of spread of phylloxera in the ‘representative vineyard’.
• The vineyard-level response to a phylloxera outbreak and establishment of a PIZ.
• The profit margin of the ‘representative vineyard’, prior to a phylloxera outbreak.

PGIBSA The Risk and Economic Impact of Phylloxera in SA’s Viticultural Regions
EconSearch Pty Ltd Page: xi
For Coonawarra, despite a relatively high profit margin for the representative vineyard, vineyard profitability is significantly less than the base case due largely to a replanting program that occurs over a relatively short time period (12 years). For the other regions that suffer a significant fall in profitability, the Riverland, Clare Valley and Barossa and Eden Valleys, replanting will occur over a longer time period (18, 24 and 18 years respectively). However, because the base-level profit margins in these regions are lower, the impact of replanting activity and other factors on profitability will be of a similar order of magnitude to that in the Coonawarra. Table 3 The Regional Employment and Value Added Impacts of the Worst-Case
Phylloxera Outbreak Scenario, 2010 a
Region Employment (No. of jobs)
Value Added b
($m) Riverland -105 -31.0 Barossa and Eden Valleys -110 -24.5 McLaren Vale -145 -34.1 Coonawarra -112 -49.2 Langhorne Creek -63 -15.9 Padthaway -15 -7.5 Clare Valley -4 -3.1 Adelaide Hills 2 -0.6 Wrattonbully -7 -2.8 Mt Benson/Robe 1 -0.8 Fleurieu Peninsula -1 -0.5
a In 2001 dollars. These estimates represent the total regional impact of a phylloxera outbreak in 2010 and incorporate direct effects in the winegrape and wine sectors and flow-on effects in other sectors of the regional economy. All values represent the difference between the ‘with’ and ‘without phylloxera’ scenarios.
b Value added is calculated as the value of output less the cost of goods and services (including imports) used in producing the output. Value added is consistent with standard measures of economic activity, such as gross domestic, state or regional product and it provides an assessment of the net contribution to regional economic growth of a particular enterprise or activity.
Source: EconSearch analysis. Estimates of the regional economic impact of a phylloxera outbreak were sensitive to the key vineyard-level assumptions noted above as well as the following assumptions.
• The geographical location of the PIZ and the number of growers quarantined by the PIZ.
• The overall relative probability of spread of phylloxera within the PIZ. In each of the four regions in which the regional economic impact of a phylloxera outbreak was calculated to be high, that is, the Riverland, Barossa and Eden Valleys, McLaren Vale and Coonawarra, the hypothetical PIZ (based on an outbreak at the geographical centre of the viticultural region) would quarantine a large number of vineyards. Also, in each of these four regions, the probability of spread of phylloxera between vineyards was determined to be medium or high.

PGIBSA The Risk and Economic Impact of Phylloxera in SA’s Viticultural Regions
EconSearch Pty Ltd Page: xii
The Risk of Phylloxera in South Australia’s Key Viticultural Regions The ‘risk’ of phylloxera can be defined as a product of the probability of a phylloxera infestation and the consequences (economic impact) of an outbreak. Matrices were constructed to compare the risk of phylloxera at the vineyard and regional levels between South Australia’s key viticultural regions. Vineyard level A risk estimation matrix for phylloxera in South Australia’s key viticultural regions, at the vineyard level, is presented in Table 4. The matrix provides an estimate of the comparative risk of a phylloxera outbreak. It is an indicator of comparative risk because, although the risk of a phylloxera outbreak for the ‘representative vineyard’ in some regions (e.g. the Riverland, Clare Valley and the Barossa and Eden Valleys) may be high relative to other viticultural regions in SA, it is not necessarily high in absolute terms. Table 4 A Risk Estimation Matrix for Phylloxera in South Australia’s Key
Viticultural Regions: Vineyard Level Assessment a
a When interpreting the risk estimation matrix it is important to note that although the descriptors for each axis are similar, the matrix is not necessarily symmetrical. That is, a low probability of infestation combined with high economic impact is not necessarily the same as high probability combined with low impact.
Source: EconSearch and SRHS analysis (Derived from Tables 1 and 2). Regional level It is important to note that the risk of phylloxera at the vineyard level is not necessarily the same as the risk at the regional level. A risk estimation matrix was also constructed at the regional level (Table 5).
High McLaren Vale Clare Valley Barossa and Eden Valleys Riverland
Medium
Padthaway Langhorne Creek
Adelaide Hills Limestone Coast Other
Coonawarra
Low Wrattonbully Fleurieu Other
Low Medium High
Pro
babi
lity
of P
hyllo
xera
Infe
stat
ion
Vineyard-Level Economic Impact of Phylloxera Outbreak

PGIBSA The Risk and Economic Impact of Phylloxera in SA’s Viticultural Regions
EconSearch Pty Ltd Page: xiii
Table 5 A Risk Estimation Matrix for Phylloxera in South Australia’s Key Viticultural Regions: Regional Assessment a
a When interpreting the risk estimation matrix it is important to note that although the descriptors for each axis are similar, the matrix is not necessarily symmetrical. That is, a low probability of infestation combined with high economic impact is not necessarily the same as high probability combined with low impact.
Source: EconSearch and SRHS analysis (Derived from Tables 1 and 3). Although it could be expected that the risk estimation matrices would be similar at the vineyard and regional levels (Tables 4 and 5, respectively), differences between them arise for a variety of reasons. The most significant of these are regional differences in the number of vineyards in the PIZ and variations in the probability of spread of phylloxera between vineyards. In the course of the analysis, the probability of spread of phylloxera has been incorporated into the estimates of regional economic impact. One of the most striking differences between Tables 4 and 5 is the categorisation of McLaren Vale. Although the vineyard-level economic impact of phylloxera in McLaren Vale is relatively low, the regional economic impact is relatively high because of the large number of vineyards in the hypothetical McLaren Vale PIZ and the high probability of spread of phylloxera. Conclusions and Recommendations The key conclusions of this study are as follows.
• The viticultural regions of SA vary greatly in the factors or characteristics that determine the overall relative probability of infestation and spread of phylloxera. Therefore, each region will need to focus on different issues to reduce the probability of infestation and spread of phylloxera.
• At the vineyard level, Riverland vineyards are most vulnerable to the impact of phylloxera because they have the lowest profit margins prior to a phylloxera outbreak, a significant financial burden imposed by replanting and a high relative probability of infestation.
High Clare ValleyMcLaren Vale
Barossa and Eden Valleys Riverland
Medium Adelaide Hills Limestone Coast Other
Langhorne Creek Padthaway Coonawarra
Low Wrattonbully Fleurieu Other
Low Medium High
Pro
babi
lity
of P
hyllo
xera
Infe
stat
ion
Regional Economic Impact of Phylloxera Outbreak

PGIBSA The Risk and Economic Impact of Phylloxera in SA’s Viticultural Regions
EconSearch Pty Ltd Page: xiv
• At the regional level, the Riverland, Barossa and Eden Valleys, McLaren Vale and Coonawarra are most vulnerable to the impact of phylloxera because they would be likely to have a large number of vineyards quarantined by a PIZ and have a relatively high probability of infestation and rate of spread of phylloxera.
• The impact of a phylloxera outbreak in any given viticultural region on the relevant regional economy could be greater than the impact on the South Australian economy due to the substitutability of grapes between regions and the positive economic impact of investment in new vineyards and winery infrastructure.
• Estimates of the economic impact of a phylloxera outbreak were calculated on the basis of current (2001) grape prices. If the prices received for winegrapes were to fall in the future, which seems likely, the actual economic impact of a phylloxera outbreak could be much more severe than reported here. Further, the relative economic impact between regions could change if prices were to move differentially between regions.
• The rates of yield decline in phylloxera infested areas and rate of spread of phylloxera, within and between vineyards, were key assumptions in the risk analysis. Unfortunately, limited data are available and much of it is anecdotal and subjective.
A number of recommendations are made to the PGIBSA that will assist it to fulfil its charter to:
• prevent phylloxera entering the state; • control outbreaks of phylloxera in the state; and • develop plans for the eradication of phylloxera in the state’s vineyards. The consultants recommend that: 1. The findings of this study be used to prioritise phylloxera prevention activities in
regions with a high risk of a phylloxera outbreak. Risk is a product of the probability of infestation and the economic impact of a phylloxera outbreak.
2. The planting of vines grafted to phylloxera resistant rootstocks be increased,
particularly in the regions identified as having high phylloxera risk. Rootstocks are still the best insurance against a phylloxera outbreak.
3. A high level of awareness of the factors likely to lead to an infestation of
vineyards with phylloxera in SA be maintained by PGIBSA and other agencies.
4. Research into the factors affecting phylloxera infestation and spread, currently being carried out in Victoria, be continued. This work provides data on which to assess phylloxera risks in SA.
5. Regular gathering of information on the movements of grapes, must, juice,
planting material, machinery and visitors from interstate and between regions in SA should continue to be carried out. These data will allow objective measurement of the key contributing factors to phylloxera infestation and spread.
PGIBSA The Risk and Economic Impact of Phylloxera in SA’s Viticultural Regions
EconSearch Pty Ltd Page: xv
6. Secure and practical protocols for the movement of grape material, machinery and personnel between PIZ and PRZ interstate and PEZ in SA continue to be developed. These protocols should be standardised nationally with input from the National Vine Health Steering Committee (NVHSC).
7. Adjoining PEZ in SA, Victoria and NSW, for example Sunraysia and Riverland,
work closely together to provide increased phylloxera security for both regions.
8. Constant vigilance and preparedness for an outbreak of phylloxera must be a key strategy for the SA grape industry. The grape industry needs to understand that quarantine barriers are now based on a risk assessment and there is no such thing as “zero risk” of phylloxera infestation in SA. The early detection of an outbreak of phylloxera in vineyards will lessen the chance of spread to other vineyards in the region or elsewhere and reduce the economic impact of the outbreak.
If these recommendations are effectively implemented, the probability of phylloxera infestation in South Australian vineyards will be further reduced and the risk minimised.

PGIBSA The Risk and Economic Impact of Phylloxera in SA’s Viticultural Regions
EconSearch Pty Ltd Page: 1
1. Introduction The Phylloxera and Grape Industry Board of South Australia (PGIBSA) invited tenders to undertake a project to assist them in developing and implementing policies for the protection of the South Australian grape industry from the pest phylloxera. Specifically, PGIBSA required the tenderer to;
• assess the relative probability of an infestation of phylloxera occurring in South Australia’s key viticultural regions;
• estimate the economic impact of a phylloxera outbreak3; and
• assess the risk4 of an outbreak of phylloxera in each region. The detailed brief presented in the Tender Documents is attached in Appendix 1. Scholefield Robinson Horticultural Services Pty Ltd (SRHS) and EconSearch Pty Ltd were the successful joint tenderers for the project and this report presents their findings. The work was undertaken by Matthew Ferris and Julian Morison (EconSearch Pty Ltd), Peter Scholefield (Scholefield Robinson Horticultural Services Pty Ltd) and Mike Kinsella (Kinsella Consulting). 1.1 Background to Study Phylloxera is still a serious potential risk to the Australian grape industry even though its spread since first detected in 1877 has been relatively slow.
In over 150 years of viticulture, phylloxera has never been detected in South Australia. Given its spread throughout all of the world’s viticultural regions (excluding Chile) and its occurrence in the eastern states of Australia, this is quite remarkable. Factors contributing to this are distance from infested vineyards interstate, quarantine regulations, the vulnerability of the insect to heat and the fact that it only lives on grapevines. However, the rapid expansion of vineyards, increasing mechanisation, shared labour and the continued spread of phylloxera in Victoria mean that additional measures may need to be implemented to ensure that South Australia remains phylloxera-free.
Once detected in a vineyard, the staged removal of vines and replanting with vines grafted to tolerant rootstocks is, currently, the only solution. Only 13 per cent of vines in South Australia are grafted to rootstocks, significantly increasing the impact of an outbreak. Interstate and overseas experience is that, once established in a region, infestation of the entire region is inevitable. This is primarily because visual symptoms of phylloxera can take 2 – 5 years to manifest. Lack of direct experience of phylloxera in South Australia may also result in incorrect diagnosis of symptoms, further delaying detection. A reluctance to be the first grape grower to have phylloxera in their vineyard may also delay notification of an outbreak.
3 Note that an infestation refers to the initial establishment of phylloxera while an outbreak refers to the
situation once phylloxera has been detected. 4 The ‘risk’ of phylloxera can be defined as a product of the probability of a phylloxera infestation and the
consequences (economic impact) of an outbreak.

PGIBSA The Risk and Economic Impact of Phylloxera in SA’s Viticultural Regions
EconSearch Pty Ltd Page: 2
As blanket quarantine restrictions become less acceptable to Governments and the community at large, agricultural industries that are at risk from the introduction and spread of a new pest or disease must fully assess the risks to their industry.
The risk of phylloxera to the South Australian grape industry is a good example of such a situation where the consequences of an outbreak of phylloxera could be very damaging. However the risks are not fully understood nor has the economic loss been quantified.
Considerable work on state and national phylloxera protocols is being done by various agencies and the National Vine Health Steering Committee (NVHSC). Their aim is to maximise protection from phylloxera spread and standardise procedures for propagation material, movement of must, machinery and people, at the national level.
The Phylloxera and Grape Industry Board of South Australia (PGIBSA) has the charter to address the following issues with regard to phylloxera:
• prevent phylloxera entering the state; • control outbreaks of phylloxera in the state; and • develop plans for the eradication of phylloxera in the state’s vineyards.
1.2 Key Viticultural Regions in South Australia 1.2.1 Description The key viticultural regions in South Australia that have been used for this study are outlined in Table 1.1. The definition of these regions is best described in the Geographic Indication documentation available from the Australian Wine and Brandy Corporation (AWBC) (Sullivan 2001). The location and boundaries of the regions are illustrated in Figure 1.1. Table 1.1 Key Viticultural Regions of South Australia a
Viticultural Regions
Riverland Barossa and Eden Valleys McLaren Vale Coonawarra Langhorne Creek Padthaway Clare Valley Adelaide Hills Wrattonbully Mt Benson/Robe b
Fleurieu Peninsula c
a Does not include Mount Lofty Ranges-Other (i.e. Adelaide Plains) and SA Other, as defined in PGIBSA (2001).
b Includes Bordertown, as defined in PGIBSA (2001), although the Robe/Mt Benson sub-region has been used as a case study in the analysis that follows.
c Includes Southern Fleurieu, Currency Creek and Kangaroo Island.

PGIBSA The Risk and Economic Impact of Phylloxera in SA’s Viticultural Regions
EconSearch Pty Ltd Page: 3
Figure 1.1 Key Viticultural Regions of South Australia
Kangaroo Island
SouthernFleurieu Currency Creek
Langhorne CreekMcLaren
Vale
Adelaide Hills
Eden Valley
Barossa Valley
Riverland
Mt Benson
Padthaway
Coonawarra
Wrattonbully
Clare Valley
Interim
Interim
0 30 60 90 120
Kilometers
Source: PBIBSA

PGIBSA The Risk and Economic Impact of Phylloxera in SA’s Viticultural Regions
EconSearch Pty Ltd Page: 4
1.2.2 Statistical information The most up-to-date and reliable information on plantings, production, grower profile, and future demand for winegrapes in South Australia’s viticultural regions is provided in the 2001 South Australian Winegrape Utilisation and Pricing Survey (PGIBSA 2001). Table 1.2 Number of Growers and Property Size by Viticultural Region in SA
Property size in hectares REGION
<10 10 - 24 25 - 49 >49 Total growers
Total hectares
Number of growers in each category
Adelaide Hills 127 49 22 7 205 2476 Barossa + Eden Valley 302 152 83 21 558 9313 Bordertown 0 0 1 5 6 1022 Clare Valley 122 49 17 18 206 4434 Coonawarra 27 30 14 20 91 4957 Fleurieu other incl KI 25 7 6 2 40 593 Langhorne Creek 21 34 18 21 94 4752 Limestone Coast 25 14 11 5 55 1515 McLaren Vale 207 71 43 16 337 5189 Mount Lofty Ranges - Other 31 12 4 2 49 572 Padthaway 3 4 6 12 25 3290 Riverland 740 328 84 38 1190 18245 Wrattonbully 9 12 6 5 32 1347 SA Other 20 7 1 0 28 214
Number of Growers 1659 769 316 172 2916 % of Total Growers 57% 26% 11% 6% 100%
Number of Hectares 7777 11509 10092 28564 57942 % of Total Hectares 13% 20% 17% 49% 100%
Source: Winegrape Utilisation and Pricing Survey 2001 (PGIBSA)

PGIBSA The Risk and Economic Impact of Phylloxera in SA’s Viticultural Regions
EconSearch Pty Ltd Page: 5
Table 1.3 2001 Vintage, Source of Fruit by Viticultural Region in SA
Region Winery grown
(tonnes)
Independent grower
(tonnes)
Total crush
(tonnes)
% Winery grown
Adelaide Hills 2586 16334 18920 14% Barossa Valley 9908 43990 53898 18% Bordertown 5195 1434 6629 78% Clare Valley 13444 10049 23493 57% Coonawarra 41310 11815 53125 78% Eden Valley 5650 5481 11131 51% Fleurieu zone - other 1940 3126 5066 38% Langhorne Creek 20489 30821 51309 40% Limestone Coast zone - other 4704 6241 10945 43% McLaren Vale 12968 42904 55872 23% Mount Lofty zone - other 980 4983 5963 16% Padthaway 25697 10419 36116 71% Riverland 53490 273614 327104 16% SA - other 211 2867 3078 7% Wrattonbully 10884 5289 16172 67% Total 209455 469365 678821 31%
Source: Winegrape Utilisation and Pricing Survey 2001 (PGIBSA) Table 1.4 2001 Crush Compared with 2006 Estimated Demand – By Viticultural
Region in SA
Region 2001 Actual
2006 Preferred Diff’cea %
Diff’cea
Adelaide Hills 18920 19002 -82 0% Bordertown 6629 11131 -4502 -68% Barossa Valley 53898 83668 -29770 -55% Clare Valley 23493 35047 -11554 -49% Coonawarra 53125 46136 6989 13% Eden Valley 11131 16165 -5034 -45% Fleurieu zone other 5066 7380 -2314 -46% Langhorne Creek 51309 72869 -21560 -42% Limestone Coast - other 10945 11046 -101 -1% McLaren Vale 55872 77883 -22011 -39% Mount Lofty zone other 5963 5603 360 6% Padthaway 36116 33408 2708 7% Riverland 327104 400912 -73808 -23% Wrattonbully 16172 18006 -1834 -11% South Australia - other 3078 3019 59 2% Total 678821 841275 -162454 -24% a Negative difference indicates a shortfall; a positive difference indicates a surplus Source: Winegrape Utilisation and Pricing Survey 2001 (PGIBSA)

PGIBSA The Risk and Economic Impact of Phylloxera in SA’s Viticultural Regions
EconSearch Pty Ltd Page: 6
1.3 Classification of Grape Growing Regions in Australia Based on Phylloxera Status
Grapegrowing regions in Australia are classified into zones according to their phylloxera status. • Phylloxera Infested Zone (PIZ)
This zone is also known as a Vine Disease District or phylloxera affected area. It is the quarantine area around a known infestation of phylloxera.
• Phylloxera Risk Zone (PRZ) This zone has no legal status and is an undeclared area where phylloxera is not known to be present, but is not proven to be absent. Most of the PRZ areas have few grapes planted.
• Phylloxera Exclusion Zone (PEZ) This zone is also called a Declared Free Area, a Vine Protected Area, or a
Phylloxera Free Area. It is officially recognised as being free of phylloxera. Figure 1.2 shows the location of PIZ and PEZ areas in Australia. All other grapegrowing areas are classed as PRZ.

PGIBSA The Risk and Economic Impact of Phylloxera in SA’s Viticultural Regions
EconSearch Pty Ltd Page: 7
Figure 1.2 Phylloxera Management Zones in Australia

PGIBSA The Risk and Economic Impact of Phylloxera in SA’s Viticultural Regions
EconSearch Pty Ltd Page: 8
2. Assessment of the Relative Probability of Phylloxera Infestation and Spread in SA’s Viticultural Regions
2.1 Factors Considered The probability of phylloxera in South Australia’s viticultural regions can be divided into two components; the probability of introduction, establishment or infestation (external), and the probability of spread (internal). The probability of infestation with phylloxera (external factors) This relates to phylloxera moving from a PIZ or PRZ to a PEZ. The factors identified as contributing to the probability of infestation were:
• Proximity of region to a PIZ. • Importation of planting material into South Australia. • Importation of juice and must into South Australia. • Movement of machinery and equipment into South Australia. • Visitor movement from PIZ into a region. • Scale of new vineyard planting since 1997.
Most of these external factors are subject to quarantine controls that aim to minimise the risk. However, there is no such thing as “zero risk”. Importation of fresh grapes was not considered in assessing the probability of infestation. Fresh grapes from PIZ and PRZ regions are not permitted to enter South Australia. While data on the volume of fresh grapes entering South Australia from PEZ (eg. Sunraysia) was not available, it is not considered to be high. Entry of vine planting material into South Australia requires certification in line with the legislative requirements and PGIBSA notification. Juice and must is allowed entry into SA under Interstate Certification Assurance (ICA) protocols established in conjunction with PGIBSA. Equipment and machinery requires certification and may be inspected at the quarantine border stations. The probability of spread of phylloxera (internal factors) The factors identified that influence the probability of internal spread after an infestation of phylloxera has occurred were:
• Soil type. • Proximity of vineyards to each other. • Area of vineyards on resistant rootstocks. • Movement of grapes between regions for processing. • Level of survey for detecting phylloxera:
- National protocols. - Proposed aerial surveys and new techniques.
• Movement of contractors between vineyards.

PGIBSA The Risk and Economic Impact of Phylloxera in SA’s Viticultural Regions
EconSearch Pty Ltd Page: 9
2.2 Method of Assessment Data were collected on each of the external and internal factors listed in Section 2.1. For some factors quantitative data were available, e.g. areas of phylloxera resistant rootstocks planted in each region, but for others more subjective information was obtained from the consultant’s experience, industry discussion and comments. The data on factors affecting the probability of infestation with phylloxera were first considered in isolation of other external factors. An assessment was made of the individual factor’s potential to increase the probability of a phylloxera infestation in a region, compared to the ‘threat’ in other regions. The second step was to combine the assessments for individual factors, using appropriate weightings, to derive an aggregate assessment of the relative probability of a phylloxera outbreak. This overall assessment was not made quantitatively but in relative terms, as either low, medium or high. The same approach was used in assessing the probability of spread of phylloxera. First, assessment was made of the individual (internal) factors and their potential to increase the probability of spread. Second, the assessments of individual factors were combined to derive an aggregate assessment of the relative probability of spread.

PGIBSA The Risk and Economic Impact of Phylloxera in SA’s Viticultural Regions
EconSearch Pty Ltd Page: 10
3. Probability of infestation With Phylloxera in SA’s Viticultural Regions (External Factors)
3.1 Proximity of Regions to an Interstate PIZ The known grape growing areas with phylloxera in Australia (PIZ) are located in central Victoria and near Sydney. The borders between SA, Victoria and NSW are the line of potential entry for phylloxera into SA. In Victoria there are several regions that are free of phylloxera (PEZ) and they have quarantine restrictions on the entry of grapes and grape material that are similar to those in SA (e.g. Sunraysia and Henty-West Wimmera). Other parts of Victoria have less grape growing activity, less quarantine protection and they are classed as Phylloxera Risk Zones (PRZ). Movement of phylloxera from a PIZ to SA would be more unlikely via a PEZ (e.g. Sunraysia) than from a PRZ (e.g. the border areas near Pinnaroo or Bordertown). The recently declared PEZ for Henty-West Wimmera will provide an added protective buffer to the Limestone Coast (SE) region of SA. Table 3.1 presents a subjective assessment of the probability of phylloxera infestation in SA due to proximity to a PIZ and the “protection” at the border afforded by an adjacent PEZ in Victoria. As most of the identified methods of movement of phylloxera are not dependent on distance from the source of phylloxera (e.g. planting material, grapes and must, or machinery), the proximity factor is probably not of great significance. However, all regions of SA are a long distance from PIZs in Victoria or NSW. If there was an outbreak of phylloxera in Sunraysia or western Victoria, the proximity of SA to these areas would become much more significant.

PGIBSA The Risk and Economic Impact of Phylloxera in SA’s Viticultural Regions
EconSearch Pty Ltd Page: 11
Table 3.1 Probability of Phylloxera Infestation in a Region due to Proximity to a PIZ in Other States a
Region Proximity to PIZ Protected by PEZ in another state
Relative Probability of
Phylloxera Infestation b
Riverland Borders Victoria Yes M Barossa and Eden Valleys L McLaren Vale L Coonawarra Borders Victoria Yes M Langhorne Creek L Padthaway Close to border with
Victoria Yes M
Clare Valley First contact point with NSW via Broken Hill
L
Adelaide Hills L Wrattonbully Borders Victoria Yes M LC Other/Mt Benson/Robe L
Fleurieu Peninsula L a All regions in SA are a great distance from PIZ in other states. Therefore, the probability of unassisted
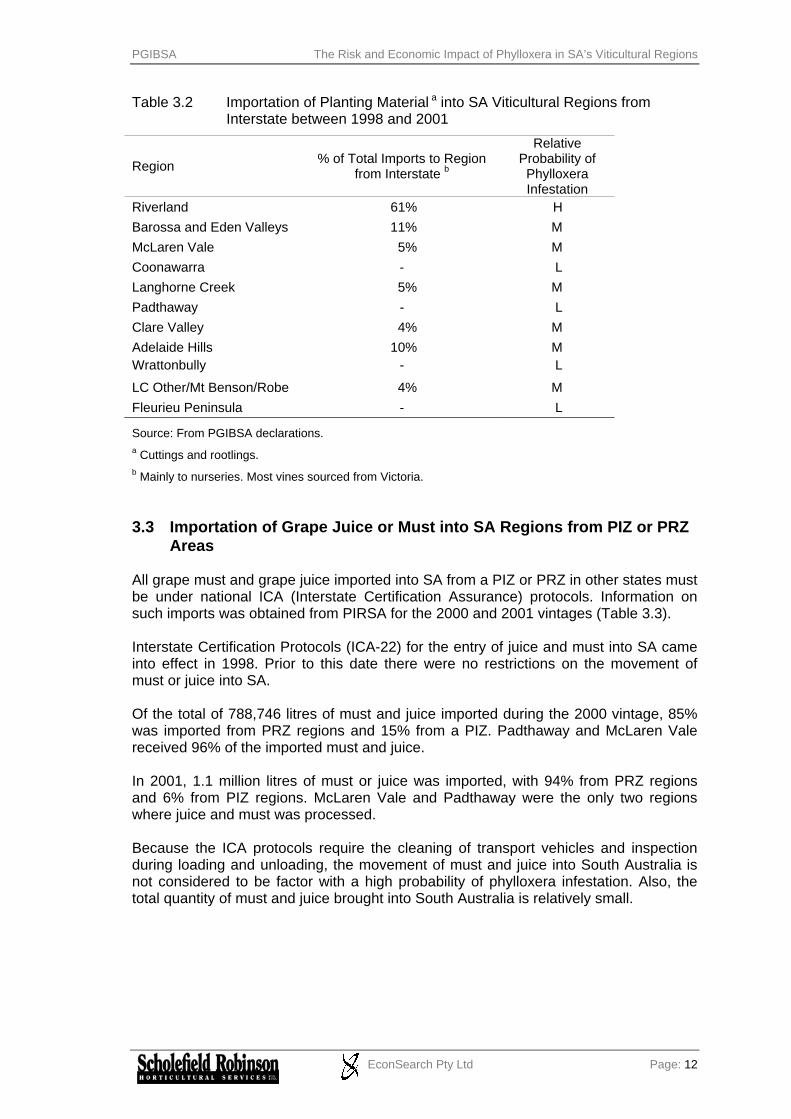
spread by the insect itself is considered negligible. b H = High, M = Medium, L = Low. 3.2 Importation of Planting Material into SA The importation of grape planting material into SA from interstate requires plant health certification by quarantine authorities and notification to PGIBSA. Records of importations between 1998 and 2001 are summarised in Table 3.2. Importation is not permitted from a PIZ or PRZ so the risk of phylloxera infestation is low. About half of the introductions were cuttings without roots or soil contact. Rootlings, the other half, were hot water treated, a treatment for both phylloxera and nematode control.
Most of the introductions were to the Riverland region (61%) and it is estimated that a high proportion of these would have been cuttings for nurseries in the region.
Whatever the probability of infestation from the introduction of planting material into SA, the Riverland is the region with the highest probability. During the period of rapid expansion in planting over the last decade, the shortage of high quality planting material, combined with the number of inexperienced growers, would have increased the likelihood of infested material being illegally introduced to South Australia from interstate.
PGIBSA The Risk and Economic Impact of Phylloxera in SA’s Viticultural Regions
EconSearch Pty Ltd Page: 12
Table 3.2 Importation of Planting Material a into SA Viticultural Regions from Interstate between 1998 and 2001
Region % of Total Imports to Region from Interstate b
Relative Probability of
Phylloxera Infestation
Riverland 61% H Barossa and Eden Valleys 11% M McLaren Vale 5% M Coonawarra - L Langhorne Creek 5% M Padthaway - L Clare Valley 4% M Adelaide Hills 10% M Wrattonbully - L
LC Other/Mt Benson/Robe 4% M Fleurieu Peninsula - L
Source: From PGIBSA declarations. a Cuttings and rootlings. b Mainly to nurseries. Most vines sourced from Victoria. 3.3 Importation of Grape Juice or Must into SA Regions from PIZ or PRZ
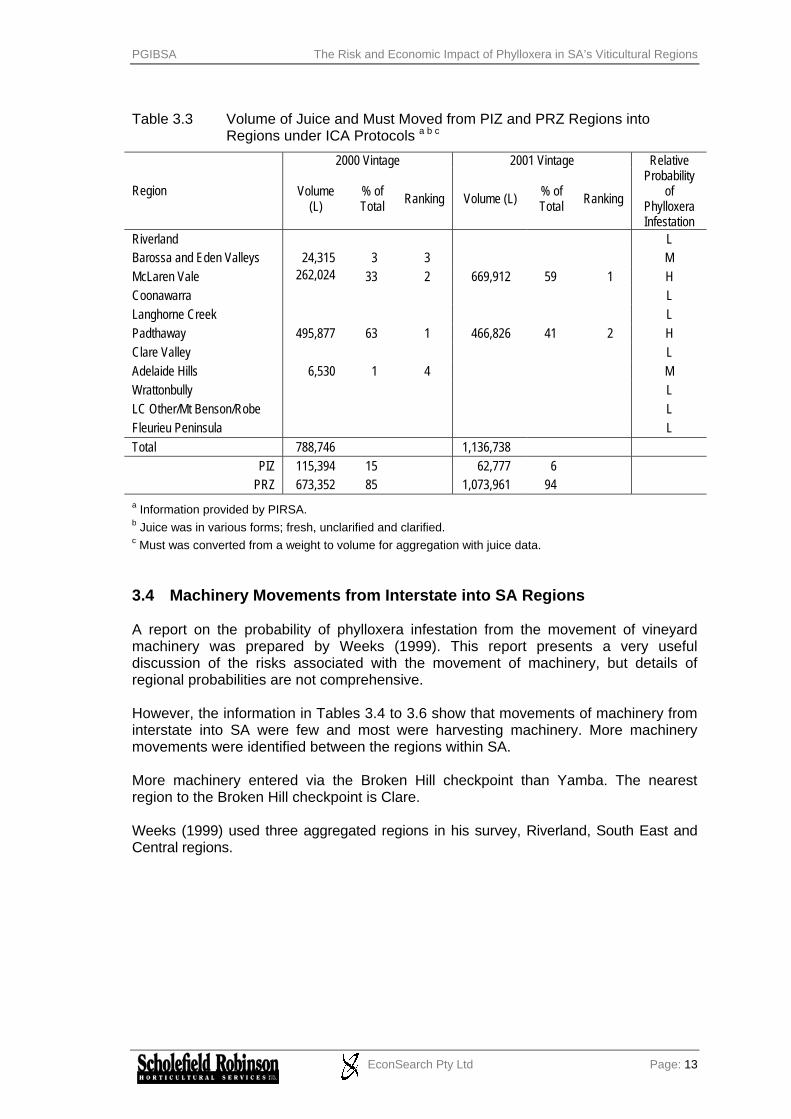
Areas All grape must and grape juice imported into SA from a PIZ or PRZ in other states must be under national ICA (Interstate Certification Assurance) protocols. Information on such imports was obtained from PIRSA for the 2000 and 2001 vintages (Table 3.3). Interstate Certification Protocols (ICA-22) for the entry of juice and must into SA came into effect in 1998. Prior to this date there were no restrictions on the movement of must or juice into SA. Of the total of 788,746 litres of must and juice imported during the 2000 vintage, 85% was imported from PRZ regions and 15% from a PIZ. Padthaway and McLaren Vale received 96% of the imported must and juice. In 2001, 1.1 million litres of must or juice was imported, with 94% from PRZ regions and 6% from PIZ regions. McLaren Vale and Padthaway were the only two regions where juice and must was processed. Because the ICA protocols require the cleaning of transport vehicles and inspection during loading and unloading, the movement of must and juice into South Australia is not considered to be factor with a high probability of phylloxera infestation. Also, the total quantity of must and juice brought into South Australia is relatively small.
PGIBSA The Risk and Economic Impact of Phylloxera in SA’s Viticultural Regions
EconSearch Pty Ltd Page: 13
Table 3.3 Volume of Juice and Must Moved from PIZ and PRZ Regions into
Regions under ICA Protocols a b c
2000 Vintage 2001 Vintage
Region Volume (L)
% of Total Ranking Volume (L) % of
Total Ranking
Relative Probability
of Phylloxera Infestation
Riverland L Barossa and Eden Valleys 24,315 3 3 M McLaren Vale 262,024
4 33 2 669,912 59 1 H
Coonawarra L Langhorne Creek L Padthaway 495,877 63 1 466,826 41 2 H Clare Valley L Adelaide Hills 6,530 1 4 M Wrattonbully L LC Other/Mt Benson/Robe L Fleurieu Peninsula L Total 788,746 1,136,738
PIZ 115,394 15 62,777 6 PRZ 673,352 85 1,073,961 94
a Information provided by PIRSA. b Juice was in various forms; fresh, unclarified and clarified. c Must was converted from a weight to volume for aggregation with juice data. 3.4 Machinery Movements from Interstate into SA Regions A report on the probability of phylloxera infestation from the movement of vineyard machinery was prepared by Weeks (1999). This report presents a very useful discussion of the risks associated with the movement of machinery, but details of regional probabilities are not comprehensive. However, the information in Tables 3.4 to 3.6 show that movements of machinery from interstate into SA were few and most were harvesting machinery. More machinery movements were identified between the regions within SA. More machinery entered via the Broken Hill checkpoint than Yamba. The nearest region to the Broken Hill checkpoint is Clare. Weeks (1999) used three aggregated regions in his survey, Riverland, South East and Central regions.

PGIBSA The Risk and Economic Impact of Phylloxera in SA’s Viticultural Regions
EconSearch Pty Ltd Page: 14
Table 3.4 The Probability of Phylloxera Infestation by Vineyard Machinery in SA’s
Viticultural Regions
Type of Equipment
Relative Probability of
Phylloxera Infestation a
Mechanical Harvesters H Cultivators/Trenchers/Excavators M Tractors, Grape bins, Buckets, Mechanical Pruners, Rippers, Augers M Sprayers, Planters, Trellis Equipment M Weedicide Sprayers, Slashers, Straw Spreaders L a H = High, M = Medium, L = Low Source: Weeks (1999) Table 3.5 Movements of Vineyard Equipment from Interstate and Within Regions
Movements Type of Equipment Within SA Interstate Grape Harvesters 2 15 Trellising Equipment 45 3 Source: Weeks (1999) Table 3.6 Main Points of Entry into South Australia
Main Points of Entry into SA Number
Broken Hill 9 Yamba 6 Pinnaroo 1 Bordertown 2
Source: Weeks (1999) Movement of wine tankers between regions is another type of equipment that could cause phylloxera infestation in South Australia’s viticultural regions. However, tankers moving from PIZ and PRZ regions are required to follow ICA protocols and this should minimise the probability of infestation. The Riverland and Clare are considered to have a medium relative probability of phylloxera infestation via machinery and all other areas a low probability of infestation. 3.5 Interstate Visitors to Wine Regions A wine tourism report (SATC 2001) surveyed visitors to cellar door outlets in five wine regions in South Australia. The survey asked visitors about where they lived, how they travelled, whether they stayed overnight in the region, etc. Of particular interest to our project was the information on interstate visitors.
PGIBSA The Risk and Economic Impact of Phylloxera in SA’s Viticultural Regions
EconSearch Pty Ltd Page: 15
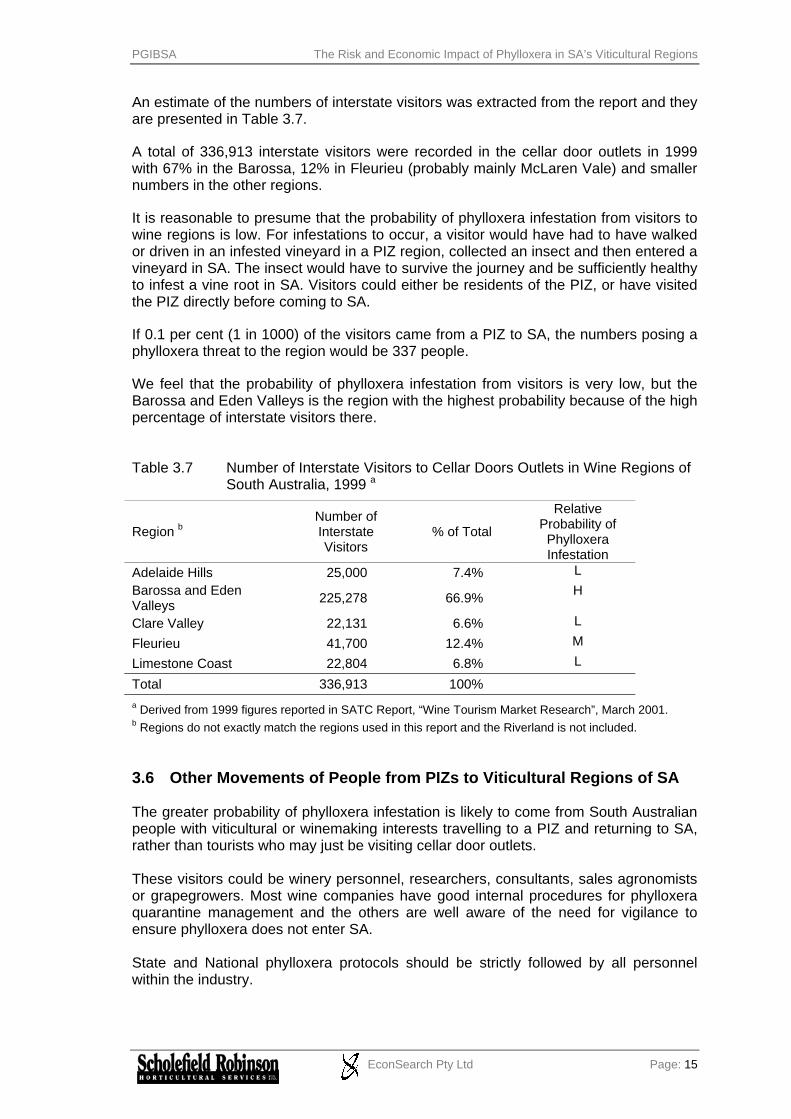
An estimate of the numbers of interstate visitors was extracted from the report and they are presented in Table 3.7.
A total of 336,913 interstate visitors were recorded in the cellar door outlets in 1999 with 67% in the Barossa, 12% in Fleurieu (probably mainly McLaren Vale) and smaller numbers in the other regions.
It is reasonable to presume that the probability of phylloxera infestation from visitors to wine regions is low. For infestations to occur, a visitor would have had to have walked or driven in an infested vineyard in a PIZ region, collected an insect and then entered a vineyard in SA. The insect would have to survive the journey and be sufficiently healthy to infest a vine root in SA. Visitors could either be residents of the PIZ, or have visited the PIZ directly before coming to SA.
If 0.1 per cent (1 in 1000) of the visitors came from a PIZ to SA, the numbers posing a phylloxera threat to the region would be 337 people.
We feel that the probability of phylloxera infestation from visitors is very low, but the Barossa and Eden Valleys is the region with the highest probability because of the high percentage of interstate visitors there. Table 3.7 Number of Interstate Visitors to Cellar Doors Outlets in Wine Regions of
South Australia, 1999 a
Region b Number of Interstate Visitors
% of Total
Relative Probability of
Phylloxera Infestation
Adelaide Hills 25,000 7.4% L Barossa and Eden Valleys 225,278 66.9% H
Clare Valley 22,131 6.6% L
Fleurieu 41,700 12.4% M
Limestone Coast 22,804 6.8% L
Total 336,913 100% a Derived from 1999 figures reported in SATC Report, “Wine Tourism Market Research”, March 2001. b Regions do not exactly match the regions used in this report and the Riverland is not included. 3.6 Other Movements of People from PIZs to Viticultural Regions of SA The greater probability of phylloxera infestation is likely to come from South Australian people with viticultural or winemaking interests travelling to a PIZ and returning to SA, rather than tourists who may just be visiting cellar door outlets. These visitors could be winery personnel, researchers, consultants, sales agronomists or grapegrowers. Most wine companies have good internal procedures for phylloxera quarantine management and the others are well aware of the need for vigilance to ensure phylloxera does not enter SA. State and National phylloxera protocols should be strictly followed by all personnel within the industry.

PGIBSA The Risk and Economic Impact of Phylloxera in SA’s Viticultural Regions
EconSearch Pty Ltd Page: 16
3.7 Recent Plantings of Vineyards in SA’s Viticultural Regions The level of new planting is another factor that would impact on the probability of a phylloxera infestation.
Table 3.8 presents the areas of vineyard in each of the viticultural regions up to the year 2000 and the expansion of this area that has occurred since 1997. The Riverland region has both the largest area of vineyards and the greatest expansion of area since 1997.
The regions with the greatest increase in vineyard area since 1997 have a higher probability of phylloxera infestation than areas with less plantings. In periods of high demand for planting material, there may be a temptation for vines to be sourced from areas that are less “safe”. Also, many of the new players in the grapegrowing industry may not be as aware of the dangers of sourcing planting material from other than PEZ areas. Table 3.8 Total Vineyard Area by Viticultural Region in 2000 and Increase Since
1997
Region Vineyard Area 2000 (ha)
Plantings since 1997 (ha)
Relative Probability of
Phylloxera Infestation
Riverland 18,245 6,416 H Barossa and Eden Valleys 9,313 2,639 H McLaren Vale 5,189 1,652 M Coonawarra 4,957 1,512 M Langhorne Creek 4,752 2,483 H Padthaway 3,290 624 L Clare Valley 4.434 1,935 H Adelaide Hills 2,476 1,441 M Wrattonbully 1,347 637 L LC Other/Mt Benson/Robe 2,537 1,394 M Fleurieu Peninsula 592 444 L SA Other 786 393 -
TOTAL 57,919 21,590
Source: PGIBSA (2001). 3.8 Overall Probability of Phylloxera Infestation in SA’s Viticultural
Regions All of the factors discussed above were ranked low, medium and high for the relative probability of causing an infestation in each of the regions. Each factor was then allocated a weighting of low, medium and high depending on the relative importance of this factor. For example, entry of planting material was given a weighting of medium (score 2). The Riverland had a high ranking (score 3) for entry of planting material. The score for the Riverland for entry of planting material was therefore 2 x 3 = 6.
PGIBSA The Risk and Economic Impact of Phylloxera in SA’s Viticultural Regions
EconSearch Pty Ltd Page: 17
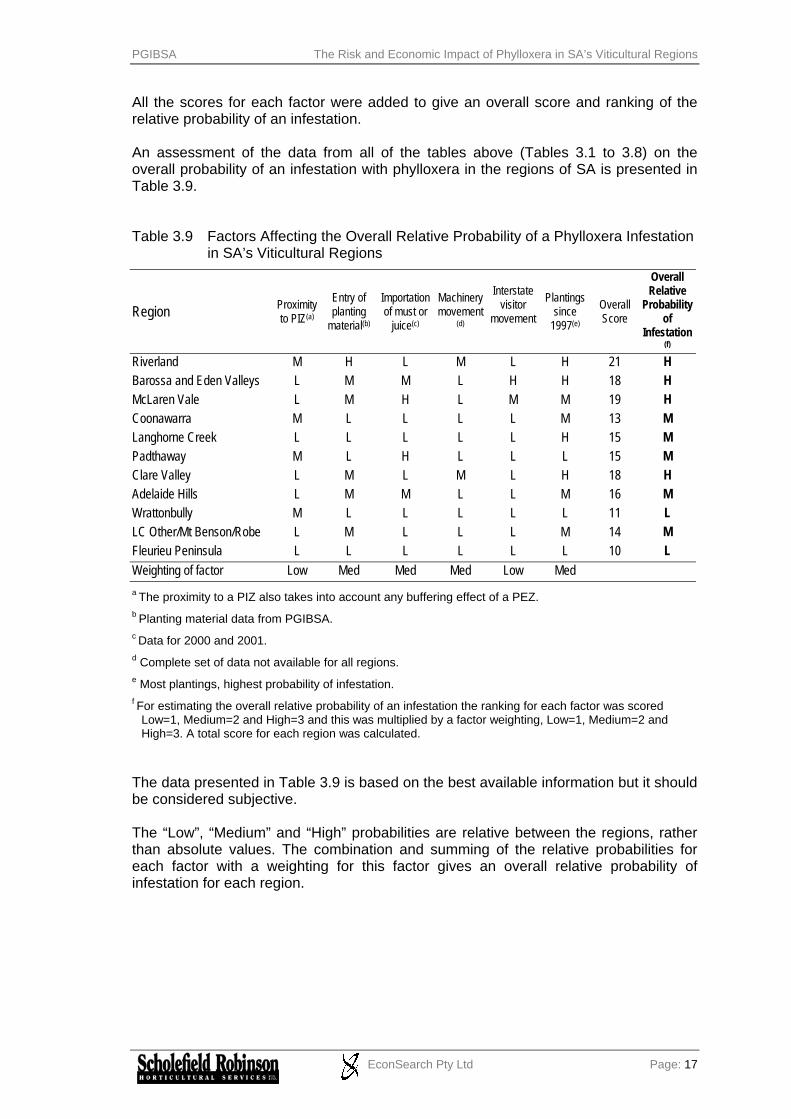
All the scores for each factor were added to give an overall score and ranking of the relative probability of an infestation. An assessment of the data from all of the tables above (Tables 3.1 to 3.8) on the overall probability of an infestation with phylloxera in the regions of SA is presented in Table 3.9. Table 3.9 Factors Affecting the Overall Relative Probability of a Phylloxera Infestation
in SA’s Viticultural Regions
Region Proximity to PIZ(a)
Entry of planting
material(b)
Importation of must or
juice(c)
Machinery movement
(d)
Interstate visitor
movement
Plantings since
1997(e)
Overall Score
Overall Relative
Probability of
Infestation (f)
Riverland M H L M L H 21 H Barossa and Eden Valleys L M M L H H 18 H McLaren Vale L M H L M M 19 H Coonawarra M L L L L M 13 M Langhorne Creek L L L L L H 15 M Padthaway M L H L L L 15 M Clare Valley L M L M L H 18 H Adelaide Hills L M M L L M 16 M Wrattonbully M L L L L L 11 L LC Other/Mt Benson/Robe L M L L L M 14 M Fleurieu Peninsula L L L L L L 10 L Weighting of factor Low Med Med Med Low Med a The proximity to a PIZ also takes into account any buffering effect of a PEZ. b Planting material data from PGIBSA. c Data for 2000 and 2001. d Complete set of data not available for all regions. e Most plantings, highest probability of infestation. f For estimating the overall relative probability of an infestation the ranking for each factor was scored
Low=1, Medium=2 and High=3 and this was multiplied by a factor weighting, Low=1, Medium=2 and High=3. A total score for each region was calculated.
The data presented in Table 3.9 is based on the best available information but it should be considered subjective. The “Low”, “Medium” and “High” probabilities are relative between the regions, rather than absolute values. The combination and summing of the relative probabilities for each factor with a weighting for this factor gives an overall relative probability of infestation for each region.
PGIBSA The Risk and Economic Impact of Phylloxera in SA’s Viticultural Regions
EconSearch Pty Ltd Page: 18
4. Probability of Spread of Phylloxera in SA’s Viticultural Regions after an Infestation (Internal Factors)
The rate at which phylloxera will spread in a viticultural region after an initial infestation is likely to be affected by a number of factors. One of the most worrying facts is that phylloxera is often not detected for a number of years and, by then, spread may be significant. Therefore, awareness, vigilance and constant monitoring for phylloxera are critical components of any phylloxera control strategy. The factors assessed for probability of spread within a region were:
• soil type; • proximity of vineyards to each other (vineyard concentration); • area of rootstocks already planted; • movement of grapes and must within and between regions; and • movement of machinery, vineyard personnel and visitors within a region (little data
available). 4.1 Soil Type The current accepted thinking is that phylloxera spreads more rapidly in heavy textured soils that crack when dry, or in friable, well-structured soils with reasonable clay content. These soils allow the easy movement of phylloxera crawlers into the soil to infest vine roots. Information was obtained from PIRSA Land Information on the texture of the surface soils in South Australia’s viticultural regions. Data was not available on subsurface soil textures. The PGIBSA is currently funding research on phylloxera survival rates in different soil types. Information on the rate of spread in different soil types is scarce. However, experience in the King Valley in Victoria and in Oregon (USA), suggests that spread is rapid in friable, well-structured soils. Figure 4.1 shows the distribution of soils of different surface texture in SA’s key viticultural regions.

PGIBSA The Risk and Economic Impact of Phylloxera in SA’s Viticultural Regions
EconSearch Pty Ltd Page: 19
Figure 4.1 Surface Soil Texture in South Australia’s Key Viticultural Regions

PGIBSA The Risk and Economic Impact of Phylloxera in SA’s Viticultural Regions
EconSearch Pty Ltd Page: 20
The location of vineyards in each of the regions was matched with surface soil texture and the percentage of vineyard area with heavy soil textures (sandy clay loam to heavy clay) was calculated. Table 4.1 presents these data. Coonawarra and Padthaway had the greatest proportion of heavy textured soils while Adelaide Hills and Mt Benson/Robe had the lowest proportion of heavy textured soil. The spread of phylloxera in Coonawarra and Padthaway would be faster than other areas, based on soil texture alone. Table 4.1 Surface Soil Texture in SA’s Key Viticultural Regions
Region Percentage of heavy surface soil texture in
vineyards a
Relative Probability of Spread of Phylloxera b
Riverland 14 M Barossa and Eden Valleys 15 M McLaren Vale 14 M Coonawarra 62 H Langhorne Creek 20 M Padthaway 31 M Clare Valley 9 L Adelaide Hills 1 L Wrattonbully 22 M LC Other/Mt Benson/Robe 0 L Fleurieu Peninsula 2 L a Heavy textures defined as Sandy Clay Loam (SCL) to Cracking Clay (CC). b Highest percentage of heavy textured soils, more probability of spread of phylloxera. 4.2 Vineyard Concentration The proximity of vineyards to other vineyards in a region is an important factor in assessing the probability of spread of phylloxera after an infestation. If vineyards are located within close proximity to each other, the probability of spread will be greater from actual movement of phylloxera crawlers and/or from movement on equipment or personnel. Maps of each viticultural region with the location and area of all vineyards were provided by PGIBSA. For each region, a line was drawn around the area containing the main concentration of vineyards. The area of vineyards within this concentrated “sub-region” was compared with the total area of the “sub-region” and a concentration of planting calculated. This provided a relative measure of the proximity of vineyards to each other and hence some indication of the relative probability of movement of phylloxera between vineyards due to their proximity. Figure 4.2 shows the Geographical Indications (GI) boundary, location of vineyards and the selected sub-area where the main concentration of vineyards occurs for McLaren Vale and the Fleurieu Other region. These two regions were chosen to illustrate the highest and the lowest concentration of vineyard plantings amongst South Australia’s key viticultural regions.

PGIBSA The Risk and Economic Impact of Phylloxera in SA’s Viticultural Regions
EconSearch Pty Ltd Page: 21
Figure 4.2 Relative Concentration of Vineyard Plantings in the McLaren Vale and Fleurieu Peninsula Regions
Source: PGIBSA

PGIBSA The Risk and Economic Impact of Phylloxera in SA’s Viticultural Regions
EconSearch Pty Ltd Page: 22
Table 4.2 presents the areas of vineyards in the selected sub-areas and the concentration of vineyard plantings within this sub-area of the region. The sub-area in McLaren Vale has a concentration of 29.4 hectares of vineyard per square kilometre, while in the Fleurieu Other sub-area vineyard concentration was only 0.7 hectares of vineyard per square kilometre. Regions were ranked for the relative concentration of vineyards within the sub-area. McLaren Vale, Langhorne Creek and Coonawarra had the highest concentration while Fleurieu Other, Adelaide Hills and Mt Benson/Robe had the lowest concentration. This data indicates that spread of phylloxera from one vineyard to another is more likely in McLaren Vale, Coonawarra, and Langhorne Creek where the concentration of vineyards is higher. Table 4.2 Concentration of Vineyards in Selected Areas of GI where Vineyards are
Mainly Located
Region Sub-area (ha)(a)
A
Vineyard area in sub-area
(ha) B
Concentration (ha vines/km2)
Relative Probability of
Spread of Phylloxera
Riverland 116,363 15,305 13.2 M Barossa and Eden Valleys 63,865 5,698 9.4 M
McLaren Vale 17,610 5,177 29.4 H Coonawarra 26,020 4,817 18.5 H Langhorne Creek 19,630 3,617 18.4 H Padthaway 20,123 3,225 16.0 M Clare Valley 39,042 2,453 6.3 L Adelaide Hills 83,523 2,245 2.7 L Wrattonbully 27,067 1,210 4.5 L LC Other/Mt Benson/Robe 22,526 698 3.1 L
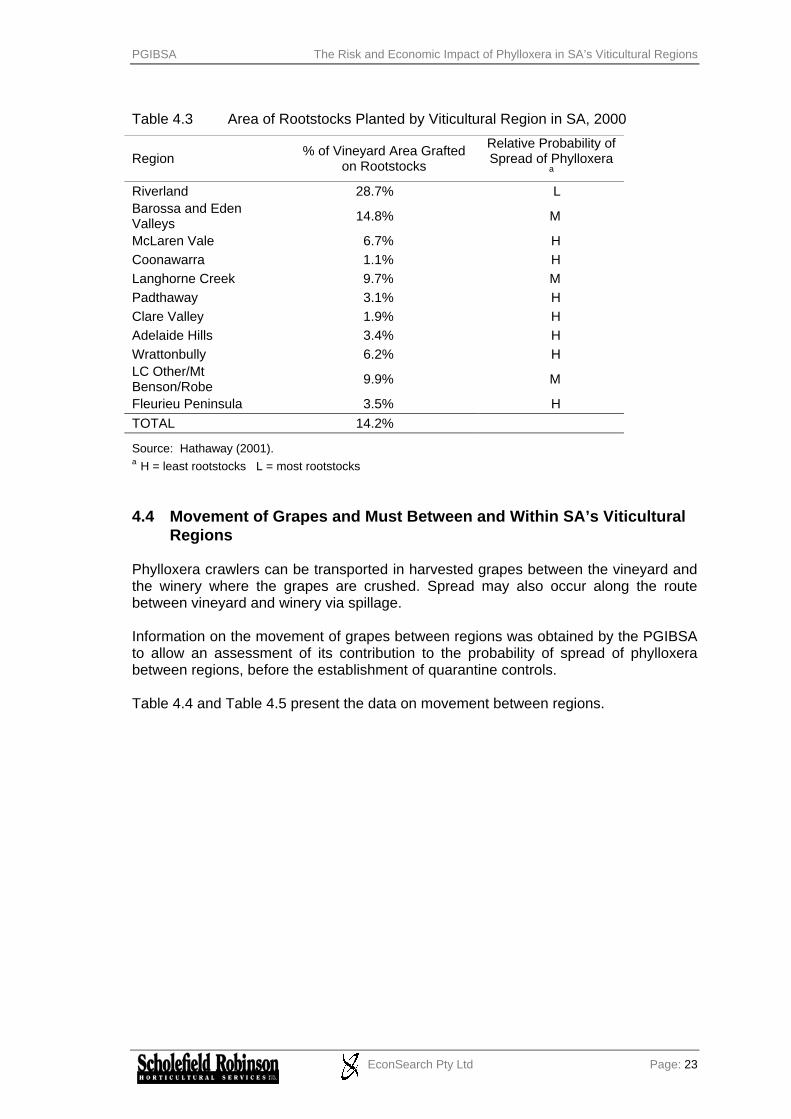
Fleurieu Other 43,534 300 0.7 L a The sub-area was selected by drawing a line around the area containing most of the vineyards. 4.3 Vineyards Grafted on Resistant Rootstocks The planting of Vitis vinifera species of grape varieties grafted on phylloxera-resistant rootstocks is the only long-term control measure available in the event of an infestation. Rootstocks are also used for nematode control and many of these rootstocks are also effective against phylloxera. A survey of growers conducted by PGIBSA provided estimates of the areas planted to rootstocks and attitudes of growers towards rootstocks (Hathaway 2001). Table 4.3 presents the areas of rootstocks planted in SA’s viticultural regions in 2000. In the event of a phylloxera infestation, those regions with more rootstocks already planted will have a much better capacity to cope with the inevitable outbreak. The Riverland has 28.7% of its area planted to rootstocks, Barossa/Eden Valley 14.8% and all the other regions have less than 10% of plantings on rootstocks.
PGIBSA The Risk and Economic Impact of Phylloxera in SA’s Viticultural Regions
EconSearch Pty Ltd Page: 23
Table 4.3 Area of Rootstocks Planted by Viticultural Region in SA, 2000
Region % of Vineyard Area Grafted on Rootstocks
Relative Probability of Spread of Phylloxera
a Riverland 28.7% L Barossa and Eden Valleys 14.8% M
McLaren Vale 6.7% H Coonawarra 1.1% H Langhorne Creek 9.7% M Padthaway 3.1% H Clare Valley 1.9% H Adelaide Hills 3.4% H Wrattonbully 6.2% H LC Other/Mt Benson/Robe 9.9% M
Fleurieu Peninsula 3.5% H TOTAL 14.2%
Source: Hathaway (2001). a H = least rootstocks L = most rootstocks 4.4 Movement of Grapes and Must Between and Within SA’s Viticultural
Regions Phylloxera crawlers can be transported in harvested grapes between the vineyard and the winery where the grapes are crushed. Spread may also occur along the route between vineyard and winery via spillage. Information on the movement of grapes between regions was obtained by the PGIBSA to allow an assessment of its contribution to the probability of spread of phylloxera between regions, before the establishment of quarantine controls. Table 4.4 and Table 4.5 present the data on movement between regions.

PGIBSA The Risk and Economic Impact of Phylloxera in SA’s Viticultural Regions
EconSearch Pty Ltd Page: 24
Table 4.4 Grapes Crushed in Regions that are Sourced from Outside the Region, 2001
Region Total Grape
Production of Region (t)
Total Grapes Crushed (t)
Tonnes Crushed from
Outside Region a
Relative Probability of
Spread of Phylloxera b
Riverland 327,104 267,110 13,356 M
Barossa Valley 53,898 185,215 138,911 H Eden Valley 11,131 0 0 M McLaren Vale 55,872 39,148 17,617 M Coonawarra 53,125 51,934 23,370 M Langhorne Creek 51,309 16,168 9,539 M Padthaway 36,116 13,600 7,480 M Clare Valley 23,493 9,717 1,555 L Adelaide Hills 18,920 2,484 1,565 L Wrattonbully 16,172 3,899 3,509 L LC Other/Mt Benson/Robe 10,945 0 0 L
Fleurieu Other 5,066 1,985 655 L
Source: PGIBSA a For example, in the Barossa 75% of grapes crushed come from outside the region. b H = most grapes crushed from outside regions.
Table 4.5 Grapes Sent to Other Regions for Crushing, 2001
Region Total Grape
Production of Region (t)
Grapes to Other Regions for Crushing
(t) a Riverland 327,104 55,608 Barossa Valley 53,898 11,670 Eden Valley 11,131 11,131 McLaren Vale 55,872 21,790 Coonawarra 53,125 15,406 Langhorne Creek 51,309 43,100 Padthaway 36,116 29,615 Clare Valley 23,493 10,572 Adelaide Hills 18,920 17,596 Wrattonbully 16,172 15,849 LC Other/Mt Benson/Robe 10,945 10,945
Fleurieu Other 5,066 3,850
Source: PGIBSA a For example, in the Adelaide Hills 93% of grapes sent for crushing in another region.

PGIBSA The Risk and Economic Impact of Phylloxera in SA’s Viticultural Regions
EconSearch Pty Ltd Page: 25
4.5 Overall Probability of Spread of Phylloxera in SA’s Viticultural Regions
The overall assessment of the relative probability of spread of phylloxera in a region following an outbreak of phylloxera has been estimated using the ranking for each factor combined with a relative weighting for each factor. Table 4.6 presents the findings. The probability of spread of phylloxera for each factor was ranked as Low (1), Medium (2) or High (3). The factors; surface soil texture, concentration of vineyards, movement of grapes and percentage of plantings on rootstocks have weightings of 3, 2, 2 and 2 respectively. The product of the probability multiplied by the weighting for each factor gives a score for each region which provides a relative overall ranking of Low, Medium or High for each region. Table 4.6 Factors Affecting Overall Probability of Spread of Phylloxera in SA’s Key
Viticultural Regions a
Region Surface
Soil Texture
Concentration of
Vineyards
Movement of
Grapes into
Region for Crushing
Rootstock Score
Overall Relative
Probability of Spread
of Phylloxera
Riverland M M M L 16 M Barossa and Eden Valleys M M H M 20 H
McLaren Vale M H M H 22 H Coonawarra H H M H 25 H Langhorne Creek M H M M 20 H
Padthaway M M M H 20 H Clare Valley L L L H 13 L Adelaide Hills L L L H 13 L Wrattonbully M L L H 16 M LC Other/Mt Benson/Robe L L L M 11 L Fleurieu Peninsula L L L H 13 L
Weighting of factor High Med Med Med
a L = Low probability of spread due to this factor, M = Medium, H = High.
PGIBSA The Risk and Economic Impact of Phylloxera in SA’s Viticultural Regions
EconSearch Pty Ltd Page: 26
5. Approach to the Economic Impact Analysis This section of the report provides an assessment of the likely economic impact of a phylloxera outbreak in one or more of South Australia’s key viticultural regions (Table 1.1). Estimates are provided for the likely economic impact on:
• individual vineyards; • regional grape and wine production; • regional economies; • the South Australian grape and wine industry; and • the South Australian economy.
5.1 Impact on Individual Vineyards Step 1 Construct representative financial models A ‘representative vineyard’ financial model was prepared for each of the 11 viticultural regions with region-specific data such as the average size of vineyard, varietal mix, yield, price, input mix and cost of inputs. Step 2 Prepare baseline financial indicators – no phylloxera outbreak Using the models from Step 1, a set of baseline financial indicators was prepared for the representative vineyards in each of the 11 regions. The models were run over a 20-year period and simulated the development of the vineyard to maturity and its ongoing maintenance. ‘Whole-of-vineyard’ indicators were prepared for the total enterprise and presented graphically. Step 3 Impact on individual vineyards of a phylloxera outbreak Modelling the impact of a phylloxera outbreak on individual vineyards required the estimation of the impact of an outbreak on a range of key vineyard management and physical variables (including yield, price and input costs). Using the models from Step 1, the set of baseline financial indicators were re-estimated for the representative vineyards in each of the 11 regions. As for Step 2, ‘whole-of-vineyard’ indicators were prepared for the total enterprise and presented graphically. 5.2 Impact on Regional Grape and Wine Production Step 1 Baseline regional grape and wine production Data were collated on the volume and value of grape and wine production in each of the 11 regions, using the 2001 vintage as the baseline year. There are substantial movements of grapes around the state for wine making and estimates were made of these flows between regions by the PGIBSA. Based on current industry forecasts an assessment was made of the volume and value of grape and wine production in each of the 11 regions over a period of 10 years.

PGIBSA The Risk and Economic Impact of Phylloxera in SA’s Viticultural Regions
EconSearch Pty Ltd Page: 27
Step 2 Estimate impacts of an outbreak on regional grape production The impact on grape production in a particular region will depend on, for example:
• the impact on individual growers (estimated as part of 5.1);
• the rate of spread of the disease within the region; and
• the impact on the demand for product from the region. An assessment of the impact of an outbreak on grape production was made for each of the 11 regions taking into account these and other key factors. Again, the impact will be felt for more than the year of the outbreak and so the assessment provides a profile over a number of years of the likely impact on grape production and the value of that production. Step 3 Estimate impacts of an outbreak on regional wine production The impact on wine production in a particular region will depend on, for example:
• local grape production; and
• the response by winemakers in the region to any local supply shortfalls. An assessment of the impact of an outbreak on wine production was made for each of the 11 regions taking into account these factors. As with production, the impact will be felt for more than the year of the outbreak and so the assessment provided a profile over a number of years of the likely impact on regional wine production and the value of that production. Step 4 Impact on regional grape and wine production of a phylloxera outbreak Using the with and without approach, the baseline values from Step 1 (without an outbreak) were compared with the estimates from Steps 2 and 3 (with an outbreak) to give an estimate of the impact on regional grape and wine production (11 regions) of a phylloxera outbreak. It is worth noting that outbreaks in some regions may, depending on the degree of inter-regional grape substitutability and other substitution effects, result in severe impacts locally but create positive price and production stimuli elsewhere. In this regard it was important to distinguish between short and long term impacts. As far as possible, such complexities were incorporated into the analysis. Any assumptions regarding price and quantity response were clearly spelt out. 5.3 Impact on the Regional Economy The methodology employed in this study for measurement of economic impacts was input-output analysis. Input-output analysis provides a standard approach for the estimation of the economic impact of a particular activity. The input-output model is used to calculate industry multipliers that can then be applied to various scenarios. While input-output analysis has a number of limitations, it is widely used in economic impact analysis and is the only practical method for measuring economic impacts at the regional level5.
5 For an outline of input-output methodology and terminology refer to Appendices 2 and 3 respectively.

PGIBSA The Risk and Economic Impact of Phylloxera in SA’s Viticultural Regions
EconSearch Pty Ltd Page: 28
EconSearch has developed, for PIRSA Sustainable Resources (and other agencies), a set of regional input-output tables for South Australia. The regional models that were used for each of the 11 viticultural regions are shown in Table 5.1. Table 5.1 Regional Economic Models and Viticultural Regions
Regional Economic Model Viticultural Regions Riverland a Riverland
South Central b Barossa and Eden Valleys Langhorne Creek McLaren Vale Adelaide Hills Fleurieu Peninsula
South East c Coonawarra Padthaway Wrattonbully Mt Benson/Robe
Northern Agricultural Districts d Clare Valley a EconSearch 2000b. b Hassell 1998. c EconSearch 2001a. d EconSearch 2000a. The following steps were involved in estimating the impacts of a phylloxera outbreak on the regional economy. Step 1 Baseline assessment of grape and wine industry impact The grape growing and wine producing activities of a particular viticultural region were specified in the relevant regional economic model. This included total regional employment in these activities, payments of wages and salaries and purchases of goods and services from other local industries. These data were derived from the analyses undertaken earlier (impact on individual vineyards and regional grape and wine production). The model was used to calculate the grape and wine industry multipliers and thereby estimate the impact the industry has on the regional economy. These impacts were specified in terms of the following regional economic indicators6:
• Value of output (business turnover);
• Employment;
• Household income; and
• Value added
6 Refer to Appendix 3: Glossary of Input-Output Terminology for a definition of these terms.
PGIBSA The Risk and Economic Impact of Phylloxera in SA’s Viticultural Regions
EconSearch Pty Ltd Page: 29
Step 2 Estimate impacts of an outbreak on the regional economy Based on the analysis conducted in 5.2, the regional economic model was adjusted to reflect the changes in grape and wine production in the region following the outbreak of phylloxera. Multipliers for these ‘adjusted’ industries were estimated and flow-on effects of the industry (with outbreak) on the regional economy estimated. Step 3 Impact on the regional economy of a phylloxera outbreak Using the with and without approach, the baseline values from Step 1 (without an outbreak) were compared with the estimates from Steps 2 and 3 (with an outbreak) to give an estimate of the net impact on regional grape and wine production of a phylloxera outbreak. Steps 1 to 3 were repeated for each of the 11 regions. 5.4 Impact on the South Australian Grape and Wine Industry The economic impact of phylloxera on the South Australian grape and wine industry was described in qualitative terms, based on discussions with industry representatives and stakeholders. 5.5 Impact on the South Australian Economy The process described for 5.3 (regional economy impact) was repeated at the state level. EconSearch has updated the state input-output table for the Department of Industry and Trade (SA). This model, specified in terms of 1999/00 economic activity, was available for use in the impact assessment (EconSearch 2001b).
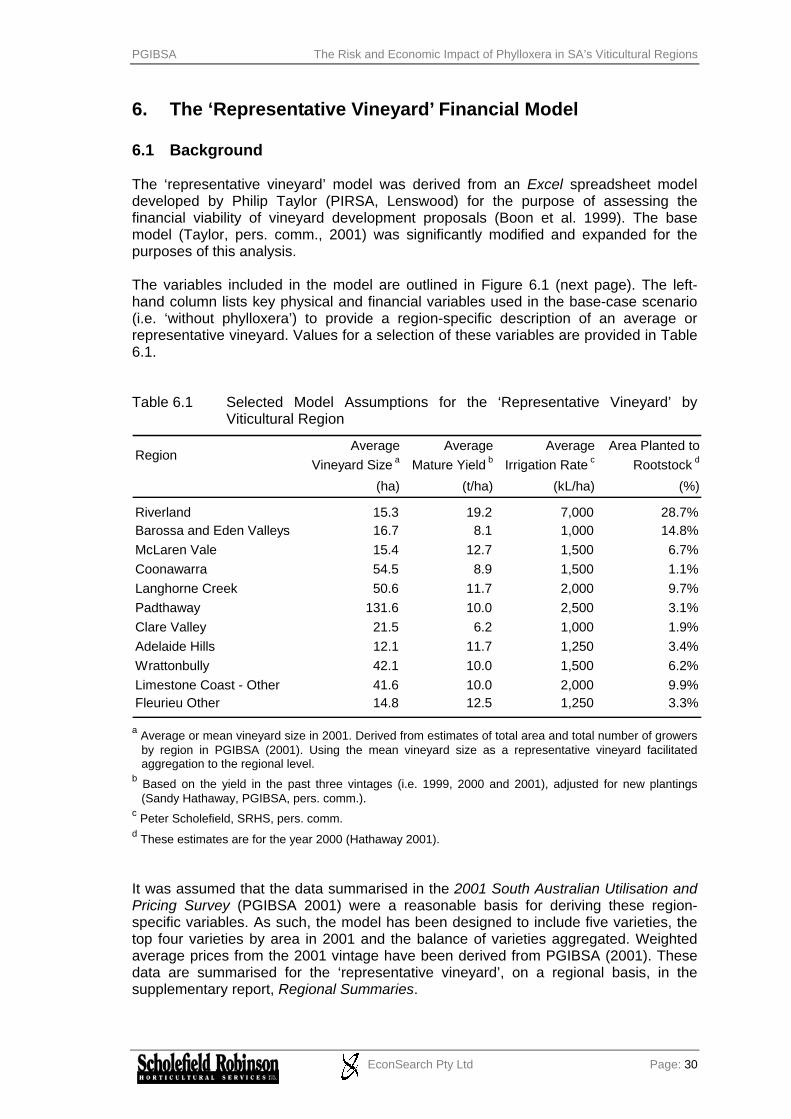
PGIBSA The Risk and Economic Impact of Phylloxera in SA’s Viticultural Regions
EconSearch Pty Ltd Page: 30
6. The ‘Representative Vineyard’ Financial Model 6.1 Background The ‘representative vineyard’ model was derived from an Excel spreadsheet model developed by Philip Taylor (PIRSA, Lenswood) for the purpose of assessing the financial viability of vineyard development proposals (Boon et al. 1999). The base model (Taylor, pers. comm., 2001) was significantly modified and expanded for the purposes of this analysis. The variables included in the model are outlined in Figure 6.1 (next page). The left-hand column lists key physical and financial variables used in the base-case scenario (i.e. ‘without phylloxera’) to provide a region-specific description of an average or representative vineyard. Values for a selection of these variables are provided in Table 6.1. Table 6.1 Selected Model Assumptions for the ‘Representative Vineyard’ by
Viticultural Region
a Average or mean vineyard size in 2001. Derived from estimates of total area and total number of growers by region in PGIBSA (2001). Using the mean vineyard size as a representative vineyard facilitated aggregation to the regional level.
b Based on the yield in the past three vintages (i.e. 1999, 2000 and 2001), adjusted for new plantings (Sandy Hathaway, PGIBSA, pers. comm.).
c Peter Scholefield, SRHS, pers. comm. d These estimates are for the year 2000 (Hathaway 2001). It was assumed that the data summarised in the 2001 South Australian Utilisation and Pricing Survey (PGIBSA 2001) were a reasonable basis for deriving these region-specific variables. As such, the model has been designed to include five varieties, the top four varieties by area in 2001 and the balance of varieties aggregated. Weighted average prices from the 2001 vintage have been derived from PGIBSA (2001). These data are summarised for the ‘representative vineyard’, on a regional basis, in the supplementary report, Regional Summaries.
RegionAverage
Vineyard Size a Average
Mature Yield b Average
Irrigation Rate c Area Planted to
Rootstock d
(ha) (t/ha) (kL/ha) (%)
Riverland 15.3 19.2 7,000 28.7%Barossa and Eden Valleys 16.7 8.1 1,000 14.8%McLaren Vale 15.4 12.7 1,500 6.7%Coonawarra 54.5 8.9 1,500 1.1%Langhorne Creek 50.6 11.7 2,000 9.7%Padthaway 131.6 10.0 2,500 3.1%Clare Valley 21.5 6.2 1,000 1.9%Adelaide Hills 12.1 11.7 1,250 3.4%Wrattonbully 42.1 10.0 1,500 6.2%Limestone Coast - Other 41.6 10.0 2,000 9.9%Fleurieu Other 14.8 12.5 1,250 3.3%

PGIBSA The Risk and Economic Impact of Phylloxera in SA’s Viticultural Regions
EconSearch Pty Ltd Page: 31
Figure 6.1 Regional Variables Used in the Representative Vineyard Model
Without Phylloxera With Phylloxera Physical variables Physical variables (as for Without
Phylloxera model plus those below)
Financial variables Financial variables (as for Without
Phylloxera model plus those below)
Current (2001) plantings by variety and a breakdown of areas planted pre-1998, 1998, 1999, and 2000. Source: PGIBSA (2001)
Average vineyard size. Varietal mix: five varieties – top four single varieties by current (2001) area and all other varieties aggregated. Source: PGIBSA (2001)
Mature yield by variety. Yield of current plantings. Growth of yield for future plantings. Source: PGIBSA and Taylor (2001)
Irrigation rate. Source: SRHS
Row width and vine spacing. Source: SRHS
Variable costs: including proportion machine harvested and pruned. Source: Taylor (2001) and SRHS
Overhead costs. Source: Taylor (2001), EconSearch and SRHS
Future planting program by variety for the twenty-year period, 2002 to 2021. Source: PGIBSA (2001), SRHS and EconSearch
Capital and overhead costs of the future planting program. Source: Taylor (2001), EconSearch and SRHS
Area of each variety permanently removed in the years subsequent to the discovery of the phylloxera infestation. Source: EconSearch and SRHS
Area of each variety replanted to rootstock in the years subsequent to the discovery of the phylloxera infestation. Source: EconSearch and SRHS
Capital and overhead costs of the vine-pull and replanting programs. Source: Taylor (2001), EconSearch and SRHS
Weighted average prices by variety for the 2001 vintage. Price penalty for grapes from young vines. Source: PGIBSA (2001) and SRHS
Price penalty for vineyards in a PIZ. Used as a proxy for inter-regional grape substitutability. Source: EconSearch and SRHS
Rate of decline (yield penalty) for phylloxera infested areas and rate of spread within the vineyard. Proportion of vineyard planted to soils with a heavy surface texture. Source: EconSearch and SRHS

PGIBSA The Risk and Economic Impact of Phylloxera in SA’s Viticultural Regions
EconSearch Pty Ltd Page: 32
The ‘with phylloxera’ scenario in Figure 6.1 provides a region-specific description of an average or representative vineyard in the following situations:
• located in a viticultural region with a PIZ (Phylloxera Infested Zone) but not located in the PIZ;
• located in a PIZ but not infested with phylloxera; and • located in a PIZ and infested with phylloxera (grower or winery-owned).
6.2 The Basic Premise of the Model The basic premise of the model is that individual growers, in response to current market signals and/or a phylloxera outbreak in 20017, would respond over the next twenty years with some mix of:
• new plantings; • re-plantings with rootstock; and • vine-pull.
On the basis of the relevant mix the model was used to estimate, in current prices, the physical and financial response to these developments. 6.2.1 The ‘without phylloxera’ scenario In the ‘without phylloxera’ scenario it was assumed that growers, over the five year period 2002 to 2006, would undertake a planting program based on the discrepancy between actual winery usage of their fruit in 2001 and preferred usage in 2006, as outlined in PGIBSA (2001). Details are provided on a regional basis in the supplementary report, Regional Summaries. For the years 2007 to 2021, in the absence of other information, it was assumed that individual growers would undertake new plantings at half the annual rate forecast for the period 2002 to 2006. Where the region is a Phylloxera Exclusion Zone (PEZ), the proportion of rootstock used in new plantings and re-plantings would reflect that in current plantings (Table 6.1). 6.2.2 The ‘with phylloxera’ scenario Rate of yield decline and rate of spread with phylloxera In the ‘with phylloxera’ scenario it has been assumed that a phylloxera infestation occurs in the current year (2001) but is not detected until 2003. Based on experience with phylloxera in Victoria, it was assumed that the rate of decline in yield for any given phylloxera infested area was 12 per cent per annum on soils with a heavy surface texture (clay), 7 per cent per annum on soils with a medium surface texture (clay/sand) and 2 per cent per annum on soils with a light surface texture (sand).
7 The base year for the analysis was assumed to be 2001.
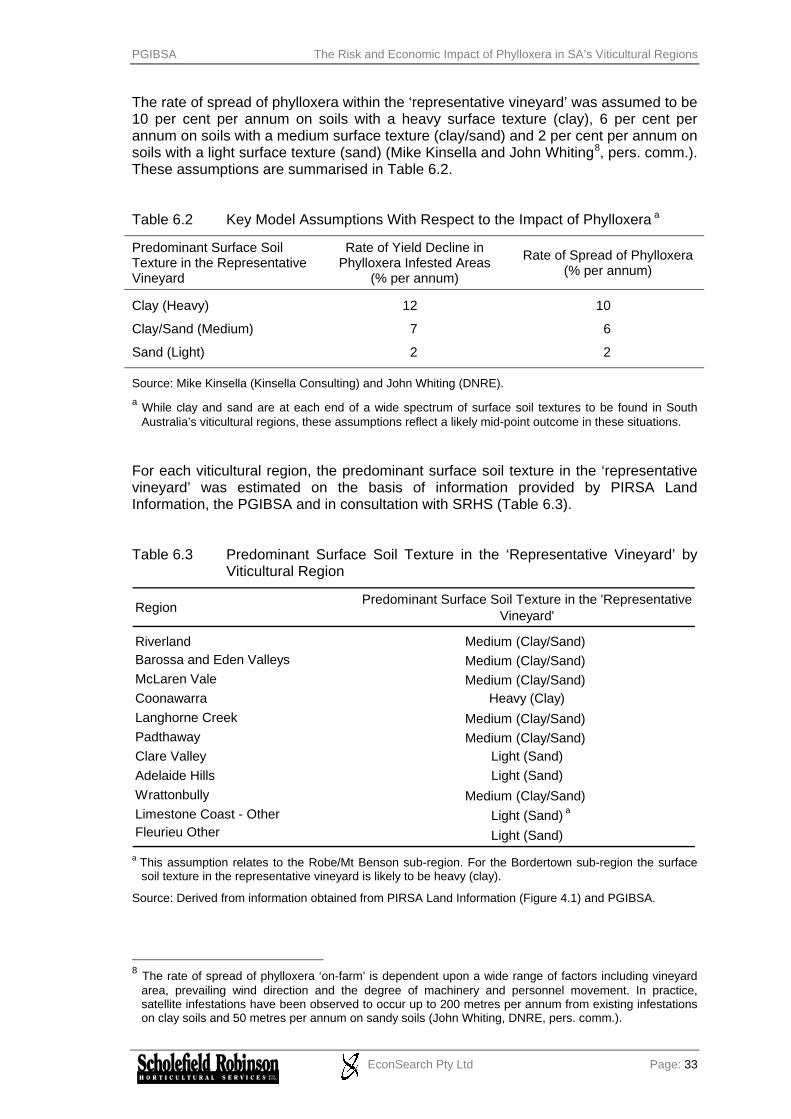
PGIBSA The Risk and Economic Impact of Phylloxera in SA’s Viticultural Regions
EconSearch Pty Ltd Page: 33
The rate of spread of phylloxera within the ‘representative vineyard’ was assumed to be 10 per cent per annum on soils with a heavy surface texture (clay), 6 per cent per annum on soils with a medium surface texture (clay/sand) and 2 per cent per annum on soils with a light surface texture (sand) (Mike Kinsella and John Whiting8, pers. comm.). These assumptions are summarised in Table 6.2. Table 6.2 Key Model Assumptions With Respect to the Impact of Phylloxera a
Predominant Surface Soil Texture in the Representative Vineyard
Rate of Yield Decline in Phylloxera Infested Areas
(% per annum)
Rate of Spread of Phylloxera(% per annum)
Clay (Heavy) 12 10
Clay/Sand (Medium) 7 6
Sand (Light) 2 2
Source: Mike Kinsella (Kinsella Consulting) and John Whiting (DNRE). a While clay and sand are at each end of a wide spectrum of surface soil textures to be found in South
Australia’s viticultural regions, these assumptions reflect a likely mid-point outcome in these situations. For each viticultural region, the predominant surface soil texture in the ‘representative vineyard’ was estimated on the basis of information provided by PIRSA Land Information, the PGIBSA and in consultation with SRHS (Table 6.3). Table 6.3 Predominant Surface Soil Texture in the ‘Representative Vineyard’ by
Viticultural Region
a This assumption relates to the Robe/Mt Benson sub-region. For the Bordertown sub-region the surface soil texture in the representative vineyard is likely to be heavy (clay).
Source: Derived from information obtained from PIRSA Land Information (Figure 4.1) and PGIBSA.
8 The rate of spread of phylloxera ‘on-farm’ is dependent upon a wide range of factors including vineyard
area, prevailing wind direction and the degree of machinery and personnel movement. In practice, satellite infestations have been observed to occur up to 200 metres per annum from existing infestations on clay soils and 50 metres per annum on sandy soils (John Whiting, DNRE, pers. comm.).
Region Predominant Surface Soil Texture in the 'Representative Vineyard'
Riverland Medium (Clay/Sand) Barossa and Eden Valleys Medium (Clay/Sand) McLaren Vale Medium (Clay/Sand) Coonawarra Heavy (Clay)Langhorne Creek Medium (Clay/Sand) Padthaway Medium (Clay/Sand) Clare Valley Light (Sand)Adelaide Hills Light (Sand)Wrattonbully Medium (Clay/Sand) Limestone Coast - Other Light (Sand) a
Fleurieu Other Light (Sand)
PGIBSA The Risk and Economic Impact of Phylloxera in SA’s Viticultural Regions
EconSearch Pty Ltd Page: 34
The predominant surface soil texture in the ‘representative vineyard’ (Table 6.3) and the area of the ‘representative vineyard’ planted to rootstock (Table 6.1) are key determinants, in this analysis, of the rate of yield decline and rate of spread of phylloxera at the vineyard level. Regional variation in the potential loss of production from phylloxera at the vineyard level is illustrated in Table 6.4 for a hypothetical phylloxera infestation that occurred in the year 2001. In Coonawarra, where the representative vineyard has a relatively low proportion of current plantings on rootstock and is planted predominantly on soils with a heavy surface texture, the production loss from a phylloxera infestation in 2001 over the twenty-year period to 2021 is likely to be high. In the absence of any control or preventative measures, the phylloxera susceptible area9 on the representative vineyard would be completely unproductive by 2019. The point at which such a vineyard becomes financially unviable would obviously be much earlier. In the Riverland, where the representative vineyard has a relatively high proportion of current plantings on rootstock10 but is planted predominantly on soils with a medium surface texture, the production loss from a phylloxera infestation in 2001 over the twenty-year period to 2021 is still likely to be relatively high. In the absence of any control or preventative measures, the representative vineyard could suffer from a 31 per cent loss of production from phylloxera infestation by 2021. In the Adelaide Hills, where the representative vineyard has a relatively low proportion of current plantings on rootstock and is planted predominantly on soils with a light surface texture, the production loss from a phylloxera infestation in 2001 over the twenty-year period to 2021 is likely to be relatively low. In the absence of any control or preventative measures, the representative vineyard could suffer from an 8 per cent loss of production from phylloxera infestation by 2021.
9 The phylloxera susceptible area is that proportion of the representative vineyard planted on own-rooted
vines. 10 Largely for nematode protection.

PGIBSA The Risk and Economic Impact of Phylloxera in SA’s Viticultural Regions
EconSearch Pty Ltd Page: 35
Table 6.4 Potential Loss of Production from a Phylloxera Infestation in 2001 for the Representative Vineyard, by Viticultural Region a
a These estimates of the potential loss of production from phylloxera have been calculated on the basis of the representative vineyard taking no measures to prevent the spread of phylloxera within the vineyard (by replanting existing own-rooted vines to rootstock) or to balance the loss of production (by planting new areas to phylloxera-resistant rootstock). In practice, however, this is highly unlikely to occur and these data have been included for illustrative purposes only.
b Where the predominant surface soil texture in the representative vineyard is heavy, the phylloxera-susceptible area is completely unproductive by 2019. The balance represents the area originally planted to rootstock (Table 6.1).
c This analysis relates to the Robe/Mt Benson sub-region.
Source: EconSearch analysis
2001 2002 2003 2004 2005 2006 2007 2008 2009 2010 2011 2012 2013 2014 2015 2016 2017 2018 2019 2020 2021
Riverland 0.0% 0.3% 0.9% 1.8% 3.0% 4.5% 6.3% 8.4% 10.8% 13.3% 15.9% 18.2% 20.4% 22.3% 24.1% 25.6% 26.9% 28.0% 29.0% 29.8% 30.7%
Barossa and Eden Valleys 0.0% 0.4% 1.1% 2.1% 3.6% 5.4% 7.5% 10.0% 12.9% 15.9% 19.0% 21.8% 24.4% 26.7% 28.8% 30.6% 32.2% 33.5% 34.6% 35.6% 36.6%
McLaren Vale 0.0% 0.4% 1.2% 2.4% 3.9% 5.9% 8.2% 11.0% 14.1% 17.4% 20.8% 23.9% 26.7% 29.2% 31.5% 33.5% 35.2% 36.7% 37.9% 39.0% 40.1%
Coonawarra b 0.0% 1.2% 3.6% 7.1% 11.9% 17.8% 24.9% 33.2% 42.7% 52.6% 62.5% 71.2% 78.7% 85.1% 90.2% 94.2% 96.9% 98.5% 98.9% 98.9% 98.9%
Langhorne Creek 0.0% 0.4% 1.1% 2.3% 3.8% 5.7% 8.0% 10.6% 13.7% 16.8% 20.1% 23.1% 25.8% 28.3% 30.5% 32.4% 34.1% 35.5% 36.7% 37.8% 38.8%
Padthaway 0.0% 0.4% 1.2% 2.4% 4.1% 6.1% 8.5% 11.4% 14.7% 18.1% 21.6% 24.8% 27.7% 30.3% 32.7% 34.8% 36.6% 38.1% 39.4% 40.5% 41.7%
Clare Valley 0.0% 0.0% 0.1% 0.2% 0.4% 0.6% 0.8% 1.1% 1.4% 1.8% 2.2% 2.6% 3.1% 3.6% 4.1% 4.7% 5.3% 6.0% 6.7% 7.5% 8.2%
Adelaide Hills 0.0% 0.0% 0.1% 0.2% 0.4% 0.6% 0.8% 1.1% 1.4% 1.7% 2.1% 2.6% 3.0% 3.5% 4.1% 4.6% 5.3% 5.9% 6.6% 7.3% 8.1%
Wrattonbully 0.0% 0.4% 1.2% 2.4% 3.9% 5.9% 8.3% 11.0% 14.2% 17.5% 20.9% 24.0% 26.8% 29.4% 31.7% 33.7% 35.4% 36.9% 38.1% 39.2% 40.3%
Limestone Coast - Other c 0.0% 0.0% 0.1% 0.2% 0.4% 0.5% 0.8% 1.0% 1.3% 1.6% 2.0% 2.4% 2.8% 3.3% 3.8% 4.3% 4.9% 5.5% 6.2% 6.8% 7.6%
Fleurieu Other 0.0% 0.0% 0.1% 0.2% 0.4% 0.6% 0.8% 1.1% 1.4% 1.7% 2.1% 2.6% 3.0% 3.5% 4.1% 4.6% 5.3% 5.9% 6.6% 7.3% 8.1%
RegionPotential Loss of Production from Phylloxera for the Representative Vineyard (% of 2001 Production)

PGIBSA The Risk and Economic Impact of Phylloxera in SA’s Viticultural Regions
EconSearch Pty Ltd Page: 36
Price penalty with phylloxera In addition to the yield impacts described above, it was assumed that all growers located in a Phylloxera Infested Zone (PIZ), regardless of whether or not their vineyards were directly infested with phylloxera, would be subject to a price penalty. This price effect is the result of reduced demand for their fruit in the 3 to 4 years subsequent to the discovery of a phylloxera outbreak in their region. It was assumed that the price effect would be a consequence of difficulties experienced by wineries in handling fruit from a PIZ and increased costs associated with adherence to national ICA protocols, not as a result of concerns about grape quality. For the purposes of this analysis the price penalty (Table 6.5) has been used as a proxy for inter-regional grape substitutability (Table 6.6). Growers in a region with low inter-regional grape substitutability (e.g. Coonawarra) would be likely to experience a relatively low price penalty following the discovery of a phylloxera outbreak. In contrast, growers in a region with high inter-regional grape substitutability (e.g. Riverland) would be likely to incur a more severe price response with a phylloxera outbreak. Table 6.5 Price Penalty for Grapes from a Phylloxera Infested Zone a
Price as a Percentage of the 2001 price
Price Penalty 2002 2003 2004 2005 2006
onwards
Low 100% 90% 95% 100% 100%
Medium 100% 82% 90% 97% 100%
High 100% 75% 85% 95% 100%
a It was assumed that the phylloxera infestation occurred in 2001 but was not detected until 2003.
Source: SRHS, EconSearch and PGIBSA Project Steering Committee.

PGIBSA The Risk and Economic Impact of Phylloxera in SA’s Viticultural Regions
EconSearch Pty Ltd Page: 37
Table 6.6 Degree of Inter-Regional Grape Substitutability by Viticultural Region
Region Degree of Inter-Regional Grape Substitutability
Riverland High Barossa and Eden Valleys Low McLaren Vale Low Coonawarra Low Langhorne Creek High Padthaway Medium Clare Valley Low Adelaide Hills Medium Wrattonbully Medium Mt Benson/Robe Medium Fleurieu Other Medium
Source: EconSearch, SRHS and PGIBSA Project Steering Committee. Vineyard-level response with phylloxera In the ‘with phylloxera’ scenario it was assumed that growers within a viticultural region could be divided into four distinct groups with the following characteristics: Phylloxera Group 1: Vineyard located outside the PIZ (Outside PIZ, No Phy11).
Phylloxera Group 2: Vineyard located in a PIZ but not infested with phylloxera (In PIZ, No Phy).
Phylloxera Group 3: Winery-owned vineyard located in a PIZ and infested with phylloxera (Winery-Owned, In PIZ, With Phy).
Phylloxera Group 4: Grower-owned vineyard12 located in a PIZ and infested with phylloxera (Grower-Owned, In PIZ, With Phy).
The likely response of these four groups to a phylloxera infestation in 2001 and establishment of a PIZ within the viticultural region upon discovery of the outbreak in 2003 is:
11 Phylloxera. 12 The rationale for distinguishing between winery-owned and grower-owned vineyards was to reflect the
likely capital constraint facing grower-owned vineyards when financing a significant program of new plantings, in addition to re-plantings. This would be in contrast to the likely commercial imperative facing winery-owned vineyards in satisfying unmet demand.

PGIBSA The Risk and Economic Impact of Phylloxera in SA’s Viticultural Regions
EconSearch Pty Ltd Page: 38
Phylloxera Group 1: Vineyards located outside the PIZ (Outside PIZ, No Phy)
• Growers would continue with their program of new plantings, however, new plantings subsequent to the detection of the outbreak of phylloxera in the region would be exclusively to rootstock13.
• No replanting with rootstocks (ie to replace phylloxera-infested vines) would be undertaken. As the vineyards are located outside the PIZ it was assumed that they are not infested with phylloxera and no replanting would be required.
• These growers would not suffer a phylloxera-induced price penalty in the years 2003 to 2005.
Phylloxera Group 2: Vineyards located in a PIZ but not infested with phylloxera
(In PIZ, No Phy)
• Growers would continue with their program of new plantings. Subsequent to the detection of the outbreak of phylloxera in the region new plantings would be exclusively to rootstock.
• No replanting with rootstocks to replace phylloxera-infested vines would be undertaken.
• These growers would suffer a phylloxera-induced price penalty in the years 2003 to 2005.
Phylloxera Group 3: Winery-owned vineyards located in a PIZ and infested with
phylloxera (Winery-Owned, In PIZ, With Phy)
• Growers would continue with their program of new plantings. • Growers would replant 100 per cent of the phylloxera susceptible area14 to
rootstock subsequent to the detection of the phylloxera outbreak in the region15. If the vineyard were planted predominantly on soils with a heavy surface texture this would be undertaken over a period of 12 years, over 18 years if medium surface texture and over 24 years if predominantly light surface-textured soils (Table 6.7). New plantings and re-plantings subsequent to the detection of the outbreak of phylloxera would be exclusively to rootstock.
• These growers would suffer a phylloxera-induced price penalty in the years 2003 to 2005.
Phylloxera Group 4: Grower-owned vineyards located in a PIZ and infested with
phylloxera (Grower-Owned, In PIZ, With Phy)
• Growers would continue with their program of new plantings in 2002 and 2003, prior to the discovery of phylloxera outbreak. However, subsequent to the discovery of an outbreak (i.e. from 2004 onwards), they would halve the original planned rate of growth (i.e. in comparison with Phylloxera Groups 1 to 3)16.
13 This would increase costs given that the average cost of cuttings was assumed to be $1.00 per vine and
the average cost of grafted rootlings was assumed to be $3.50 per vine. 14 The phylloxera susceptible area is that proportion of the representative vineyard planted on own-rooted
vines. 15 That is, from 2004 onwards. 16 That is, some financial resources would be redirected toward the replanting program and managing the
price penalty.

PGIBSA The Risk and Economic Impact of Phylloxera in SA’s Viticultural Regions
EconSearch Pty Ltd Page: 39
• Subsequent to the detection of the phylloxera outbreak in the region they would replant 100 per cent of the phylloxera susceptible area to rootstock. If the vineyard were planted predominantly on soils with a heavy surface texture this would be undertaken over a period of 12 years, over 18 years if medium surface texture and over 24 years if predominantly light surface-textured soils (Table 6.7). New plantings and re-plantings subsequent to the detection of the outbreak of phylloxera would be exclusively to rootstock17.
• These growers would suffer a phylloxera-induced price penalty in the years 2003 to 2005.
Table 6.7 Key Model Assumptions With Respect to the Vineyard–Level Response
With Phylloxera a
Predominant Surface Soil Texture in the Representative Vineyard
Time Taken to Replant 100 per cent of the Phylloxera-Susceptible Vineyard Area
(Years)
Clay (Heavy) 12
Clay/Sand (Medium) 18
Sand (Light) 24
Source: EconSearch, SRHS and PGIBSA Project Steering Committee.
17 Given the relatively low rate of spread of phylloxera and the associated yield decline on soils with a light
surface texture (Table 6.2 and Table 6.4), a decision not to undertake replanting to phylloxera resistant rootstock may appear to be a viable option for growers in Phylloxera Groups 3 and 4 for regions with vineyards planted predominantly on these types of soils. In practice, however, the quality assurance schemes undertaken by most wineries would require that the purchase of grapes from known sources of phylloxera infestation be minimised. Thus there could be significant price penalties for growers who took no measures to eradicate the phylloxera or reduce the impact of infestation. In this situation, wineries would be likely to source grapes preferentially from those growers with a programmed schedule of replanting. Furthermore, as previously noted, surface soil texture is only one of the factors to be considered when quantifying the probability of spread of a phylloxera infestation within or between vineyards.

PGIBSA The Risk and Economic Impact of Phylloxera in SA’s Viticultural Regions
EconSearch Pty Ltd Page: 40
7. The Impact of a Phylloxera Outbreak on Individual Vineyards
The aim in this section is to describe the physical and financial response of the ‘representative vineyard’ to the ‘without phylloxera’ (base case) and ‘with phylloxera’ scenarios, over the twenty-year period 2002 to 2021. Tables 7.1 and 7.2 provide a regional summary of the vineyard-level results for the key financial variables, vineyard profitability and total capital expenditure. All vineyard-level financial results have been calculated at constant (2001) prices. A more detailed (time-series) representation of the vineyard-level financial and physical results for all viticultural regions is provided in the supplementary report, Regional Summaries. Table 7.1 The Impact of a Phylloxera Outbreak on Profitability for the
Representative Vineyard for the Period 2002 to 2021 a
a Vineyard profitability was calculated as the present value of earnings before interest and tax (EBIT) over the period 2002 to 2021 using a discount rate of 7 per cent.
b This analysis relates to the Robe/Mt Benson sub-region.
Source: EconSearch analysis
Vineyard Located inOutside PIZ,
No Phy (Group 1)
In PIZ No Phy
(Group 2)
Winery-Owned, In PIZ,
With Phy (Group 3)
Grower-Owned, In PIZ,
With Phy (Group 4)
Riverland -1% -16% -45% -56%
Barossa and Eden Valleys -1% -4% -32% -41%
McLaren Vale 0% -2% -17% -27%
Coonawarra 0% -2% -35% -35%
Langhorne Creek 0% -6% -21% -29%
Padthaway 0% -4% -22% -22%
Clare Valley -2% -7% -38% -44%
Adelaide Hills -1% -8% -27% -28%
Wrattonbully 0% -5% -24% -29%
Limestone Coast - Other b 0% -5% -19% -23%
Fleurieu Other -1% -6% -19% -27%
Change in Vineyard Profitability (% difference from base case)
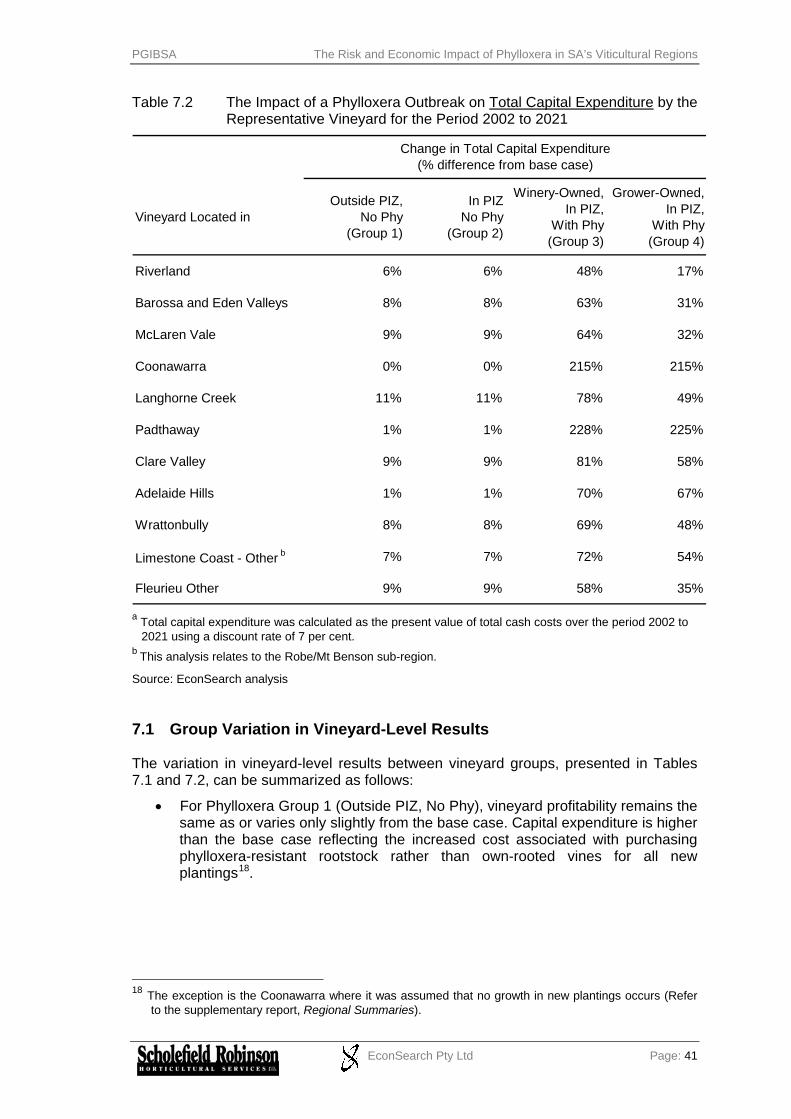
PGIBSA The Risk and Economic Impact of Phylloxera in SA’s Viticultural Regions
EconSearch Pty Ltd Page: 41
Table 7.2 The Impact of a Phylloxera Outbreak on Total Capital Expenditure by the Representative Vineyard for the Period 2002 to 2021
a Total capital expenditure was calculated as the present value of total cash costs over the period 2002 to 2021 using a discount rate of 7 per cent.
b This analysis relates to the Robe/Mt Benson sub-region.
Source: EconSearch analysis 7.1 Group Variation in Vineyard-Level Results The variation in vineyard-level results between vineyard groups, presented in Tables 7.1 and 7.2, can be summarized as follows:
• For Phylloxera Group 1 (Outside PIZ, No Phy), vineyard profitability remains the same as or varies only slightly from the base case. Capital expenditure is higher than the base case reflecting the increased cost associated with purchasing phylloxera-resistant rootstock rather than own-rooted vines for all new plantings18.
18 The exception is the Coonawarra where it was assumed that no growth in new plantings occurs (Refer
to the supplementary report, Regional Summaries).
Vineyard Located inOutside PIZ,
No Phy (Group 1)
In PIZ No Phy
(Group 2)
Winery-Owned, In PIZ,
With Phy (Group 3)
Grower-Owned, In PIZ,
With Phy (Group 4)
Riverland 6% 6% 48% 17%
Barossa and Eden Valleys 8% 8% 63% 31%
McLaren Vale 9% 9% 64% 32%
Coonawarra 0% 0% 215% 215%
Langhorne Creek 11% 11% 78% 49%
Padthaway 1% 1% 228% 225%
Clare Valley 9% 9% 81% 58%
Adelaide Hills 1% 1% 70% 67%
Wrattonbully 8% 8% 69% 48%
Limestone Coast - Other b 7% 7% 72% 54%
Fleurieu Other 9% 9% 58% 35%
Change in Total Capital Expenditure (% difference from base case)
PGIBSA The Risk and Economic Impact of Phylloxera in SA’s Viticultural Regions
EconSearch Pty Ltd Page: 42
• For Phylloxera Group 2 (In PIZ, No Phy), profitability is less than the base case mainly due to the price penalty in the years 2003 to 2005 associated with being inside the PIZ. Capital expenditure is higher than the base case reflecting the increased cost associated with purchasing phylloxera-resistant rootstock rather than own-rooted vines for all new plantings.
• For Phylloxera Group 3 (Winery-Owned, In PIZ, With Phy), profitability is significantly less than the base case reflecting a number of factors including:
the price penalty in the years 2003 to 2005 associated with being inside the PIZ;
yield losses from phylloxera infested areas; and
the income foregone from the removal and subsequent replanting of phylloxera susceptible and/or infested areas.
Capital expenditure is significantly higher than the base case reflecting a programmed schedule of replanting to phylloxera-resistant rootstock and the increased cost associated with purchasing phylloxera-resistant rootstock rather than own-rooted vines for all new plantings.
• For Phylloxera Group 4 (Grower-Owned, In PIZ, With Phy), profitability is significantly less than the base case and Phylloxera Group 3. This reflects a number of factors including:
the price penalty in the years 2003 to 2005 associated with being inside the PIZ;
yield losses from phylloxera infested areas;
the income foregone from the removal and subsequent replanting of phylloxera susceptible and/or infested areas; and
a smaller program of new plantings.
Capital expenditure is significantly higher than the base case reflecting a programmed schedule of replanting to phylloxera-resistant rootstock and the increased cost associated with purchasing phylloxera-resistant rootstock rather than own-rooted vines for all new plantings. However, capital expenditure is lower than Phylloxera Group 3 due to the smaller program of new plantings.
7.2 Regional Variation in Vineyard-Level Results Variation in the vineyard-level results between regions (i.e. down columns in Tables 7.1 and 7.2) is a result of the interaction of a large number of variables. In addition to the variables that directly impact upon the magnitude of the economic consequences for individual vineyards (e.g. yield decline with phylloxera, price penalty and extent of replanting activity), another key variable is the profit margin for the representative vineyard. A vineyard’s base-level profitability will largely determine its vulnerability or ability to cope with the consequences of a phylloxera infestation (i.e. reduced yields, price penalty, the income forgone as a result of replanting activity etc.). Using prices from the 2001 vintage and holding them constant over the 20-year period of the analysis resulted in a relatively low profit margin for the representative vineyard in the Riverland, Clare Valley and the Barossa and Eden Valleys and a relatively high profit margin in Coonawarra and Padthaway. As a result:

PGIBSA The Risk and Economic Impact of Phylloxera in SA’s Viticultural Regions
EconSearch Pty Ltd Page: 43
• For Phylloxera Group 2:
Vineyard profitability in the Riverland is significantly less than the base case as a result of the ‘high’ price penalty. Vineyard profitability in the Clare Valley is impacted reasonably significantly, despite a ‘low’ price penalty19.
Differences in capital expenditure between vineyards, within the group20 are a function of the (assumed) growth in total area of the representative vineyard over the 20-year period. The rate of expansion, relative to current area, is greatest in Langhorne Creek, while no growth is assumed to occur in the Coonawarra.
• For Phylloxera Groups 3 and 4:
For the Coonawarra, despite the high profit margin, vineyard profitability is significantly less than the base case due largely to a replanting program that occurs over a relatively short time period (12 years). For the other regions that suffer a significant fall in profitability, the Riverland, Clare Valley and Barossa and Eden Valleys the replanting will occur over a longer time period (18, 24 and 18 years respectively). However, because the base-level profit margins in these regions are lower, the impact of replanting activity and other factors on profitability will be of a similar order of magnitude to that in the Coonawarra21.
Differences in capital expenditure between vineyards, within the group reflect the impact of expenditure on replanting. Thus, for the Coonawarra and Padthaway, where the rate of new plantings was assumed to be low, capital expenditure is significantly different from the base case, in percentage terms.
19 Refer to Table 6.5 and Table 6.6 for a description of the magnitude of and differences in price penalties
between regions. 20 This also applies to Phylloxera Group 1. 21 That is, a drop in profitability in the range of 35 to 50 per cent, averaged over groups 3 and 4.

PGIBSA The Risk and Economic Impact of Phylloxera in SA’s Viticultural Regions
EconSearch Pty Ltd Page: 44
8. The Impact of a Phylloxera Outbreak on the Regional Grape and Wine Industry and the Broader Regional Economy
8.1 Background and Assumptions The aim in this section is to provide estimates of the impact of a hypothetical, localised22 phylloxera outbreak in 2001 on regional grape and wine production and the broader regional economy in 2010. This analysis has been undertaken for all 11 key South Australian viticultural regions (Table 1.1). The methodology employed in this study for measurement of economic impacts was input-output analysis. Input-output analysis provides a standard approach for the estimation of the economic impact of a particular activity. The input-output model is used to calculate industry multipliers that can then be applied to various scenarios. While input-output analysis has a number of limitations, it is widely used in economic impact analysis and is the only practical method for measuring economic impacts at the regional level23. EconSearch has developed, for PIRSA Sustainable Resources (and other agencies), a set of regional input-output tables for South Australia. The regional models that were used for each of the 11 viticultural regions are shown in Table 5.1. The ‘building blocks’ for this section of the analysis were the vineyard-level results for the ‘without phylloxera’ and ‘with phylloxera’24 scenarios, outlined in Section 7. They were utilised in the following manner.
• Estimates were derived by the PGIBSA of the number of growers quarantined by a hypothetical PIZ in each viticultural region. It was assumed that the PIZ was established in 2003 in response to an infestation that occurred in 2001.
• Estimates were derived of the number of growers within the PIZ whose vineyards were infested with phylloxera by 2010. A best and worst-case scenario, based on the probability of spread, was developed to account for the range of possible outcomes.
• The impact of a hypothetical phylloxera outbreak on grape production in each viticultural region was estimated for the best and worst-case scenarios at three points in time, 2003, 2006 and 2010.
22 That is, restricted to a single PIZ within any given viticultural region. 23 For an outline of input-output methodology and terminology refer to Appendices 2 and 3 respectively. 24 That is, Phylloxera Groups 1 to 4.
PGIBSA The Risk and Economic Impact of Phylloxera in SA’s Viticultural Regions
EconSearch Pty Ltd Page: 45
• Regional economic impacts were measured at one point in time, 201025, including the direct effects on regional grape and wine sectors and the associated flow-on effects on the broader regional economy. These impacts were specified in terms of the following regional economic indicators26:
value of output (business turnover);
employment;
household income; and
value added. 8.1.1 The number of growers quarantined by a hypothetical PIZ For the purposes of this analysis it was assumed that a phylloxera outbreak occurred in the nearest vineyard to the centre of each viticultural region. A quarantine zone (PIZ), established in 2003, was drawn in accordance with the Phylloxera Outbreak Management Plan. The boundary of the PIZ was extended to include adjacent vineyards in order to enhance the manageability and effectiveness of the PIZ as a quarantine measure (Peter Hackworth, PGIBSA, pers. comm.). The number of growers whose vineyards would be quarantined by a PIZ drawn along these lines is outlined in Tables 8.3 and 8.4. The physical location of a hypothetical PIZ of this nature is illustrated, for each region, in the supplementary report, Regional Summaries. 8.1.2 The number of growers in the PIZ with phylloxera-infested vineyards by
2010 The number of growers in the PIZ with phylloxera-infested vineyards by 2010 was assumed to be dependent largely upon the relative intra-regional probability of spread of phylloxera within a PIZ. This was discussed in some detail in Section 4 of the report and is summarised in Table 8.1.
25 The input-output models used for this section of the analysis relate to the approximate structure of
South Australia’s regional economies in the late 1990s. Technological change and productivity improvements that are likely to occur by 2021 preclude the use of the models for projecting impacts this far into the future.
26 Refer to Appendix 3: Glossary of Input-Output Terminology.

PGIBSA The Risk and Economic Impact of Phylloxera in SA’s Viticultural Regions
EconSearch Pty Ltd Page: 46
Table 8.1 The Intra-Regional Probability of Spread of a Phylloxera Infestation Within a PIZ, by Viticultural Region
a Derived from Table 4.6. b This assumption relates to the probability of spread of a phylloxera infestation within the Robe/Mt Benson
sub-region. The assumption could differ, as would the associated economic impact, if the outbreak were to occur in the Bordertown sub-region.
An estimate of the relationship between the probability of spread of phylloxera and the number of growers in the PIZ likely to be infested by 2010 is provided in Table 8.2. Best and worst-case phylloxera outbreak scenarios were developed to account for the range of possible outcomes. In both the best and worst-case scenarios it was assumed that, over the ten-year period to 2010, the phylloxera outbreak would be contained within the PIZ. This implies that the quarantine measures would be effective.
Riverland Medium
Barossa and Eden Valleys High
McLaren Vale High
Coonawarra High
Langhorne Creek High
Padthaway High
Clare Valley Low
Adelaide Hills Low
Wrattonbully Medium
Limestone Coast - Other b Low
Fleurieu Other Low
The Probability of Spread of a Phylloxera Infestation Within a PIZ a
Region

PGIBSA The Risk and Economic Impact of Phylloxera in SA’s Viticultural Regions
EconSearch Pty Ltd Page: 47
Table 8.2 An Estimate of the Relationship Between the Probability of Spread of a Phylloxera Infestation and the Best and Worst-Case Scenarios a
a The phylloxera outbreak in the King Valley region of Victoria in the early 1990s was used as the benchmark for determining the worst-case outbreak scenario. All vineyards within that region were infested with phylloxera within 10 years of the initial outbreak. The region’s vineyards are based on clay-loam soils and experienced a high level of interaction in terms of personnel and machinery at the time of the outbreak (Jim Hardie, pers. comm.). Both of these factors would suggest that the region had a high probability of spread of a phylloxera infestation at the time of the outbreak.
Source: EconSearch analysis. The information contained in Table 8.1 and Table 8.2 was used to estimate the number of growers in each category of vineyard-level response to the phylloxera outbreak (i.e. Phylloxera Groups 1 to 4 as defined in Section 6.2.2). These estimates and the underlying assumptions are detailed in Table 8.3 for the best-case ‘with phylloxera’ scenario and Table 8.4 for the worst-case ‘with phylloxera’ scenario. Estimates of the number of growers in each category of vineyard-level response to the phylloxera outbreak were the ‘building blocks’ for the regional economic impact analysis that follows in Sections 8.2 and 8.3.
Best Case Worst Case
60% 100%
45% 80%
30% 60%Low
Percentage of Vineyards in PIZ Infested by 2010The Probability of Spread of a Phylloxera Infestation Within a PIZ
High
Medium

PGIBSA The Risk and Economic Impact of Phylloxera in SA’s Viticultural Regions
EconSearch Pty Ltd Page: 48
Table 8.3 Estimates of the Number of Growers in each Phylloxera Group in the ‘Best-Case’ Phylloxera Outbreak Scenario
a These estimates are derived from Table 6.1. It was assumed that the total number of growers does not change during the period of the impact analysis, 2001 to 2010. b It was assumed that a phylloxera infestation occurred in the geographical centre of each viticultural region and that the PIZ was determined on the basis of a 5 km radius
around that point. These estimates were calculated on the basis of information provided by Peter Hackworth, PGIBSA, pers. comm. c These estimates were determined on the basis the intra-regional probability of spread of phylloxera, as outlined in Table 8.1. d The proportion of winery-owned vineyards in each region was determined on the basis of the source of fruit survey for the 2001 vintage in PGIBSA (2001). This proportion was
assumed to remain constant over time.
Outside PIZ, No Phy (Group
1)
In Piz, No Phy (Group 2)
Winery-Owned, In PIZ, With Phy
(Group 3)
Grower-Owned, In PIZ, With Phy
(Group 4)
Riverland 1,190 415 187 16% 775 228 30 157
Barossa and Eden Valleys 558 260 156 24% 298 104 37 119
McLaren Vale 337 210 126 23% 127 84 29 97
Coonawarra 91 84 50 78% 7 34 39 11
Langhorne Creek 94 46 28 40% 48 18 11 17
Padthaway 25 11 7 71% 14 4 5 2
Clare Valley 206 65 20 57% 141 45 11 9
Adelaide Hills 205 16 5 14% 189 11 1 4
Wrattonbully 32 12 5 67% 20 7 3 2
Limestone Coast - Other 61 7 2 56% 54 5 1 1
Fleurieu Other 40 6 2 38% 34 4 1 1
RegionProportion
Winery-Owned d
Estimated Number of
Growers Infested with
Phylloxera by 2010 c
Estimated Number of Growers in each Phylloxera Group in 2010Total Number of Growers in the Region in
2001 a
Estimated Number of
Growers in a PIZ
established in 2003 b

PGIBSA The Risk and Economic Impact of Phylloxera in SA’s Viticultural Regions
EconSearch Pty Ltd Page: 49
Table 8.4 Estimates of the Number of Growers in each Phylloxera Group in the ‘Worst-Case’ Phylloxera Outbreak Scenario
a These estimates are derived from Table 6.1. It was assumed that the total number of growers does not change during the period of the impact analysis, 2001 to 2010. b It was assumed that a phylloxera infestation occurred in the geographical centre of each viticultural region and that the PIZ was determined on the basis of a 5 km radius
around that point. These estimates were calculated on the basis of information provided by Peter Hackworth, PGIBSA, pers. comm. c These estimates were determined on the basis the intra-regional probability of spread of phylloxera, as outlined in Table 8.1. d The proportion of winery-owned vineyards in each region was determined on the basis of the source of fruit survey for the 2001 vintage in PGIBSA (2001). This proportion was
assumed to remain constant over time.
Outside PIZ, No Phy (Group
1)
In Piz, No Phy (Group 2)
Winery-Owned, In PIZ, With Phy
(Group 3)
Grower-Owned, In PIZ, With Phy
(Group 4)
Riverland 1,190 415 332 16% 775 83 53 279
Barossa and Eden Valleys 558 260 260 24% 298 0 62 198
McLaren Vale 337 210 210 23% 127 0 48 162
Coonawarra 91 84 84 78% 7 0 66 18
Langhorne Creek 94 46 46 40% 48 0 18 28
Padthaway 25 11 11 71% 14 0 8 3
Clare Valley 206 65 39 57% 141 26 22 17
Adelaide Hills 205 16 10 14% 189 6 2 8
Wrattonbully 32 12 10 67% 20 2 6 4
Limestone Coast - Other 61 7 4 56% 54 3 2 2
Fleurieu Other 40 6 4 38% 34 2 2 2
Total Number of Growers in the Region in
2001 a
Estimated Number of
Growers in a PIZ
established in 2003 b
Region
Estimated Number of Growers in each Phylloxera Group in 2010Estimated Number of
Growers Infested with
Phylloxera by 2010 c
Proportion Winery-Owned d
PGIBSA The Risk and Economic Impact of Phylloxera in SA’s Viticultural Regions
EconSearch Pty Ltd Page: 50
8.2 The Impact of a Phylloxera Outbreak on Regional Grape Production Based on the four groups of vineyard-level response to a phylloxera outbreak (Section 6.2.2) and the number of growers, by region, likely to respond to an outbreak in this manner (Section 8.1), estimates were derived of the net impact27 on regional grape production of a phylloxera outbreak. The results of this analysis are presented in Table 8.5. Impacts were measured at 3 points in time, 2003, 2006 and 2010. The estimates refer to the net impact of a phylloxera outbreak in a given region on grape production in that region, when compared with the base-case outcome. There are several points to note from these results.
• The impacts on regional grape production in 2003 are estimates of the yield loss (at a regional level) that could occur following an infestation in 2001. These impacts, for both the best and worst-case scenarios, are relatively small in a regional context (in absolute terms) and could be offset by seasonal yield variation.
• The impacts on regional grape production in 2006 and 2010 are estimates of yield losses from phylloxera infested areas and the yield foregone from the removal and subsequent replanting of phylloxera susceptible and/or infested areas28 (Refer to the supplementary report, Regional Summaries for an illustration of this point at the vineyard level).
• It is important to distinguish between absolute and relative impacts. For example, although the worst-case phylloxera outbreak scenario in the Riverland could lead to a production shortfall (when compared with the base case) of over 21,000 tonnes in 2010, it represents only a 4.4 per cent reduction on the base case. In contrast, a production shortfall of approximately 13,000 tonnes in the Coonawarra, in absolute terms, represents a 30 per cent reduction relative to the base case.
• For regions with vineyards spread over a wide geographic area and with a small number of growers quarantined by a hypothetical PIZ, the regional production impacts are small in both absolute and relative terms (i.e. Adelaide Hills, Mt Benson/Robe and Fleurieu Other).
27 The difference between the ‘with’ and ‘without phylloxera’ scenarios. 28 For the purposes of this analysis it was assumed that growers would not respond to a phylloxera
outbreak by replanting infested or susceptible areas until 2004, at the earliest.

PGIBSA The Risk and Economic Impact of Phylloxera in SA’s Viticultural Regions
EconSearch Pty Ltd Page: 51
Table 8.5 Estimates of the Net Impact on Regional Grape Production of a Hypothetical Phylloxera Outbreak a
a These estimates refer to the impact of a phylloxera outbreak in a given region on grape production in that region. The net impact on regional grape production refers to the difference between the ‘with’ and ’without phylloxera’ scenarios.
Source: EconSearch analysis.
2003 2006 2010 Change from Base Case
(2010)
2003 2006 2010 Change from Base Case
(2010)t t t % t t t %
Riverland -151 -4,520 -11,944 -2.4% -269 -8,036 -21,233 -4.4%
Barossa and Eden Valleys -69 -1,968 -4,623 -4.5% -115 -3,280 -7,705 -7.5%
McLaren Vale -89 -2,562 -6,101 -6.6% -148 -4,270 -10,169 -10.9%
Coonawarra -260 -4,590 -7,851 -17.9% -433 -7,650 -13,085 -29.8%
Langhorne Creek -57 -1,628 -3,704 -4.6% -95 -2,713 -6,173 -7.7%
Padthaway -32 -792 -1,226 -3.7% -53 -1,320 -2,044 -6.1%
Clare Valley -1 -168 -386 -1.1% -2 -337 -772 -2.2%
Adelaide Hills 0 -39 -77 -0.3% 0 -78 -153 -0.5%
Wrattonbully -8 -214 -381 -2.3% -15 -380 -677 -4.0%
Limestone Coast - Other 0 -51 -114 -0.4% -1 -101 -228 -0.7%
Fleurieu Other 0 -23 -63 -0.6% 0 -46 -125 -1.2%
Region
Best-Case Scenario Worst-Case Scenario

PGIBSA The Risk and Economic Impact of Phylloxera in SA’s Viticultural Regions
EconSearch Pty Ltd Page: 52
8.3 The Results of the Economic Impact Analysis at the Regional Level The four groups of vineyard-level response to a phylloxera outbreak (Section 6.2.2) and the number of growers, by region, likely to respond to an outbreak in this manner (Section 8.1) are also key determinants, in this analysis, of the economic impact of a phylloxera outbreak in each viticultural region on the broader regional economy. There would be a range of economic stimuli in regional economies following a hypothetical phylloxera infestation in 2001 in any given viticultural region, some positive, others negative. They would include the following.
• At the earlier stage of the outbreak, particularly in the year 2003, the impacts would be felt mainly through a reduction in vineyard profits due to the price penalty associated with being in a PIZ.
• As the response to the outbreak widened there would be positive economic stimuli from increased regional expenditure associated with large-scale replanting programs in the winegrape sector.
• However, as the response to the outbreak widened there would be negative economic stimuli associated with reductions in grape supply to the regional wine sector29.
The year 2010 represents a useful midpoint in the progression of the outbreak and the associated response. Thus, economic impacts of a phylloxera outbreak at the regional level, for the four indicators, turnover, employment, household income and value added, were estimated for this point in time30. The results are summarised in Table 8.6 and Table 8.7. Detailed results are provided in the supplementary report, Regional Summaries. The results of the regional economic impact analysis are summarised in Table 8.6 for the best-case phylloxera outbreak scenario and Table 8.7 for the worst-case phylloxera outbreak scenario. There are several key points.
• All estimates represent the difference between the ‘with’ and ‘without phylloxera’ scenarios.
• While estimates are presented in terms of dollars (2001) or numbers of jobs, the relativities between regions are more important than the absolute estimates.
• The relativities between regions and the absolute estimates could change if the year for which the impacts were measured (in this case 2010) were different.
• The turnover impact in the winegrape sector is greater in percentage terms than the production impact given that grapes from young vines were assumed to receive a price penalty31.
• Estimates of turnover do not include flow-on effects in other sectors of the regional economy to avoid double counting.
• Estimates of employment, household income and value added represent the total regional impact of a phylloxera outbreak and incorporate direct effects in
29 It was assumed, for the purposes of this analysis, that the wine sector in each regional economy was
‘closed’. That is, there would be no substitution of grapes from other regions to offset supply shortfalls in that region. While unrealistic in practice, this assumption was necessary to illustrate the potential magnitude of the regional economic impacts of a phylloxera infestation.
30 It was beyond the scope of this analysis to estimate the economic impact of a phylloxera outbreak for each year between 2001 and 2010, for each region.
31 This, in turn, is a function of the replanting activity.
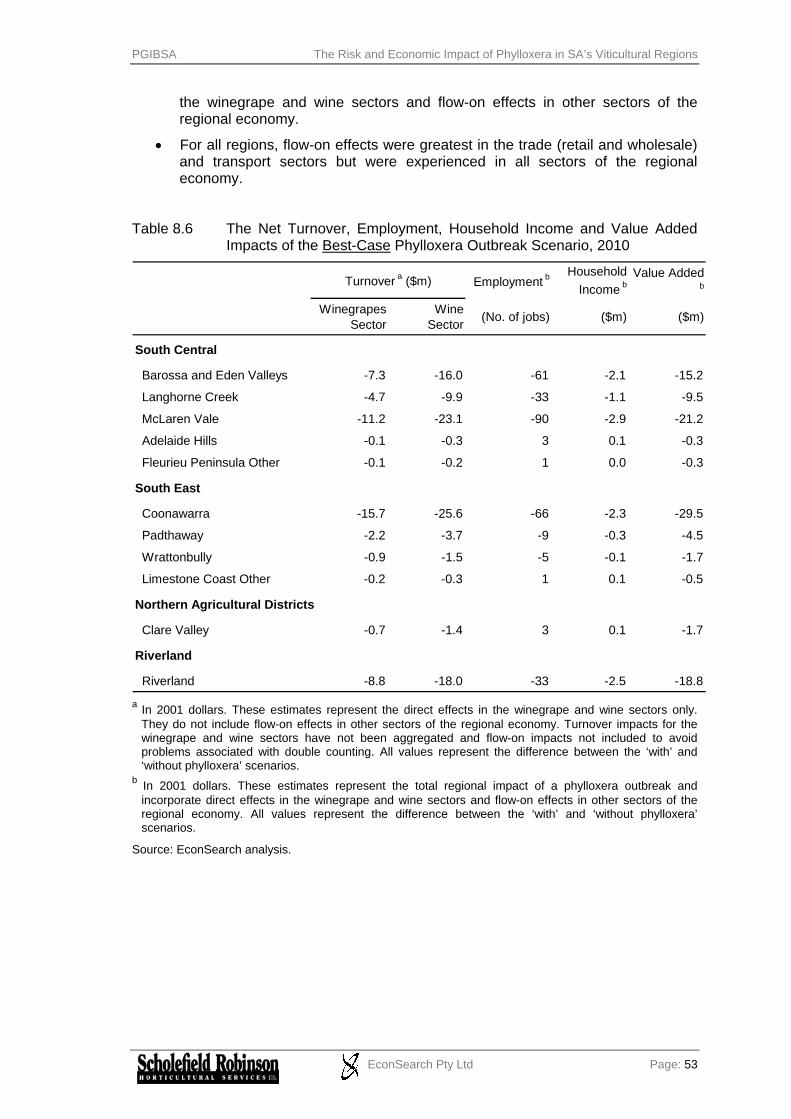
PGIBSA The Risk and Economic Impact of Phylloxera in SA’s Viticultural Regions
EconSearch Pty Ltd Page: 53
the winegrape and wine sectors and flow-on effects in other sectors of the regional economy.
• For all regions, flow-on effects were greatest in the trade (retail and wholesale) and transport sectors but were experienced in all sectors of the regional economy.
Table 8.6 The Net Turnover, Employment, Household Income and Value Added
Impacts of the Best-Case Phylloxera Outbreak Scenario, 2010
a In 2001 dollars. These estimates represent the direct effects in the winegrape and wine sectors only. They do not include flow-on effects in other sectors of the regional economy. Turnover impacts for the winegrape and wine sectors have not been aggregated and flow-on impacts not included to avoid problems associated with double counting. All values represent the difference between the ‘with’ and ‘without phylloxera’ scenarios.
b In 2001 dollars. These estimates represent the total regional impact of a phylloxera outbreak and incorporate direct effects in the winegrape and wine sectors and flow-on effects in other sectors of the regional economy. All values represent the difference between the ‘with’ and ‘without phylloxera’ scenarios.
Source: EconSearch analysis.
Employment b Household Income b
Value Added b
Winegrapes Sector
Wine Sector (No. of jobs) ($m) ($m)
South Central
Barossa and Eden Valleys -7.3 -16.0 -61 -2.1 -15.2
Langhorne Creek -4.7 -9.9 -33 -1.1 -9.5
McLaren Vale -11.2 -23.1 -90 -2.9 -21.2
Adelaide Hills -0.1 -0.3 3 0.1 -0.3
Fleurieu Peninsula Other -0.1 -0.2 1 0.0 -0.3
South East
Coonawarra -15.7 -25.6 -66 -2.3 -29.5
Padthaway -2.2 -3.7 -9 -0.3 -4.5
Wrattonbully -0.9 -1.5 -5 -0.1 -1.7
Limestone Coast Other -0.2 -0.3 1 0.1 -0.5
Northern Agricultural Districts
Clare Valley -0.7 -1.4 3 0.1 -1.7
Riverland
Riverland -8.8 -18.0 -33 -2.5 -18.8
Turnover a ($m)

PGIBSA The Risk and Economic Impact of Phylloxera in SA’s Viticultural Regions
EconSearch Pty Ltd Page: 54
Table 8.7 The Net Turnover, Employment, Household Income and Value Added Impacts of the Worst-Case Phylloxera Outbreak Scenario, 2010
a In 2001 dollars. These estimates represent the direct effects in the winegrape and wine sectors only. They do not include flow-on effects in other sectors of the regional economy. Turnover impacts for the winegrape and wine sectors have not been aggregated and flow-on impacts not included to avoid problems associated with double counting. All values represent the difference between the ‘with’ and ‘without phylloxera’ scenarios.
b In 2001 dollars. These estimates represent the total regional impact of a phylloxera outbreak and incorporate direct effects in the winegrape and wine sectors and flow-on effects in other sectors of the regional economy. All values represent the difference between the ‘with’ and ‘without phylloxera’ scenarios.
Source: EconSearch analysis.
Employment b Household Income b
Value Added b
Winegrapes Sector
Wine Sector (No. of jobs) ($m) ($m)
South Central
Barossa and Eden Valleys -12.1 -26.8 -110 -3.6 -24.5
Langhorne Creek -8.1 -17.4 -63 -2.1 -15.9
McLaren Vale -18.6 -38.2 -145 -4.6 -34.1
Adelaide Hills -0.3 -0.6 2 0.1 -0.6
Fleurieu Peninsula Other -0.2 -0.5 -1 0.0 -0.5
South East
Coonawarra -26.2 -42.7 -112 -3.8 -49.2
Padthaway -3.6 -6.2 -15 -0.5 -7.5
Wrattonbully -1.4 -2.5 -7 -0.2 -2.8
Limestone Coast Other -0.4 -0.5 1 0.1 -0.8
Northern Agricultural Districts
Clare Valley -1.3 -2.9 -4 -0.1 -3.1
Riverland
Riverland -15.0 -31.2 -105 -5.0 -31.0
Turnover a ($m)

PGIBSA The Risk and Economic Impact of Phylloxera in SA’s Viticultural Regions
EconSearch Pty Ltd Page: 55
9. The Impact of a Phylloxera Outbreak on the South Australian Grape and Wine Industry and South Australian Economy
The scope of the economic impact of a phylloxera outbreak can be measured at various levels. The aim in this analysis was to provide some estimates of the impact on:
• individual vineyards; • regional grape and wine production; • the regional economy; • the South Australian (grape and) wine industry; and • the South Australian economy.
The impact on individual vineyards was outlined in Section 7 and the impact on regional grape and wine production and regional economies in Section 8. It is important to note that the impact of a phylloxera outbreak in any given viticultural region on the relevant regional economy could be greater than the impact on the South Australian economy. There would be several factors contributing to this outcome.
• If wineries were subject to phylloxera induced shortages of supply from any given viticultural region they would be likely to substitute this supply with grapes from other viticultural regions within SA. If this supply of grapes were to come from interstate, however, the impact on the South Australian economy would be likely to be greater than the impact on the regional economy.
• Over the longer term (e.g. in the 10 years to 2010) this substitution would be facilitated by the planting of new vineyards in regions without phylloxera (PEZ). This activity would be likely to have a positive economic impact on the SA economy unless it occurred interstate.
• The adjustment process, described above, may also involve the construction of new processing, storage and distribution facilities for grapes and wine, either within or outside regions with PIZs. This activity would also be likely to have a positive economic impact on the SA economy unless it occurred interstate.
There are several other factors that have not been quantified in this analysis that could have a negative economic impact at all of the levels outlined above. These include the following.
• It is possible that a phylloxera outbreak may negatively affect the price of wine, both domestically and in export markets, through the impact on the image of the product. A phylloxera outbreak may affect the ‘clean, green’ image of South Australian wines, possibly due to a perception amongst consumers that phylloxera poses a health (food safety) risk or reflects poor vineyard management practices. However, this is considered to be unlikely to happen.

PGIBSA The Risk and Economic Impact of Phylloxera in SA’s Viticultural Regions
EconSearch Pty Ltd Page: 56
• It is likely that the market value of vineyards in a viticultural region would be negatively affected by a phylloxera outbreak in that region, particularly within the PIZ. Indeed, land values for all land suitable for vineyard development could be negatively affected, within the PIZ, the broader viticultural region or state-wide. As above, this may be due to a perception, in this case on the part on investors in vineyard development, that the probability of a phylloxera outbreak in PEZs is increased by the existence of a PIZ within the state.

PGIBSA The Risk and Economic Impact of Phylloxera in SA’s Viticultural Regions
EconSearch Pty Ltd Page: 57
10. The Risk of Phylloxera in South Australia’s Viticultural Regions
As outlined in the introduction to the report, the ‘risk’ of phylloxera can be defined as a product of the probability of a phylloxera outbreak and the consequences (economic impact) of an outbreak. In the course of the analysis estimates have been provided of the economic impact of a phylloxera outbreak at both the vineyard and regional level. Thus, by assuming that the probability of a phylloxera infestation for the ‘representative vineyard’ in any given region is the same as the regional probability of infestation, it was possible to construct risk estimation matrices to categorise the relative risk of phylloxera in South Australia’s viticultural regions, at both the vineyard and regional levels. 10.1 Vineyard Level Risk of Phylloxera A risk estimation matrix for phylloxera in South Australia’s viticultural regions, at the vineyard level, is provided in Table 10.1. The matrix provides an estimate of the comparative risk of a phylloxera outbreak. It is an indicator of comparative risk because, although the risk of a phylloxera outbreak for the ‘representative vineyard’ in some regions (e.g. the Riverland, Clare Valley and the Barossa and Eden Valleys) may be high relative to other viticultural regions in SA, it is not necessarily high in absolute terms. Table 10.1 A Risk Estimation Matrix for Phylloxera in South Australia’s Viticultural
Regions: Vineyard Level Assessment a
a When interpreting the risk estimation matrix it is important to note that although the descriptors for each axis are similar, the matrix is not necessarily symmetrical. That is, a low probability of infestation combined with high economic impact is not necessarily the same as high probability combined with low impact.
Source: Derived from Table 3.9 and Table 7.1.
High McLaren Vale Clare Valley Barossa and Eden Valleys Riverland
Medium
Padthaway Langhorne Creek
Adelaide Hills Limestone Coast Other
Coonawarra
Low Wrattonbully Fleurieu Other
Low Medium High
Pro
babi
lity
of P
hyllo
xera
Infe
stat
ion
Vineyard-Level Economic Impact of Phylloxera Outbreak

PGIBSA The Risk and Economic Impact of Phylloxera in SA’s Viticultural Regions
EconSearch Pty Ltd Page: 58
In contrast to the relative measure, that is, the probability of a phylloxera infestation32, estimates of the consequences (economic impact) of an outbreak at the vineyard level were quantitatively based. The estimates were calculated as the percentage difference in EBIT between the ‘with’ and ‘without phylloxera’ scenarios33. 10.2 Regional Level Risk of Phylloxera It is important to note that the risk of phylloxera at the vineyard level is not necessarily the same as the risk at the regional level. To demonstrate this point, a risk estimation matrix was also constructed at the regional level (Table 10.2). As above, the matrix in Table 10.2 provides an estimate of the comparative risk of a phylloxera outbreak. Although the regional economic impact (horizontal axis) has been quantified in terms of employment, household income and value added34, the probability of a phylloxera infestation has been assessed only in a relative sense. This means that while the risk of phylloxera outbreak in some regions, at the regional level, may be high relative to other viticultural regions in SA (e.g. McLaren Vale, Barossa and Eden Valleys and the Riverland), it is not necessarily high in absolute terms. Table 10.2 A Risk Estimation Matrix for Phylloxera in South Australia’s Viticultural
Regions: Regional Assessment a
a When interpreting the risk estimation matrix it is important to note that although the descriptors for each axis are similar, the matrix is not necessarily symmetrical. That is, a low probability of infestation combined with high economic impact is not necessarily the same as high probability combined with low impact.
Source: Derived from Table 4.6 and Tables 8.6 and 8.7.
32 Regional variation in the rate of spread of phylloxera at the vineyard level was incorporated in the
‘representative vineyard’ model (Refer to Table 6.2 and Table 6.3). 33 The level of economic impact at the vineyard level (low, medium or high) was determined on the basis of
the weighted average percentage change in EBIT from the base case, for Phylloxera Groups 3 and 4 (Table 7.1). Weightings were based on the proportion of winery-owned vineyards in each region (Tables 8.3 and 8.4).
34 The level of economic impact at the regional level (low, medium or high) was derived from Tables 8.6 and 8.7.
High Clare ValleyMcLaren Vale
Barossa and Eden Valleys Riverland
Medium Adelaide Hills Limestone Coast Other
Langhorne Creek Padthaway Coonawarra
Low Wrattonbully Fleurieu Other
Low Medium High
Pro
babi
lity
of P
hyllo
xera
Infe
stat
ion
Regional Economic Impact of Phylloxera Outbreak

PGIBSA The Risk and Economic Impact of Phylloxera in SA’s Viticultural Regions
EconSearch Pty Ltd Page: 59
Although it could be expected that the risk estimation matrices would be similar at the vineyard and regional levels (Tables 10.1 and 10.2, respectively), differences between them may arise for a variety of reasons. The most significant of these are regional differences in the number of vineyards in the PIZ and variations in the probability of spread of phylloxera between vineyards. In the course of the analysis, the probability of spread of phylloxera has been incorporated into the estimates of regional economic impact. One of the most striking differences between Tables 10.1 and 10.2 is the categorisation of McLaren Vale. Although the vineyard-level economic impact of phylloxera in McLaren Vale is relatively low, the regional economic impact is relatively high because of the large number of vineyards in the hypothetical McLaren Vale PIZ and the high relative probability of spread of phylloxera. When interpreting the risk estimation matrices it is important to note that the probability of a phylloxera infestation was determined on the basis of a predominantly subjective assessment of the relative importance of the following ‘vectors’ or factors.
• The proximity of the region to a PIZ.
• The source of planting material for vineyards in the region.
• The movement of must and juice from PIZs into the region.
• The movement of machinery from other regions, within or outside SA, to the region.
• The number of visitors (tourists) to the region.
• The area of plantings in the region since 1997. Similarly, the estimated vineyard-level economic impacts of a phylloxera outbreak (used in Table 10.1) were sensitive to the following key assumptions.
• The predominant surface soil texture in the ‘representative vineyard’ and the associated rate of yield decline of phylloxera infested areas and rate of spread of phylloxera in the ‘representative vineyard’ (Table 6.3 and Table 6.2).
• The vineyard-level response to a phylloxera outbreak and establishment of a PIZ (Section 6.2.2).
Estimates of the regional economic impact of a phylloxera outbreak (used in Table 10.2) were sensitive to the assumptions listed below, as well as to the key vineyard-level assumptions noted above.
• The geographical location of the PIZ and the number of growers quarantined by the PIZ35.
• The intra-regional probability of spread of a phylloxera infestation (between vineyards) within the PIZ (Table 8.1).
35 Examples are provided in the supplementary report, Regional Summaries.

PGIBSA The Risk and Economic Impact of Phylloxera in SA’s Viticultural Regions
EconSearch Pty Ltd Page: 60
11. Conclusions and Recommendations The key conclusions of this study are as follows.
• The viticultural regions of SA vary greatly in the factors or characteristics that determine the overall relative probability of infestation and spread of phylloxera. Therefore, each region will need to focus on different issues to reduce the probability of infestation and spread of phylloxera.
• At the vineyard level, Riverland vineyards are most vulnerable to the impact of phylloxera because they have the lowest profit margins prior to a phylloxera outbreak, a significant financial burden imposed by replanting and a high relative probability of infestation.
• At the regional level, the Riverland, Barossa and Eden Valleys, McLaren Vale and Coonawarra are most vulnerable to the impact of phylloxera because they would be likely to have a large number of vineyards quarantined by a PIZ and have a relatively high probability of infestation and rate of spread of phylloxera.
• The impact of a phylloxera outbreak in any given viticultural region on the relevant regional economy could be greater than the impact on the South Australian economy due to the substitutability of grapes between regions and the positive economic impact of investment in new vineyards and winery infrastructure.
• Estimates of the economic impact of a phylloxera outbreak were calculated on the basis of current (2001) grape prices. If the prices received for winegrapes were to fall in the future, which seems likely, the actual economic impact of a phylloxera outbreak could be much more severe than reported here. Further, the relative economic impact between regions could change if prices were to move differentially between regions.
• The rates of yield decline in phylloxera infested areas and rate of spread of phylloxera, within and between vineyards, were key assumptions in the risk analysis. Unfortunately, limited data are available and much of it is anecdotal and subjective.
A number of recommendations are made to the PGIBSA that will assist it to fulfil its charter to:
• prevent phylloxera entering the state; • control outbreaks of phylloxera in the state; and, • develop plans for the eradication of phylloxera in the state’s vineyards. The consultants recommend that:
1. The findings of this study be used to prioritise phylloxera prevention activities in regions with a high risk of a phylloxera outbreak. Risk is a product of the probability of infestation and the economic impact of a phylloxera outbreak.
2. The planting of vines grafted to phylloxera resistant rootstocks be
increased, particularly in the regions identified as having high phylloxera risk. Rootstocks are still the best insurance against a phylloxera outbreak.

PGIBSA The Risk and Economic Impact of Phylloxera in SA’s Viticultural Regions
EconSearch Pty Ltd Page: 61
3. A high level of awareness of the factors likely to lead to an infestation of vineyards with phylloxera in SA be maintained by PGIBSA and other agencies.
4. Research into the factors affecting phylloxera infestation and spread,
currently being carried out in Victoria, be continued. This work provides data on which to assess phylloxera risks in SA.
5. Regular gathering of information on the movements of grapes, must,
juice, planting material, machinery and visitors from interstate and between regions in SA should continue to be carried out. These data will allow objective measurement of the key contributing factors to phylloxera infestation and spread.
6. Secure and practical protocols for the movement of grape material,
machinery and personnel between PIZ and PRZ interstate and PEZ in SA continue to be developed. These protocols should be standardised nationally with input from the National Vine Health Steering Committee (NVHSC).
7. Adjoining PEZ in SA, Victoria and NSW, for example Sunraysia and
Riverland, work closely together to provide increased phylloxera security for both regions.
8. Constant vigilance and preparedness for an outbreak of phylloxera must
be a key strategy for the SA grape industry. The grape industry needs to understand that quarantine barriers are now based on a risk assessment and there is no such thing as “zero risk” of phylloxera infestation in SA. The early detection of an outbreak of phylloxera in vineyards will lessen the chance of spread to other vineyards in the region or elsewhere and reduce the economic impact of the outbreak.
If these recommendations are effectively implemented, the probability of phylloxera infestation in South Australian vineyards will be further reduced and the risk minimised.

PGIBSA The Risk and Economic Impact of Phylloxera in SA’s Viticultural Regions
EconSearch Pty Ltd Page: 62
12. References Anon 2001, Viticulture Industry Protection Plan: Reference Manual (HortGuard),
Agriculture WA.
Bannock, G., Baxter, R.E. and Rees, R. 1979, The Penguin Dictionary of Economics, Penguin Books, Middlesex.
Boon, K.F., Taylor, P.J., Panagiotopoulos, B. and Radford, R.W. 1999, Seasons of Change: A guide to successful vineyard investment in a changing world, Primary Industries and Resources, SA.
EconSearch 2000a, Planning for Primary Industries in the Northern Agricultural Districts of South Australia, a report prepared for PIRSA.
EconSearch 2000b, Planning for Primary Industries in the Riverland, South Australia, a report prepared for PIRSA.
EconSearch 2001a, Economic Impact of the Timber Industry in the South East of South Australia, a report prepared for Forestry SA.
EconSearch 2001b, Input-Output Tables for South Australia, 1999/00, a report prepared for the Department of Industry and Trade.
Fisher, J.R. and Hellman 2000, Status and Progression of infestations and management of the grape Phylloxera in the Pacific Northwest, USA, International. Symposium – Grapevine Phylloxera Management.
Hackworth, P. 2000, Machinery Contractor Survey, Limestone Coast Report, PGIBSA.
Hassell 1998, Regional Planning Framework for Mount Lofty Ranges, a report prepared for PIRSA.
Hathaway, S. 2001, Rootstock Survey Report: Attitude and behaviour of South Australian grapegrowers and winemakers regarding rootstocks, a report prepared for the Phylloxera and Grape Industry Board of South Australia, April.
Hewings, G.J.D. 1985, Regional Input-Output Analysis, Sage Publications, Beverly Hills.
Jensen, R.C. and West, G.R. 1986, Input-Output for Practitioners: Theory and Applications, Australian Regional Developments No. 1, AGPS, Canberra.
Midmore, P. and Harrison-Mayfield, L. 1996, Rural Economic Modelling: an Input-Output Approach, CAB International, Wallington, UK.
Powell, K. 2000, Management of Grape Phylloxera in South East Australia, Phase 1, and Phase 2, Report to GWRDC, DNRE, Victoria.
Powell, K. 2001, Phylloxera Workshop, Australian Wine Industry Technical Conference, Adelaide Powell, R.A., Jensen, R.C. and Gibson, A.L. 1985, The Economic Impact of Irrigated Agriculture in N.S.W., Report to the N.S.W. Irrigators' Council Limited, Department of Agricultural Economics and Business Management, University of New England, Armidale.
Phylloxera and Grape Industry Board of South Australia 2000, The Phylloxera Prevention Protocol: Procedures 1, 2, 4, 5, 6, 7, 8 and 10, Phylloxera and Grape Industry Board of South Australia.
Phylloxera and Grape Industry Board of South Australia 2001, 2001 South Australian Winegrape Utilisation and Pricing Survey.
SA Tourism Commission 2001, Wine Tourism Market Research.

PGIBSA The Risk and Economic Impact of Phylloxera in SA’s Viticultural Regions
EconSearch Pty Ltd Page: 63
Sullivan, E. (Registrar) 2001, Geographic Indication descriptions for wine regions in South Australia, Australian Wine and Brandy Corporation.
Weeks, C. 1999, Phylloxera Infestation Risk from Vineyard Machinery, Report prepared for PGIBSA.
West, G.R. 1993, Input-Output Analysis for Practitioners: User's Guide, Version 7.1, Department of Economics, University of Queensland, St Lucia.
Disclaimer We have prepared the above report exclusively for the use and benefit of our client. Neither the firm nor any employee of the firm undertakes responsibility in any way whatsoever to any person (other than to the above mentioned client) in respect of the report including any errors or omissions therein however caused.
PGIBSA The Risk and Economic Impact of Phylloxera in SA’s Viticultural Regions
EconSearch Pty Ltd Page: 64
Appendix 1 Tender Specifications 1. Regional risk of phylloxera. 1.1 Assess each of South Australia’s viticultural regions (ref 1.4) and determine the
probability of an outbreak of phylloxera.
1.2 Factors determining risk include:
1.2.1 distance from infested vineyards; 1.2.2 source of planting material; 1.2.3 level of exchange of equipment, labour and services with infested or
risk regions interstate; and 1.2.4 adherence to quarantine protocols by growers, contractors, suppliers
and vineyard staff
1.3 Factors determining impact include:
1.3.1 Soil types 1.3.2 Climate 1.3.3 Percentage of vines planted on own roots, 1.3.4 Vine age and health 1.3.5 Grape substitutability 1.3.6 At an enterprise level, the level of dependency on the vineyard for
income and distance from a crushing facility are also factors
1.4 Regions to be assessed are:
• Riverland • Barossa Valley (including Eden Valley) • Coonawarra (interim Geographical Indication) • Padthaway • Langhorne Creek • McLaren Vale • Clare • Adelaide Hills • Wrattonbully • Robe and Mt Benson • Currency Creek and Fleurieu Peninsula
2. Phylloxera outbreak Economic Impact.
2.1 The purpose of this part of the project is to give the Board a clearer understanding of the full cost of a phylloxera outbreak and the resources required to manage an outbreak;
2.2 The tenderer will be required to undertake a detailed analysis of the economic impact on an outbreak in each of the regions identified in 1.4.
2.3 Specifically, the tenderer will be required to estimate the net impact of an outbreak on:
2.3.1 vineyard owners; 2.3.2 regional grape and wine production; 2.3.3 the regional economy;

PGIBSA The Risk and Economic Impact of Phylloxera in SA’s Viticultural Regions
EconSearch Pty Ltd Page: 65
Appendix 2 Input-Output Methodology Overview of Input-Output Analysis Input-output analysis provides a comprehensive economic framework that is extremely useful in the resource planning process. Broadly, there are two ways in which the input-output method can be used. First, the input-output table provides a numerical picture of the size and shape of the economy and its essential features. The input-output transactions table can be used to describe some of the important features of an economy, the interrelationships between sectors, and the relative importance of the individual sectors. Second, input-output analysis provides a standard approach for the estimation of the economic impact of a particular activity. The input-output model is used to calculate industry multipliers that can then be applied to various development scenarios. Linkages between sectors The standard approach for the estimation of the regional economic impact of a particular activity, such as wine production, is to employ input-output analysis. The input-output model conceives the economy of the region as being divided up into a number of sectors, and this allows the analyst to trace expenditure flows. To illustrate this, consider the example of a winery that, in the course of its operation, purchases goods and services from other sectors. These goods and services would include grapes, bottles, and corks and, of course, labour. The direct employment created is regarded in the model as an expenditure flow into the household sector, which is one of several non-industrial sectors recognised in the input-output model. Upon receiving expenditure by the winery, the other sectors in the state economy engage in their own expenditures. For example, as a consequence of winning a contract for work with a winery, a bottle manufacturer buys materials from its suppliers and labour from its own employees. Suppliers and employees in turn engage in further expenditure, and so on. These indirect effects, as they are called, are part of the impact of the winery on the regional or state economy. They must be added to the direct effects (which are expenditures made in immediate support of the winery itself) in order to arrive at a measure of the total impact of the winery. It may be thought that these indirect effects go on indefinitely, and that their amount adds up without limit, the presence of leakages, however, prevents this from occurring. In the context of the impact on a regional or state economy, an important leakage is expenditure on imports, that is, products or services that originate from outside the region, state or country (e.g. French oak barrels). Thus some of the expenditure for imports to the region is lost to the local economy. Consequently, the indirect effects get smaller and smaller in successive expenditure rounds, due to this and other leakages. Hence the total expenditure created in the local economy is limited in amount, and so (in principle) it can be measured.

PGIBSA The Risk and Economic Impact of Phylloxera in SA’s Viticultural Regions
EconSearch Pty Ltd Page: 66
The performance of the input-output analysis calculations require a great deal of information. The analyst needs to know the magnitude of various expenditures and where they occur. Also needed is information on how the sectors that receiving this expenditure share their expenditures among the various sectors from whom they buy, and so on for the further expenditure rounds. In applying the input-output model, the standard procedure is to determine the direct or first-round expenditures only. No attempt is made to pursue such inquiries on expenditure in subsequent rounds, not even (for example) to trace the effects in the local economy on household expenditures by winery employees on food, clothing, entertainment, and so on, as it is impracticable to measure these effects for an individual case, here the winery. The input-output model is instead based on a set of assumptions about constant and uniform proportions of expenditure. If households in general in the local economy spend (say) 13.3 per cent of their income on food and non-alcoholic beverages, it is assumed that those working in wineries do likewise. Indeed, the effects of all expenditure rounds after the first are calculated by using such standard proportions (multiplier calculations). Multipliers Multipliers are an indication of the strength of the linkages between a particular sector and the rest of the regional economy. As well, they can be used to estimate the impact of a change in that particular sector on the rest of the economy. As noted above, detailed explanations on calculating input-output multipliers (and the underlying assumptions) are provided in any regional economics or input-output analysis text book (see for example Hewings (1985), Jensen and West (1986), Midmore and Harrison-Mayfield (1996), Powell et al. (1985), and West (1993)). Suffice to note that they are calculated through a routine set of mathematical operations based on coefficients derived from the input-output transactions table. Input-output transactions table The structure and linkages of a local economy can be described with the aid of input-output analysis. Input-output analysis, as an accounting system of inter-industry transactions, is based on the notion that no industry exists in isolation. This assumes, within any economy, each firm depends on the existence of other firms to purchase inputs from, or sell products to, for further processing. The firms also depend on final consumers of the product and labour inputs to production. An input-output transactions table is a convenient way to illustrate the purchases and sales of goods and services taking place in an economy at a given time. Input-output tables provide a numerical picture of the size and shape of the economy and its essential features. Products produced in the economy are aggregated into a number of groups of industries and the transactions between them recorded in the transactions table. The rows and columns of the input-output table can be interpreted in the following way: • The rows of the input-output table illustrate sales for intermediate usage (to other
firms) and for final demand (consumers, exports, capital formation).

PGIBSA The Risk and Economic Impact of Phylloxera in SA’s Viticultural Regions
EconSearch Pty Ltd Page: 67
• The columns show the origin of the inputs and hence the purchases made at that time (labour, capital and intermediate inputs).
• Each item is shown as a purchase by one sector and a sale by another, thus
constructing two sides of a double accounting schedule. In summary, the input-output transactions table can be used to describe some of the important features of a regional economy, the interrelationships between sectors, and the relative importance of the individual sectors. The table is also used for the calculation of sector multipliers and the estimation of economic impacts arising from some change in the local economy.
PGIBSA The Risk and Economic Impact of Phylloxera in SA’s Viticultural Regions
EconSearch Pty Ltd Page: 68
Appendix 3 Glossary of Input-Output Terminology Consumption-induced effects are additional output, employment and income resulting from re-spending by households that receive income from employment in direct and indirect activities. Consumption-induced effects are sometimes referred to as “induced effects”. Direct effects are the initial round of output, employment and income generated by an economic activity. Employment is the number of working proprietors, managers, directors and other employees, in terms of the number of full-time equivalent jobs. Flow-on effects are the sum of the production-induced effects and the consumption-induced effects. Gross regional (or state) product is a measure of value added on a regional basis. It can be calculated using two methods. The income method calculates GRP as household income plus other value added. The expenditure method calculates GRP as household expenditure plus other final demand, that is, in total, gross regional expenditure, plus exports less imports. Household income is wages and salaries and other payments to labour including overtime payments and income tax, but excluding payroll tax. Input-output analysis is an accounting system of inter-industry transactions based on the notion that no industry exists in isolation. Input-output table is a transactions table that illustrates and quantifies the purchases and sales of goods and services taking place in an economy at a given point in time. It provides a numerical picture of the size and shape of the economy and its essential features. Each item is shown as a purchase by one sector and a sale by another, thus constructing two sides of a double accounting schedule. Multiplier is an index (ratio) indicating the overall change in the level of activity that results from an initial change in economic activity. They are an indication of the strength of the linkages between a particular sector and the rest of the regional economy. They can be used to estimate the impact of a change in that particular sector on the rest of the economy. Other Final Demand includes government expenditure, private and public sector investment (gross fixed capital formation) and change in stocks (inventories). Other Value Added includes gross operating surplus and all taxes, less subsidies. Output is gross revenue of goods and services produced by commercial organisations plus gross expenditure by government agencies. Production-induced effects are additional output, employment and income resulting from re-spending by firms that receive income from the sale of goods and services to firms undertaking, for example, agricultural activities. Production-induced effects are sometimes referred to as “indirect effects”. Total impact is the sum of the direct effects and the flow-on effects.

PGIBSA The Risk and Economic Impact of Phylloxera in SA’s Viticultural Regions
EconSearch Pty Ltd Page: 69
Type I multiplier is calculated as (direct effects + production induced effects)/direct effects. Type II multiplier is calculated as (direct effects + production induced effects + consumption induced effects)/direct effects. Value added is calculated as the value of output less the cost of goods and services (including imports) used in producing the output. It represents payments to the primary inputs of production (labour, capital and land). Value added is consistent with standard measures of economic activity, such as gross domestic, state or regional product and it provides an assessment of the net contribution to regional economic growth of a particular enterprise or activity.