risk informed design as part of the systems engineering ... · rid is accomplished as part of the...
TRANSCRIPT
www.nasa.gov
Risk Informed Design as Part of the Systems Engineering Process
CHSF Symposium AIAA NASA October 14-15, 2010
George Deckert – NASA
https://ntrs.nasa.gov/search.jsp?R=20100037185 2020-02-20T03:25:15+00:00Z
What is Risk Informed Design (RID)?
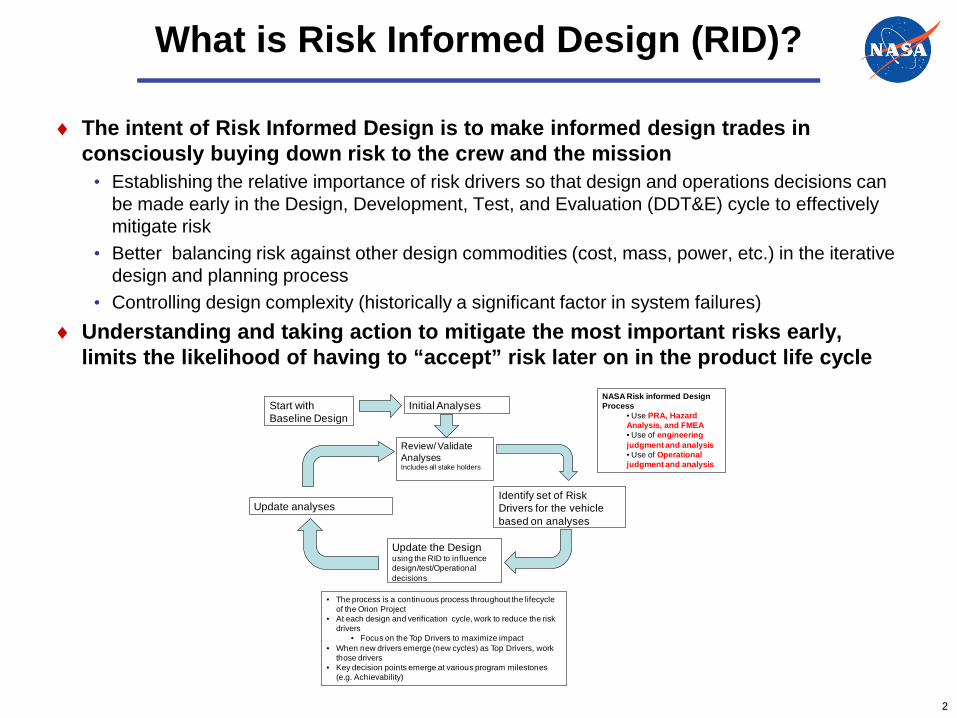
♦ The intent of Risk Informed Design is to make informed design trades in consciously buying down risk to the crew and the mission
• Establishing the relative importance of risk drivers so that design and operations decisions can be made early in the Design, Development, Test, and Evaluation (DDT&E) cycle to effectively mitigate risk
• Better balancing risk against other design commodities (cost, mass, power, etc.) in the iterative design and planning process
• Controlling design complexity (historically a significant factor in system failures)♦ Understanding and taking action to mitigate the most important risks early,
limits the likelihood of having to “accept” risk later on in the product life cycle
2
• The process is a continuous process throughout the lifecycle of the Orion Project
• At each design and verification cycle, work to reduce the risk drivers
• Focus on the Top Drivers to maximize impact• When new drivers emerge (new cycles) as Top Drivers, work
those drivers• Key decision points emerge at various program milestones
(e.g. Achievability)
Initial Analyses
Review/ Validate AnalysesIncludes all stake holders
Update the Design using the RID to influence design/test/Operational decisions
Update analysesIdentify set of Risk Drivers for the vehicle based on analyses
NASA Risk informed Design Process
• Use PRA, Hazard Analysis, and FMEA• Use of engineering judgment and analysis• Use of Operational judgment and analysis
Start withBaseline Design
RID Approach
♦RID is based on the principle that risk is a design commodity such as mass, volume, cost or power.
♦Both Qualitative and Quantitative risk analyses are used to expose dominant risk contributors, design trades and planning alternatives in the context of assigning critical design commodities.
♦RID is accomplished as part of the systems engineering design process.
♦Risk analysis includes all significant failure types, including: functional, phenomenological, software, human reliability, common cause, and external or environmental events.
♦Complexity and fidelity of analysis is consistent with the available data and information during each design cycle
• Early in development: Analysis done using higher level heritage based risk models
• Models and analysis then mature with design and gain additional detail• Late in development: Models reflect “as designed” system and provide
sufficient fidelity to evaluate aggregate risk for verification purposes
3
Integrated Decision Packages
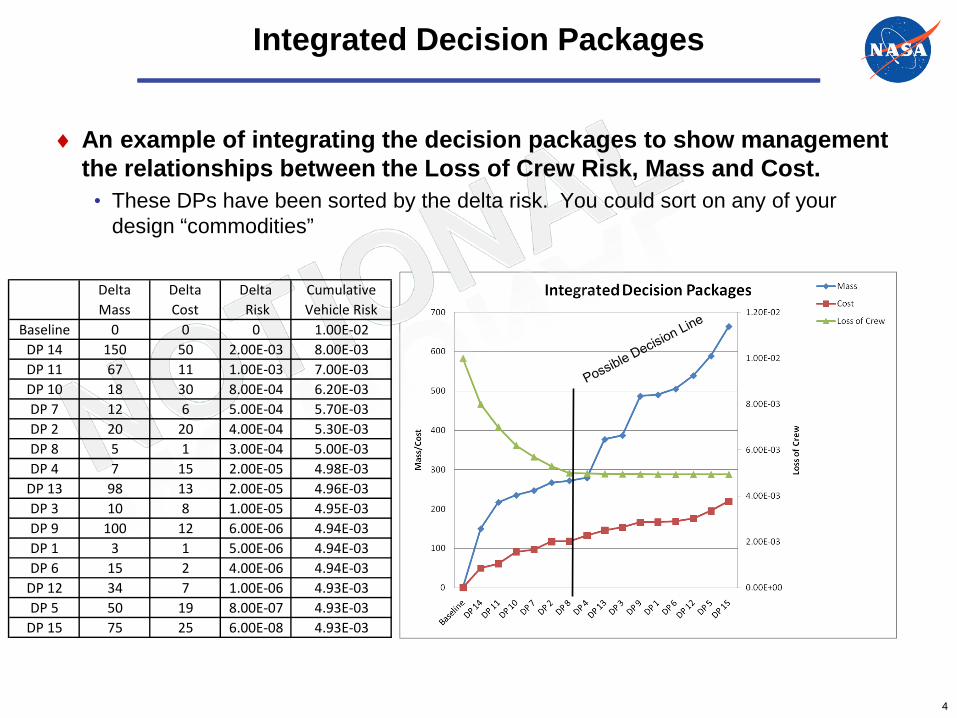
♦ An example of integrating the decision packages to show management the relationships between the Loss of Crew Risk, Mass and Cost.
• These DPs have been sorted by the delta risk. You could sort on any of your design “commodities”
4
Delta Mass
Delta Cost
Delta Risk
CumulativeVehicle Risk
Baseline 0 0 0 1.00E-02DP 14 150 50 2.00E-03 8.00E-03DP 11 67 11 1.00E-03 7.00E-03DP 10 18 30 8.00E-04 6.20E-03DP 7 12 6 5.00E-04 5.70E-03DP 2 20 20 4.00E-04 5.30E-03DP 8 5 1 3.00E-04 5.00E-03DP 4 7 15 2.00E-05 4.98E-03
DP 13 98 13 2.00E-05 4.96E-03DP 3 10 8 1.00E-05 4.95E-03DP 9 100 12 6.00E-06 4.94E-03DP 1 3 1 5.00E-06 4.94E-03DP 6 15 2 4.00E-06 4.94E-03
DP 12 34 7 1.00E-06 4.93E-03DP 5 50 19 8.00E-07 4.93E-03
DP 15 75 25 6.00E-08 4.93E-03
Backup Material
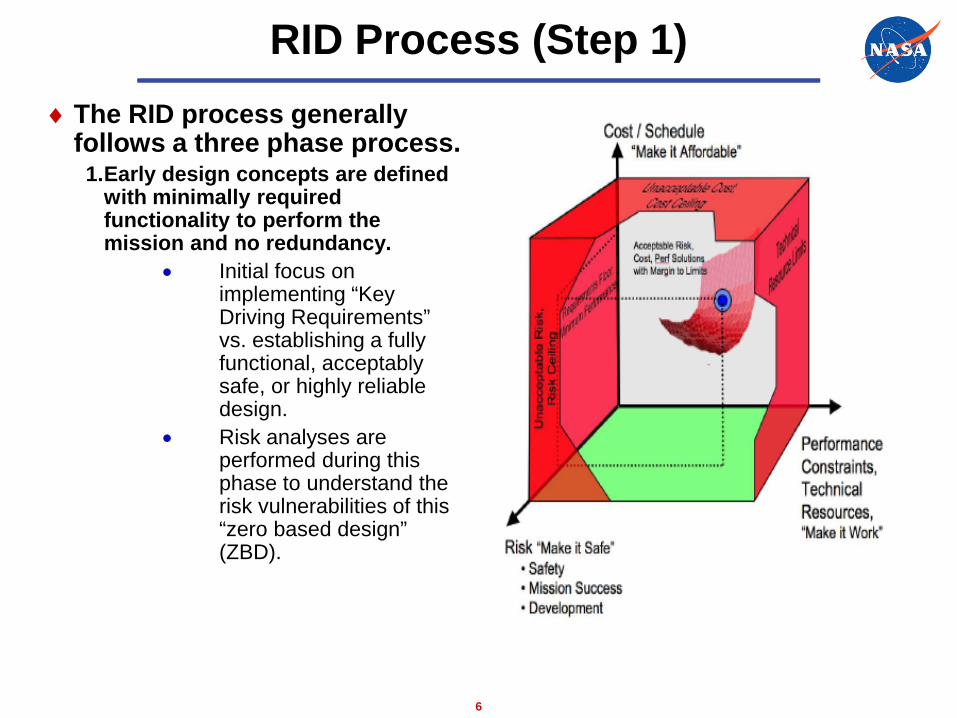
RID Process (Step 1)♦The RID process generally
follows a three phase process.1.Early design concepts are defined
with minimally required functionality to perform the mission and no redundancy.
• Initial focus on implementing “Key Driving Requirements” vs. establishing a fully functional, acceptably safe, or highly reliable design.
• Risk analyses are performed during this phase to understand the risk vulnerabilities of this “zero based design” (ZBD).
6
RID Process (Step 2)2. Once a ZBD baseline has been established, design enhancements are
evaluated with a focus on enhanced functionality and Loss of Crew (LOC) risk.
• Focus: “Make the design work” and “Make the design safe”. • Design is evaluated to determine the best ways to mitigate the risk of the vehicle. • Methods may include: adding a function (e.g., an abort capability), looking at a diverse
method for performing the critical function (dissimilar functional redundancy), increased testing to improve reliability, selecting more reliable components, adding margin to the system or adding similar redundancy.
• Risk mitigation methods are selectively applied to more optimally reduce risk while maintaining performance and cost objectives, with a priority on diversity vs. simple redundancy.
• Major Premise: Simply adding redundancy is one option to improve safety and reliability. It is not the only option. It is not always the safest or most cost effective option.
• Many different investment portfolios (Decision Packages) are compared using Figures of Merit (FOMs) derived from key risk commodities, including LOC risk in order to develop a more functional and safe design within available resources.
• Goal: Spend scarce risk mitigation resources (mass, power, volume, cost) most effectively to maximally address risk.
7
3. Finally, additional enhancements are considered which more fully address functional requirements and focus on reliability and the Loss of Mission (LOM) risk.
• A portfolio approach to comparing investments is again used• Ensures that the final design iteration produces a vehicle that more optimally
meets functional requirements safely, reliably, and within budget.
RID Process (Step 3)
8
RID Summary
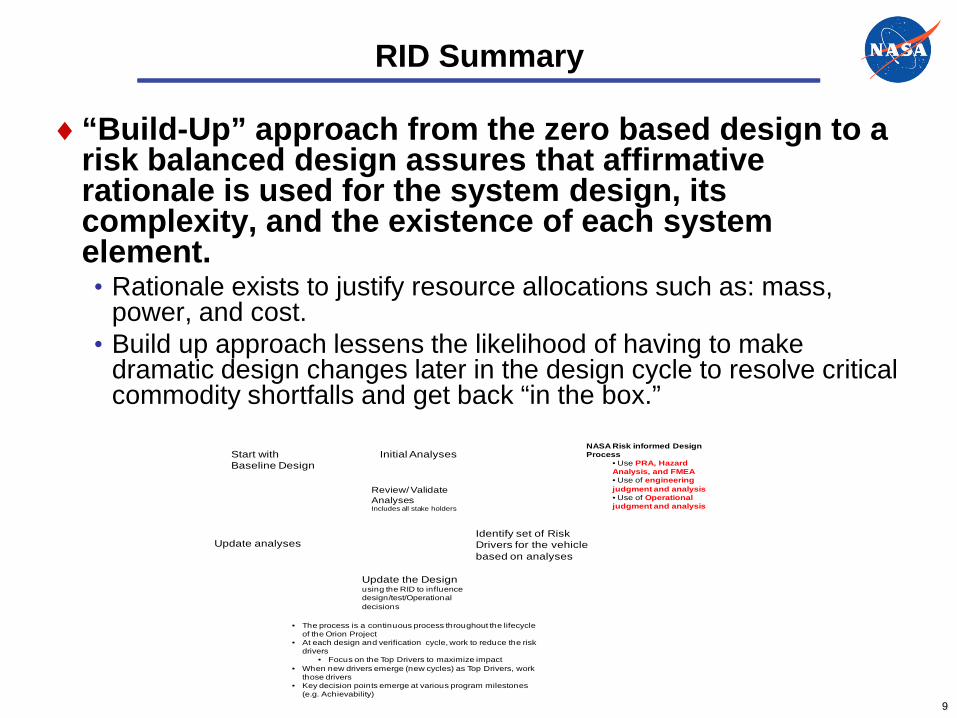
♦“Build-Up” approach from the zero based design to a risk balanced design assures that affirmative rationale is used for the system design, its complexity, and the existence of each system element. • Rationale exists to justify resource allocations such as: mass,
power, and cost. • Build up approach lessens the likelihood of having to make
dramatic design changes later in the design cycle to resolve critical commodity shortfalls and get back “in the box.”
• The process is a continuous process throughout the lifecycle of the Orion Project
• At each design and verification cycle, work to reduce the risk drivers
• Focus on the Top Drivers to maximize impact• When new drivers emerge (new cycles) as Top Drivers, work
those drivers• Key decision points emerge at various program milestones
(e.g. Achievability)
Initial Analyses
Review/ Validate AnalysesIncludes all stake holders
Update the Design using the RID to influence design/test/Operational decisions
Update analysesIdentify set of Risk Drivers for the vehicle based on analyses
NASA Risk informed Design Process
• Use PRA, Hazard Analysis, and FMEA• Use of engineering judgment and analysis• Use of Operational judgment and analysis
Start withBaseline Design
9
PROBABILISTIC RISK ASSESSMENT
10
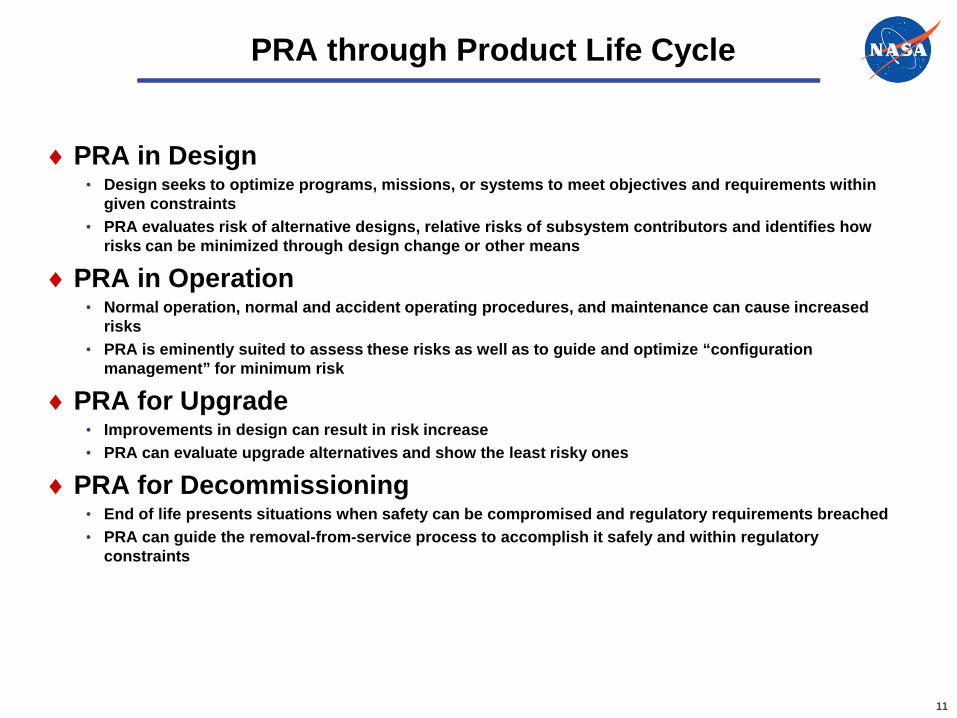
PRA through Product Life Cycle
♦PRA in Design• Design seeks to optimize programs, missions, or systems to meet objectives and requirements within
given constraints• PRA evaluates risk of alternative designs, relative risks of subsystem contributors and identifies how
risks can be minimized through design change or other means
♦PRA in Operation• Normal operation, normal and accident operating procedures, and maintenance can cause increased
risks• PRA is eminently suited to assess these risks as well as to guide and optimize “configuration
management” for minimum risk
♦PRA for Upgrade• Improvements in design can result in risk increase• PRA can evaluate upgrade alternatives and show the least risky ones
♦PRA for Decommissioning• End of life presents situations when safety can be compromised and regulatory requirements breached• PRA can guide the removal-from-service process to accomplish it safely and within regulatory
constraints
11
Why PRA?
♦ In some cases, qualitative functional redundancy analyses can adequately assess reliability. Due to the high-hazard missions and the system complexity associated with Human Space Flight, quantification of risk to the crew and mission is needed.
♦ “Risk”: scenarios, associated frequencies, and associated consequences
♦ The quantitative risk perspective gained from PRA allows for evaluation of design based on:
• Comprehensive set of failure scenarios and consequence severity• System’s ability to cope with off-nominal events• Effectiveness of mitigation capabilities• Identification and expected frequency estimation of risk-significant failure modes• Consideration of support systems and environmental conditions
♦ PRA is used to identify potential risk reduction measures and to support decisions regarding change in design or operational practice.
12
Elements of PRA
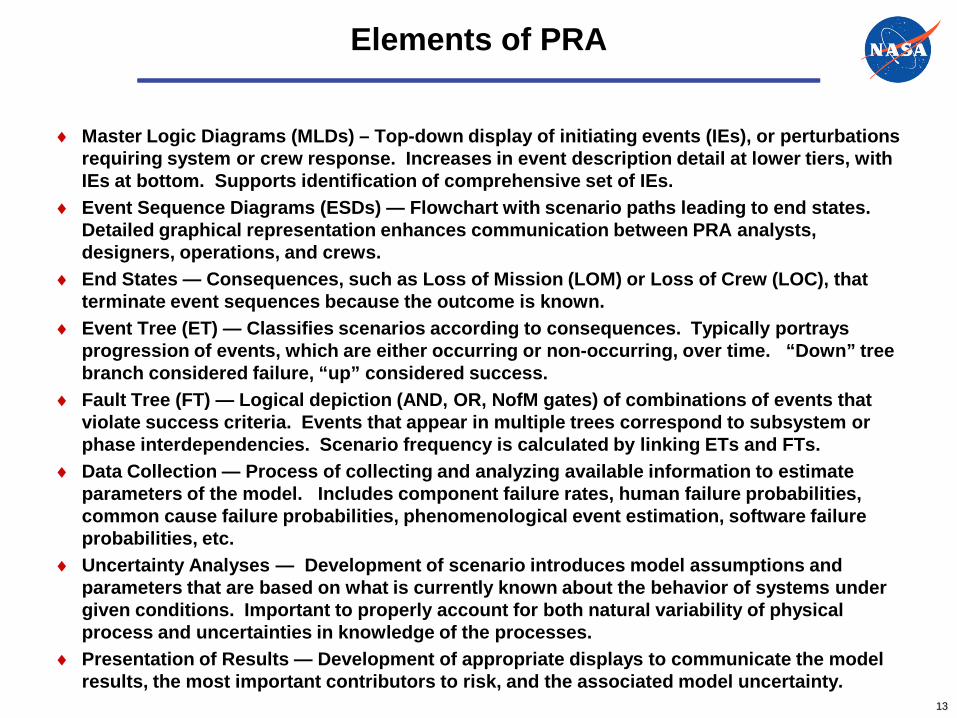
♦ Master Logic Diagrams (MLDs) – Top-down display of initiating events (IEs), or perturbations requiring system or crew response. Increases in event description detail at lower tiers, with IEs at bottom. Supports identification of comprehensive set of IEs.
♦ Event Sequence Diagrams (ESDs) — Flowchart with scenario paths leading to end states. Detailed graphical representation enhances communication between PRA analysts, designers, operations, and crews.
♦ End States — Consequences, such as Loss of Mission (LOM) or Loss of Crew (LOC), that terminate event sequences because the outcome is known.
♦ Event Tree (ET) — Classifies scenarios according to consequences. Typically portrays progression of events, which are either occurring or non-occurring, over time. “Down” tree branch considered failure, “up” considered success.
♦ Fault Tree (FT) — Logical depiction (AND, OR, NofM gates) of combinations of events that violate success criteria. Events that appear in multiple trees correspond to subsystem or phase interdependencies. Scenario frequency is calculated by linking ETs and FTs.
♦ Data Collection — Process of collecting and analyzing available information to estimate parameters of the model. Includes component failure rates, human failure probabilities, common cause failure probabilities, phenomenological event estimation, software failure probabilities, etc.
♦ Uncertainty Analyses — Development of scenario introduces model assumptions and parameters that are based on what is currently known about the behavior of systems under given conditions. Important to properly account for both natural variability of physical process and uncertainties in knowledge of the processes.
♦ Presentation of Results — Development of appropriate displays to communicate the model results, the most important contributors to risk, and the associated model uncertainty.
13
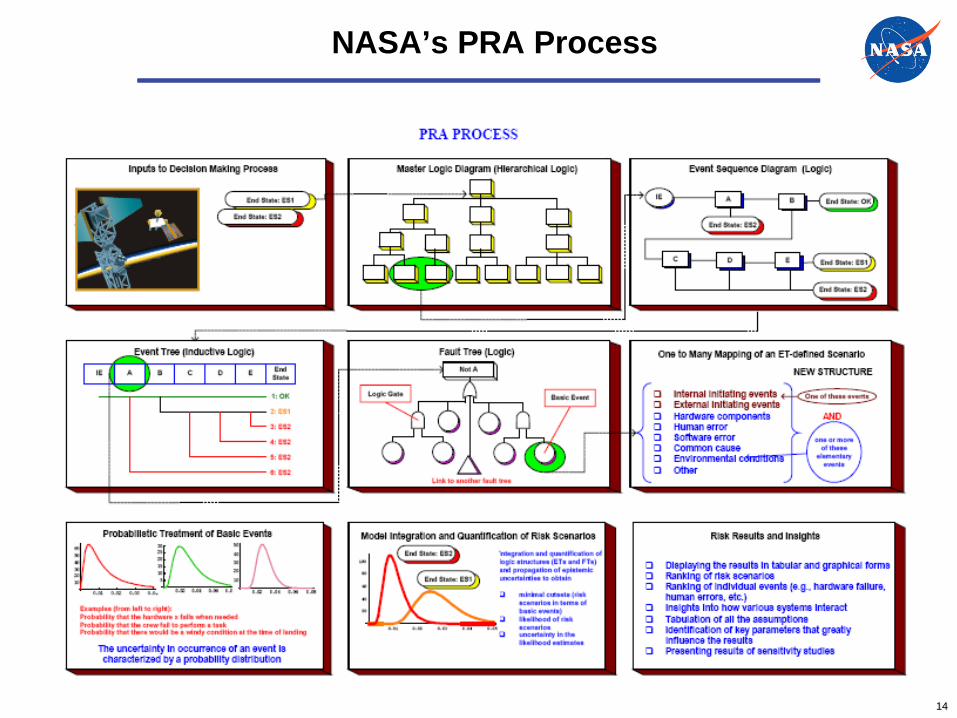
NASA’s PRA Process
14

PRA Throughout Project Lifecycle
♦ Model and data improvement continue throughout the lifecycle♦ Risk informed design, test and operations continue throughout the
Project lifecycle15
CY-2116 CY-2117 CY-2118 CY-2119 CY-2120
J F M A M J J A S O N D J F M A M J J A S O N D J F M A M J J A S O N D J F M A M J J A S O N D J F M A M J J A S O N D
CY-2121
J F M A M J J A S O N D
CY-2122
J F M A M J J A S O N D
CY-2123
J F M A M J J A S O N D
CY-2124
J F M A M J J A S O N D
SDR
CDR
MajorMilestones
PA 1 Test 1
Reqmnts/Design/Analysis DAC 2
607 Closeout ERB
PDR
DAC 4
SBR
VAC 1 VAC 2 VAC 3 VAC 4
Test 2Test 3 Flight 2
Flight 1Test 4
VAC6 VAC8VAC7DAC 5 VAC 5
RiskDrivers
Design Updates
Design Updates
Design Updates
Component Qual Testing
System Qual Testing
RiskDrivers
UpdatesRiskDrivers
Updates
RiskDrivers
Updates
RiskDrivers
Updates RiskDrivers
Updates
RiskDrivers
Updates LOC/LOMRequirement Verification
Mission SpecificRisk Reduction
RiskDrivers
Updates RiskDrivers
Updates
Mission SpecificRisk Reduction
RiskDrivers
Updates
RiskDrivers
Updates
RiskDrivers
Updates
RiskDrivers
UpdatesRiskDrivers
Updates
Mission Specific. Mission objectives and procedures
Verifying the assumptions and data. Updating design based on increasing knowledge of the capabilities of the vehicle
Design improvements, Updating testing needs, etc. Do we have a
good vehicle architecture at PDR
DAC 3
RiskDrivers
Design Updates

Example Event Tree and Fault Trees
16
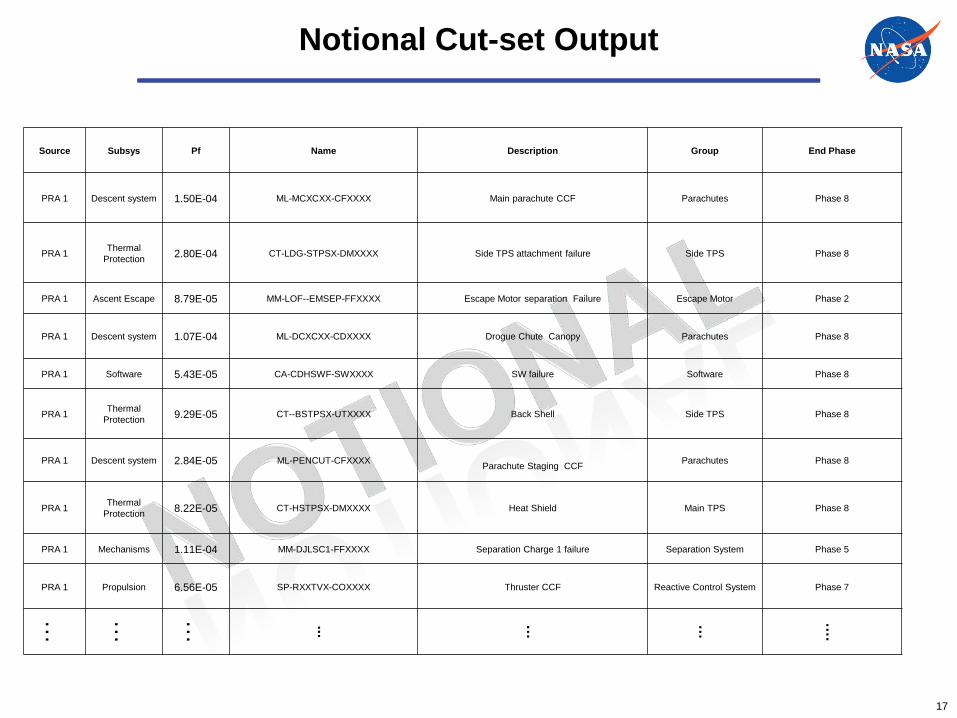
Notional Cut-set Output
17
Source Subsys Pf Name Description Group End Phase
PRA 1 Descent system 1.50E-04 ML-MCXCXX-CFXXXX Main parachute CCF Parachutes Phase 8
PRA 1 Thermal Protection 2.80E-04 CT-LDG-STPSX-DMXXXX Side TPS attachment failure Side TPS Phase 8
PRA 1 Ascent Escape 8.79E-05 MM-LOF--EMSEP-FFXXXX Escape Motor separation Failure Escape Motor Phase 2
PRA 1 Descent system 1.07E-04 ML-DCXCXX-CDXXXX Drogue Chute Canopy Parachutes Phase 8
PRA 1 Software 5.43E-05 CA-CDHSWF-SWXXXX SW failure Software Phase 8
PRA 1 Thermal Protection 9.29E-05 CT--BSTPSX-UTXXXX Back Shell Side TPS Phase 8
PRA 1 Descent system 2.84E-05 ML-PENCUT-CFXXXX Parachute Staging CCF Parachutes Phase 8
PRA 1 Thermal Protection 8.22E-05 CT-HSTPSX-DMXXXX Heat Shield Main TPS Phase 8
PRA 1 Mechanisms 1.11E-04 MM-DJLSC1-FFXXXX Separation Charge 1 failure Separation System Phase 5
PRA 1 Propulsion 6.56E-05 SP-RXXTVX-COXXXX Thruster CCF Reactive Control System Phase 7
… … … ... … … ….

Informing the Design
♦Identify functional groupings that represent risk scenarios common to a particular function.• These come from the “Group” column of the cut-set spreadsheet.
♦Usually build the Pareto chart based on the top 95% of vehicle risk in order to illustrate the key drivers.• This is done to again help focus discussions on key drivers
♦Designers can focus on the top few risk contributors that represent the greatest “bang for the buck”.
♦Allow the design teams to address specific failure scenarios and develop focused solutions rather than simply adding redundancy across the system.
18

Example Pareto Chart
19
USE OF THE PRA OUTPUT IN DESIGN TRADE STUDIES
20
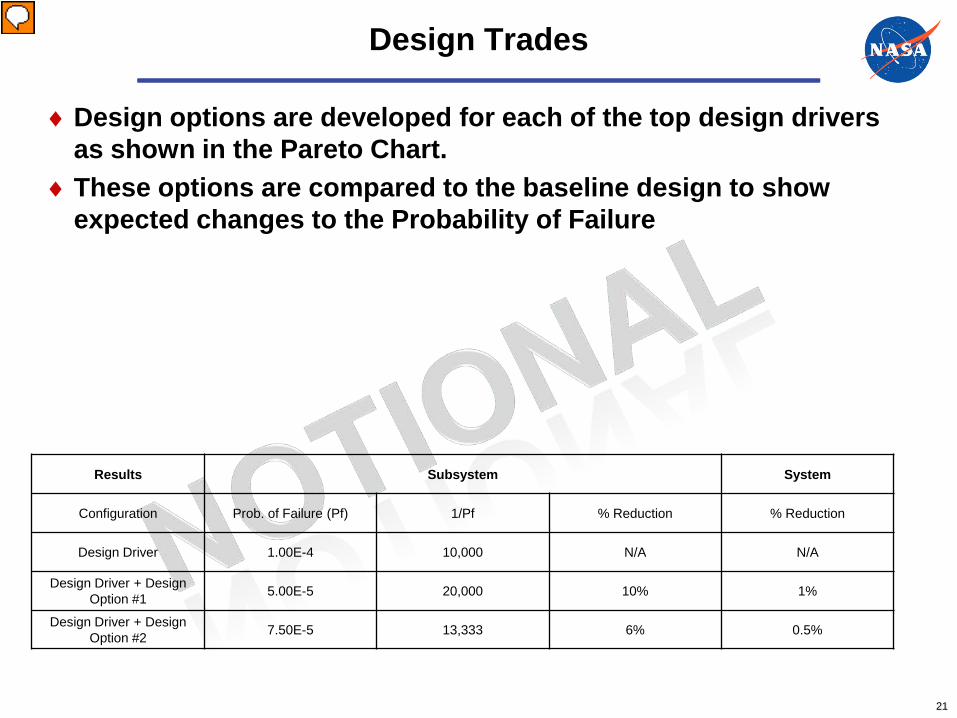
Design Trades
♦Design options are developed for each of the top design drivers as shown in the Pareto Chart.
♦These options are compared to the baseline design to show expected changes to the Probability of Failure
Results Subsystem System
Configuration Prob. of Failure (Pf) 1/Pf % Reduction % Reduction
Design Driver 1.00E-4 10,000 N/A N/A
Design Driver + Design Option #1 5.00E-5 20,000 10% 1%
Design Driver + Design Option #2 7.50E-5 13,333 6% 0.5%
21
Design Trades cont.
♦Once design options are viewed within the particular design drivers, Decision Packages are prepared which would look at each option pulling estimates of mass, power, cost, risk, etc.
♦These Decision Packages are then viewed from an integrated perspective.• The idea here is to choose the combination of Decision Packages
that will reduce the risk to crew and show what the impacts would be for our other design “commodities” (mass, power, cost, etc.).
♦These integrated packages are provided to the project management so they can make their design decisions.
22
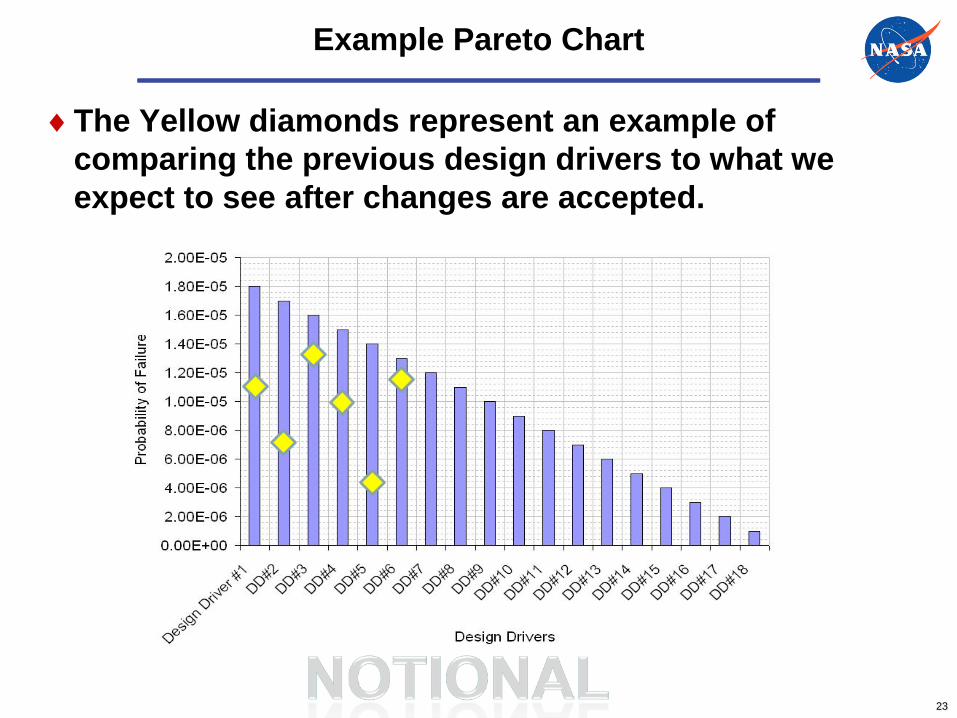
Example Pareto Chart
♦The Yellow diamonds represent an example of comparing the previous design drivers to what we expect to see after changes are accepted.
23
Results from the RID Process
♦With this information, decision makers can make informed decisions as to where to draw the line to get the most “bang for your buck”.
♦So from our example, the decision could be include DPs 14, 11, 10, 07, 02, and 08.
• This seems to be the combination where we have a “knee” in the curve when looking at mass.
24

SUMMARY
25

♦The use of the RID process in the development of the Constellation Program has been very beneficial.
♦For the first time in a major human spaceflight program, risk to the crew and mission has been a part of the design and development process instead of waiting for the design to be completed and then assessing the risk to the crew and mission.
♦This Process has been adopted by NASA as the way to develop Spacecraft and Launch Vehicles.
26