risk management: city loss prevention needs a proactive
TRANSCRIPT
Portland City AuditorAudit Services Division
RISK MANAGEMENT:
City loss prevention needs a proactive approach
June 2017

Production / Design
Robert CowanPublic Information Coordinator
Cover Photo
Jennifer ScottBroken water main in downtown Portland
Portland City AuditorAudit Services Division
RISK MANAGEMENT:
City loss prevention needs a proactive approach
June 2017

June 22, 2017
TO: Mayor Ted Wheeler Commissioner Chloe Eudaly Commissioner Nick Fish Commissioner Amanda Fritz Commissioner Dan Saltzman Tom Rinehart, Chief Administrative Offi cer
FROM: Mary Hull Caballero, City Auditor
SUBJECT: Audit Report - Risk Management: City loss prevention needs a proactive approach (Report #493)
This report makes recommendations to strengthen the City’s safety and loss prevention programs and to improve the consistency of liability claims management.
The response letter from the Chief Administrative Offi cer is included at the end of the report.
We will follow up in one year with the Commissioner-in-Charge and the Chief Administrative Offi cer for a status report detailing steps taken to address our audit recommendations.
We appreciate the assistance we received from the Offi ce of Management and Finance and Risk Management Division as we conducted this audit.
Mary Hull Caballero Audit Team: Drummond Kahn City Auditor Kari Guy Elizabeth Pape
City of Portland1221 SW 4th Avenue, Room 310 | Portland, OR 97204 | (503) 823-4005
www.PortlandOregon.gov/auditservices
iv
Risk Management
Table of Contents
Summary . . . . . . . . . . . . . . . . . . . . . . . . . . . . . . . . . . . . . . . . . . . . . . . . . . . . . . . . . . . . . . . . 1
Background . . . . . . . . . . . . . . . . . . . . . . . . . . . . . . . . . . . . . . . . . . . . . . . . . . . . . . . . . . . . .1
Audit Finding: City needs a proactive approach to loss
prevention . . . . . . . . . . . . . . . . . . . . . . . . . . . . . . . . . . . . . . . . . . . . . . . . . . . . . . . . . . . . . . 3
Recommendations: Loss Prevention . . . . . . . . . . . . . . . . . . . . . . . . . . . . . . 8
Audit Finding: Liability claims management generally
eff ective . . . . . . . . . . . . . . . . . . . . . . . . . . . . . . . . . . . . . . . . . . . . . . . . . . . . . . . . . . . . . . . . .9
Recommendations: Liabiltiy claims management . . . . . . . . . . . . 13
Objectives, scope and methodology . . . . . . . . . . . . . . . . . . . . . . . . . . . . . 14
Response to the audit . . . . . . . . . . . . . . . . . . . . . . . . . . . . . . . . . . . . . . . . . . . . . . . 17

1
Risk Management
Portland’s Risk Management Division spends almost $16 million each year helping City bureaus reduce injuries and loss, and managing and paying claims against the City. We reviewed how Risk Management coordinates its overall loss prevention programs and how it manages general liability claims against the City after an incident occurs.
Overall loss prevention activities need a proactive, Citywide focus. Risk Management does not follow City Code and policy requirements for benchmarking, information sharing, and annual reporting, result-ing in a lack of communication to City Council and bureaus about loss prevention activities and loss trends. Without a Citywide focus, City Council and bureaus may not have the information they need to budget for and prioritize risks.
Risk Management usually manages liability claims against the City well, but its approach is inconsistent. Risk Management implemented a new information system, and needs to make better use of the system’s capabilities to ensure claims are resolved consistently and on time.
Managing and controlling risk is a Citywide challenge that involves every level from City Council to individual workers. We recommend Risk Management work with City bureaus to establish a proactive, Citywide approach to loss prevention, and update its claims manage-ment procedures.
Many of the City of Portland’s 6,000 employees are in the community every day, operating heavy equipment to repair water and sewer lines, paving roads, driving police cars or fi re trucks to respond to emergencies, or leading classes in recreation centers. There are risks
RISK MANAGEMENT:City loss prevention needs a proactive approach
Summary
Background

2
Risk Management
of worker injuries and accidents inherent in much of the work the City does. A good risk management program would anticipate those risks, design programs to avoid them as much as possible, and have systems in place to resolve incidents when they occur.
In Portland, this responsibility is assigned to the Risk Management Division in the Offi ce of Management and Finance. Risk Management has fi ve primary functions:
Monitor and coordinate a Citywide safety and loss prevention program
Manage liability claims against the City when an incident occurs
Manage workers’ compensation claims
Purchase insurance
Provide occupational health services
Risk Management’s budget was $15.8 million in fi scal year 2016-17, including funds set aside to pay claims. The City manages and settles claims up to $1 million for most services, and up to $2.5 million for claims against the police. Risk Management purchases insurance for claims that exceed those limits.
Rather than bill directly for services, Risk Management’s costs, includ-ing those for administration, claim payments, and insurance, are paid for by City bureaus based on each bureau’s claim history, staffi ng level, and property insurance costs. That means, for example, that large operational bureaus, such as Police, have higher allocations for Risk Management’s costs than bureaus who rarely have claims fi led against them.
We audited the fi rst two components of Risk Management’s program: monitoring and coordinating the Citywide loss prevention program, and managing the general and fl eet liability claims made against the City. Like many functions in the City’s Offi ce of Management and Finance, Risk Management uses both centralized and decentralized approaches, depending on the function. Loss prevention follows
3
Risk Management
a decentralized model, with Risk Management providing technical assistance and coordination while bureaus are responsible for devel-oping and implementing safety programs for their staff . In this audit, we focus on Risk Management’s technical assistance and coordination role in helping bureaus reduce general liability and workers’ compen-sation claims.
Risk Management handles general and fl eet liability claims centrally. Risk Management analysts consult with safety staff in bureaus, but decisions on claims resolution are made by Risk Management. City Council must approve claims over $5,000. If a claim is fi led in court, the City Attorney works with Risk Management to defend the City’s interests and resolve the claim. We focused our audit work on Risk Management’s role in claims management.
Audit Finding:
City needs a
proactive approach
to loss prevention
An eff ective loss prevention program has clear program objectives and goals, and uses complete information to evaluate and report on the success of loss prevention eff orts. In addition, Oregon state rules require the City to have a loss control program in place because the City insures itself for some losses. Beginning in 1986, City Council adopted City Code requirements and a Loss Prevention Policy that incorporate these best practices.

4
Risk Management
We found that Risk Management does not follow many aspects of the City Code and Loss Prevention Policy:
Loss Control Code and Policy
Requirements
Prepare an annual report to Council which communicates activities, results, and areas for improvement.
Establish Citywide loss prevention benchmarks
Provide consultation to bureaus in the development of Loss Prevention Plans and develop guidelines, instructions, and a model plan
Provide technical assistance to bureaus on federal and state mandates
Provide statistical information to bureaus
Develop a loss-prevention recognition program
Current Actions
Not done
(After we completed fi eldwork, Risk Management provided a draft 2016 Annual Report. This was the fi rst annual report in 10 years.)
Not done
Not done
Done:• Reviews bureau facilities and
programs for compliance with Oregon Occupational Safety and Health requirements
• Provides updates to bureaus on federal and state mandates
Partially done:• Provides data on open and
closed claims monthly• Special reports provided on
requestbut• No routine reporting on
trends• Injuries related to sworn
Police and Fire not included
Not done
Code requirements for
loss prevention not
followed
5
Risk Management
Risk managers said they no longer follow City Code requirements for loss prevention due to structural and staff limitations. Instead they provide a catalog of services available to bureaus, including driv-ers’ education, hearing loss prevention, and ergonomic assessments. Risk Management provides technical assistance and safety reviews for bureaus on request. Risk Management also helps organize safety training and surveys City staff on safety issues.
Risk Management coordinates a monthly meeting to share informa-tion among the safety managers from the eight bureaus with the highest risk and claim volume. A 2016 Risk Management survey of bureau customers showed that bureaus value Risk Management’s services but do not always understand which services are available.
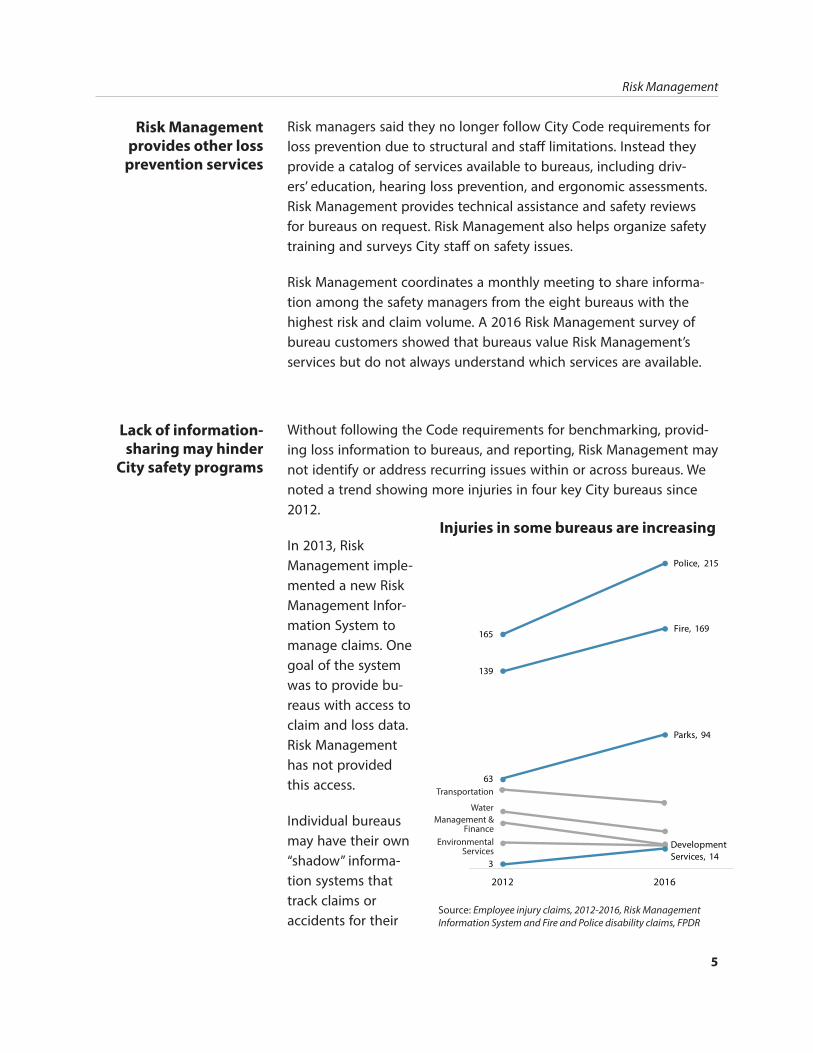
Without following the Code requirements for benchmarking, provid-ing loss information to bureaus, and reporting, Risk Management may not identify or address recurring issues within or across bureaus. We noted a trend showing more injuries in four key City bureaus since 2012.
In 2013, Risk Management imple-mented a new Risk Management Infor-mation System to manage claims. One goal of the system was to provide bu-reaus with access to claim and loss data. Risk Management has not provided this access.
Individual bureaus may have their own “shadow” informa-tion systems that track claims or accidents for their
Risk Management
provides other loss
prevention services
Lack of information-
sharing may hinder
City safety programs
Source: Employee injury claims, 2012-2016, Risk Management Information System and Fire and Police disability claims, FPDR
165
Police, 215
139
Fire, 169
63
Parks, 94
3
Development Services, 14
2012 2016
Transportation
Management & Finance
Water
Environmental Services
Injuries in some bureaus are increasing

6
Risk Management
programs outside of the Risk Management Information System. Reports from Risk Management, other than monthly lists of opened and closed claims, are available only by request. One bureau man-ager said collecting complete information from Risk Management on driver safety took three weeks, and after collecting the data once, the bureau discontinued the eff ort because it took too long. Bureau safety managers we interviewed said direct access to the information system would improve their bureaus’ safety programs.
Sharing information on injury trends is more complicated for the Police and Fire bureaus, because Risk Management does not manage worker’s compensation for police offi cers and fi refi ghters. Instead, disability claims are managed by the Fire and Police Disability and Retirement Fund. Police and Fire leadership would have to combine reports from two sources to get a complete picture of injury data for both sworn police offi cers and fi refi ghters and non-sworn employees.
While there were no clear trends in general liability claims, there were recurring claims in all bureaus. Claims for auto liability – when City vehicles damage cars or property – were among the top three causes of liability claims for six key bureaus.
Auto liability and discrimination were among the top three
claim causes in key bureaus
Police
Transportation
Environmental Services
Water
Parks
Development Services
Management and Finance
Fire
Auto liability
Struck or injured
Sewer infrastructure
Water infrastructure
Auto liability
Failure to act
Discrimination
Auto liability
Use of Force
Transportationinfrastructure
Transportationinfrastructure
Auto liability
Discrimination
Auto liability
Auto liability
Discrimination
Arrest
Fall or slip
Fall or slip
Discrimination
Outdoor areas
Discrimination
Failure to act
Failure to act
1st 2nd 3rd
Source: General and fl eet liability claims incurred costs, 2012-2016, Risk Management Information System. Bureaus ranked by total dollar value of claims.

7
Risk Management
Discrimination was also one of the top three causes of claims for many bureaus. Discrimination cases include employees fi ling claims against the City for issues such as harassment, retaliation, or discrimi-nation due to protected class. Understanding recurring losses within bureaus, and setting benchmarks and goals for improvement, can help bureaus develop loss prevention programs.
In prior years, Risk Management signed service agreements with key bureaus every two years. Risk Management provided each with infor-mation on their top three general liability and workers’ compensation claims, helped them prioritize loss prevention activities, and defi ned specifi c tasks for each bureau and Risk Management based on those loss trends. Risk Management then reviewed progress quarterly with updated data to keep the bureaus and Risk accountable for progress. Risk Management no longer provides these service agreements.
Together, City Code and the Loss Prevention Policy create a frame-work for Risk Management to enable employees and City Council to communicate about safety-related issues. According to Code, information about safety should not only be funneled up through safety managers and bureau directors, but also shared through a Loss Control Advisory Committee, made up of City Council and other high-level City offi cials, including the City Auditor. This Risk Management relationship with City Council is necessary to ensure that Council receives adequate information to make cost-benefi t decisions about risk when setting priorities and adopting budgets. While individual bureau directors may bring issues to the attention of commissioners, only Risk Management has the ability to bring a Citywide perspective to the Council and to champion worker safety and loss prevention.
However, the Loss Control Advisory Committee does not currently hold meetings, and we were unable to fi nd records of any prior meetings. With no meetings, and no annual analysis and reporting of losses, City Council receives information about Risk Management activities only when a claim payment must be approved.
Central role for Risk
Management is critical
for Council

8
Risk Management
To provide for a more proactive approach to loss prevention, we rec-ommend that Risk Management, in consultation with City bureaus:
1. Either follow the City Code and Loss Prevention Policy or develop and follow an alternative. At a minimum, a loss prevention program should include:
a. Reporting annually to City Council on prevention activities and loss trends
b. Setting benchmarks, goals, and evaluating results
c. Assisting bureaus with developing loss prevention plans
2. Provide routine trend information on losses to bureaus, both bureau-specifi c and Citywide, to assist bureaus in developing their loss prevention programs.
3. Provide bureau access and training for the Risk Management Information System.
4. Either re-introduce biennial service agreements with the eight bureaus with the most claims or more clearly defi ne the services Risk Management will provide and how they will be provided.
Recommendations:
Loss Prevention

9
Risk Management
Eff ective claims processing should be timely, with claim outcomes clearly documented and communicated. Claims decisions should protect both the City’s fi nancial interest and the interests of those potentially harmed by the City’s actions. Claims information should also inform loss prevention eff orts.
Risk Management takes the following steps in processing claims against the City:
Responds to claimant promptly when a claim is received
Sets ‘reserves’ for potential payments, so the City is aware of pending costs
Investigates the facts of the claim with City bureau assistance
Determines payment amount, if any, and pays claimant
Closes claim
We surveyed claimants with closed claims in the last two years to gauge their experiences with the City’s process. Claimants generally rated the services they received from Risk Management staff posi-tively.
Survey respondents
were positive about
Risk Management
customer service
13%
17%
20%
9%
14%
13%
10%
10%
37%
41%
37%
43%
41%
18%
16%
23%
22%
27%10% 7%
Strongly
Disagree Disagree Agree
Strongly
Agree
Customer service received the highest marks
(Neutral responses not included)
Risk staff treated me with respect
It was easy to fi le my claim
The decision to pay or deny the claim was clearly explained
Risk staff contacted me promptly after I fi led my claim
Risk staff responded promptly to my questions
Source: Audit Services survey of claimants
Audit Finding:
Liability claims
management
generally eff ective

10
Risk Management
Claimants rated their overall satisfaction with the claims process slightly lower than ratings of customer service. There was a sharp di-vide in opinion between claimants whose claims were paid and those whose claims were denied.
“I thought the response of the claims process was going to be somewhat of a hassle to deal with, but it turned out to be very smooth.”- Survey response
“I was extremely upset with the claim process and felt I was not treated with respect or fairly.”- Survey response
“I was satisfi ed in that my claim was paid, but unsatisfi ed it took nearly one year from my fi ling to do so.” – Survey response
Respondents whose claims were paid, but also had low satisfaction, focused their comments on Risk Management’s lack of timeliness and communication.
Some respondents noted that they had not yet received answers to their claims. Because we only surveyed claimants whose claims had been closed by Risk Management, all respondents should have known the outcome of their claim.
Overall satisfaction was strongly linked to claim payment
0%
25%
50%
75%
Verysatisfied
Somewhatsatisfied
Neutral Somewhatdissatisfied
Verydissatisfied
Claim paid in full
Claim paid in part
Claim denied
Source: Audit Services survey of claimants

11
Risk Management
We reviewed a random sample of claim fi les, and found that Risk Management resolved most claims in a consistent and timely manner. Some claims had unexplained delays or unclear outcomes.
Review of claims
showed generally
positive practices
For most claims the process went smoothly:
• Claimants were contacted promptly after notice
• Reserves were set within 30 days of notice
• Claims investigation was documented
• The claim was resolved in a timely manner
For some claims we observed problems:
• Documentation was missing or inconsistent
• Reserves were not updated to refl ect changes in claim information
• There were unexplained delays
• Claimants were not informed of decisions
While many of the total claims closed in 2015 and 2016 were closed in the fi rst three months after fi ling, other claims remained unre-solved for years. If a claim was in litigation this would be expected, but in the sample of claims we reviewed we also saw some delays that appeared to be caused by Risk Management.
Risk Management supervisors review fi nancial transactions and payments for all claims, but do not review overall claims handling or monitor timeliness. The result is that claims with no action can get lost.
We identifi ed examples of claim delays. In one case, a simple claim was delayed for a year before being reassigned and resolved. In another case, Risk Manage-ment asked the claimant to wait while the analyst researched the
Many claims are resolved in three
months; some take years
0%
15%
30%
45%
3 6 9 12 15 18 21 24 27 30 33 36 >36
Months
Source: Risk Management Information System, closed claims 2015-2016

12
Risk Management
cause of a sewer backup. Risk Management later closed the claim for lack of activity, but did not send a denial letter to the claimant.
In some of the claim fi les we reviewed, it was unclear why Risk Management closed a claim because of inconsistent record keeping between Risk Management analysts and the inconsistent use of elec-tronic fi les. Risk Management has not updated its claims processing policies and procedures manual since it implemented the new Risk Management Information System in 2013, and the manual does not refl ect current practice.
Risk Management staff are working to improve use and accuracy of information in the Risk Management Information System. Dur-ing our audit, we noted Risk Management making improvements to the system. The system has capabilities, such as the use of ‘Tasks’ to set automatic deadlines and notices, that could be used to ensure timeliness and consistency in the claims process. Risk Management does not have updated guidelines or a formal training program to standardize use of the new system, so each analyst has a diff erent ap-proach to record-keeping.
In 1976, voters added a provision to City Charter to require that “payment exceeding $5,000 for any claim must be authorized by an ordinance.” There is no provision in the Charter to increase this limit based on infl ation, and that amount may no longer be appropriate to trigger Council’s approval. If adjusted for infl ation, the $5,000 limit would now be closer to $21,000. Risk Management analysts told us that seeking Council approval for claims is time consuming for both staff and claimants, and they may encourage claimants to settle for $5,000 or less to avoid a delay in payment. The closed claims we re-viewed showed a large number of payments of exactly $5,000.
We also noted a few payments of more than $5,000 for claims that were not approved by Council. Risk Management managers said that when a claim has separate payments for injury and for property dam-age, they assume each payment may reach $5,000, even if the total exceeds $5,000. For example, if a car is hit by a City vehicle, Risk may pay up to $5,000 for medical bills and $5,000 for damage to the car
Threshold for Council
review of claims needs
attention

13
Risk Management
without seeking Council approval. Similarly, if joint property owners make a claim (for example, for a fl ooded basement) Risk Management may pay each person $5,000 without informing Council. There is no documentation of this practice to split payments.
Risk Management’s claims management program seems disconnect-ed from overall loss prevention in the City. Risk Management does not perform routine analysis of claim trends to inform loss prevention activities, and bureau safety staff don’t have access to the Risk Man-agement Information System.
Claims information not
used for prevention
“The event that generated our claim in the fi rst place was completely unnecessary. Prevention would have been so much better than pay-ment all round.” – Survey response
Recommendations:
Liability claims
management
To ensure consistent and timely handling of general and fl eet liability claims, we recommend that Risk Management:
5. Update the general and fl eet liability claims policies and procedures manual to address:
a. Supervisory review of claims
b. Staff training
c. Consistent record-keeping and use of Risk Management Information System
d. Benchmarks and goals for service responsiveness
6. Request the next City Charter Review Commission consider raising the dollar limits for Council approval of claims. In the meantime, document and get Council approval for the current split-payment approach.

14
Risk Management
Our audit objectives were to evaluate the eff ectiveness of the City’s loss prevention programs and the City’s general and fl eet liability claims management. We focused our audit on current loss prevention activities and general and fl eet liability claims open as of December 31, 2016 or closed during 2015 and 2016.
To accomplish our audit objectives, we:
Interviewed Risk managers and staff and safety managers and directors from key bureaus
Researched City and State laws, prior audits, program reviews, and best practices related to loss prevention programs and claims handling
Documented roles and responsibilities
Analyzed claims history and City injury data
Reviewed the cost allocation model
Reviewed records related to the loss prevention program including program policies, self-insured audits, safety meeting agendas and notes, safety reviews, and safety survey information
Surveyed 770 claimants with recently closed claims; received 221 responses for a 29 percent response rate
Reviewed a random sample of 50 closed and 20 open general and fl eet liability claims
The Audit Services Division answers directly to the elected City Audi-tor, who is charged by City Charter to conduct performance audits in accordance with generally accepted government auditing standards. Those standards require auditors to be independent of the audited organization to avoid an actual or perceived relationship that could impair the audit work. According to City Code, the City Auditor serves on the City’s Loss Control Advisory Committee. Because that commit-tee does not meet, we do not believe the City Auditor’s membership on the committee constitutes an impairment to our independence.
Objectives, Scope,
and Methodology

15
Risk Management
We conducted this performance audit in accordance with generally accepted government auditing standards. Those standards require that we plan and perform the audit to obtain suffi cient, appropriate evidence to provide a reasonable basis for our fi ndings and conclu-sions based on our audit objectives. We believe that the evidence obtained provides a reasonable basis for our fi ndings and conclusions based on our audit objectives.

16
Risk Management

RESPONSE TO THE AUDIT

RESPONSE TO THE AUDIT

This report is intended to promote the best possible management of public resources. This and other audit reports produced by the Audit Services Division are available for viewing on the web at: www.portlandoregon.gov/auditservices. Printed copies can be obtained by contacting the Audit Services Division.
Audit Services Division
Offi ce of the City Auditor
1221 SW 4th Avenue, Room 310
Portland, Oregon 97204
503-823-4005
www.portlandoregon.gov/auditservices
Risk Management: City loss prevention needs a proactive approach Report #493, June 2017
Audit Team: Kari Guy, Elizabeth Pape
Mary Hull Caballero, City AuditorDrummond Kahn, Director of Audit Services
Other recent audit reports:
Translated Community Survey: Half report City is doing a good job (#496, April 2017)
Portland’s Financial Condition: Funding infrastructure should be high priority (#490, April 2017)
Portland Building Reconstruction: City faced with important post-planning decisions to ensure project success (#482, December 2016)