rizzo calculation 107-3891.02-f-1 1(h), rev. 1, 'probable ...q paul consultants c. rizzo...
TRANSCRIPT
May 4, 2012 BNP-2012-115 Enclosure 4
Enclosure 4
RIZZO Calculation 07-3891.02-F-1 1(h),"Probable Maximum Storm Event for Walker Run Watershed (BBNPP)"
DOQ CALCULM
SATION COVER PAGE
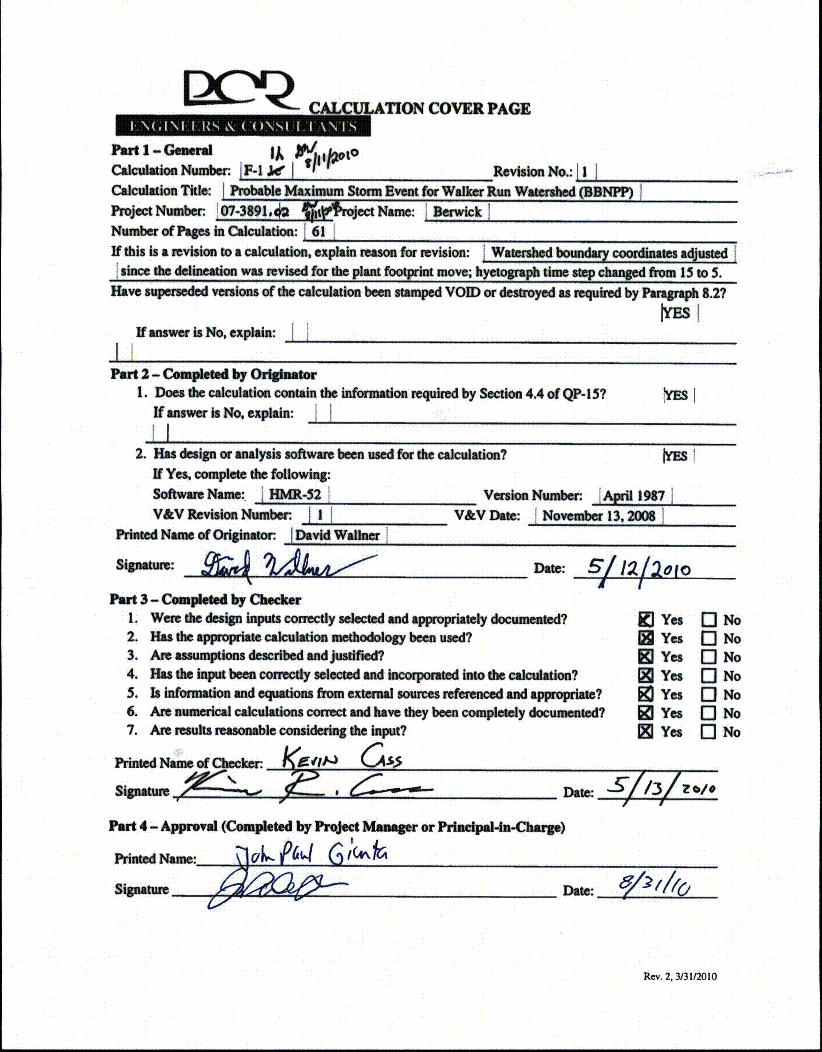
Plai-rt1Gemea Ix jf- ptCalculation Number- I F-iW I pRevision No.: Ii IICalculation T*Ie: I Probable MaxImum Stoan wt EWfor;WalerR~un Watershied (BNNP IProject Numbe. 107-3391.* ec Name: I BwckINumbe of Paes in CalculaWn: 611If this is a revision to a calculadon, explain reason for revision: I Watershed bua co*ornts a sed I
Isimce the delineation was revised for She plan footprint move; hyctogrp time step changed from, 15 to S.Have superseded versions of te calculation been stamped VOID or destroyed as required by paragraph 8.2?WI',.
If answer is No. explain: IjII I
Part 2 - ComphtdW by Orkignalor1. Doe he c"latiocontad W "on * by Section 4,4 of(QP-l5?
IfanswerisNo~explain:I I
2. Has design or analysis software ben used for dte calculation?If Yes, complete th following:
Software Name:. I HMR-52 VonV&V Revision Niunber. VAV Dal
Printed Name of Originator. I Davi Wailner
W1ms
,nNumber [April 19987I: November 13.2=061
Dat: I
Pa.t 3- Compedted by CheckerI1. Were the design Inputs corectly selected and appropriately documented?2. Has de appropriate calculation methodology been used?3. Are asstumptions described andjusifed4. Has dt inp been correctly selected and incorpoatied Into dt calcut ?5. Is informadon and equWons from external sources rderencd and appropriate?6. Are numerical cakculons correct and have dthy been complely documented?7. Are results reasonable considering the Input?
KJYes[YesM]Yes[1YesEayes
YesEYes
0JNo
I-NoINo-No
I-No0 No
Printed Nam atDate: L3zl
, U- Ar
Padt 4 -Approval (Completed by Project M=Wg~ or Princdpal-in-Chag)
PrNoted Name: ýjGfL-A4 Gc614ýkAS*AMW Z: ý- ý- ý- ý
Date:
Rev. 2, 3/31/2010

PAuL C. R zz AssociTms, INc.LCQ CONSULTANTS
By D •Date 4.,/280.10 Subject- Probable Maximum Storm Event Sheet No. I.__ of 61Chkd.ByS .Date for Walker Run Watershed (BBNPP) Project No. 07-38911 "
DW = David Wallner o A
KRC = KevinCass
Purpose:
Evaluate the Probable Maximum Precipitation (PMP) to determine the Probable MaximumStorm (PMS) event that generates the maximum amount of direct runoff (or peak discharge)from the Walker Run watershed. The peak one (1)-hour storm event acting on an area of one(1) square miles (1-mi 2) will also be analyzed to determine the maximum precipitation levelsat the BBNPP site, which will later be used as input to develop the BBNPP site drainagemodel.
Assumptions:
Based on mapping performed for the project, the area of the delineated Walker Runwatershed is 4.31 square miles.
References:
1. Hydrologic Engineering Center (HEC), USACE Water Resources Support Center, June1978, "Hydrometeorological Report No. 51 (HMR-51): Probable Maximum PrecipitationEstimates, United States East of the 105" Meridian."
2. Hydrologic Engineering Center, USACE Water Resources Support Center, March 1984,"Hydrometeorological Report No. 52 (HMR-52): Probable Maximum StormComputation (Eastern U.S.)."
3. HMR-52: Verification & Validation, Project No. 08-9006, RIZZO 2008.
Methodolofv:
The first step in determining the PMS is to evaluate the PMP storm distribution to determinethe credible PMP storm distributions capable of producing the maximum peak dischargefrom the watershed. The HMR-52computer program was developed from the U.S. ArmyCorps of Engineers (USACE) Water Resources Support Center report "HMR-52" (Reference2), and is used to compute basin-average precipitation for the PMS (i.e., develop a rainfallhyetograph) in accordance with the temporal and spatial storm patterns associated with thePMP estimates provided in the HMR-51 report (Reference 1). All required HMR-52program inputs are identified and discussed latter in the "Calculation" section.
The PMP depth generated by the 1-hour 1-mi2 storm event acting on the BBNPP site isdetermined using the isohyet chart presented in Figure 24 of the HMR-52 report (seeAttachment E). Since the storm hyetograph representing the 1-hour 1-mi 2 event has such asmall duration in comparison to the 72-hour event being analyzed over the entire Walker Run
P:\DJUM-52 Walker Run PMS Caic. (Rev. 1)
Q PAUL C. R izzo ASSOCIATES, INC.CONSULTANTS QBy DW.I Date 4/28/2010 Subject Probable Maximum Storm Event Sheet No. 2 of 61Chkd.By A.K4 Date / for Walker Run Watershed (BBNPP) Project No. 07-3891
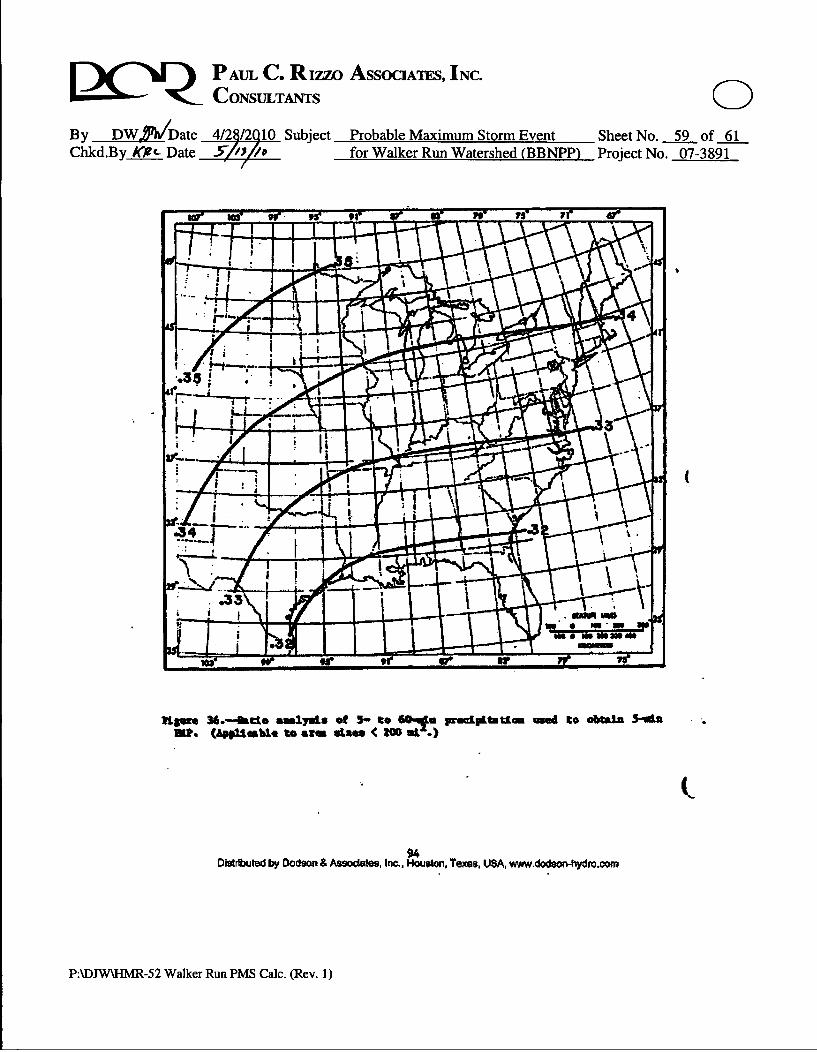
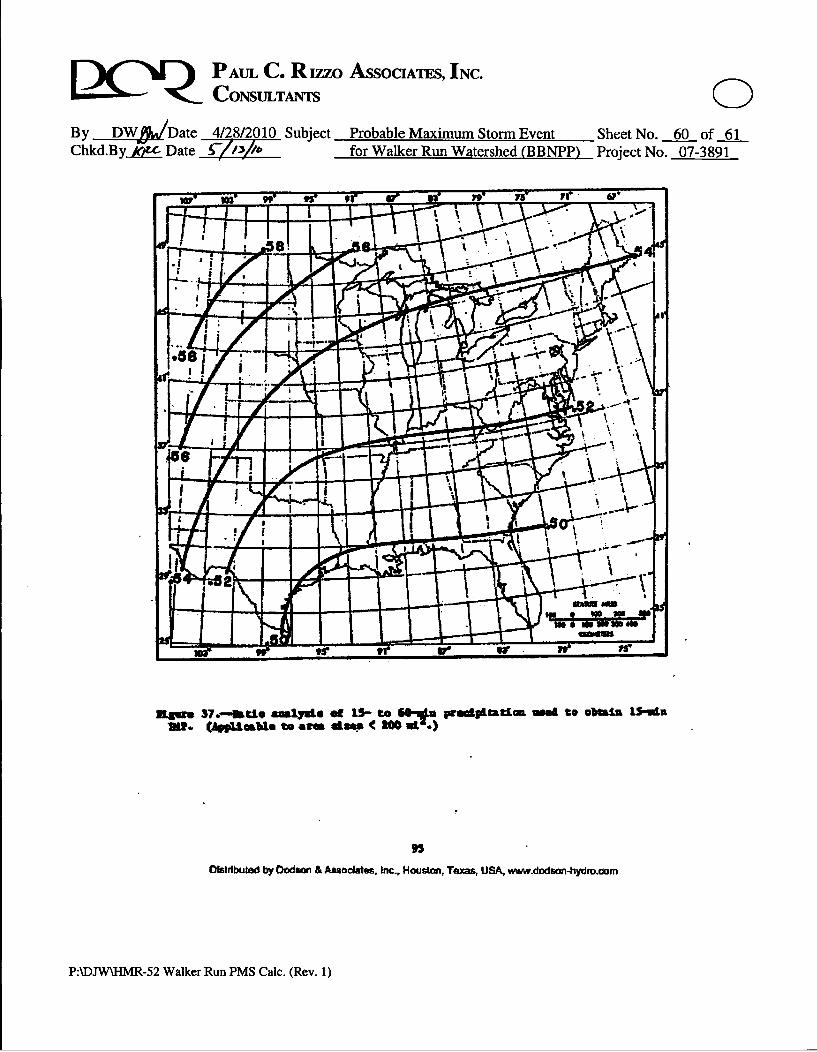
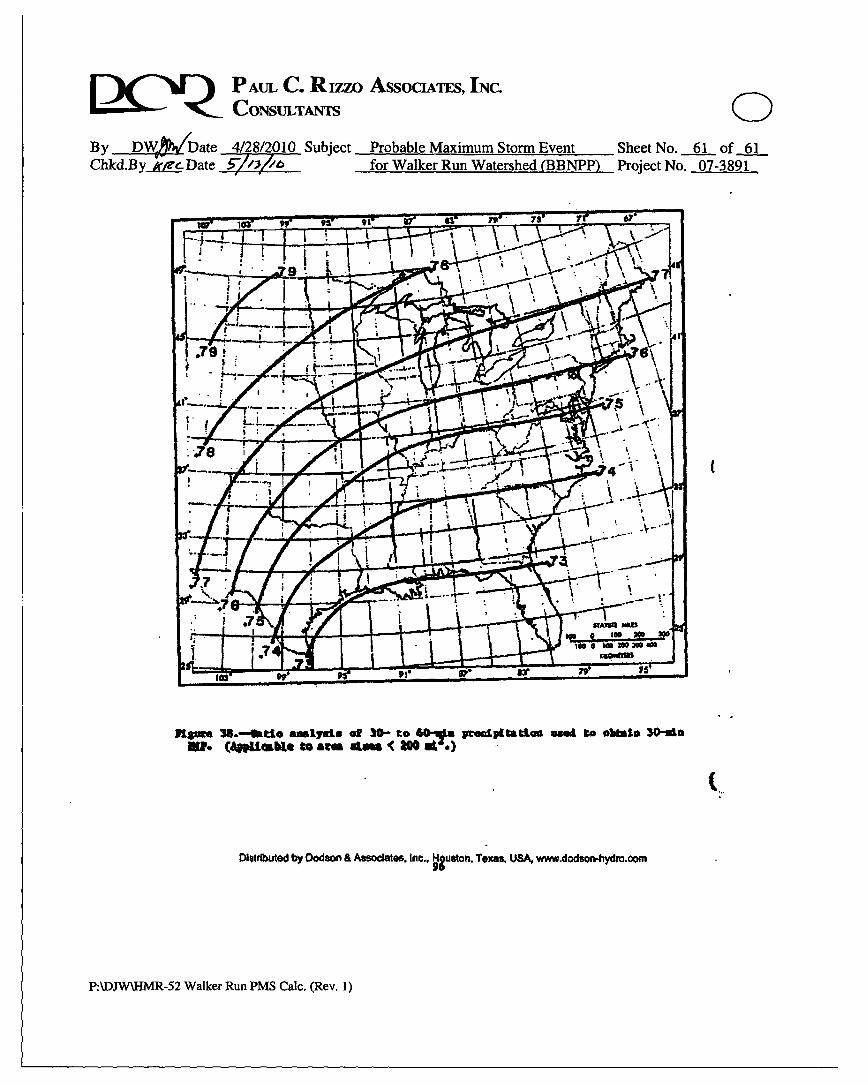
watershed, the cumulative storm hyetograph is generated simply by using ratio analysis toobtain the 5-minute, 15-minute, and 30-minute PMP (Figures 36, 37, and 38 in the HMR-52report, respectively) once the 1-hour PMP is determined (see Attachment E).
Calculation
*The PMS analysis of Walker Run watershed requires various types of input in order to beevaluated in the HMR-52 program. All inputs required to perform the Walker Runwatershed analysis will be presented first, followed by the 1-hour 1-mi2 PMP analysis.
Inputs for Walker Run PM[P Analysis
The PMP storm distribution is evaluated to determine the credible PMP storm distributionscapable of producing the maximum amount of direct runoff (or peak discharge) from thewatershed. The computer program HMR-52 is used to compute basin-average precipitationfor the PMS in accordance with the temporal and spatial storm patterns associated with thePMP estimates provided in the HMR-51 report.
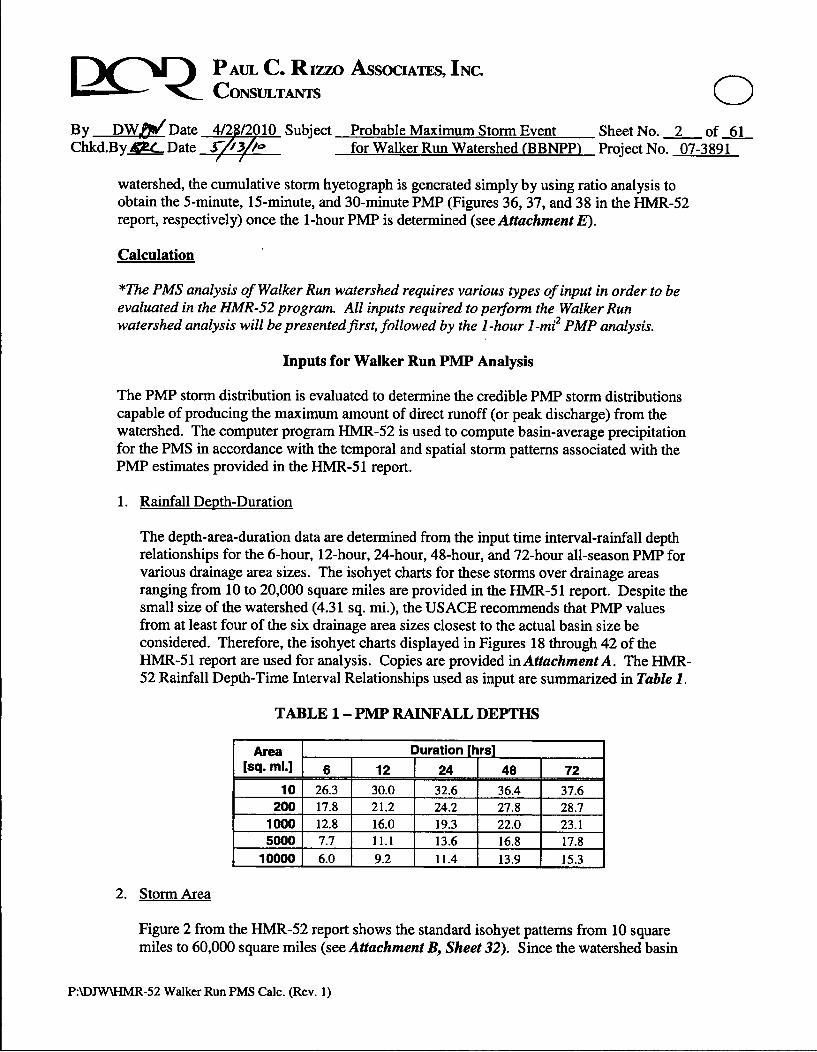
1. Rainfall Depth-Duration
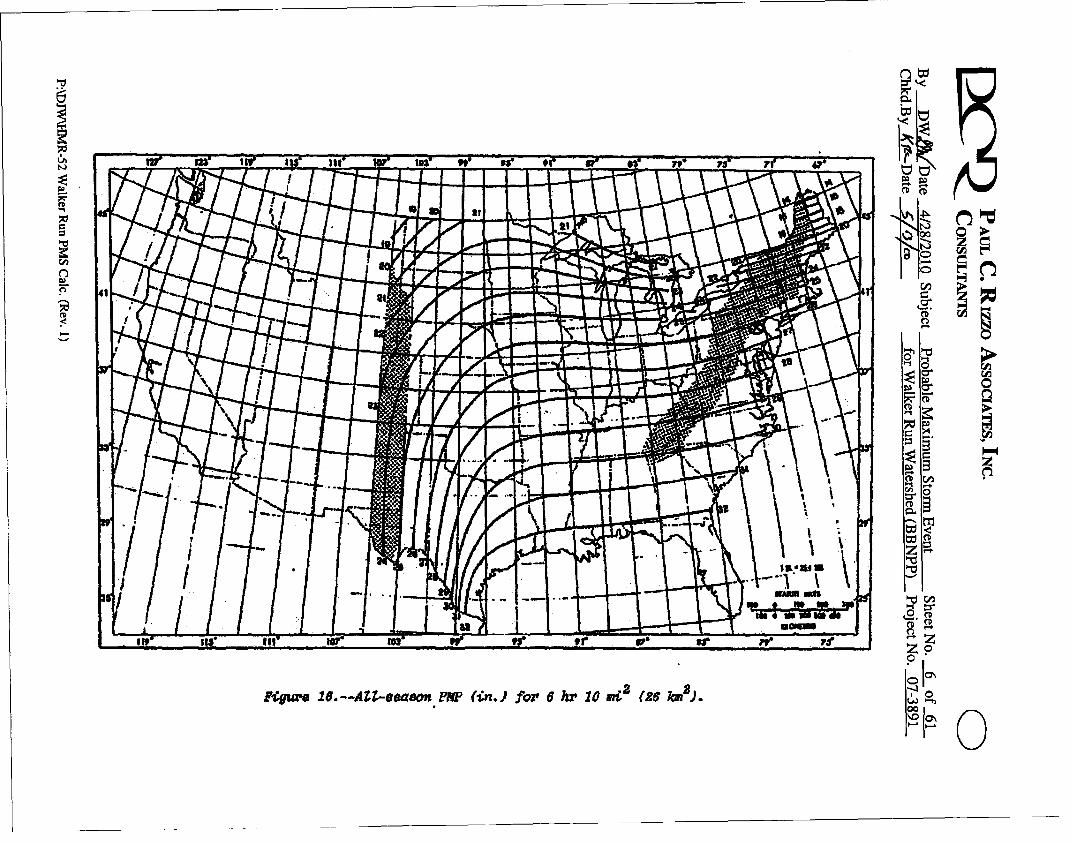
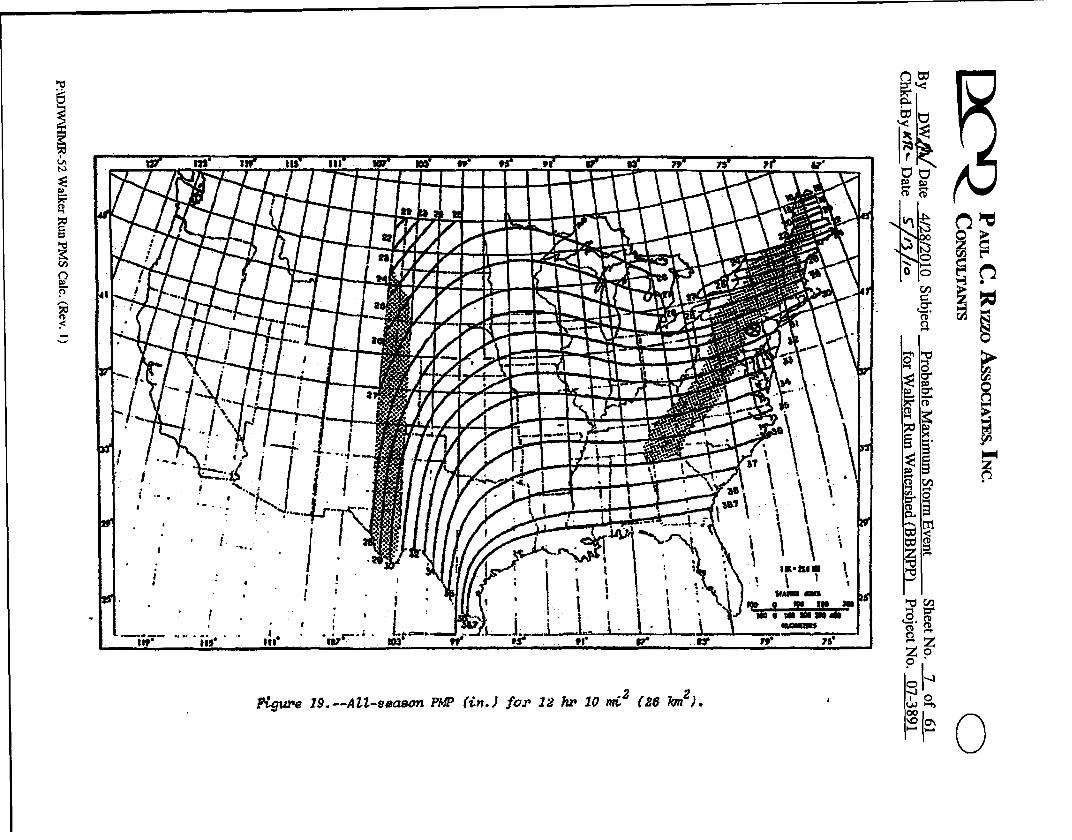
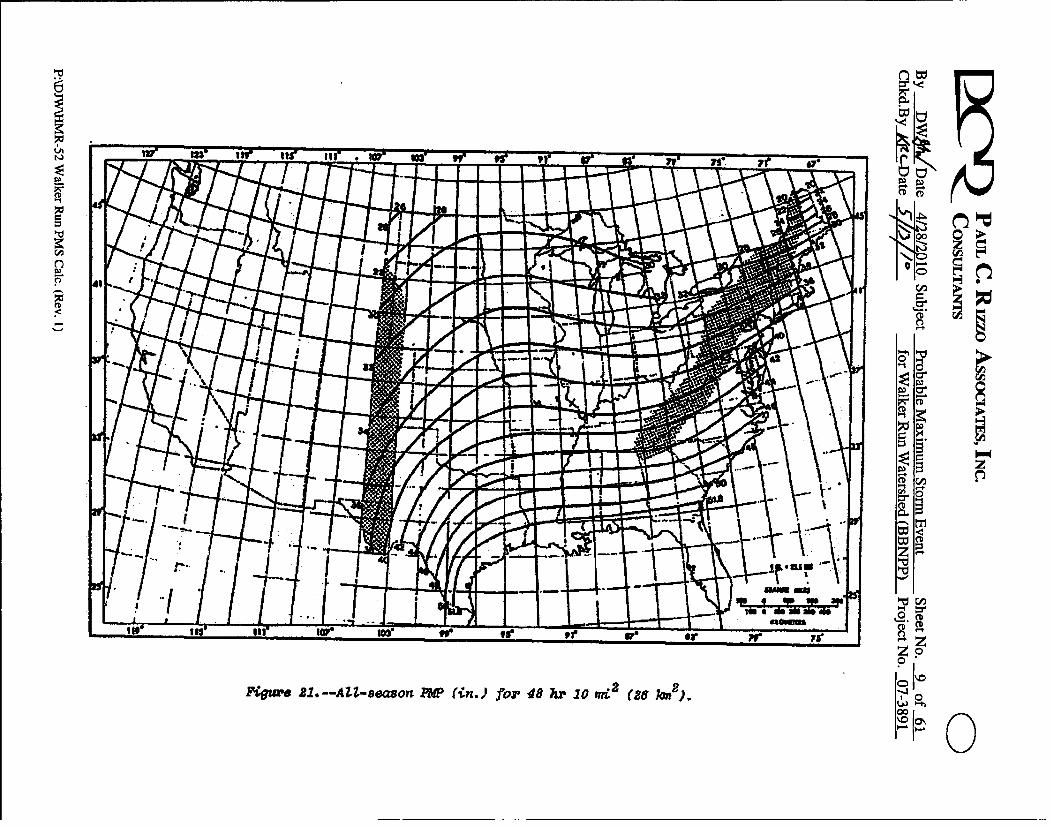
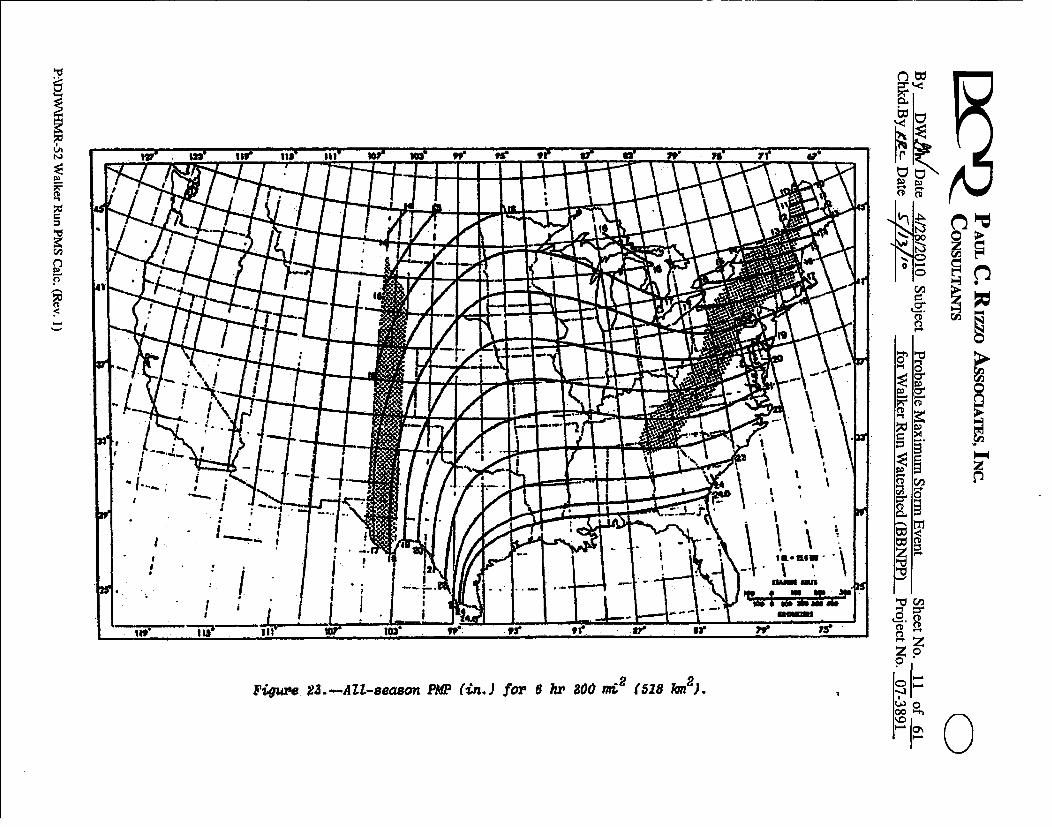
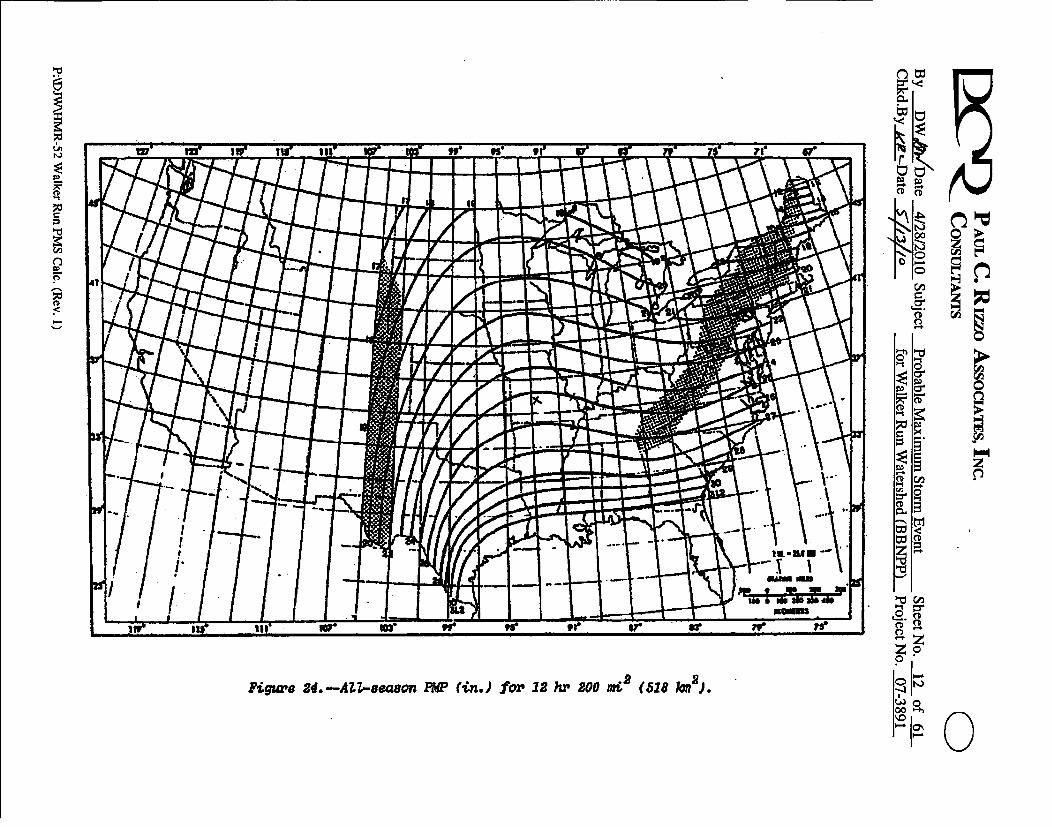
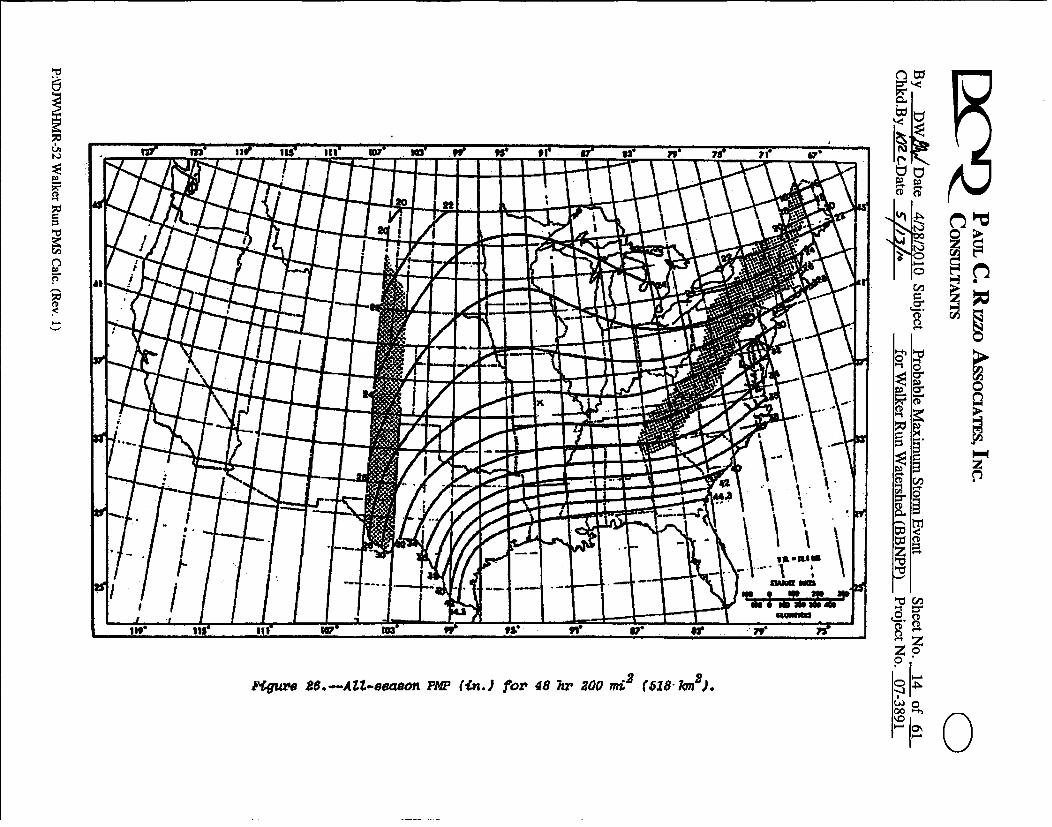
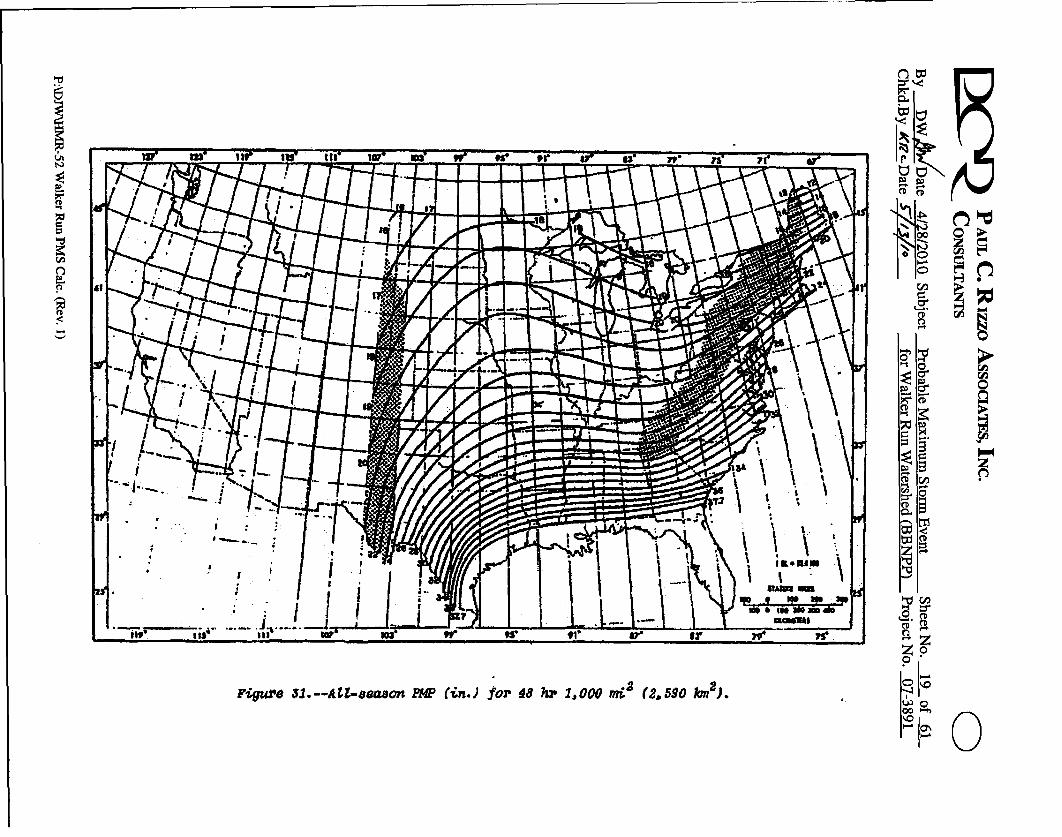
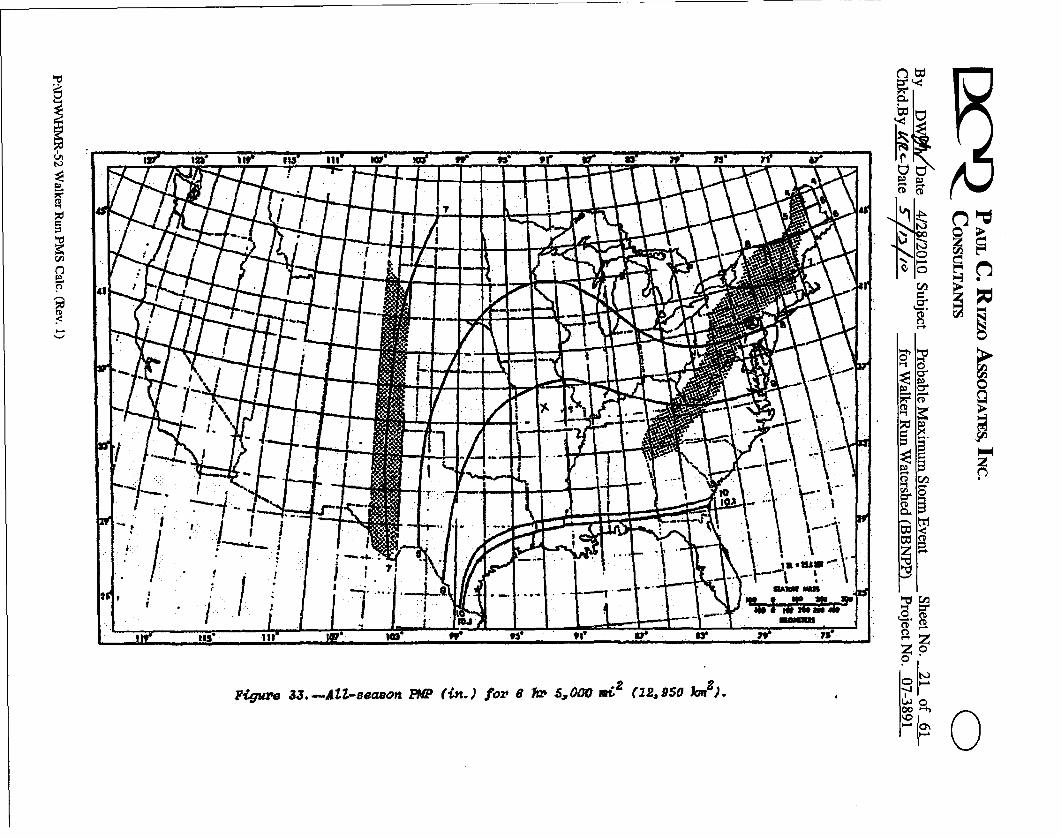
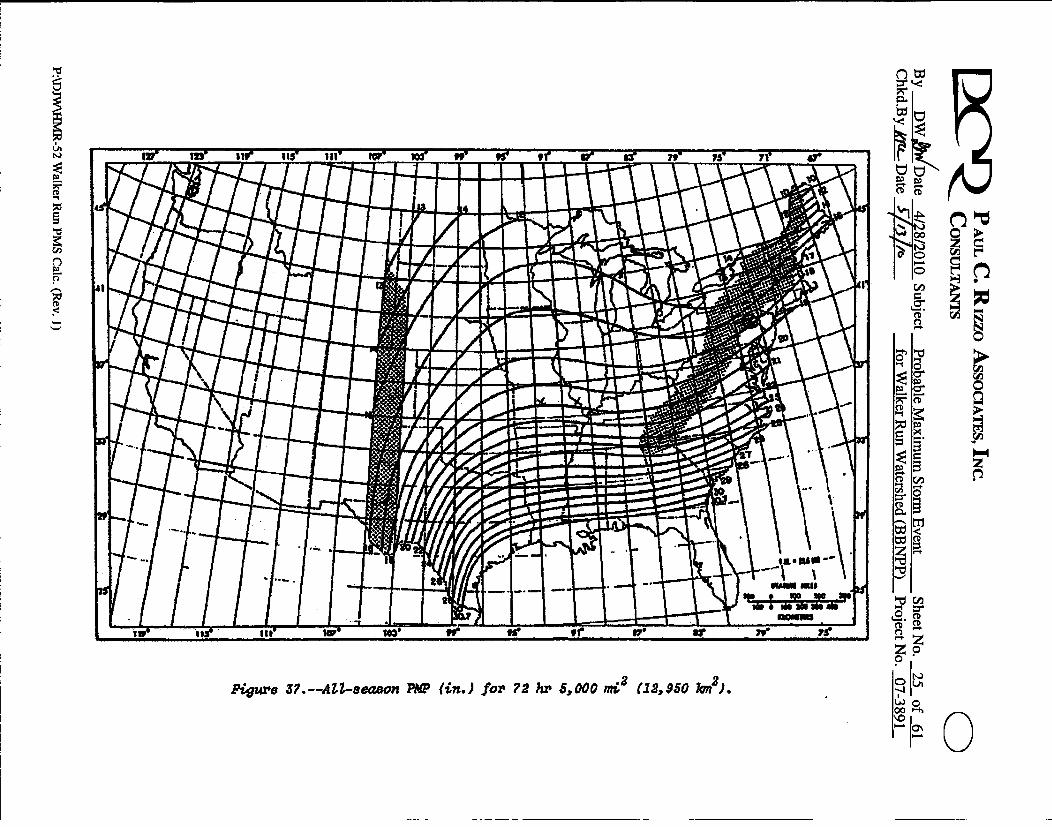
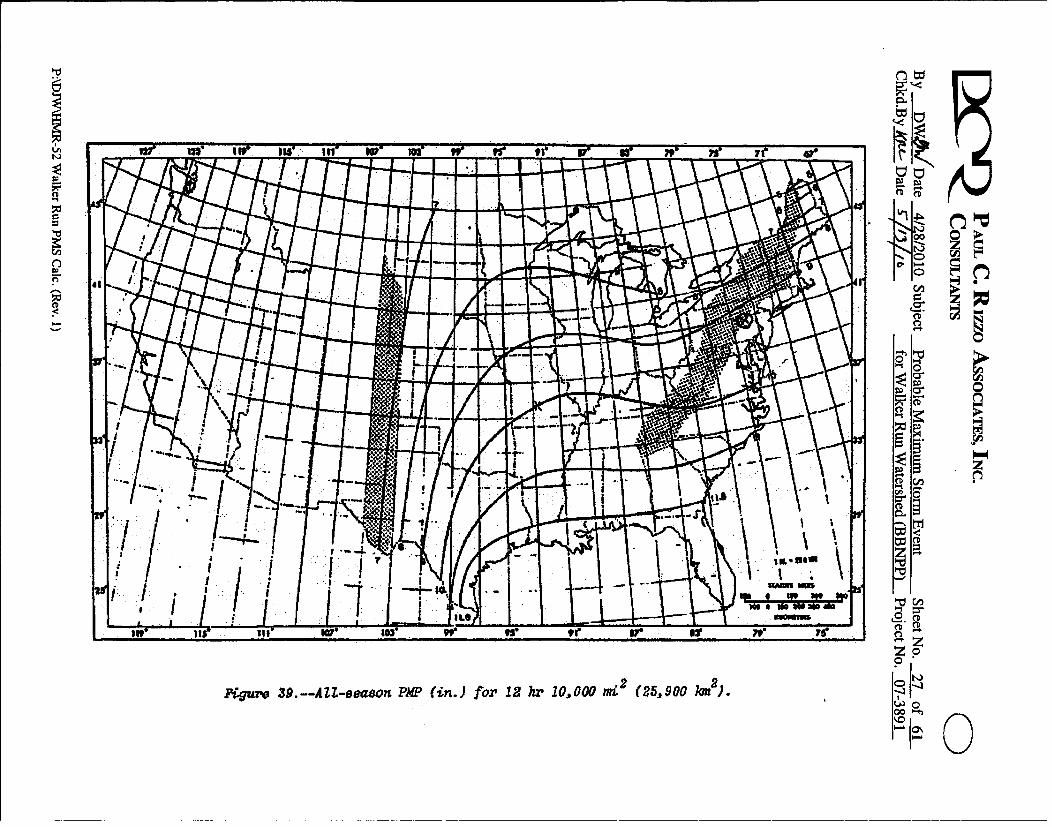
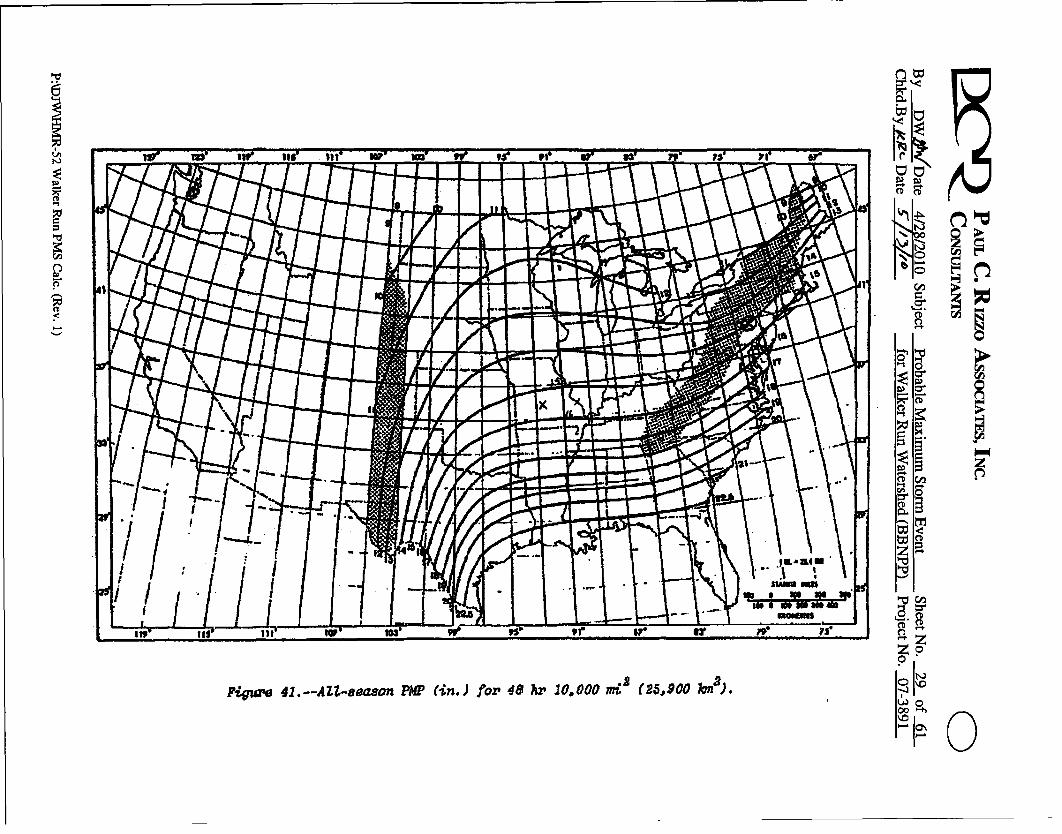
The depth-area-duration data are determined from the input time interval-rainfall depthrelationships for the 6-hour, 12-hour, 24-hour, 48-hour, and 72-hour all-season PMP forvarious drainage area sizes. The isohyet charts for these storms over drainage areasranging from 10 to 20,000 square miles are provided in the HMR-51 report. Despite thesmall size of the watershed (4.31 sq. mi.), the USACE recommends that PMP valuesfrom at least four of the six drainage area sizes closest to the actual basin size beconsidered. Therefore, the isohyet charts displayed in Figures 18 through 42 of theHMR-51 report are used for analysis. Copies are provided in Attachment A. The HMR-52 Rainfall Depth-Time Interval Relationships used as input are summarized in Table 1.
TABLE 1 - PMP RAINFALL DEPTHS
Area Duration [hrs][sq.mi.] 6 12 1 24 48 72
10 26.3 30.0 32.6 36.4 37.6200 17.8 21.2 24.2 27.8 28.7
1000 12.8 16.0 19.3 22.0 23.15000 7.7 11.1 13.6 16.8 17.8
10000 6.0 9.2 11.4 13.9 15.3
2. Storm Area
Figure 2 from the HMR-52 report shows the standard isohyet patterns from 10 squaremiles to 60,000 square miles (see Attachment B, Sheet 32). Since the watershed basin
PADJWU\HM-52 Walker Run PMS Calc. (Rev. 1)

L2 Q PAUL C. Rizzo AssocIAms, INC.CONSULTANTS QBy _DW. Date 4/28/2010 Subject Probable Maximum Storm Event Sheet No. 3 of 61Chkd.By Kit- Date-- 4/O for Walker Run Watershed (BBNPP) Project No. 07-3891
area (4.31 sq. mi.) is less than 10 square miles, only the 10-square mile PMP storm eventneeds to be considered. Therefore, larger storm areas are not considered in thisevaluation.
3. Storm Orientation
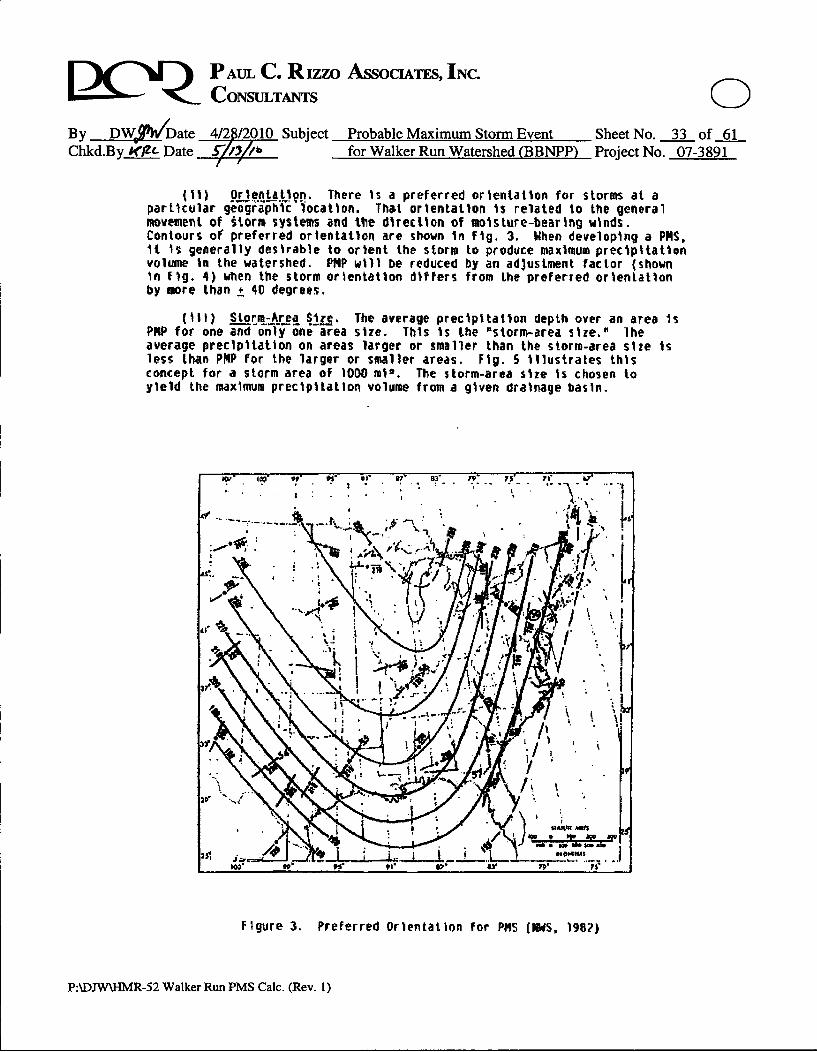
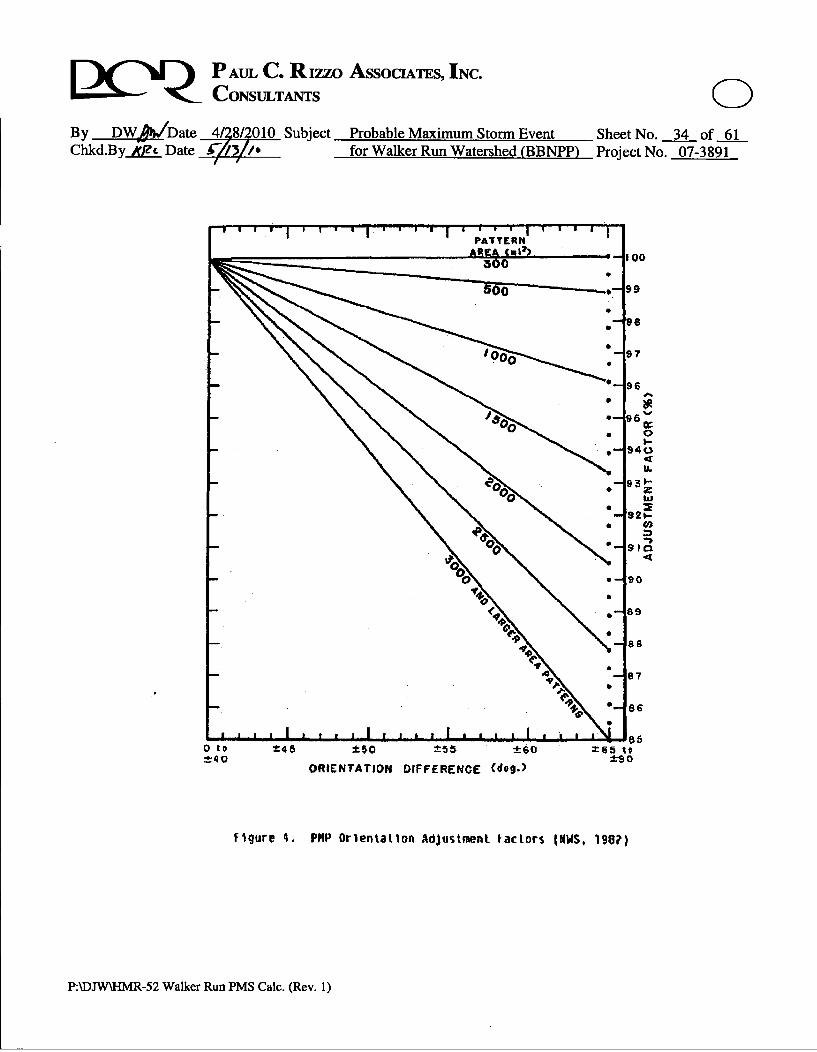
The storm orientation is determined from Figure 3 in the HMR-52 report (see Sheet 33).The storm orientation is approximately 204 degrees; however, due to the small size of thewatershed, the storm orientation will not influence the PMP calculation as shown inFigure 4 from the HMR-52 report (see Sheet 34).
4. Rainfall Duration Interval
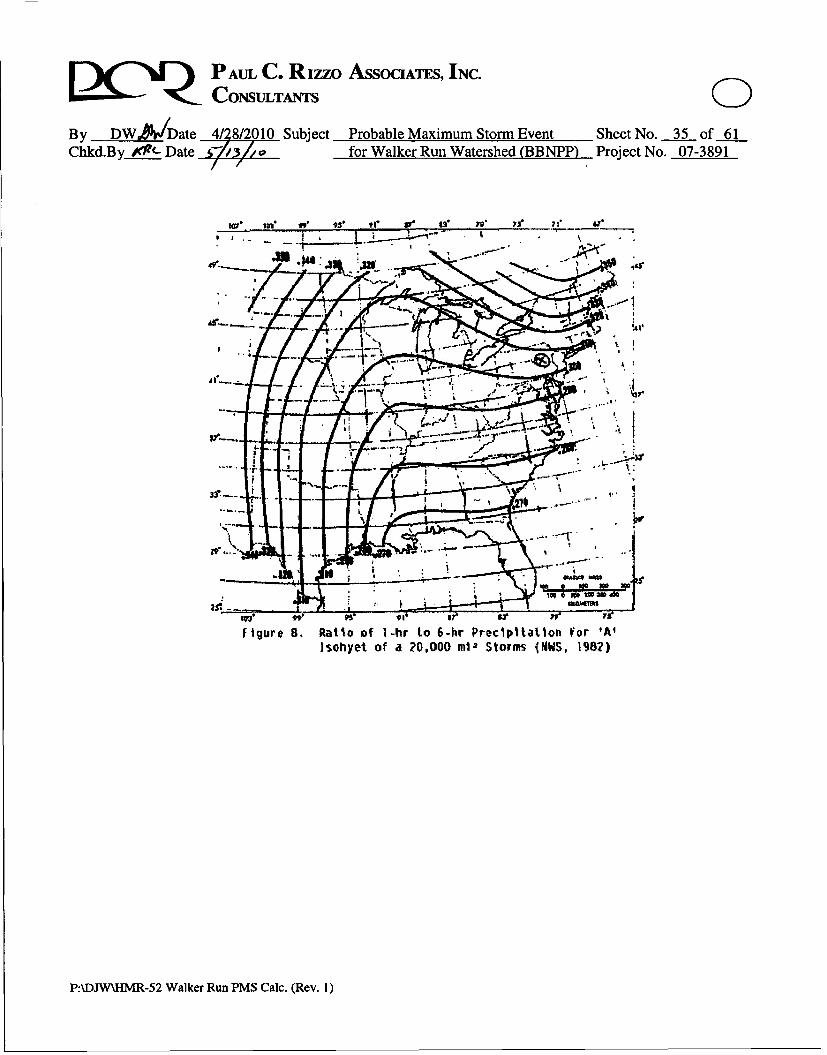
Since the runoff is relatively quick (short Time of Concentration, TJ), the 1-hour durationPMP is considered. The ratio of the 1-hour to 6-hour precipitation for isohyet 'A' isestimated to be 0.304 as determined from Figure 8 in the HMR-52 report (see Sheet 35).A time interval of 5 minutes was selected in estimating the rainfall distribution.
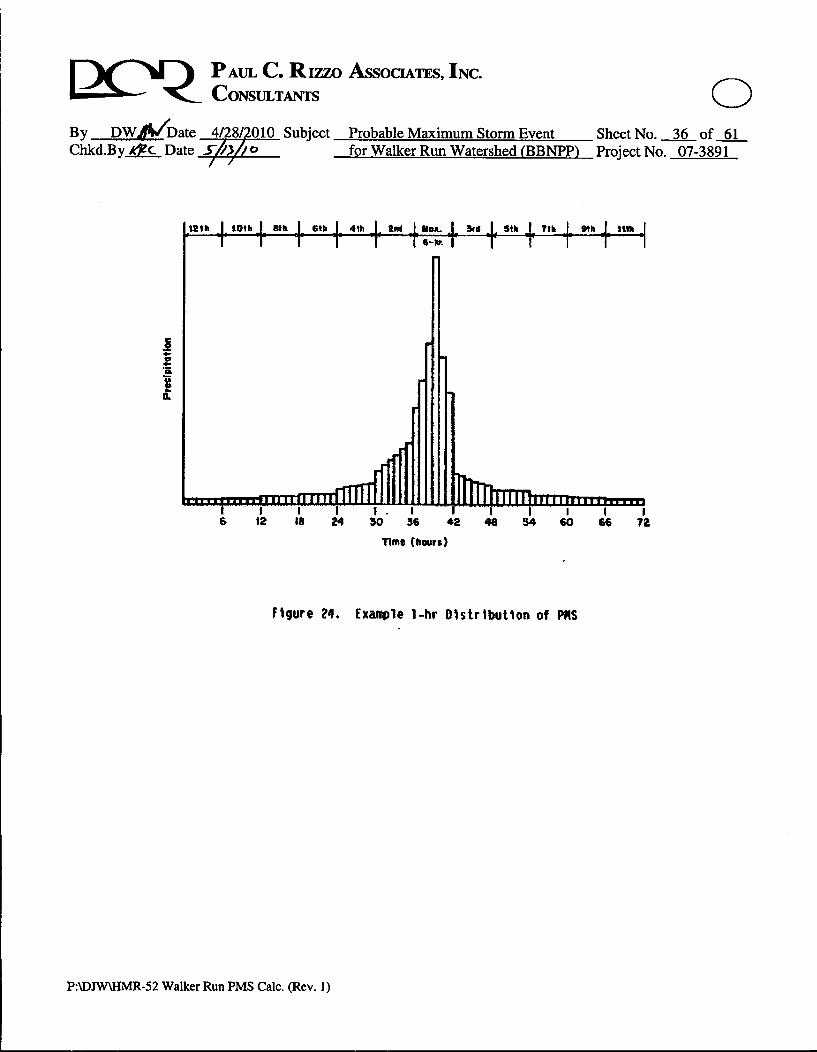
5. Hyetograph Shape / Depth-Duration Distribution
The default "time sequence to depth of rainfall" distribution was selected. Thisdistribution is shown on Figure 24 of the HMR-52 report (see Sheet 36).
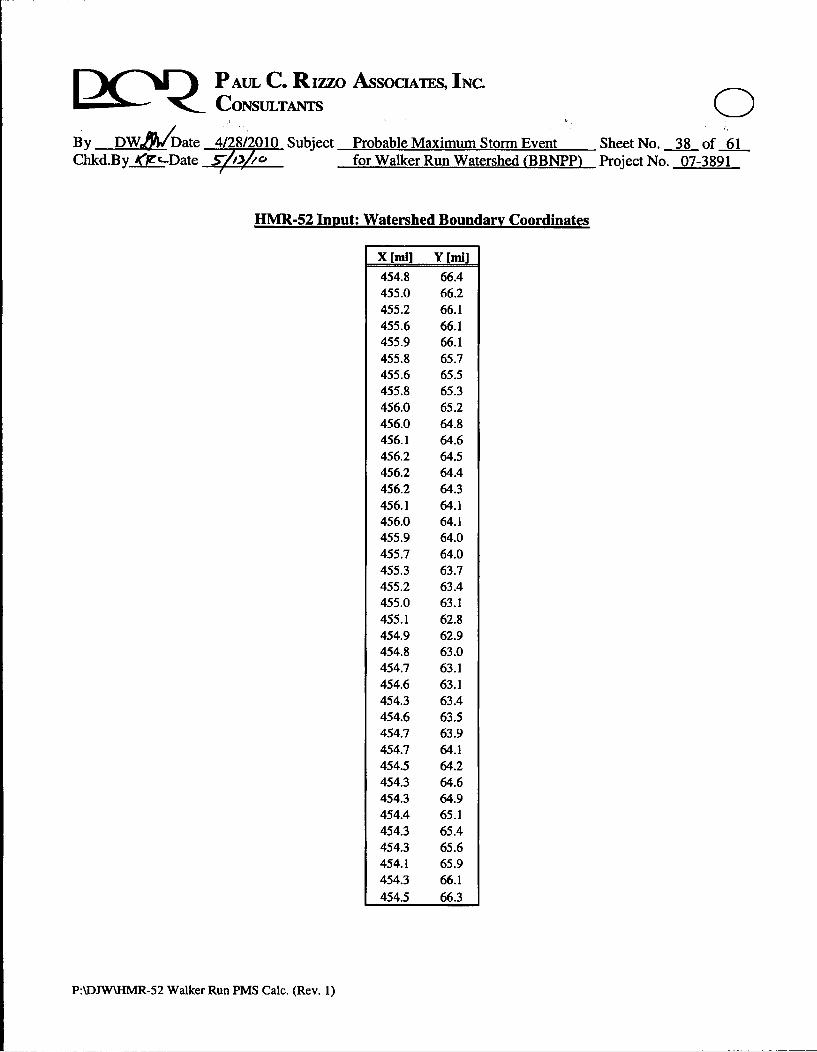
6. Watershed Basin Area
An approximate boundary of the subject watershed area is estimated by 39 points asshown on Sheet 38 in Attachment C. Selected boundary points were plotted inAutoCAD to verify that they generated an accurate representation of the watershed shapeand area. An AutoCAD plot layout displaying the approximated basin area and itsgeometric properties is shown on Sheet 39 in Attachment C, and a map showing theexact watershed delineation is displayed on Sheet 40 for comparison. Note that althoughthe approximated basin area that is used in the HMR-52 program differs slightly whencompared to the exact watershed delineation, the discrepancy does not affect the outputsince the Walker Run watershed is less than 10 square miles. The X and Y coordinatesare input into the HMR-52 program in inches from an arbitrary origin. The map scalefactor of 1-inch = 1.000 mile is also input into the program.
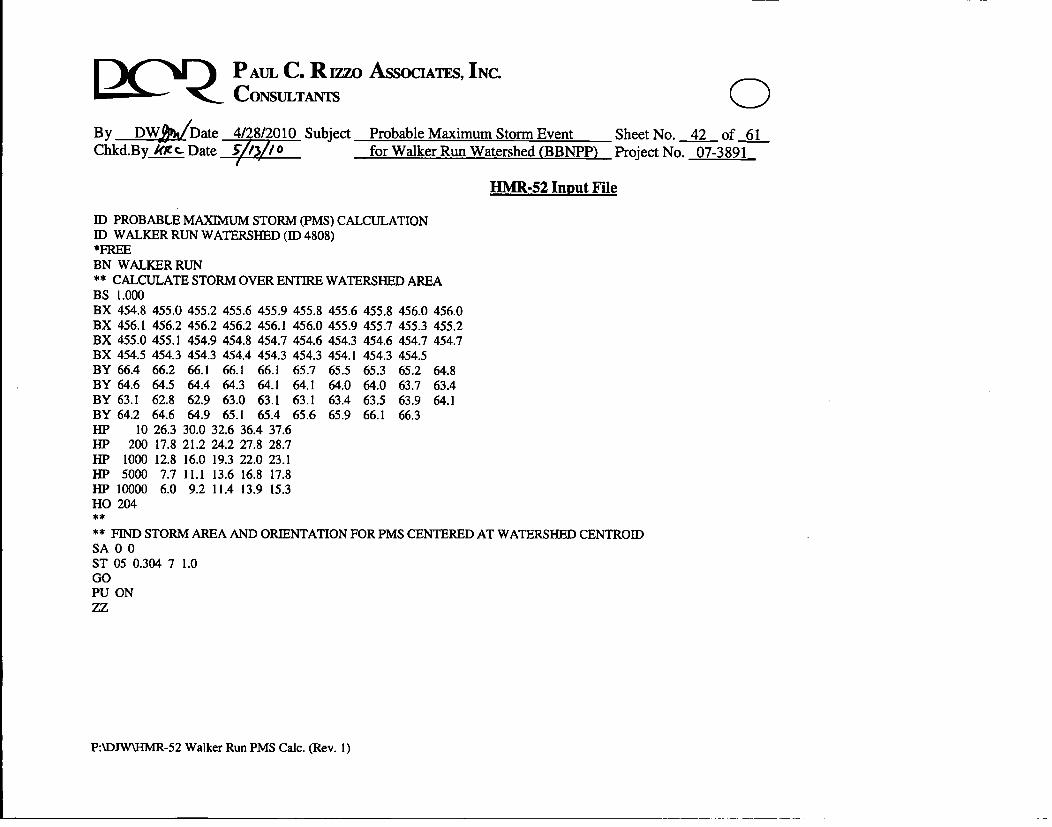
7. HMR-52 Program Execution
The information described above is input onto HMR-52 "Punch Cards." The input file isincluded in Attachment D. The PMS distribution is then computed.
P:\IDJWUIMR-52 Walker Run PMS Calc. (Rev. 1)
Q PAUL C. Rizzo AssocIATFs, INC.CONSULTANTS QBy DW.6Date 41Z8/2010 Subject Probable Maximum Storm Event Sheet No. 4 of 61Chkd.By.g_ C Date 5-//V1 0 for Walker Run Watershed (BBNPP) Project No. 07-3891
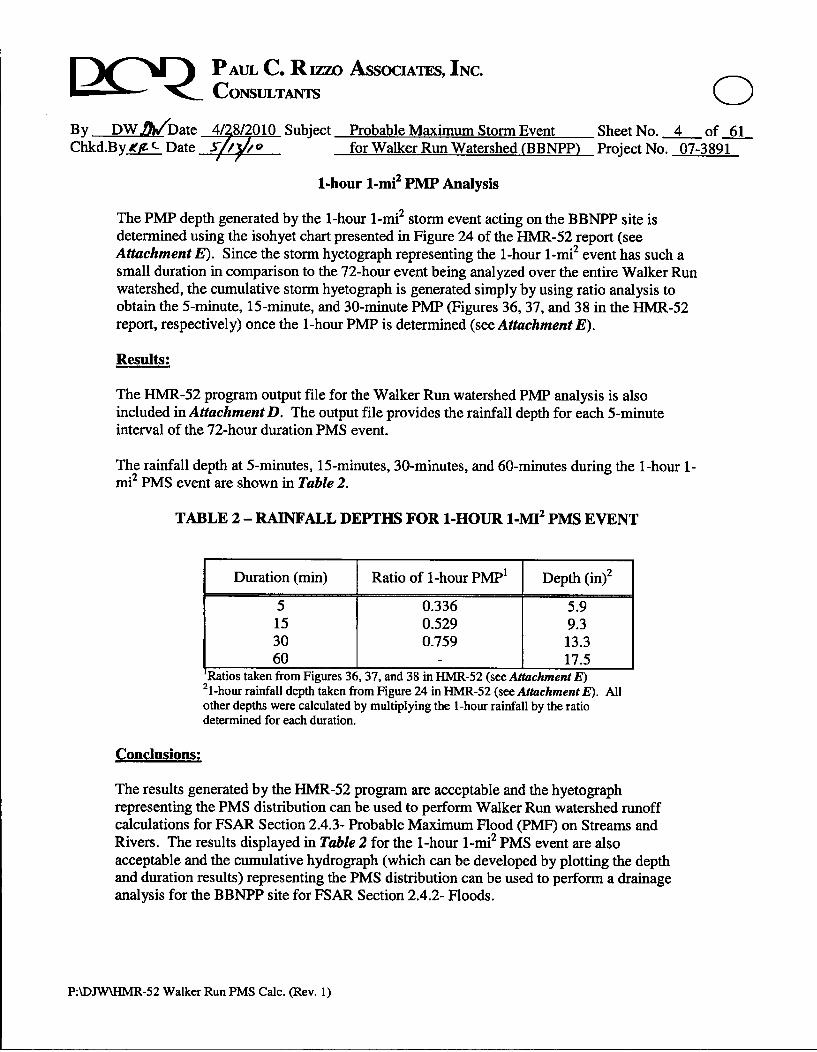
1-hour 1-mi 2 PMP Analysis
The PMP depth generated by the 1-hour 1-mi2 storm event acting on the BBNPP site isdetermined using the isohyet chart presented in Figure 24 of the HMR-52 report (seeAttachment E). Since the storm hyetograph representing the 1-hour 1-mi2 event has such asmall duration in comparison to the 72-hour event being analyzed over the entire Walker Runwatershed, the cumulative storm hyetograph is generated simply by using ratio analysis toobtain the 5-minute, 15-minute, and 30-minute PMP (Figures 36, 37, and 38 in the HMR-52report, respectively) once the 1-hour PMP is determined (see Attachment E).
Results:
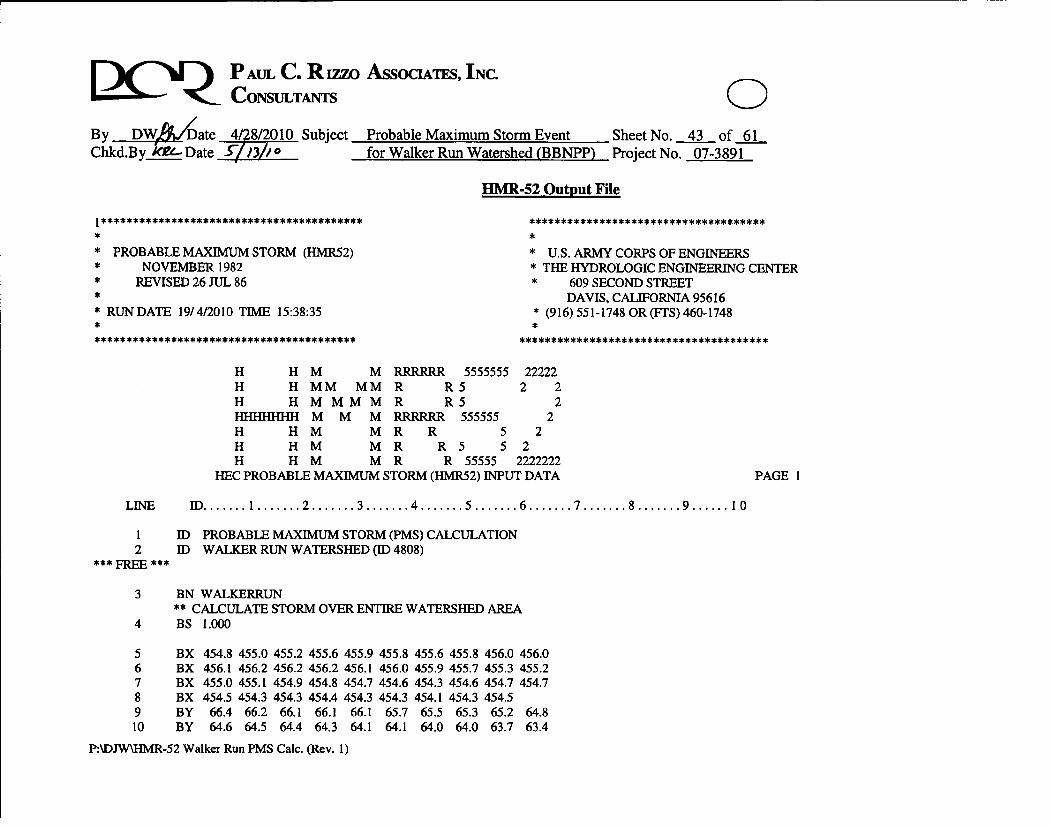
The HMR-52 program output file for the Walker Run watershed PMP analysis is alsoincluded in Attachment D. The output file provides the rainfall depth for each 5-minuteinterval of the 72-hour duration PMS event.
The rainfall depth at 5-minutes, 15-minutes, 30-minutes, and 60-minutes during the 1-hour 1-mi PMS event are shown in Table 2.
TABLE 2 - RAINFALL DEPTHS FOR 1-HOUR 1-MI2 PMS EVENT
Duration (min) ] Ratio of 1-hour PMP' Depth (in)2
5 0.336 5.915 0.529 9.330 0.759 13.360 17.5
Ratios taken from Figures 36, 37, and 38 in HMR-52 (see Attachment E)2 1-hour rainfall depth taken from Figure 24 in HMR-52 (see Attachment E). Allother depths were calculated by multiplying the 1-hour rainfall by the ratiodetermined for each duration.
Conclusions:
The results generated by the HMR-52 program are acceptable and the hyetographrepresenting the PMS distribution can be used to perform Walker Run watershed runoffcalculations for FSAR Section 2.4.3- Probable Maximum Flood (PMF) on Streams andRivers. The results displayed in Table 2 for the 1-hour 1-mi 2 PMS event are alsoacceptable and the cumulative hydrograph (which can be developed by plotting the depthand duration results) representing the PMS distribution can be used to perform a drainageanalysis for the BBNPP site for FSAR Section 2.4.2- Floods.
P:\DJWX\MR-52 Walker Run PMS Calc. (Rev. 1)
L•(Ž PAUL C. RIZZOCONSULTANTS
ASSOCIATES, INC.
By DW _ Date 4/28/2010 SubjectChkd.By _&r-- Date EL/,3/1r
Probable Maximum Storm Event.......
| ...... f
Probable Maximum Storm Eventfor Walker Run Watershed (BBNPP)
Sheet No. 5 of 61Project No. 07-3891
Attachment A
All-Season PMP Isohyet Charts- Eastern United States(Reference: HMR 51)
P:\DJW\E•ffR-52 Walker Run PMS Calc. (Rev. 1)
LAt-
;0
00
go
CD
n
0
Figw' 1O--AZZ-eeasotnIP (in.) for 6 hr 10 al 2 (26 AM$)
0
IV
0D
CD
00
CD
-t
00
Zo
-J"
>
0
PFiure 19.--Al,-aeaeon PMI (in.) for 12 hr 10 ri 2 (26 W).

C'DI
tz
CD
k0
z
0
CD-t
CD-I
CD
I
0~CD
~r1CD-t
Zo
0100
i:0
Ftgurze BO.-Al-aeaon PWM (in.) for 2d hr Z10 m (28 1cm).
0
I~.<
V~.1t~J
INJO
IgI~cd~
*1
0
o
I.
z
0~1
-t
-I
rb
"0
:71
zAp
.0
Figure 21.--Afl-aeaeon IW (in.) for 48 hu, 10 rd2(26 kin2).
0

o3
I,(j<
00;zCJ~
Cj)
zCD
CD
tz
0
~~10
0~0
~rj
Co' CD
w 0
00~
P-gw'.e ".--AZ"-eaVWon PW (in.) for,.- 72 hr .10' m (26 AWC .
0
-to
"0cI
00
I-I~0-I
0
0I-tU,
I-'0
0~
0
c-I
0
zm
0:Zo
.oc0Fip '. ,,.-AZL-aeason PW (in-.J for' 6 ,200 nOG 28 (528 km-*).
-~t
CD
CD CD
t0
0 -
CDR
0I-I
CD-l
CD
CD
I-t0
0~CD
CD
0
0,-zo
0
Figure 24.-A-A.-eaeon PWP (in.) for 12 hr 200 ILA (528 la.nJ.

I•L
0d
100
0
.o"
o
-tIt•r
0 -+
0c-t
0z00
0
Figure 2S.--AZZ-ameaon PMP (in.) for a4 hn' 200 nd 2 (518 ;"n2 ).
I=<1
,0
n tz
t:u
CD
Oo
0
0
0
w 0CcI-t
o
0
z
2S.--AUZ-seao, Pff (in.) for 48 hr 200 Md.O (618 km 2).
0

IA
Wj
0-)
RL
1tIIIk4N
Pq C- -
M.
CD
Zo
0 D
S0
C
z.
04
Figre 87.--AU-eeaoon2 PF r(in.) for 72 hr 200 ptc,2 (518 ou a)..

Ieb-t
0
rtw
4z cit
o
z
0-l
~1
~1
0v
0~
CDl
ZoZ
Figure 8.--AZ-oeason PM (in.) for 16 hi 1,000 mi.2 (2, 590 km a).
0

IC,,
0
CD
00
1o)02
0
U)
to <OOz
rEi-ur a 2O.AZ-season PM (in.) for 12 hr 2,000 mid (2, 590 ktn2 ).
0

I-t
C,,
CDC
k.7't
-t
-t
4d
II
~10
tllrb
0
zz•
Z p
00~*
PFiure 30.-AZI-A.a,,emon FP (in.) fo.r E4 h2% 1,000 ri (2,590 kAAn).
" li in. tit' ow.
000e
.. 4
•- I • g
'CDN6 I
ZP
Figue 3.--~t-eaeo PM (i.) fov 8 P' 1000m~A 8~ 90 m2)to-q

ILu
CD
Cd~
0
CD
CDr
(1)
0
>
CD
~ID
Fgiwe 32.--AlZ-seaaon FP (in.) for 73 hr 1,000 m2 (2,590 OOkn),
0C•zZo
tj3.oo-
00
0
I~1
C)
0 r-ri0cdI)
0'-1
0
0-l
00~
0
0I0
~cab
00
z~o
.ooFigur. 33.-AZZ-aeason PUP (in.) for. 6 ha 5,000 e (2.S50 IA).

00r)
CD
0
z
ozo
4 :
00Figure 34.-.Alt-season PW'1 (in.) for 12 hr~ 5 000011 (12,950 kv2 2).
0

CD CDCD
1w~~%NvrO~
CD
0
0
EmCD
-t
"*1
tz
4
0CD0
I'D
CD
z9
NIS"w' 3S.--AZ-saeaon PM' (in.) for 24 hr 6GsOOO nri (12,050 k"n2 ).WJ~ 0
0

I(b
cj~
0
CD CD
0~
z
CD
CDCI
CD
all
009
MD
Figure 36.--Al1ý-8asasn PM? 4in.) for 48 hr. 5.,000 nri (12, 950W )
CD0
k)00C.,l*
0
Io-i
i30"
10
IND
-l
-t00~
0
'1
0
zm
0Zo
0cPiom 3?.--A-aeaon PAP (in.) for ?72 hu S,000 mi (2,2,950 ;*2).

I-tc~w
N~I~[n~0
0
CD
0v
0
0
0
0
S000'*
Figue 38.--AZl-e ,mon PP (in.) for' 5 1 10,000 ot (285,00 A=n2 ).
I•-I
C,,
C-,
<
I-..
I-.
CD
0
CD
CD
't1
tz
0
CD,
102
Zo
00Fguzre 39.--AZZ-aeaeon PMP (in.) for 12 hr 10,000 mi2 (25,900 kin2).
0

I:0
0
0D
CD
:L
0
:TI
Rr
Zo0*
LON
Figure O.-AUZ-smon FW (in.) for 24 hr 10,000 al (86, o0 kms).
0
ICD-t
0
CD
IjIo[,<
I,Ip
It'
ir.C-D
Zo
S0
0o-
0z
z
Figure 41.--AZZ-.aeason Ptd (in.) for 48 hr 10O000 ia (25.,900 k=2).
0

Itb-I
tb 001
0I-t
I-IU,
-t0
0
LZ0
ZO
Lo0Figwe E2.-AZZ-,eason P31 (in.) for 78 hr .0,o00o a,8 (88., 900 •)
•Q PAUL C. RizzoCONSULTANTS
ASSOCIATES, INC.
By _ DWj• Date 4/28/2010 SubjectChkd.By_!K/"--Date "31"
Probable Maximum Storm Eventfor Walker Run Watershed (BBNPP)
Sheet No. 31 of 61Project No. 07-3891I
IAttachment B
Referenced Excerpts, Tables, Figures, and Chartsfrom HMR 51 and HMR 52
P:\DJW\HMR-52 Walker Run PMS Calc. (Rev. 1)

ŽQQ PAUL C. Rizzo AssocImS, INC.CONSULTANTS QBy DWy Dtate 4/28/2010 Subject Probable Maximum Storm Event Sheet No. 32 of 61Chkd.Byft, RL Date g/t11/!1 for Walker Run Watershed (BBNPP) Project No. 07-3891
Sectlon 2
PRDBAII F MAXIMUM SlORH ANALYSIS PROCEDURf
2.1 Probable Maximum Prec ijj .•e .t tat ion Definition
Probable Maximum Precipitation (PMP) is theoretically the greatest depthof precipitation for a given duration that is physically possible over a givensize storm area at a particular geographical location at a certain time of theyear. Hydrometeorological Report No. 51 {HMR No. 51) contains generalized(for any storm area) all-season estimates of PNP for the United States, eastof the 105th meridian. Fig. 1.
?. !Probable Maximum Storm Definition
Probable Maximum Storm (PIS) is a hypothetical storm which produces theProbable Maximum flood from a particular drainage basin. HydrometeorologicalReport No. 52 (HtMR No. 52) provides criteria and step-by-step instructions forconfiguring a PHS using PMP estimates from HMR No. 51. Key concepts uponwhich the procedures in NHM No. 52 are based are as follows.
2.2.1 Spatial Distribution
The spatial distribution of the PWP Is governed by prIncipals describedunder four headings: isohyetal shape, orientation, storm-area size, andspatial variability.
(1) Isohy tal .shape. The PMS Is represented by elliptical Isohyets,each of which has a ratio of major axis to minor axis of 2.5 to 1. Standardellipses have been established containing areas from 10 to 60,000 m.1(fig. 2).
figure 2. Standard Isohyetal Pattern (PWS, 198)
PADJWU\IM-52 Walker Run PMS Calc. (Rev. 1)
Dcla
PAUL C. Rizzo AssociATEs, INC.CONSULTANTS 0
By DW.X Date 4/28/2010 Subject Probable Maximum Storm Event Sheet No. 33 of 61Chkd.By.Kl',Zt Date &/J3/t. for Walker Run Watershed (BBNPP) Project No. 07-3891
(fil Or ient._atn. There Is a preferred orientation for storms at aparticular geographic location. That orientation is related to the generalmovement of tiorm systems and tte direction of misture-bearing winds.Contours of preferred orientation are shown in Fig. 3. When developing a PHS,it Is generally desirable to orient the storm to produce maximum precipitationvolume In the watershed. PuP will be reduced by an adjustment factor (shownIn Fig. 4) when the storm orientation differs from the preferred orientationby more than ± 40 degrees.
(ill) Storm-Area Size. The average precipitation depth over an area IsPlP for one and only one area size. This is the "storm-area size," 1heaverage precipitation on areas larger or smaller than the storm-area size isless than PMP for the larger or smaller areas. Fig. S illustrates thisconcept for a storm area of 1000 mi*. The storm-area size Is chosen toyield the maximum precipitation volume from a given drainage basin.
Figure 3. Preferred Orientation for PMS [N15S, 198?)
P:ADJWIMR-52 Walker Run PMS Calc. (Rev. 1)
PC4ý?-PAUL C. Rizzo ASSOCIATES, INC.
CONSULTANTS 0By DW_ /Date 4/28/2010 Subject Probable Maximum Storm Event Sheet No. 34 of 61Chkd.By J[j Date FA3L// for Walker Run Watershed (BBNPP) Project No. 07-3891
=65 tot-9 0
ORIENTATION DIFFERENCE C4eg.)
F~gure 4. PMP Orientation Adjustment tactors (NWS, 198?)
P:\DJWUHMR-52 Walker Run PMS Calc. (Rev. 1)
C Q P AUL C. Rizzo ASSOCIATES, INC.CONSULTANTS 0By DWA/Date 4/28/2010 SubjectChkd.By ,•jlC Date z
Probable Maximum Storm Eventfor..W.lk.r.Run..Wa.er.hed (B......
Sheet No. 35 of 61Project No. 07-3891
for Walker Run Watershed (BBNPP)
Kw . we ve VC e s. 79 7s* 11* 47I -
Figure S. Ratio of 1-hr to 6-hr Precipitation for 'A'lsohyet of a 20,000 m12 Storms (MWS, 1982)
P:\DJWNHMR-52 Walker Run PMS Calc. (Rev. 1)
[ Ž PAUL C. RizzoCONSULTANTS
ASSOCIATES, INC.
By_ DWfl'Date 4/28/2010 SubjectChkd.By__ec Date V3he
.tlb ].-too,h _ wh r th.
- - - - 1
0I
Probable Maximum Storm EventProbable Maximum Storm Eventfor Walker Run Watershed (BBNPP)
Sheet No. 36 of 61Project No. 07-3891
for Walker Run Watershed (BBNP
D 36 42 48
Time (tourg)
Figure 24. Example 1-hr Distribution of PMS
P:\DJWJiMR-52 Walker Run PMS Calc. (Rev. 1)

[ ) PAUL C. RizzoCONSULTANTS
ASSOCIATES, INC.
By DWA/Date 4/28/2010 SubjectChkd.By &4"L Date I-//3//
Probable Maximum Storm Eventfor Walker Run Watershed (BBNPP)
Sheet No. 37 of 61Project No. 07-3891
Attachment C
Watershed Basin Maps
P:\DJW\HMR-52 Walker Run PMS Calc. (Rev. 1)
[ŽQQ P AUL C. Rizzo ASSOCIATES, INC.CONSULTANTS 0By DWyhV/Date 4/28/2010 Subject Probable Maximum Storm Event Sheet No. 38 of 61Chkd.By! --Date .. / I c! for Walker Run Watershed (BBNPP) Project No. 07-3891
HMR-52 Input: Watershed Boundary Coordinates
P:\DJ\HMR-52 Walker Run PMS Calc. (Rev. 1)

~CQ PAULC Ruzzo Assocunms, INC.COSULTANS 0By.._WjWDatc •M1 Subject Pbxmtble maximm Starm Eve Sheet No. 40 of 61Chkd.By C'Jt. Date A forWAukerRunWAtenh& (BBNPPM ProjectNo. 07-3891
P:ADJWYAR-52 Wuaw Ram PMS CRIC. (Rev. 1)

2c-%QPAUL C. Rizzo AssociATs, INC.CONSULTANTS
By __D {Date 4128/2010 Subject Probable Maximum Storm EventChkd.By. i(''- Date V/ for Walker Run Watershed (BBNPP)
0Sheet No. 41 of 61Project No. 07-3891
Attachment D
HMR 52 Input/Output Files
PADJW\BHM-52 Walker Run PMS Calc. (Rev. 1)
PAUL C. Rizzo ASSOCIATES, INC.CONSULTANTS 0
By DW_/Date 4/28/2010 SubjectChkd.Bykic.- Date jIZK! Z
Probable Maximum Storm Eventfor Walker Run Watershed (BBNPP)
Sheet No. 42 of 61Project No. 07-3891I I
HMR-52 Input File
ID PROBABLE MAXIMUM STORM (PMS) CALCULATIONID WALKER RUN WATERSHED (ID 4808)*FREEBN WALKER RUN** CALCULATE STORM OVER ENTIRE WATERSHED AREABS 1.000BXBXBXBXBYBYBYBYHPHPHPH-P
HPHO
454.8 455.0 455.2456.1 456.2 456.2455.0 455.1 454.9454.5 454.3 454.366.4 66.2 66.164.6 64.5 64.463.1 62.8 62.964.2 64.6 64.9
455.6456.2454.8454.466.164.363.065.1
455.9 455.8 455.6456.1 456.0 455.9454.7 454.6 454.3454.3 454.3 454.166.1 65.7 65.564.1 64.1 64.063.1 63.1 63.465.4 65.6 65.9
455.8455.7454.6454.365.364.063.566.1
456.0 456.0455.3 455.2454.7 454.7454.565.2 64.863.7 63.463.9 64.166.3
10200
10005000
10000204
26.317.812.87.76.0
30.0 32.621.2 24.216.0 19.311.1 13.69.2 11.4
36.4 37.627.8 28.722.0 23.116.8 17.813.9 15.3
** FIND STORM AREA AND ORIENTATION FOR PMS CENTERED AT WATERSHED CENTROIDSA 0 0ST 05 0.304 7 1.0GOPU ONZZ
P:\DJW\HMR-52 Walker Run PMS Calc. (Rev. 1)
DC`-ý PAUL C. Rizzo AssocATms, INC.CONSULTANTS 0
By DW ate 4/28/2010 SubjectChkd.By.kf'-Date £/0,//o
Probable Maximum Storm Eventfor Walker Run Watershed (BBNPP) E
Sheet No. 43 of 61Project No. 07-3891
HMR-52 Output File
* PROBABLE MAXIMUM STORM (HMR52)* NOVEMBER 1982* REVISED 26 JUL 86
* RUNDATE 19/4/2010 TIME 15:38:35*
** ***** ** **** ** *** **** ***** *** *** ****
** ** **** ** *** *** *** ** **** *** *** ******
* U.S. ARMY CORPS OF ENGINEERS* THE HYDROLOGIC ENGINEERING CENTER* 609 SECOND STREET
DAVIS, CALIFORNIA 95616* (916) 551-1748 OR (FITS) 460-1748
***** ******* *** ***•****** **** ***** ** **
H H M M RRRRRR 5555555 22222H H MM MM R R5 2 2H H M M M M R R5 2HHHHHHH M M M RRRRRR 555555 2H H M M R R 5 2H H M M R R 5 5 2H H M M R R 55555 2222222
HEC PROBABLE MAXIMUM STORM (HMR52) INPUT DATA
LINE ED ....... 1 ....... 2 ....... 3 ....... 4 ....... 5 ....... 6 ....... 7 ....... 8 ....... 9 ...... 10
PAGE 1
12
*** FREE ***
ID PROBABLE MAXIMUM STORM (PMS) CALCULATIONID WALKER RUN WATERSHED (ID 4808)
3 BN WALKERRUN** CALCULATE STORM OVER ENTIRE WATERSHED AREA
4 BS 1.000
5678910
BXBXBXBXBYBY
454.8 455.0 455.2 455.6 455.9 455.8456.1 456.2 456.2 456.2 456.1 456.0455.0 455.1 454.9 454.8 454.7 454.6454.5 454.3 454.3 454.4 454.3 454.3
66.4 66.2 66.1 66.1 66.1 65.764.6 64.5 64.4 64.3 64.1 64.1
455.6 455.8 456.0455.9 455.7 455.3454.3 454.6 454.7454.1 454.3 454.5
65.5 65.3 65.264.0 64.0 63.7
456.0455.2454.7
64.863.4
PADJWUIMR-52 Walker Run PMS Calc. (Rev. 1)
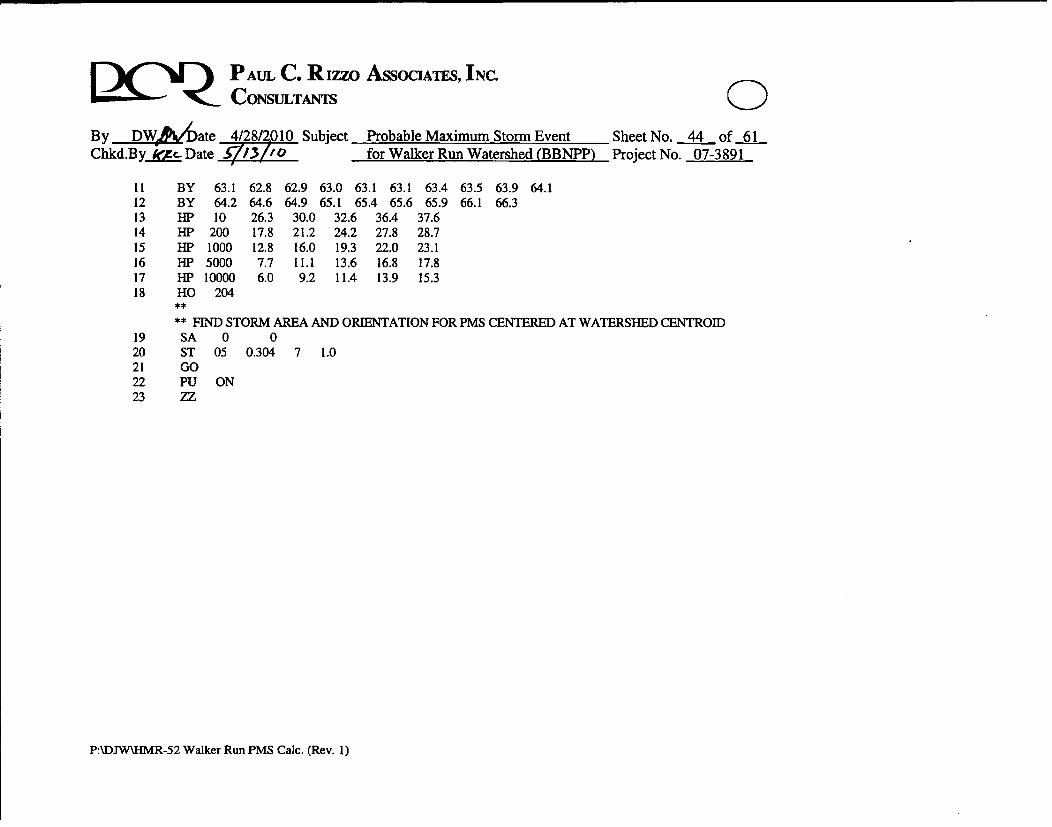
C Q PAUL C. Rizzo ASSOCIATES, INC.CONSULTANTS 0By DW,4 )ate 4/28/2010 Subject Probable Maximum Storm Event Sheet No. 44 of 61Chkd.By_ 5• Date .,i/3i/Z o for Walker Run Watershed (BBNPP) Project No. 07-3891
1112131415161718
1920212223
BY 63.1 62.8 62.9 63.0 63.1 63.1 63.4 63.5 63.9 64.1BY 64.2 64.6 64.9 65.1 65.4 65.6 65.9 66.1 66.3HP 10 26.3 30.0 32.6 36.4 37.6HP 200 17.8 21.2 24.2 27.8 28.7HP 1000 12.8 16.0 19.3 22.0 23.1HP 5000 7.7 11.1 13.6 16.8 17.8HP 10000 6.0 9.2 11.4 13.9 15.3HO 204**
** FIND STORM AREA AND ORIENTATION FOR PMS CENTERED AT WATERSHED CENTROIDSA 0 0ST 05 0.304 7 1.0GOPU ONZZ
P:\DJW\HM-52 Walker Run PMS Calc. (Rev. 1)
pc-",QýPAUL C. RizzoCONSULTANTS
ASSOCIATES, INC.
By DW, /..,.Date 4/28/2010 SubjectChkd.By. nc- Date i'-7/3.//
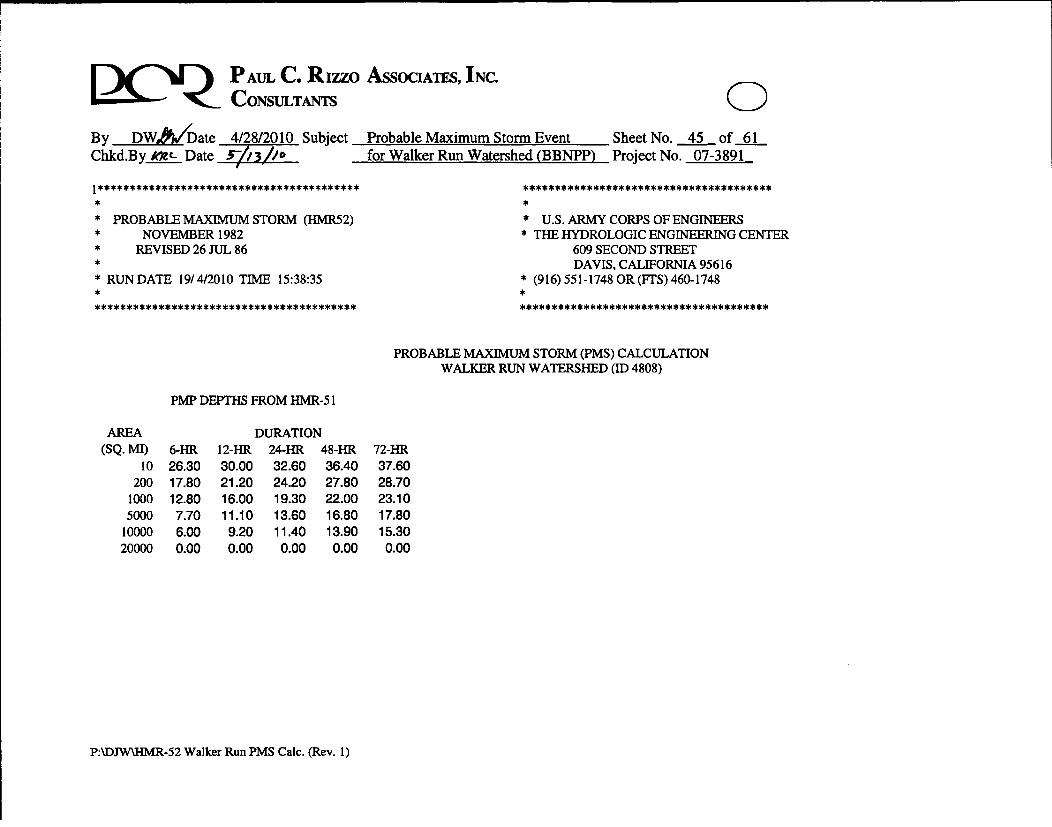
* PROBABLE MAXIMUM STORM (HMR52* NOVEMBER 1982* REVISED 26 JUL 86
* RUN DATE 19/4/2010 TIME 15:38:35
Probable Maximum Storm Event Sheet No. 45 of 61for Walker Run Watershed (BBNPP) Project No. 07-3891
* U.S. ARMY CORPS OF ENGINEERS* THE HYDROLOGIC ENGINEERING CENTER
609 SECOND STREETDAVIS, CALIFORNIA 95616
* (916) 551-1748 OR (FTS) 460-1748
* **** * * * ** ** ** * * * * * * *** * * * * * ** * * * ** * *** **
PROBABLE MAXIMUM STORM (PMS) CALCULATIONWALKER RUN WATERSHED (ID 4808)
PMP DEPTHS FROM HMR-51
AREA(SQ. MI)
10200
10005000
1000020000
DURATION
6-HR26.3017.8012.807.706.000.00
12-HR30.0021.2016.0011.109.200.00
24-HR32.6024.2019.3013.6011.400.00
48-HR36.4027.8022.0016.8013.900.00
72-HR37.6028.7023.1017.8015.300.00
PADJW'LHMR-52 Walker Run PMS Calc. (Rev. 1)
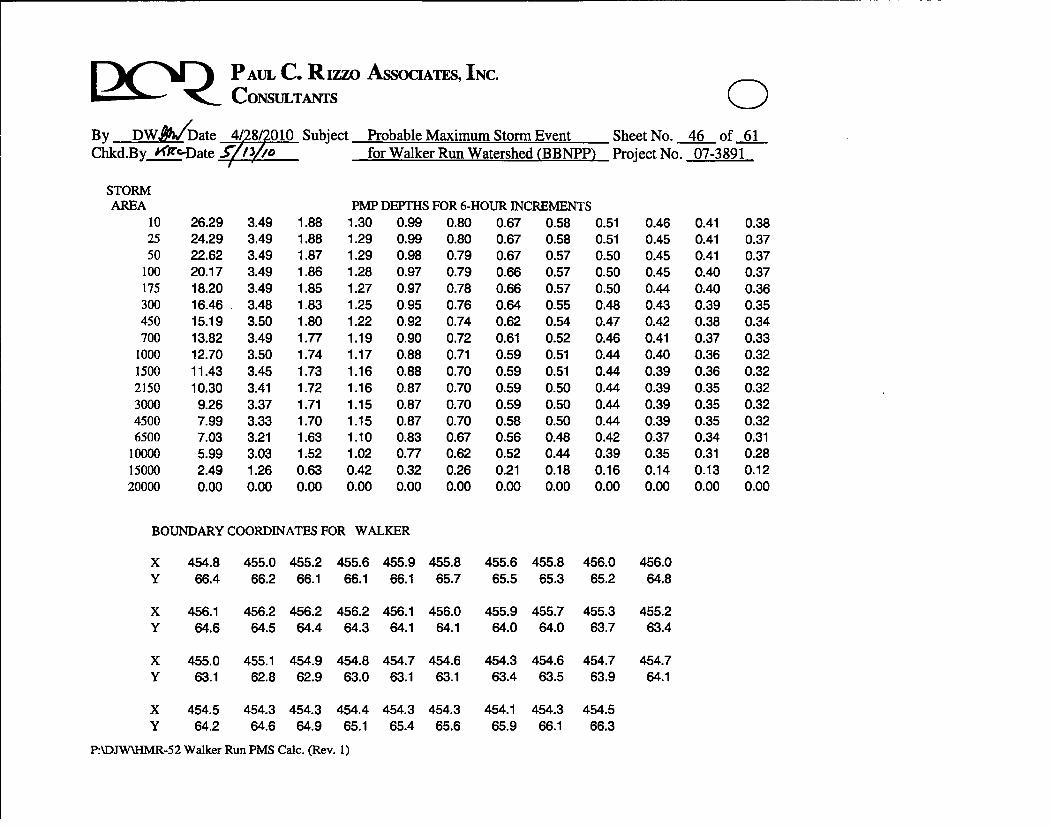
~C~Q PAUL C. R IZZO ASSOCIATES, INC.CONSULTANTS 0By RDW Date 41'28/2010 Subject Probable Maximum Storm Event Sheet No. 46 of 61Chkd.By_ýýcDate for Walker Run Watershed (BBNPP) Project No. 07-3891
STORMAREA
102550
100175300450700
100015002150300045006500
100001500020000
PMP DEPTHS FOR 6-HOUR INCREMENTS26.29 3.49 1.8824.29 3.49 1.8822.62 3.49 1.8720.17 3.49 1.8618.20 3.49 1.8516.46 3.48 1.8315.19 3.50 1.8013.82 3.49 1.7712.70 3.50 1.7411.43 3.45 1.7310.30 3.41 1.729.26 3.37 1.717.99 3.33 1.707.03 3.21 1.635.99 3.03 1.522.49 1.26 0.630.00 0.00 0.00
1.30 0.991.29 0.991.29 0.981.28 0.971.27 0.971.25 0.951.22 0.921.19 0.901.17 0.881.16 0.881.16 0.871.15 0.871.15 0.871.10 0.831.02 0.770.42 0.320.00 0.00
0.80 0.67 0.58 0.51 0.46 0.41 0.380.80 0.67 0.58 0.51 0.45 0.41 0.370.79 0.67 0.57 0.50 0.45 0.41 0.370.79 0.66 0.57 0.50 0.45 0.40 0.370.78 0.66 0.57 0.50 0.44 0.40 0.360.76 0.64 0.55 0.48 0.43 0.39 0.350.74 0.62 0.54 0.47 0.42 0.38 0.340.72 0.61 0.52 0.46 0.41 0.37 0.330.71 0.59 0.51 0.44 0.40 0.36 0.320.70 0.59 0.51 0.44 0.39 0.36 0.320.70 0.59 0.50 0.44 0.39 0.35 0.320.70 0.59 0.50 0.44 0.39 0.35 0.320.70 0.58 0.50 0.44 0.39 0.35 0.320.67 0.56 0.48 0.42 0.37 0.34 0.310.62 0.52 0.44 0.39 0.35 0.31 0.280.26 0.21 0.18 0.16 0.14 0.13 0.120.00 0.00 0.00 0.00 0.00 0.00 0.00
BOUNDARY COORDINATES FOR WALKER
X 454.8 455.0 455.2 455.6 455.9 455.8 455.6 455.8 456.0 456.0Y 66.4 66.2 66.1 66.1 66.1 65.7 65.5 65.3 65.2 64.8
X 456.1 456.2 456.2 456.2 456.1 456.0 455.9 455.7 455.3 455.2Y 64.6 64.5 64.4 64.3 64.1 64.1 64.0 64.0 63.7 63.4
X 455.0 455.1 454.9 454.8 454.7 454.6 454.3 454.6 454.7 454.7Y 63.1 62.8 62.9 63.0 63.1 63.1 63.4 63.5 63.9 64.1
X 454.5 454.3 454.3 454.4 454.3 454.3 454.1 454.3 454.5Y 64.2 64.6 64.9 65.1 65.4 65.6 65.9 66.1 66.3
P:\DJW\HMR-52 Walker Run PMS Calc. (Rev. 1)
AUL C. Rizzo AssocIATES, INC.CONSULTANTS 0
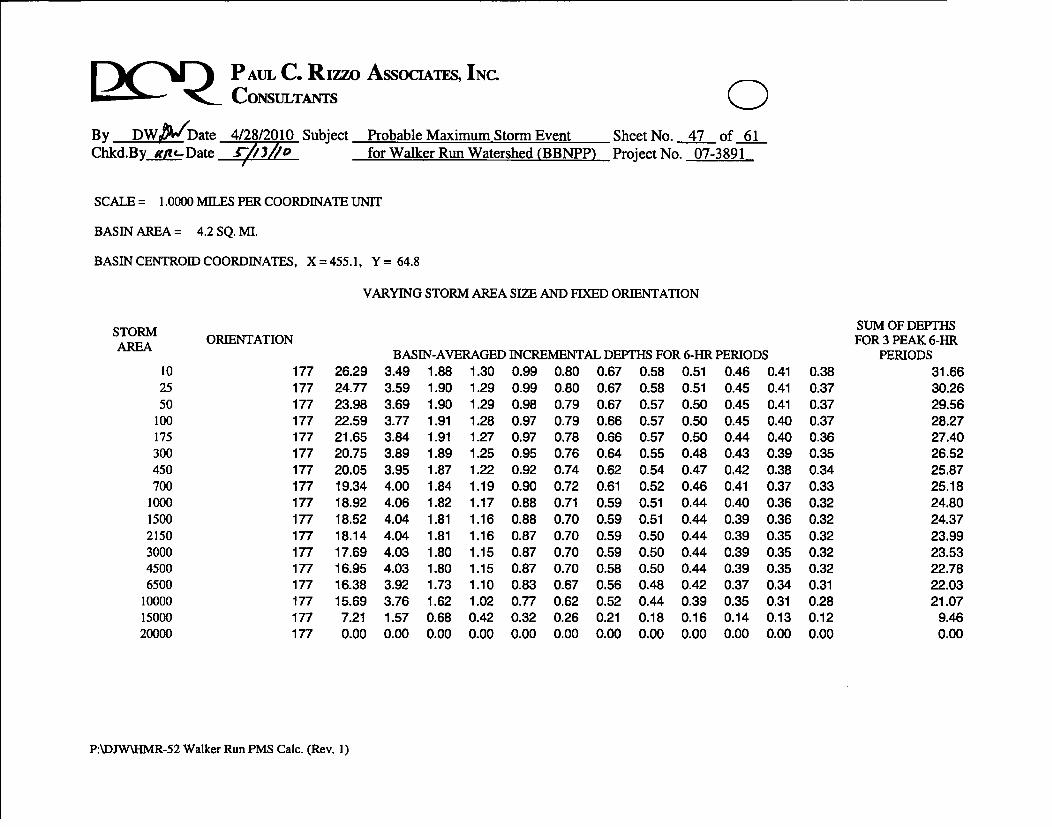
By iDW /,Date 4/28/2010 Subject Probable Maximum Storm Event Sheet No. 47 of 61Chkd.By g~c--Date -/3 for Walker Run Watershed (BBNPP) Project No. 07-3891
SCALE = 1.0000 MILES PER COORDINATE UNIT
BASIN AREA = 4.2 SQ. MI.
BASIN CENTROID COORDINATES, X = 455.1, Y = 64.8
VARYING STORM AREA SIZE AND FIXED ORIENTATION
STORMAREA ORIENTATION
BASIN-AVERAGED INCREMENTAL DEPTHS FOR 6-HR PERIODS102550
100175300450700
100015002150300045006500
100001500020000
177177177177177177177177177177177177177177177177177
26.29 3.4924.77 3.5923.98 3.6922.59 3.7721.65 3.8420.75 3.8920.05 3.9519.34 4.0018.92 4.0618.52 4.0418.14 4.0417.69 4.0316.95 4.0316.38 3.9215.69 3.76
7.21 1.570.00 0.00
1.881.901.901.911.911.891.871.841.821.811.811.801.801.731.620.680.00
1.30 0.991.29 0.991.29 0.981.28 0.971.27 0.971.25 0.951.22 0.921.19 0.901.17 0.881.16 0.881.16 0.871.15 0.871.15 0.871.10 0.831.02 0.770.42 0.320.00 0.00
0.80 0.67 0.580.80 0.67 0.580.79 0.67 0.570.79 0.66 0.570.78 0.66 0.570.76 0.64 0.550.74 0.62 0.540.72 0.61 0.520.71 0.59 0.510.70 0.59 0.510.70 0.59 0.500.70 0.59 0.500.70 0.58 0.500.67 0.56 0.480.62 0.52 0.440.26 0.21 0.180.00 0.00 0.00
0.510.510.500.500.500.480.470.460.440.440.440.440.440.420.390.160.00
0.46 0.410.45 0.410.45 0.410.45 0.400.44 0.400.43 0.390.42 0.380.41 0.370.40 0.360.39 0.360.39 0.350.39 0.350.39 0.350.37 0.340.35 0.310.14 0.130.00 0.00
0.380.370.370.370.360.350.340.330.320.320.320.320.320.310.280.120.00
SUM OF DEPTHSFOR 3 PEAK 6-HR
PERIODS31.6630.2629.5628.2727.4026.5225.8725.1824.8024.3723.9923.5322.7822.0321.07
9.460.00
P:\DJW\MR-52 Walker Run PMS Caic. (Rev. 1)
~C Q PAUL C. Rizzo ASSOCIATES, INC.CONSULTANTS 0By DW /bDate 4/28/2010 Subject Probable Maximum Storm Event Sheet No. 48 of 61Chkd.By.A5 Date i .i/,•i for Walker Run Watershed (BBNPP) Project No. 07-3891
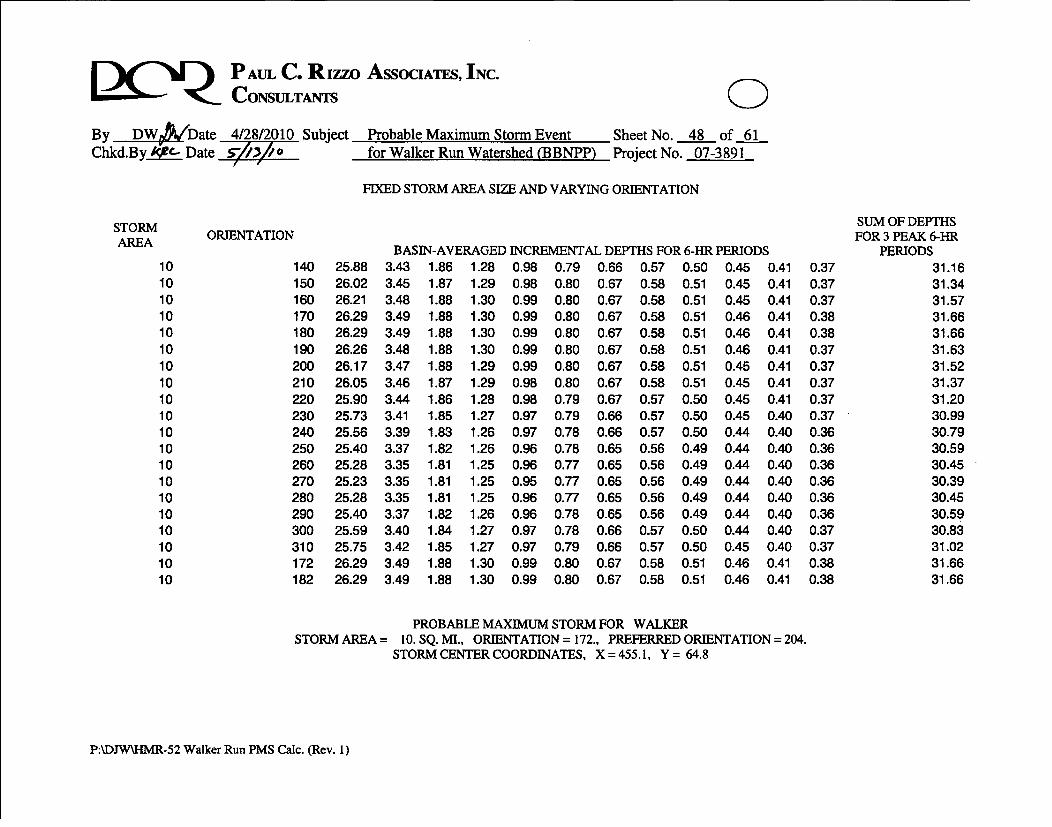
FIXED STORM AREA SIZE AND VARYING ORIENTATION
STORMAREA
ORIENTATIONBASIN-AVERAGED INCREMENTAL DEPTHS FOR 6-HR PERIODS
1010101010101010101010101010101010101010
140150160170180190200210220230240250260270280290300310172182
25.8826.0226.2126.2926.2926.2626.1726.0525.9025.7325.5625.4025.2825.2325.2825.4025.5925.7526.2926.29
3.43 1.863.45 1.873.48 1.883.49 1.883.49 1.883.48 1.883.47 1.883.46 1.873.44 1.863.41 1.853.39 1.833.37 1.823.35 1.813.35 1.813.35 1.813.37 1.823.40 1.843.42 1.853.49 1.883.49 1.88
1.28 0.98 0.791.29 0.98 0.801.30 0.99 0.801.30 0.99 0.801.30 0.99 0.801.30 0.99 0.801.29 0.99 0.801.29 0.98 0.801.28 0.98 0.791.27 0.97 0.791.26 0.97 0.781.26 0.96 0.781.25 0.96 0.771.25 0.95 0.771.25 0.96 0.771.26 0.96 0.781.27 0.97 0.781.27 0.97 0.791.30 0.99 0.801.30 0.99 0.80
0.66 0.570.67 0.580.67 0.580.67 0.580.67 0.580.67 0.580.67 0.580.67 0.580.67 0.570.66 0.570.66 0.570.65 0.560.65 0.560.65 0.560.65 0.560.65 0.560.66 0.570.66 0.570.67 0.580.67 0.58
0.500.510.510.510.510.510.510.510.500.500.500.490.490.490.490.490.500.500.510.51
0.45 0.410.45 0.410.45 0.410.46 0.410.46 0.410.46 0.410.45 0.410.45 0.410.45 0.410.45 0.400.44 0.400.44 0.400.44 0.400.44 0.400.44 0.400.44 0.400.44 0.400.45 0.400.46 0.410.46 0.41
0.370.370.370.380.380.370.370.370.370.370.360.360.360.360.360.360.370.370.380.38
SUM OF DEPTHSFOR 3 PEAK 6-HR
PERIODS31.1631.3431.5731.6631.6631.6331.5231.3731.2030.9930.7930.5930.4530.3930.4530.5930.8331.0231.6631.66
PROBABLE MAXIMUM STORM FOR WALKERSTORM AREA = 10. SQ. MI., ORIENTATION = 172., PREFERRED ORIENTATION = 204.
STORM CENTER COORDINATES, X = 455.1, Y = 64.8
P:\DJW\HMR-52 Walker Run PMS Calc. (Rev. 1)

CPAUL C. R izzo ASSOCIATES, INC.CONSULTANTS 0By __ DW_,,%W~ate 4/28/2010 Subject Probable Maximum Storm Event Sheet No. 49 of 61Chkd.By A'/Lt-Date • /ii for Walker Run Watershed (BBNPP) Project No. 07-3891
AREAISOHYET AE(SQ. MI.)
A 10B 25C 50D 100E 175F 300G 450H 700I 1000J 1500K 2150L 3000M 4500N 65000 10000P 15000Q 25000R 40000S 60000
AREAWITHINBASIN 1
4.00 26.294.00 16.824.00 12.624.00 9.994.00 7.894.00 6.314.00 4.994.00 3.684.00 2.634.00 1.584.00 0.534.00 0.004.00 0.004.00 0.004.00 0.004.00 0.004.00 0.004.00 0.004.00 0.00
DEPTHS (INCHES) FOR 6-HOUR INCREMENTS OF PMS
23.492.231.671.361.050.840.700.490.350.240.100.000.000.000.000.000.000.000.00
31.881.230.900.740.570.450.380.260.190.120.060.000.000.000.000.000.000.000.00
41.300.840.620.510.390.310.260.180.130.080.040.000.000.000.000.000.000.000.00
50.990.640.480.390.300.240.200.140.100.060.030.000.000.000.000.000.000.000.00
6 70.80 0.670.52 0.440.39 0.320.31 0.260.24 0.200.19 0.160.16 0.130.11 0.090.08 0.070.05 0.040.02 0.020.00 0.000.00 0.000.00 0.000.00 0.000.00 0.000.00 0.000.00 0.000.00 0.00
80.580.380.280.230.170.140.120.080.060.040.020.000.000.000.000.000.000.000.00
9 100.51 0.460.33 0.300.25 0.220.20 0.180.15 0.140.12 0.110.10 0.090.07 0.060.05 0.050.03 0.030.02 0.010.00 0.000.00 0.000.00 0.000.00 0.000.00 0.000.00 0.000.00 0.000.00 0.00
110.410.270.200.160.120.100.080.060.040.030.010.000.000.000.000.000.000.000.00
120.380.240.180.150.110.090.080.050.040.020.010.000.000.000.000.000.000.000.00
AVERAGE DEPTH = 26.29 3.49 1.88 1.30 0.99 0.80 0.67 0.58 0.51 0.46 0.41 0.38
TIME INTERVAL = 5. MINUTES
1-HR TO 6-HR RATIO FOR ISOHYET A AT 20000 SQ. MI. = 0.304
P:\DJW\HMR-52 Walker Run PMS Calc. (Rev. 1)
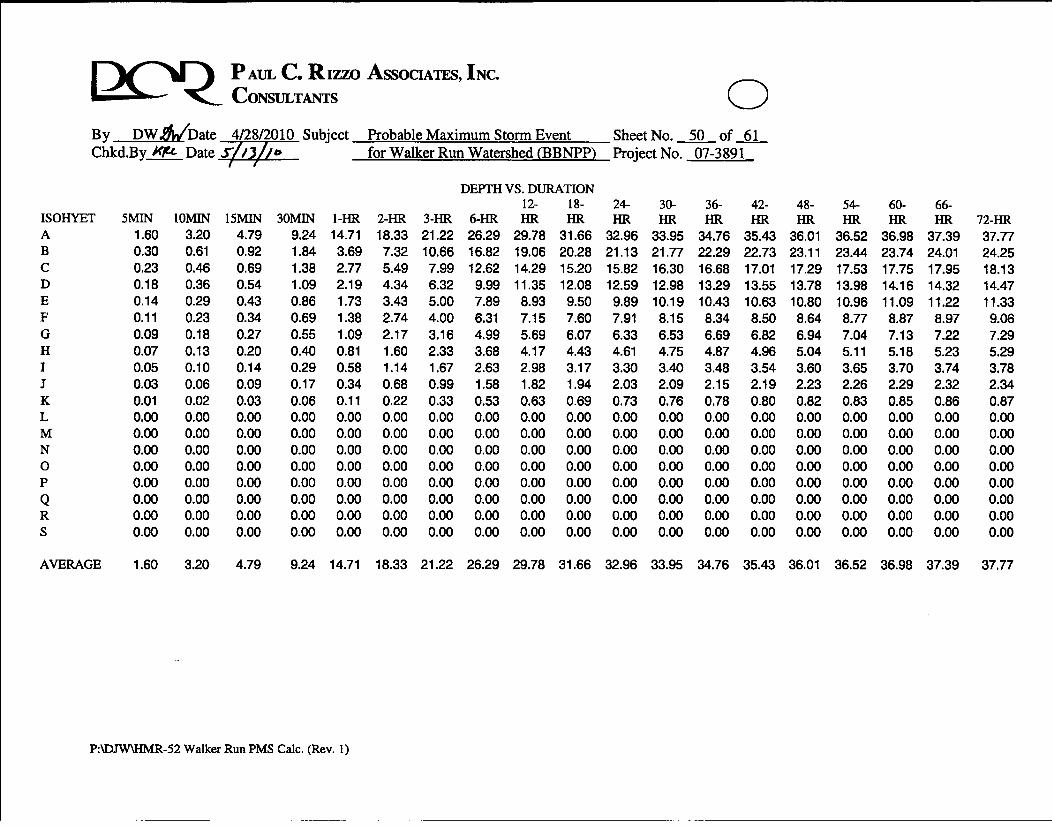
LKQ PAUL C. R izzo AssocIATs, INC.CONSULTANTS QBy DW.&VDate 4/28/2010 Subject Probable Maximum Storm Event Sheet No. 50 of 61Chkd.By.M'jt Date i//J//, for Walker Run Watershed (BBNPP) Project No. 07-3891
DEFTH VS. DURATION12- 18- 24- 30- 36- 42- 48- 54- 60- 66-
ISOHYET 5MIN 10MIN 15MIN 30MIN I-HR 2-HR 3-HR 6-HR HR HR HR HR HR HR HR HR HR HR 72-HRA 1.60 3.20 4.79 9.24 14.71 18.33 21.22 26.29 29.78 31.66 32.96 33.95 34.76 35.43 36.01 36.52 36.98 37.39 37.77B 0.30 0.61 0.92 1.84 3.69 7.32 10.66 16.82 19.06 20.28 21.13 21.77 22.29 22.73 23.11 23.44 23.74 24.01 24.25C 0.23 0.46 0.69 1.38 2.77 5.49 7.99 12.62 14.29 15.20 15.82 16.30 16.68 17.01 17.29 17.53 17.75 17.95 18.13D 0.18 0.36 0.54 1.09 2.19 4.34 6.32 9.99 11.35 12.08 12.59 12.98 13.29 13.55 13.78 13.98 14.16 14.32 14.47E 0.14 0.29 0.43 0.86 1.73 3.43 5.00 7.89 8.93 9.50 9.89 10.19 10.43 10.63 10.80 10.96 11.09 11.22 11.33F 0.11 0.23 0.34 0.69 1.38 2.74 4.00 6.31 7.15 7.60 7.91 8.15 8.34 8.50 8.64 8.77 8.87 8.97 9.06G 0.09 0.18 0.27 0.55 1.09 2.17 3.16 4.99 5.69 6.07 6.33 6.53 6.69 6.82 6.94 7.04 7.13 7.22 7.29H 0.07 0.13 0.20 0.40 0.81 1.60 2.33 3.68 4.17 4.43 4.61 4.75 4.87 4.96 5.04 5.11 5.18 5.23 5.291 0.05 0.10 0.14 0.29 0.58 1.14 1.67 2.63 2.98 3.17 3.30 3.40 3.48 3.54 3.60 3.65 3.70 3.74 3.78J 0.03 0.06 0.09 0.17 0.34 0.68 0.99 1.58 1.82 1.94 2.03 2.09 2.15 2.19 2.23 2.26 2.29 2.32 2.34K 0.01 0.02 0.03 0.06 0.11 0.22 0.33 0.53 0.63 0.69 0.73 0.76 0.78 0.80 0.82 0.83 0.85 0.86 0.87L 0.00 0.00 0.00 0.00 0.00 0.00 0.00 0.00 0.00 0.00 0.00 0.00 0.00 0.00 0.00 0.00 0.00 0.00 0.00M 0.00 0.00 0.00 0.00 0.00 0.00 0.00 0.00 0.00 0.00 0.00 0.00 0.00 0.00 0.00 0.00 0.00 0.00 0.00N 0.00 0.00 0.00 0.00 0.00 0.00 0.00 0.00 0.00 0.00 0.00 0.00 0.00 0.00 0.00 0.00 0.00 0.00 0.000 0.00 0.00 0.00 0.00 0.00 0.00 0.00 0.00 0.00 0.00 0.00 0.00 0.00 0.00 0.00 0.00 0.00 0.00 0.00P 0.00 0.00 0.00 0.00 0.00 0.00 0.00 0.00 0.00 0.00 0.00 0.00 0.00 0.00 0.00 0.00 0.00 0.00 0.00Q 0.00 0.00 0.00 0.00 0.00 0.00 0.00 0.00 0.00 0.00 0.00 0.00 0.00 0.00 0.00 0.00 0.00 0.00 0.00R 0.00 0.00 0.00 0.00 0.00 0.00 0.00 0.00 0.00 0.00 0.00 0.00 0.00 0.00 0.00 0.00 0.00 0.00 0.00S 0.00 0.00 0.00 0.00 0.00 0.00 0.00 0.00 0.00 0.00 0.00 0.00 0.00 0.00 0.00 0.00 0.00 0.00 0.00
AVERAGE 1.60 3.20 4.79 9.24 14.71 18.33 21.22 26.29 29.78 31.66 32.96 33.95 34.76 35.43 36.01 36.52 36.98 37.39 37.77
PADJWXBHM-52 Walker Run PMS Calc. (Rev. 1)
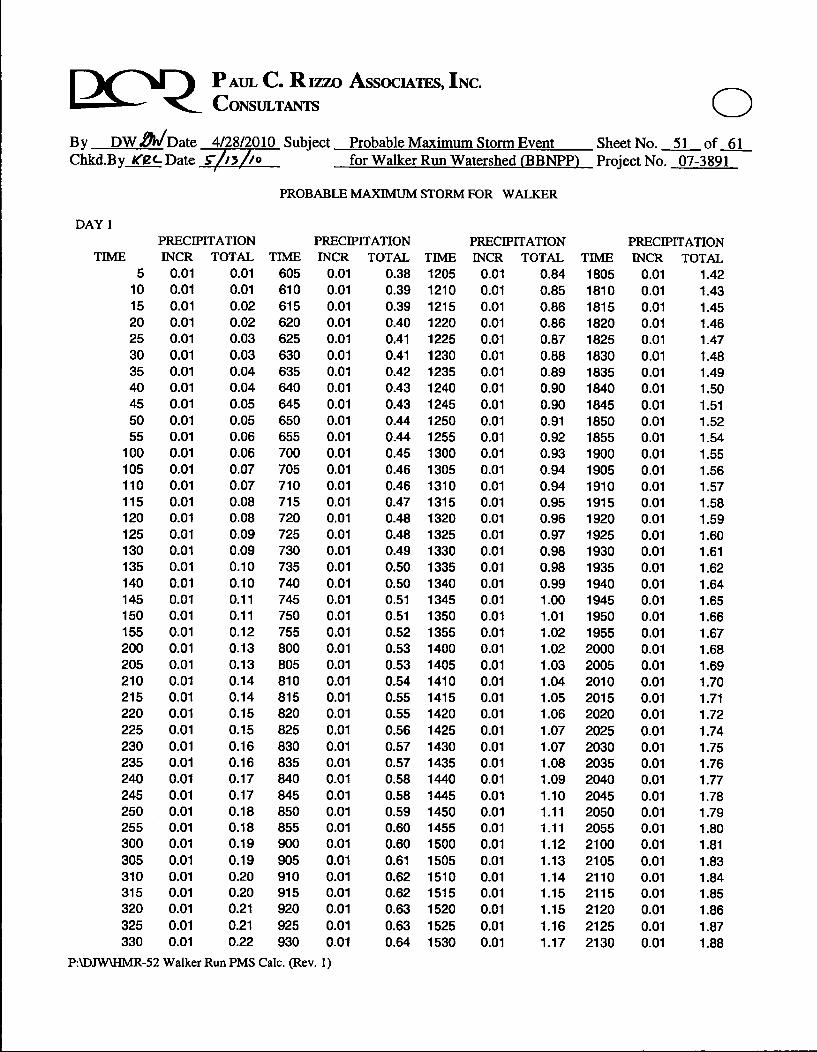
Q PAUL C. Rizzo ASSOCIATES, INC.CONSULTANTS 0By DW.M/'Date 4/28/2010 Subject Probable Maximum Storm Event Sheet No. 51 of 61Chkd.By /'iC- Date '-//o for Walker Run Watershed (BBNPP) Project No. 07-3891
PROBABLE MAXIMUM STORM FOR WALKER
DAY 1PRECIPITATION PRECIPITATION PRECIPITATION
TIME INCR TOTAL TIME INCR TOTAL TIME INCR TOTAL TIMEPRECIPITATIONINCR TOTAL
510152025303540455055
100105110115120125130135140145150155200205210215220225230235240245250255300305310315320325330
0.010.010.010.010.010.010.010.010.010.010.010.010.010.010.010.010.010.010.010.010.010.010.010.010.010.010.010.010.010.010.010.010.010.010.010.010.010.010.010.010.010.01
0.010.010.020.020.030.030.040.040.050.050.060.060.070.070.080.080.090.090.100.100.110.110.120.130.130.140.140.150.150.160.160.170.170.180.180.190.190.200.200.210.210.22
605610615620625630635640645650655700705710715720725730735740745750755800805810815820825830835840845850855900905910915920925930
0.010.010.010.010.010.010.010.010.010.010.010.010.010.010.010.010.010.010.010.010.010.010.010.010.010.010.010.010.010.010.010.010.010.010.010.010.010.010.010.010.010.01
0.38 12050.39 12100.39 12150.40 12200.41 12250.41 12300.42 12350.43 12400.43 12450.44 12500.44 12550.45 13000.46 13050.46 13100.47 13150.48 13200.48 13250.49 13300.50 13350.50 13400.51 13450.51 13500.52 13550.53 14000.53 14050.54 14100.55 14150.55 14200.56 14250.57 14300.57 14350.58 14400.58 14450.59 14500.60 14550.60 15000.61 15050.62 15100.62 15150.63 15200.63 15250.64 1530
0.010.010.010.010.010.010.010.010.010.010.010.010.010.010.010.010.010.010.010.010.010.010.010.010.010.010.010.010.010.010.010.010.010.010.010.010.010.010.010.010.010.01
0.84 18050.85 18100.86 18150.86 18200.87 18250.88 18300.89 18350.90 18400.90 18450.91 18500.92 18550.93 19000.94 19050.94 19100.95 19150.96 19200.97 19250.98 19300.98 19350.99 19401.00 19451.01 19501.02 19551.02 20001.03 20051.04 20101.05 20151.06 20201.07 20251.07 20301.08 20351.09 20401.10 20451.11 20501.11 20551.12 21001.13 21051.14 21101.15 21151.15 21201.16 21251.17 2130
0.010.010.010.010.010.010.010.010.010.010.010.010.010.010.010.010.010.010.010.010.010.010.010.010.010.010.010.010.010.010.010.010.010.010.010.010.010.010.010.010.010.01
1.421.431.451.461.471.481.491.501.511.521.541.551.561.571.581.591.601.611.621.641.651.661.671.681.691.701.711.721.741.751.761.771.781.791.801.811.831.841.851.861.871.88
P:\DJWUHMR-52 Walker Run PMS Calc. (Rev. 1)
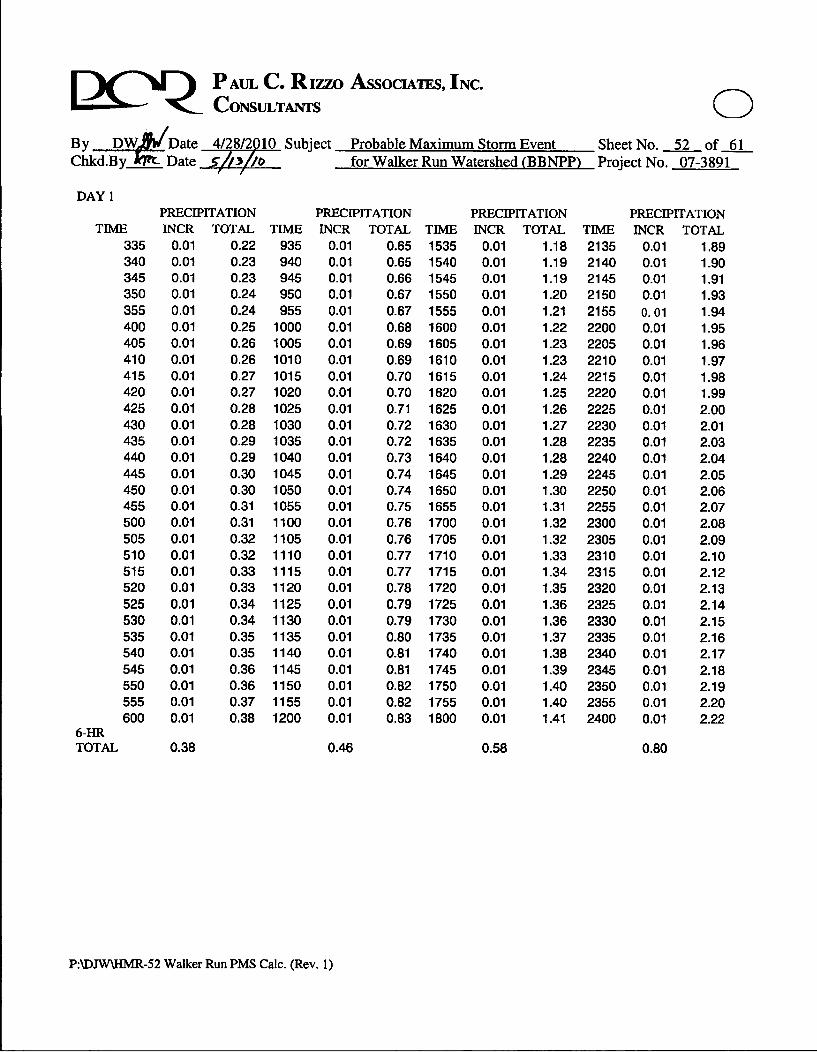
[2 )Q PAUL C. Rizzo ASSOCIATES, INC.CONSULTANTS
By DW,/Date 4/28/2010 Subject Probable Maximum Storm EventChkd.By V Date !.IZ3,110 for Walker Run Watershed (BBNPP)
0Sheet No. 52 of 61Project No. 07-3891
DAY IPRECIPITATION PRECIPITATION PRECIPITATION
TIME INCR TOTAL TIME INCR TOTAL TIME INCR TOTAL TIMEPRECIPITATIONINCR TOTAL
335340345350355400405410415420425430435440445450455500505510515520525530535540545550555600
6-HRTOTAL
0.010.010.010.010.010.010.010.010.010.010.010.010.010.010.010.010.010.010.010.010.010.010.010.010.010.010.010.010.010.01
0.38
0.22 9350.23 9400.23 9450.24 9500.24 9550.25 10000.26 10050.26 10100.27 10150.27 10200.28 10250.28 10300.29 10350.29 10400.30 10450.30 10500.31 10550.31 11000.32 11050.32 11100.33 11150.33 11200.34 11250.34 11300.35 11350.35 11400.36 11450.36 11500.37 11550.38 1200
0.010.010.010.010.010.010.010.010.010.010.010.010.010.010.010.010.010.010.010.010.010.010.010.010.010.010.010.010.010.01
0.46
0.65 15350.65 15400.66 15450.67 15500.67 15550.68 16000.69 16050.69 16100.70 16150.70 16200.71 16250.72 16300.72 16350.73 16400.74 16450.74 16500.75 16550.76 17000.76 17050.77 17100.77 17150.78 17200.79 17250.79 17300.80 17350.81 17400.81 17450.82 17500.82 17550.83 1800
0.010.010.010.010.010.010.010.010.010.010.010.010.010.010.010.010.010.010.010.010.010.010.010.010.010.010.010.010.010.01
0.58
1.18 21351.19 21401.19 21451.20 21501.21 21551.22 22001.23 22051.23 22101.24 22151.25 22201.26 22251.27 22301.28 22351.28 22401.29 22451.30 22501.31 22551.32 23001.32 23051.33 23101.34 23151.35 23201.36 23251.36 23301.37 23351.38 23401.39 23451.40 23501.40 23551.41 2400
0.010.010.010.010.010.010.010.010.010.010.010.010.010.010.010.010.010.010.010.010.010.010.010.010.010.010.010.010.010.01
0.80
1.891.901.911.931.941.951.961.971.981.992.002.012.032.042.052.062.072.082.092.102.122.132.142.152.162.172.182.192.202.22
P:\DJWH-MR-52 Walker Run PMS Calc. (Rev. 1)
[Ž)Q PAUL C. Rizzo AssoCIAms, INC.CONSULTANTS
By DWy Date 4/28/2010 Subject Probable Maximum Storm EventChkd.By.Aettc Date ,/3//o for Walker Run Watershed (BBNPP) I
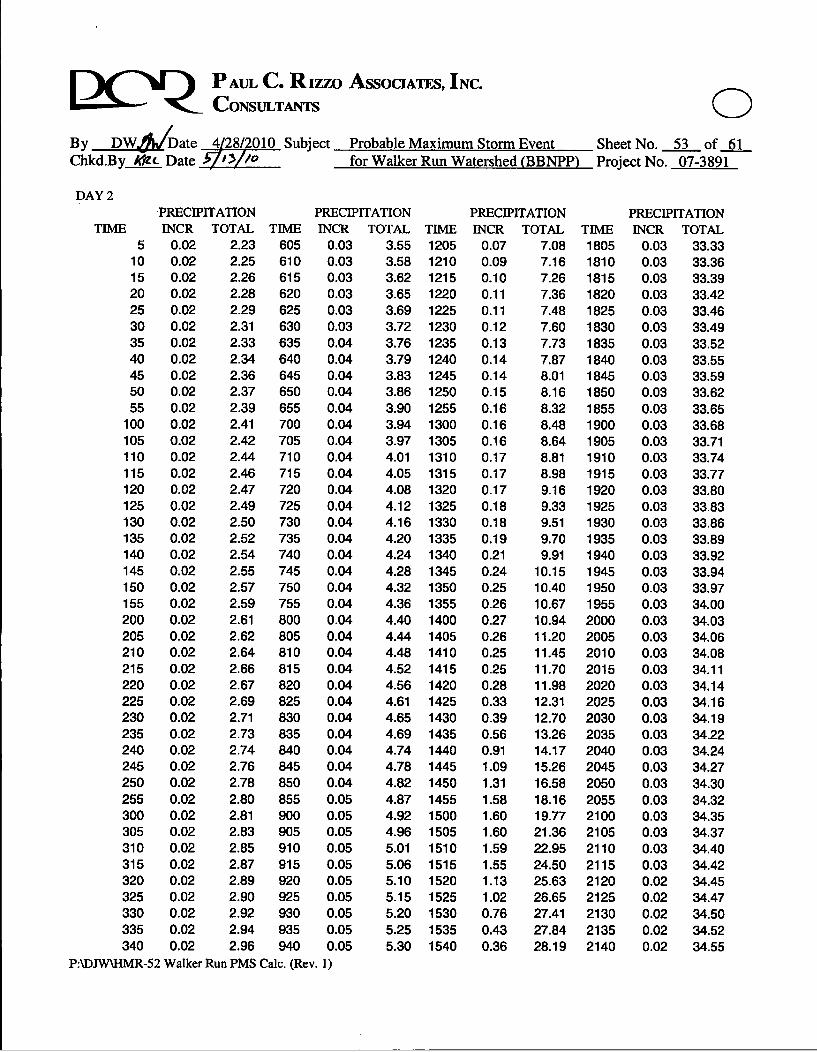
0;heet No. 53 of 61'roject No. 07-3891
DAY 2PRECIPITATION PRECIPITATION PRECIPITATION
TIME INCR TOTAL TIME INCR TOTAL TIME INCR TOTAL TIMEPRECIPITATIONINCR TOTAL
510152025303540455055
100105110115120125130135140145150155200205210215220225230235240245250255300305310315320325330335340
0.020.020.020.020.020.020.020.020.020.020.020.020.020.020.020.020.020.020.020.020.020.020.020.020.020.020.020.020.020.020.020.020.020.020.020.020.020.020.020.020.020.020.020.02
2.232.252.262.282.292.312.332.342.362.372.392.412.422.442.462.472.492.502.522.542.552.572.592.612.622.642.662.672.692.712.732.742.762.782.802.812.832.852.872.892.902.922.942.96
605610615620625630635640645650655700705710715720725730735740745750755800805810815820825830835840845850855900905910915920925930935940
0.030.030.030.030.030.030.040.040.040.040.040.040.040.040.040.040.040.040.040.040.040.040.040.040.040.040.040.040.040.040.040.040.040.040.050.050.050.050.050.050.050.050.050.05
3.55 12053.58 12103.62 12153.65 12203.69 12253.72 12303.76 12353.79 12403.83 12453.86 12503.90 12553.94 13003.97 13054.01 13104.05 13154.08 13204.12 13254.16 13304.20 13354.24 13404.28 13454.32 13504.36 13554.40 14004.44 14054.48 14104.52 14154.56 14204.61 14254.65 14304.69 14354.74 14404.78 14454.82 14504.87 14554.92 15004.96 15055.01 15105.06 15155.10 15205.15 15255.20 15305.25 15355.30 1540
0.070.090.100.110.110.120.130.140.140.150.160.160.160.170.170.170.180.180.190.210.240.250.260.270.260.250.250.280.330.390.560.911.091.311.581.601.601.591.551.131.020.760.430.36
7.08 18057.16 18107.26 18157.36 18207.48 18257.60 18307.73 18357.87 18408.01 18458.16 18508.32 18558.48 19008.64 19058.81 19108.98 19159.16 19209.33 19259.51 19309.70 19359.91 1940
10.15 194510.40 195010.67 195510.94 200011.20 200511.45 201011.70 201511.98 202012.31 202512.70 203013.26 203514.17 204015.26 204516.58 205018.16 205519.77 210021.36 210522.95 211024.50 211525.63 212026.65 212527.41 213027.84 213528.19 2140
0.030.030.030.030.030.030.030.030.030.030.030.030.030.030.030.030.030.030.030.030.030.030.030.030.030.030.030.030.030.030.030.030.030.030.030.030.030.030.030.020.020.020.020.02
33.3333.3633.3933.4233.4633.4933.5233.5533.5933.6233.6533.6833.7133.7433.7733.8033.8333.8633.8933.9233.9433.9734.0034.0334.0634.0834.1134.1434.1634.1934.2234.2434.2734.3034.3234.3534.3734.4034.4234.4534.4734.5034.5234.55
P:\DJW\UER-52 Walker Run PMS Calc. (Rev. 1)
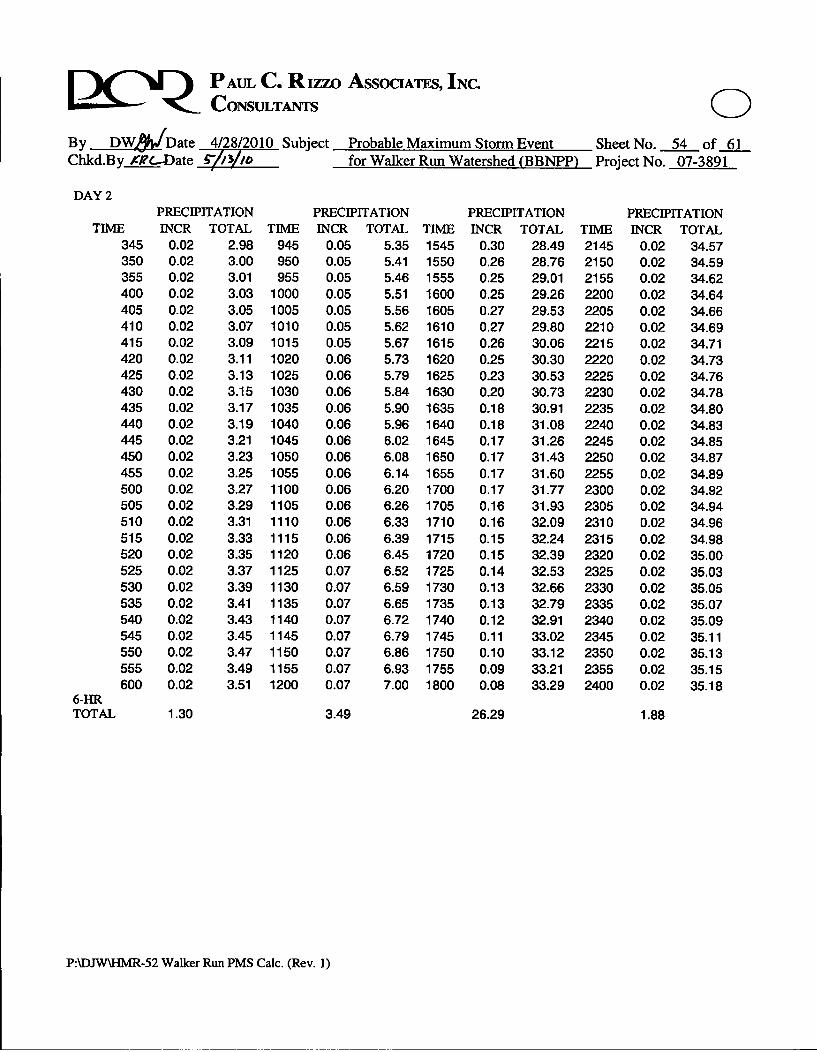
Q PAUL C. Rizzo AssocIATEs, INC.CONSULTANTS 0By DWIDate 4/28/2010 Subject Probable Maximum Storm Event Sheet No. 54 of 61Chkd.By._KRL-Date 6'//3/0 for Walker Run Watershed (BBNPP) Project No. 07-3891
DAY 2PRECIPITATION PRECIPITATION PRECIPITATION
TIME INCR TOTAL TIME INCR TOTAL TIME INCR TOTAL TIMEPRECIPITATIONINCR TOTAL
345350355400405410415420425430435440445450455500505510515520525530535540545550555600
6-HRTOTAL
0.020.020.020.020.020.020.020.020.020.020.020.020.020.020.020.020.020.020.020.020.020.020.020.020.020.020.020.02
1.30
2.98 9453.00 9503.01 9553.03 10003.05 10053.07 10103.09 10153.11 10203.13 10253.15 10303.17 10353.19 10403.21 10453.23 10503.25 10553.27 11003.29 11053.31 11103.33 11153.35 11203.37 11253.39 11303.41 11353.43 11403.45 11453.47 11503.49 11553.51 1200
0.050.050.050.050.050.050.050.060.060.060.060.060.060.060.060.060.060.060.060.060.070.070.070.070.070.070.070.07
3.49
5.35 15455.41 15505.46 15555.51 16005.56 16055.62 16105.67 16155.73 16205.79 16255.84 16305.90 16355.96 16406.02 16456.08 16506.14 16556.20 17006.26 17056.33 17106.39 17156.45 17206.52 17256.59 17306.65 17356.72 17406.79 17456.86 17506.93 17557.00 1800
0.300.260.250.250.270.270.260.250.230.200.180.180.170.170.170.170.160.160.150.150.140.130.130.120.110.100.090.08
26.29
28.49 214528.76 215029.01 215529.26 220029.53 220529.80 221030.06 221530.30 222030.53 222530.73 223030.91 223531.08 224031.26 224531.43 225031.60 225531.77 230031.93 230532.09 231032.24 231532.39 232032.53 232532.66 233032.79 233532.91 234033.02 234533.12 235033.21 235533.29 2400
0.020.020.020.020.020.020.020.020.020.020.020.020.020.020.020.020.020.020.020.020.020.020.020.020.020.020.020.02
1.88
34.5734.5934.6234.6434.6634.6934.7134.7334.7634.7834.8034.8334.8534.8734.8934.9234.9434.9634.9835.0035.0335.0535.0735.0935.1135.1335.1535.18
P:\DJWUMR-52 Walker Run PMS Calc. (Rev. 1)

Q PAUL C. Rizzo AssociATEs, INC.CONSULTANTS
By DW Date 4/28/2010 Subject Probable Maximum Storm EventChkd.By_.c-Date •Z1/11/• for Walker Run Watershed (BBNPP)
0Sheet No. 55 of 61Project No. 07-3891
DAY 3PRECIPITATION PRECIPITATION
TIME INCR TOTAL TIME INCR
510152025303540455055
100105110115120125130135140145150155200205210215220225230235240245250255300305310315320325330335340
0.010.010.010.010.010.010.010.010.010.010.010.010.010.010.010.010.010.010.010.010.010.010.010.010.010.010.010.010.010.010.010.010.010.010.010.010.010.010.010.010.010.010.010.01
35.19 60535.20 61035.22 61535.23 62035.24 62535.26 63035.27 63535.29 64035.30 64535.31 65035.33 65535.34 70035.36 70535.37 71035.38 71535.40 72035.41 72535.42 73035.44 73535.45 74035.47 74535.48 75035.49 75535.51 80035.52 80535.53 81035.55 81535.56 82035.58 82535.59 83035.60 83535.62 84035.63 84535.64 85035.66 85535.67 90035.69 90535.70 91035.71 91535.73 92035.74 92535.75 93035.77 93535.78 940
0.010.010.010.010.010.010.010.010.010.010.010.010.010.010.010.010.010.010.010.010.010.010.010.010.010.010.010.010.010.010.010.010.010.010.010.010.010.010.010.010.010.010.010.01
TOTAL TIME36.18 120536.19 121036.20 121536.21 122036.22 122536.22 123036.23 123536.24 124036.25 124536.26 125036.27 125536.28 130036.29 130536.30 131036.31 131536.32 132036.33 132536.34 133036.35 133536.36 134036.37 134536.37 135036.38 135536.39 140036.40 140536.41 141036.42 141536.43 142036.44 142536.45 143036.46 143536.47 144036.48 144536.49 145036.50 145536.51 150036.51 150536.52 151036.53 151536.54 152036.55 152536.56 153036.57 153536.58 1540
PRECIPITATIONINCR TOTAL TIME
0.01 36.85 18050.01 36.86 18100.01 36.86 18150.01 36.87 18200.01 36.88 18250.01 36.89 18300.01 36.89 18350.01 36.90 18400.01 36.91 18450.01 36.91 18500.01 36.92 18550.01 36.93 19000.01 36.94 19050.01 36.94 19100.01 36.95 19150.01 36.96 19200.01 36.96 19250.01 36.97 19300.01 36.98 19350.01 36.98 19400.01 36.99 19450.01 37.00 19500.01 37.01 19550.01 37.01 20000.01 37.02 20050.01 37.03 20100.01 37.03 20150.01 37.04 20200.01 37.05 20250.01 37.06 20300.01 37.06 20350.01 37.07 20400.01 37.08 20450.01 37.08 20500.01 37.09 20550.01 37.10 21000.01 37.11 21050.01 37.11 21100.01 37.12 21150.01 37.13 21200.01 37.13 21250.01 37.14 21300.01 37.15 21350.01 37.16 2140
PRECIPITATIONINCR TOTAL
0.01 37.360.01 37.370.01 37.370.01 37.380.01 37.380.01 37.390.01 37.390.01 37.400.01 37.410.01 37.410.01 37.420.01 37.420.01 37.430.01 37.430.01 37.440.01 37.450.01 37.450.01 37.460.01 37.460.01 37.470.01 37.470.01 37.480.01 37.490.01 37.490.01 37.500.01 37.500.01 37.510.01 37.510.01 37.520.01 37.530.01 37.530.01 37.540.01 37.540.01 37.550.01 37.550.01 37.560.01 37.570.01 37.570.01 37.580.01 37.580.01 37.590.01 37.590.01 37.600.01 37.61
P:\DJVIW\HR-52 Walker Run PMS Calc. (Rev. 1)

ŽPAUL C. Rizzo ASSOCIATES, INC.CONSULTANTS 0
By DWDate 4/28/2010 Subject Probable Maximum Storm Event Sheet No. 56 of 61Chkd.By./cr-Date f /V/0 for Walker Run Watershed (BBNPP) Project No. 07-3891
DAY 3
PRECIPITATION PRECIPITATION PRECIPITATIONTIME INCR TOTAL TIME INCR TOTAL TIME INCR TOTAL TIME
PRECIPITATIONINCR TOTAL
345350355400405410415420425430435440445450455500505510515520525530535540545550555600
6-HRTOTAL
0.010.010.010.010.010.010.010.010.010.010.010.010.010.010.010.010.010.010.010.010.010.010.010.010.010.010.010.01
0.99
35.80 94535.81 95035.82 95535.84 100035.85 100535.87 101035.88 101535.89 102035.91 102535.92 103035.93 103535.95 104035.96 104535.98 105035.99 105536.00 110036.02 110536.03 111036.04 111536.06 112036.07 112536.09 113036.10 113536.11 114036.13 114536.14 115036.15 115536.17 1200
0.010.010.010.010.010.010.010.010.010.010.010.010.010.010.010.010.010.010.010.010.010.010.010.010.010.010.010.01
0.67
36.59 154536.60 155036.61 155536.62 160036.63 160536.64 161036.65 161536.66 162036.66 162536.67 163036.68 163536.69 164036.70 164536.71 165036.72 165536.73 170036.74 170536.75 171036.76 171536.77 172036.78 172536.79 173036.80 173536.81 174036.81 174536.82 175036.83 175536.84 1800
0.010.010.010.010.010.010.010.010.010.010.010.010.010.010.010.010.010.010.010.010.010.010.010.010.010.010.010.01
0.51
37.16 214537.17 215037.18 215537.18 220037.19 220537.20 221037.20 221537.21 222037.22 222537.23 223037.23 223537.24 224037.25 224537.25 225037.26 225537.27 230037.28 230537.28 231037.29 231537.30 232037.30 232537.31 233037.32 233537.33 234037.33 234537.34 235037.35 235537.35 2400
0.010.010.010.010.010.010.010.010.010.010.010.010.010.010.010.010.010.010.010.010.010.010.010.010.010.010.010.01
0.41
37.6137.6237.6237.6337.6337.6437.6537.6537.6637.6637.6737.6737.6837.6937.6937.7037.7037.7137.7137.7237.7337.7337.7437.7437.7537.7537.7637.77
P:\DJWUBA-52 Walker Run PMS Calc. (Rev. 1)
L~ Q PAUL C. Rizzo AssocIATEs, INC.CONSULTANTS 0By DW,•'Date 4/28/20)10 SubjectChkd.ByA. c-Date -rll•//&
Probable Maximum Storm Eventfor Walker Run Watershed (BBNPP)
Sheet No. 57 of 61Project No. 07-3891I m
Attachment E
Referenced Figures from HMR-52 for 1-hour _Mi2 PMPAnalysis
P:\DJWHMR-52 Walker Run PMS Calc. (Rev. 1)
L CPAUL C. Rizzo ASSOCIATES, INC.CONSULTANTS 0
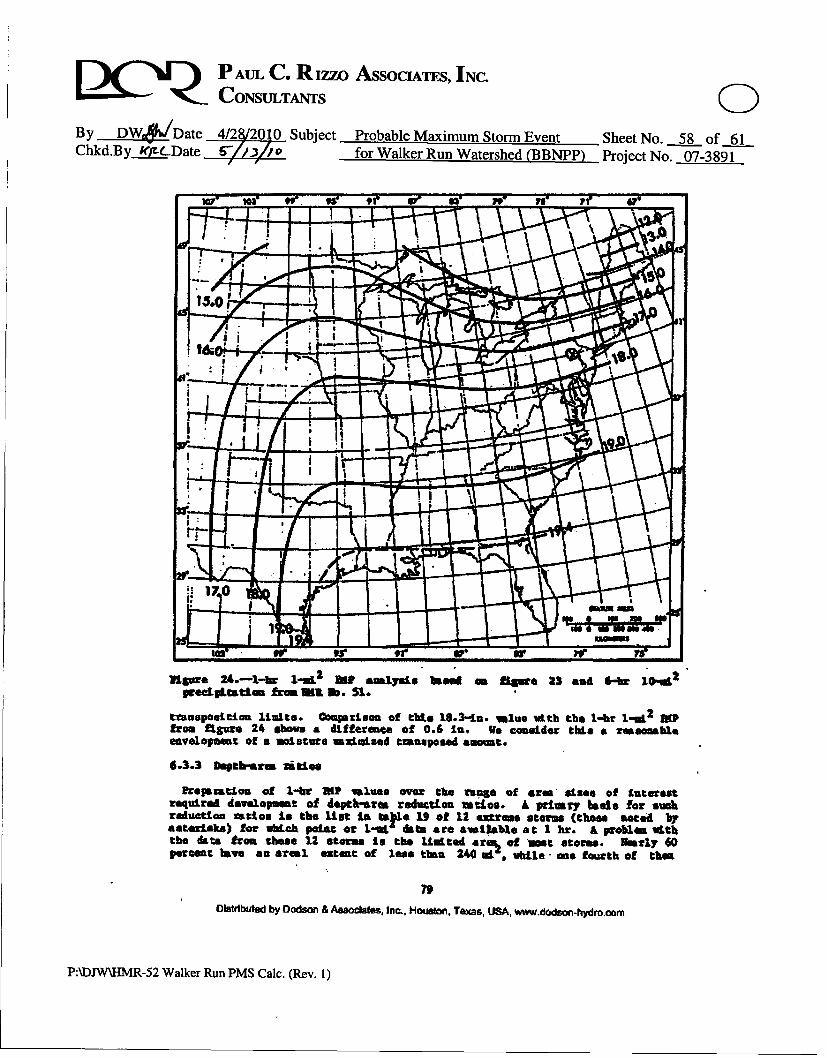
By DW,• Date 4/2/20]0 Subject Probable Maximum Storm Event Sheet No. 58 of 61Chkd.By jý&Date !1L-/10/ for Walker Run Watershed (BBNPP) Project No. 07-3891
VlUvre 24.1-1- Ih -l U P utsLyysi Ueed am fltwse 23 and 6-1r 10-a1 2
peaiptLstatim frm Sit 1b. $1.
trauspostmion limits. oiesr:son of this 18.3-Ln. alue vith the 1-hr I-sA2 1pfrom flgure 24 sboes a difference of 0.6 in. go consider thi a rasonmbloeavelopselt of a ioturs umaxltmzed trmaposed emount.
6.3.3 Depth-ares, vtios
keleutiou of 1-br PAP uluus ever the Van* of area stsee of interestrequired 4aewlopment of d4el0-atr reduta•on utlos. A primry baste for suchreduction atios Is the Ust Is tatle 19 of 12 extreme sterms (these noted byasetarLaks) for which poiat or L---date are awliable at I hr. A Frobla vitjhthe kta from theae 12 storme is the lim-ted aru of met *terme, Burly 60percent lave an areal extent of less than 240 w4 , wale "aoe fourth of theA
7bO(trstutedJ tyDOadson & Aasodlates, Inc-., Ho~st•.~ Texna, US•A, ww.dodscn-hydm.oom
P:\DJW\HMR-52 Walker Run PMS Calc. (Rev. 1)
r-)C-VD PAUL C. Rizzo ASSOCIATES, INC.CONSULTANTS 0
ByPDWJ? Date 4/28/2010 SubjectChkd.By 1L,- Date
Probable Maximum Storm Eventfor Walker Run Watershed (BBNPP)
Sheet No. 59 of 61Project No. 07-3891
UlS= 36.---tco mniJl7d of 5,- to 4"-u pre-pIttntn ued to o rtMA 35-dtl. (App1bI.e tosimn sine < 200 L..)
94Disriluted by Dodson & As.•Wo(8te, Inc., Housto. Texas, USA, ww.dofton-hydro.com
P:\DJW\HM-52 Walker Run PMS Calc. (Rev. 1)
pC14PAUL C. RIzzo AssocIATEs, INC.CONSULTANTS 0
By DWM V/Date 4/28/2010 Subject Probable Maximum Storm Event Sheet No. 60 of 61Chkd.By &zC Date - for Walker Run Watershed (BBNPP) Project No. 07-3891
R1swe 37.---ktLo malynde of IS- tAo I u pedsptaLm€on umAto obtn 1a -IS-alnMR. (heppcaMe to arm udl. < 1C0 ,O.)
b5OI~ltrlbuted by Ood~sou & Assocates, inc., Houstor, Taras, USA, wvw.dodumo-hycero.corn
P:\DJWUMR-52 Walker Run PMS Calc. (Rev. 1)
[~QQ~ PAUL C. Rizzo AssoCIAEs, INC.CONSULTANTS 0By DW 6 Date 4/28/2010 Subject Probable Maximum Storm Event Sheet No. 61 of 61Chkd.By-gc Date 5'3 "•,for Walker Run Watershed (BBNPP) Project No. 07-3891
WlSW 35-.fttlo e alYta of 30- to 60-4a peactpistics usd to ol1*! 30-imNO. (6gUabIe to am Lma 'C00 .@k-.)
V..
Diotributed by Dodwo & Assodatee. Ine. Vuswon, Texas, USA, www.dofton-hydro.com
P:\DJW\IR-52 Walker Run PMS Calc. (Rev. 1)