road safety in rural roads of two lanes seguridad vial en carreteras
TRANSCRIPT

Revista Ingeniería de Construcción RIC Vol 31 Nº1 2016 www.ricuc.cl
ENGLISH VERSION..................................................................................................................................................................................................................................................... Vol 31 Nº1 2016 www.ricuc.cl
ENGLISH VERSION.....................................................................................................................................................................................................................................................
Revista Ingeniería de Construcción Vol 31 Nº1 Abril de 2016 www.ricuc.cl 54
Road safety in rural roads of two lanes Seguridad vial en carreteras rurales de dos carriles
R. García 1*, L. Abreu *
* Universidad Central de Las Villas, Santa Clara, Villa Clara. CUBA
Fecha de Recepción: 14/07/2015 Fecha de Aceptación: 31/01/2016
PAG 54-60
Abstract This research was performed in order to evaluate road safety in rural two-lane roads of national interest in the province of Sancti Spíritus, from the method developed by Central University of Las Villas (UCLV); this study explores the accident rate, identifies the most dangerous sections and identifies risk factors in the most dangerous sections. This information will be used to formulate the possible actions to implement in that section. After the actions are approved by the governing bodies, and implemented, they can be evaluated for their effectiveness after a period of time. Keywords: Road safety, rural roads, accidents, dangerous, valuation
Resumen La presente investigación se realiza con el objetivo de evaluar la seguridad vial en carreteras rurales de dos carriles de interés nacional en la provincia de Sancti Spíritus, a partir del procedimiento desarrollado en la Universidad Central de Las Villas (UCLV), donde se realiza la caracterización de la accidentalidad, la identificación de los tramos de mayor peligrosidad y la identifican los factores de riesgos, en el tramos de mayor peligrosidad, para con esta información formular las posibles acciones a efectuar en el tramo, las cuales luego de su aprobación por los organismos rectores de la vialidad se implementan, y transcurrido un período de tiempo pueden ser evaluadas para comprobar su efectividad. Palabras clave: Seguridad vial, carreteras rurales, accidentalidad, peligrosidad, valoración
1. Introduction Reports from the Worldwide Health Organization (OMS in Spanish) state that annually 1.3 million people lose their lives due to traffic accidents and 50 million are left disabled. Countries with better results (Sweden, United Kingdom, Holland) have a rate of approximately 5 deaths per 100,000 inhabitants, whereas in Latin America and the Caribbean the rate is approximately 26 deaths per 100,000 inhabitants. According to the reports of the National Transportation Office for 2013, in Cuba there were 11,685 traffic accidents, causing the death of 685 people for a rate of 6.14 deaths per 100,000 inhabitants, with lower traffic flows than the countries referenced. Hence it is important to continue the work on the topic of roadway safety throughout the entire nation. Currently the most severe accidents are found in rural areas, on roads of national interest and particularly two-lane roads which represent 92% of the roadways in the country.
2. Development The correct detection of the risk factors that contribute to accidents comes from the analysis of the largest amount of information available, which involves obtaining information from prior research, reports of roadway administrators and possibly doing specific studies that can provide additional information to detect problems for roadway safety. Some researchers (Agent, 1973; Hauer & Persaud, 1984 & Nicholson, 1987) coincide in stating that the first actions regarding road safety should be focused on risk correction in locations where a large amount of accidents have occurred; therefore one of the most important steps is the identification of locations with the greatest deficiencies in roadway safety, where it is possible to reduce the number of accidents and their consequences. 2.1 Procedure applied to analyze road safety The procedure proposed is the description of the number of accident by using the road safety analysis method proposed by the Central University of Las Vilas (UCLV) (García, 2012), which is divided into steps and actions:
v Step I. Description of the number of accidents Delineation of the sections in the network of roads Determination of the period to be analyzed Gathering of primary information and processing Description, based on the number of accidents and the hazard ranking.
1 Corresponding Author:
Departamento de Ingeniería Civil, Facultad de Construcciones, Universidad Central de Las Villas, Santa Clara, Villa Clara, CUBA E-mail: [email protected]

Revista Ingeniería de Construcción RIC Vol 31 Nº1 2016 www.ricuc.cl
ENGLISH VERSION..................................................................................................................................................................................................................................................... Vol 31 Nº1 2016 www.ricuc.cl
ENGLISH VERSION.....................................................................................................................................................................................................................................................
Revista Ingeniería de Construcción Vol 31 Nº1 Abril de 2016 www.ricuc.cl 55
v Step II. Risk identification Review of data regarding the number of accidents Obtain additional data Determine risk factors v Step III. Analysis and proposal Proposal of possible improvements Evaluation and selection of corrective measures v Step IV. Implementation Implementation of the solution Valuation
2.2 Case study. Sancti Spíritus Province 2.2.1 Overview of the number of accidents in the Sancti Spíritus province According to reports from the province’s Commission of Road Administration and Traffic, the average annual number of accidents, deaths and injured on the nation’s rural two-lane highways in the Sancti Spíritus province for the period from 2003 to 2012 was 190 accidents, 18 deaths and 187 injured. Figure 1 presents the results per year. The year with the most problems in the number of accidents 2007, which coincides with the beginning of the reinstatement of traffic flow in that area. It is the year with the most accidents involving deaths and injuries, as well as accidents with injuries, according to the classification of
multiple authors (PIARC, 2003; Highway Safety Manual, 2010 y García, 2012). 2.3 Roadway safety analysis
v Characterization of the number of accidents 2.3.1 Delimitation of the sections of the road network The road network of national interest in the area of Sancti Spíritus spans 707.50 kilometers, according to Resolution 162/2007 of the National Traffic Center (CNV in Spanish). This network is divided into 73 sections according to geometric and traffic characteristics. The national two-lane roads cover 662.70 kilometers for 93.67 surpassing the national rate. 2.3.2 Determination of the analysis period The analysis period was chosen to be three years, from January 2010 through December 2012. 2.3.3 Collection of primary information and processing A total of 100% of the reports of traffic accidents that occurred on rural two-lane highways of national interest in the Sancti Spíritus province were processed, for a total of 547 forms. Errors present in the completion of the form, due to not fully completing the information requested, invalidated it, and it was not included in this research (Table 1).
Figure 1. Number of rural accidents in Sancti Spíritus
Table 1. Number of accidents in rural highways
Year Forms analyzed Frequency Deaths Injured
Accidents including:
Deaths Deaths and
Injured Injured
Only material damage
2010 186 162 18 169 10 3 94 55 2011 234 210 13 201 6 5 117 82 2012 197 175 17 186 7 7 94 67
TOTAL 617 547 48 556 23 15 305 204
Number of accidents in two-lane rural roads of national interest in Sancti Spíritus
Accidents
Deaths Injured
Revista Ingeniería de Construcción RIC Vol 31 Nº1 2016 www.ricuc.cl
ENGLISH VERSION..................................................................................................................................................................................................................................................... Vol 31 Nº1 2016 www.ricuc.cl
ENGLISH VERSION.....................................................................................................................................................................................................................................................
Revista Ingeniería de Construcción Vol 31 Nº1 Abril de 2016 www.ricuc.cl 56
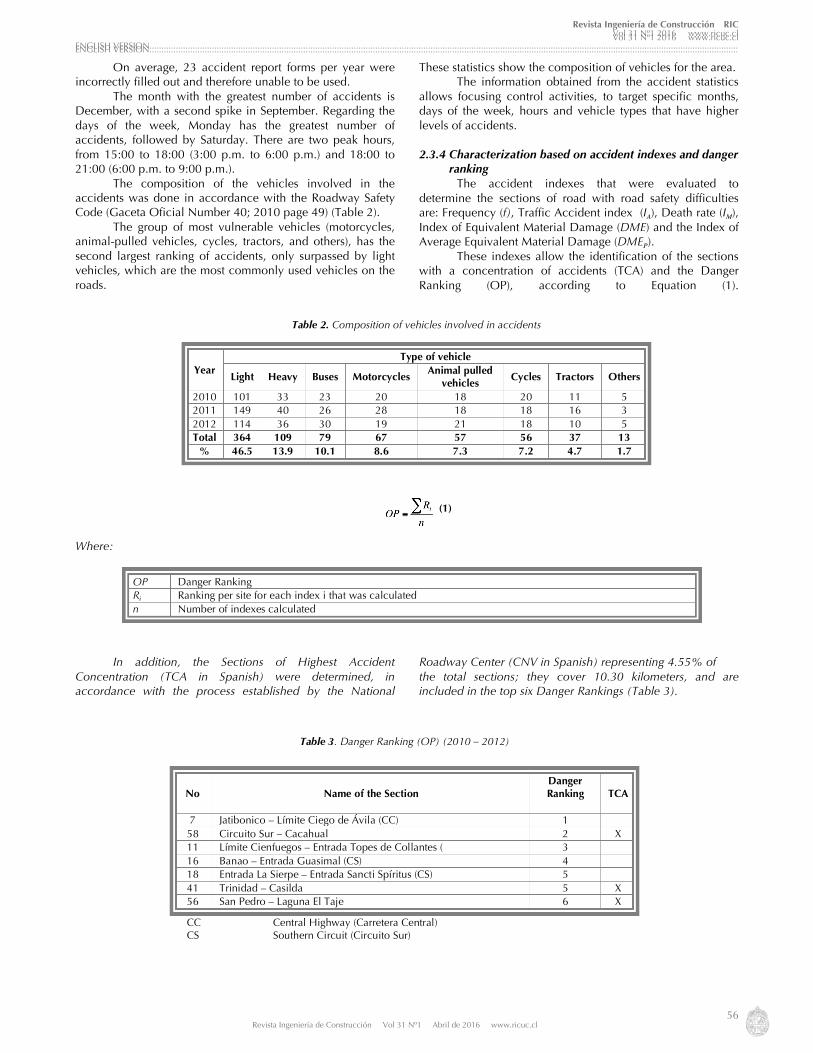
On average, 23 accident report forms per year were incorrectly filled out and therefore unable to be used. The month with the greatest number of accidents is December, with a second spike in September. Regarding the days of the week, Monday has the greatest number of accidents, followed by Saturday. There are two peak hours, from 15:00 to 18:00 (3:00 p.m. to 6:00 p.m.) and 18:00 to 21:00 (6:00 p.m. to 9:00 p.m.). The composition of the vehicles involved in the accidents was done in accordance with the Roadway Safety Code (Gaceta Oficial Number 40; 2010 page 49) (Table 2). The group of most vulnerable vehicles (motorcycles, animal-pulled vehicles, cycles, tractors, and others), has the second largest ranking of accidents, only surpassed by light vehicles, which are the most commonly used vehicles on the roads.
These statistics show the composition of vehicles for the area. The information obtained from the accident statistics allows focusing control activities, to target specific months, days of the week, hours and vehicle types that have higher levels of accidents. 2.3.4 Characterization based on accident indexes and danger ranking The accident indexes that were evaluated to determine the sections of road with road safety difficulties are: Frequency (f), Traffic Accident index (IA), Death rate (IM), Index of Equivalent Material Damage (DME) and the Index of Average Equivalent Material Damage (DMEP). These indexes allow the identification of the sections with a concentration of accidents (TCA) and the Danger Ranking (OP), according to Equation (1).
Where: In addition, the Sections of Highest Accident Concentration (TCA in Spanish) were determined, in accordance with the process established by the National
Roadway Center (CNV in Spanish) representing 4.55% of the total sections; they cover 10.30 kilometers, and are included in the top six Danger Rankings (Table 3).
Table 2. Composition of vehicles involved in accidents
Year Type of vehicle
Light Heavy Buses Motorcycles Animal pulled
vehicles Cycles Tractors Others
2010 101 33 23 20 18 20 11 5 2011 149 40 26 28 18 18 16 3 2012 114 36 30 19 21 18 10 5 Total 364 109 79 67 57 56 37 13
% 46.5 13.9 10.1 8.6 7.3 7.2 4.7 1.7
(1)
OP Danger Ranking Ri Ranking per site for each index i that was calculated n Number of indexes calculated
Table 3. Danger Ranking (OP) (2010 – 2012)
No Name of the Section Danger Ranking
TCA
7 Jatibonico – Límite Ciego de Ávila (CC) 1 58 Circuito Sur – Cacahual 2 X 11 Límite Cienfuegos – Entrada Topes de Collantes ( 3 16 Banao – Entrada Guasimal (CS) 4 18 Entrada La Sierpe – Entrada Sancti Spíritus (CS) 5 41 Trinidad – Casilda 5 X 56 San Pedro – Laguna El Taje 6 X
CC Central Highway (Carretera Central) CS Southern Circuit (Circuito Sur)
Revista Ingeniería de Construcción RIC Vol 31 Nº1 2016 www.ricuc.cl
ENGLISH VERSION..................................................................................................................................................................................................................................................... Vol 31 Nº1 2016 www.ricuc.cl
ENGLISH VERSION.....................................................................................................................................................................................................................................................
Revista Ingeniería de Construcción Vol 31 Nº1 Abril de 2016 www.ricuc.cl 57
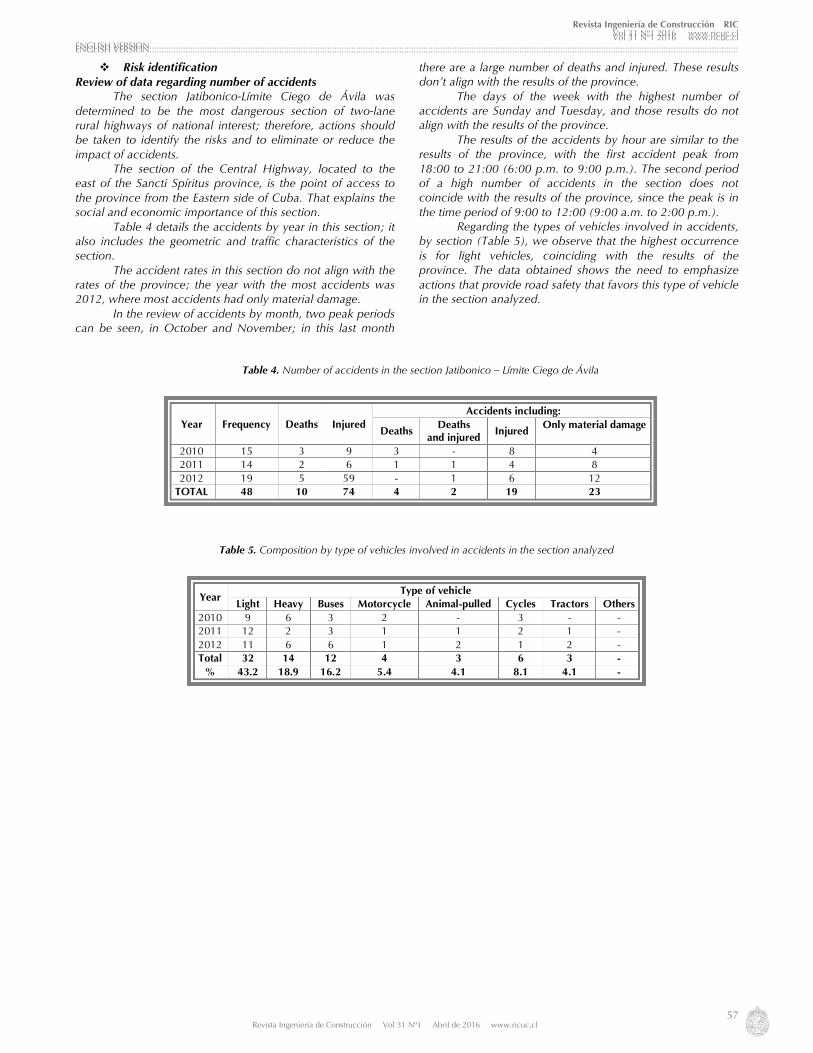
v Risk identification Review of data regarding number of accidents The section Jatibonico-Límite Ciego de Ávila was determined to be the most dangerous section of two-lane rural highways of national interest; therefore, actions should be taken to identify the risks and to eliminate or reduce the impact of accidents. The section of the Central Highway, located to the east of the Sancti Spíritus province, is the point of access to the province from the Eastern side of Cuba. That explains the social and economic importance of this section. Table 4 details the accidents by year in this section; it also includes the geometric and traffic characteristics of the section. The accident rates in this section do not align with the rates of the province; the year with the most accidents was 2012, where most accidents had only material damage. In the review of accidents by month, two peak periods can be seen, in October and November; in this last month
there are a large number of deaths and injured. These results don’t align with the results of the province. The days of the week with the highest number of accidents are Sunday and Tuesday, and those results do not align with the results of the province. The results of the accidents by hour are similar to the results of the province, with the first accident peak from 18:00 to 21:00 (6:00 p.m. to 9:00 p.m.). The second period of a high number of accidents in the section does not coincide with the results of the province, since the peak is in the time period of 9:00 to 12:00 (9:00 a.m. to 2:00 p.m.). Regarding the types of vehicles involved in accidents, by section (Table 5), we observe that the highest occurrence is for light vehicles, coinciding with the results of the province. The data obtained shows the need to emphasize actions that provide road safety that favors this type of vehicle in the section analyzed.
Table 4. Number of accidents in the section Jatibonico – Límite Ciego de Ávila
Year Frequency Deaths Injured Accidents including:
Deaths Deaths
and injured Injured
Only material damage
2010 15 3 9 3 - 8 4 2011 14 2 6 1 1 4 8 2012 19 5 59 - 1 6 12
TOTAL 48 10 74 4 2 19 23
Table 5. Composition by type of vehicles involved in accidents in the section analyzed
Year Type of vehicle
Light Heavy Buses Motorcycle Animal-pulled Cycles Tractors Others 2010 9 6 3 2 - 3 - - 2011 12 2 3 1 1 2 1 - 2012 11 6 6 1 2 1 2 - Total 32 14 12 4 3 6 3 -
% 43.2 18.9 16.2 5.4 4.1 8.1 4.1 -
Revista Ingeniería de Construcción RIC Vol 31 Nº1 2016 www.ricuc.cl
ENGLISH VERSION..................................................................................................................................................................................................................................................... Vol 31 Nº1 2016 www.ricuc.cl
ENGLISH VERSION.....................................................................................................................................................................................................................................................
Revista Ingeniería de Construcción Vol 31 Nº1 Abril de 2016 www.ricuc.cl 58
Indexes regarding the accident type were also obtained.
• Type of accidents: collision 77%, run over 8% and flip-overs 15%
• Geometric configuration: straight 73%, overpass 2%, other curves 4%, gradient changes 4%, intersection 2%, closed curve 6% and steepness 9%
• Environmental conditions: good weather 94% and light rain 6%
• Light: sunrise 2%, full daylight 50%, dusk 10%, good nighttime lighting 2% and not lit at night 36%
• Type of pavement: asphalt 100% • Surface conditions: normal 86%, wet 9% and with
potholes or cracks 5% • Road width: from five to nine meters 100% • Traffic signals installed: in good working order 98%
and there are none 2% • Visibility limits: good visibility 94% and parked
vehicles 6% An analysis of the amount of accidents in the section provides valuable information for the evaluation of the number of accident; this allows focusing control actions on the months, days of the week, times, types of vehicles most involved in accidents or on other elements. Obtaining additional data. Obtaining additional data for the section analyzed begins with analyzing all of the available information in the office, and then conduct a detailed inspection in the field, checking the following aspects:
• General topics: the highway is categorized according to geometric and functional characteristics; inadequate behavior of pedestrians, cyclists, animal-pulled vehicles and tractors; the pavement surface is deteriorated in some sections.
• Drainage: the design of the ditches in some areas isn’t aligned with the water usage, and they are obstructed; areas of vehicle access block the water flow; there are tubes with inadequate dimensions that are obstructed.
• Environment: fog is not usually present in this area; there are no trees or bushes that limit visibility; humidity on the land or pavement is not observed.
• Elements on the side of the road: bus stops are located correctly; there are some missing side rails; bridge parapets and manufacturing located near the roads.
• Speed: the designed speed is less than what is allowed in the section (90 km/h).
• Cross-section: the section is constant throughout the route, with narrowing of the road at some points; the transverse gradient of the lanes and the road allows the quick elimination of surface water.
• Alignment: the alignment of the plan and profile, and their combination, provides adequate distance for visibility.
• Intersections: the presence of intersections at the level of roadways of a lesser category, without traffic signals, with adequate visibility distances and a turning radius that allows movement without interfering with the nearby lanes.
• Ease of use for pedestrians: the section does not have adaptations for pedestrians, cyclists or other types of vehicles.
• Control signage: the vertical signage is adequate and in good working order; the horizontal signage is considered to be in bad shape or non-existent in some cases.
• Traffic: various vehicular combinations, with a large number of animal-drawn vehicles, motorcycles and tractors cause lines of cars that are waiting to pass other vehicles.
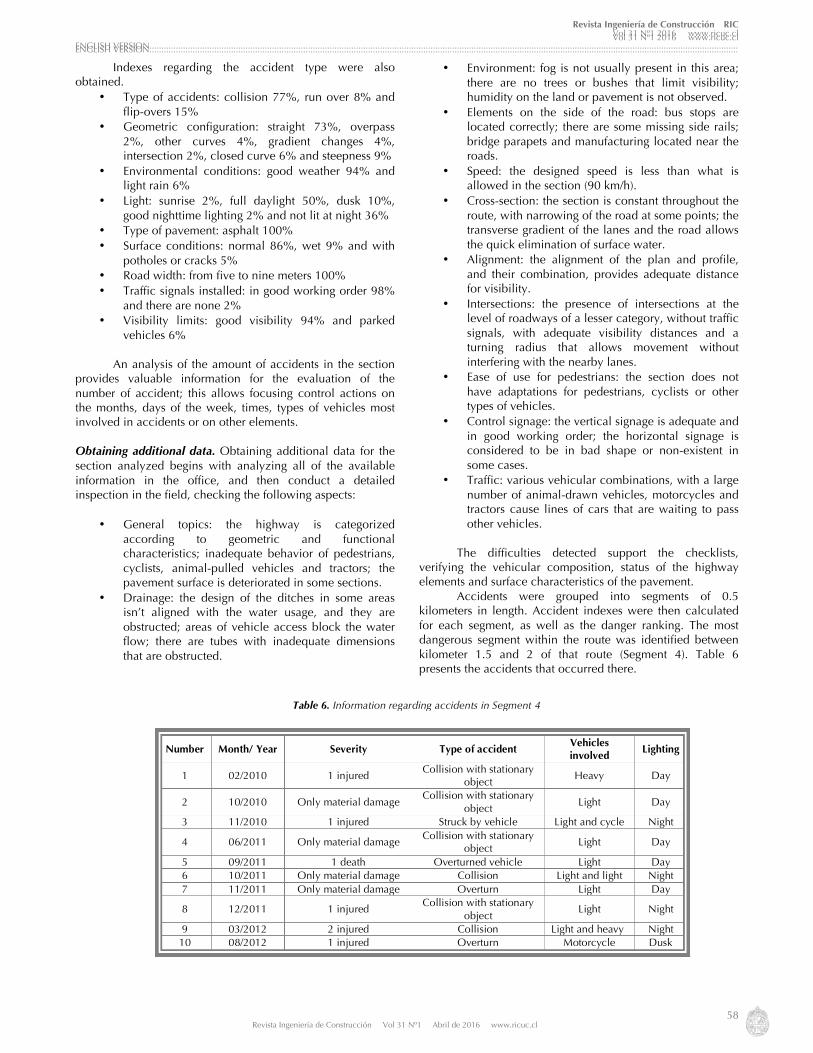
The difficulties detected support the checklists, verifying the vehicular composition, status of the highway elements and surface characteristics of the pavement. Accidents were grouped into segments of 0.5 kilometers in length. Accident indexes were then calculated for each segment, as well as the danger ranking. The most dangerous segment within the route was identified between kilometer 1.5 and 2 of that route (Segment 4). Table 6 presents the accidents that occurred there.
Table 6. Information regarding accidents in Segment 4
Number Month/ Year Severity Type of accident
Vehicles involved
Lighting
1 02/2010 1 injured Collision with stationary
object Heavy Day
2 10/2010 Only material damage Collision with stationary
object Light Day
3 11/2010 1 injured Struck by vehicle Light and cycle Night
4 06/2011 Only material damage Collision with stationary
object Light Day
5 09/2011 1 death Overturned vehicle Light Day 6 10/2011 Only material damage Collision Light and light Night 7 11/2011 Only material damage Overturn Light Day
8 12/2011 1 injured Collision with stationary
object Light Night
9 03/2012 2 injured Collision Light and heavy Night 10 08/2012 1 injured Overturn Motorcycle Dusk

Revista Ingeniería de Construcción RIC Vol 31 Nº1 2016 www.ricuc.cl
ENGLISH VERSION..................................................................................................................................................................................................................................................... Vol 31 Nº1 2016 www.ricuc.cl
ENGLISH VERSION.....................................................................................................................................................................................................................................................
Revista Ingeniería de Construcción Vol 31 Nº1 Abril de 2016 www.ricuc.cl 59
Determination of risk factors. The risk factors detected in Segment 4 are described below, and an example is shown in Figures 2 and 3:
• Lack of horizontal signage • Unlit segment • Pavement surface is deteriorated and worn away. • Difficulties with drainage • High operating speed for the type of area • Train overpass above the highway • High percentage of slow vehicles in the mix of
vehicles, which generates dangerous passing of vehicles
• Disorderly movement and circulation of the more vulnerable vehicles
The correct identification of risk factors based on available information, visits to the field, and the gathering of additional data, allows the creation of measures to assist with the reduction of accidents.
v Analysis and proposal Proposal of possible improvements. Possible improvements include:
• Creating horizontal signage • Maintenance of vertical signage • Completion of vertical signage
• Illumination throughout the entire segment, giving priority to the area of the train overpass.
• Repaving of the entire segment • Reopening and repair of ditches • Treatments for the current vehicular intersections • Increase police controls
Evaluation and selection of corrective measures The proposed measures were reviewed in the technical council of the province’s Traffic Center, and agreement was reached to immediately implement the measures that require less financial support and to include the rest in the technical plans for the Jatibonico Municipality for 2015.
v Implementation Implementation of the solution. The approved corrective measures were implemented in the segment during the second semester of 2014, under the supervision of the Municipal Mayor of CPV, without negative impacts for the road’s safety and with the quality required. This included: the implementation of horizontal signage, maintenance of vertical signage, completion of vertical signage, reopening and repair of ditches and the treatment of the intersection. Valuation. It is necessary to wait for a period of time after the corrective measures have been implemented in order to quantify the accident performance in the segment; this was not possible within this study.
Figure 2. View of Segment 4
Figure 3. Views of Segment 4
Revista Ingeniería de Construcción RIC Vol 31 Nº1 2016 www.ricuc.cl
ENGLISH VERSION..................................................................................................................................................................................................................................................... Vol 31 Nº1 2016 www.ricuc.cl
ENGLISH VERSION.....................................................................................................................................................................................................................................................
Revista Ingeniería de Construcción Vol 31 Nº1 Abril de 2016 www.ricuc.cl 60
3. Conclusions
• Rural vehicle accidents in the Sancti Spíritus province were described based on information from traffic accident report forms, allowing the determination of patterns of accidents by month, day, hour and type of vehicle.
• The use of a combination of indexes allowed the determination and ranking of sections with the greatest safety gaps; this allows focusing efforts, material and financial resources on those high impact areas.
• When describing the accidents in the Sancti Spíritus province, it is possible to identify the segments of the two-lane rural roads with the greatest safety challenges; they were ranked based on their danger to focus efforts and focus on those areas where the
implementation of measures will have a greater impact
• Once the section of rural road with the highest risk was determined, a series of risk identification steps were implemented; an analysis of the traffic accidents which occurred during the period of study, as well as additional studies that complement this information were fundamental for a more precise valuation of the problem.
• By applying the process developed by the Universidad Central de Las Villas for the evaluation of road safety for two-lane rural roads of national interest in the highest risk segment in the Sancti Spíritus province; the highway segments were identified where it is necessary to rectify the possible risks so as to reduce the number of accidents.
4. References Agent K. (1973), Evaluation of the high accident location spot improvement program in Kentucky. Bureau of Highways. Report 357. Kentucky,
USA. García R. (2012), Procedimiento para la valoración de la seguridad vial en carreteras rurales de interés nacional. [PhD Tesis], Universidad
Central “Marta Abreu” de Las Villas, Villa Clara, Cuba. Hauer E. y Persaud B. (1984), Problem of identifying hazardous locations using accident data.Transportation Research Record 975,
Transportation Research Board. Washington, DC. USA. pp 36-42. Highway Safety Manual (HSM) (2010), Highway Safety Manual. American Association of State Highway and Transportation Officials. Primera
edición Vol. 2. pp 10-1 10-75. Nicholson A. (1987), The estimation of accident rates and countermeasures affectiviness. Traffic Engineering & Control. V28, N10, pp 518-523. Piarc (2003), Road Safety Manual. World Road Association. Technical Committee on Road Safety (C13). Route Market. Quebec, Canadá. 604 p.