roland berger trend compendium · compiled by roland berger institute (rbi), the think ... 78.3...
TRANSCRIPT

February 2018
Roland Berger Trend Compendium 2030 Megatrends 1-7 Compact version

2 Roland Berger Trend Compendium 2030 - Trends 1-7 Compact version.pptx
About the Roland Berger Trend Compendium 2030
What is it?
> The Roland Berger Trend Compendium 2030 is a
global trend study compiled by Roland Berger Institute (RBI), the think tank of Roland Berger
> It describes the
most important megatrends that will shape the world between now and 2030
> The megatrends have a broad impact on the environment of companies, strongly influencing
challenges and opportunities of their business
Our approach
> We first screened relevant trend, scenario and future
studies worldwide
> Then we verified, analyzed and
consolidated the results, using them to
define the megatrends
> Next, we broke down the megatrends into
subtrends, looking at each from a global
perspective and the viewpoints of
industrialized and developing countries

3 Roland Berger Trend Compendium 2030 - Trends 1-7 Compact version.pptx
It covers seven megatrends that shape the future development of our world
Demographic dynamics
Globalization & future markets
Scarcity of resources
Climate change & ecosystem at risk
Dynamic technology & innovation
Global knowledge society
Sustainability & global responsibility
Megatrends
1 2 3 4 5 6 7

Megatrend 1 Demographic dynamics
Roland Berger Trend Compendium 2030

5 Roland Berger Trend Compendium 2030 - Trends 1-7 Compact version.pptx
Demographic dynamics are a global game changer for all economies and societies – There are four key subtrends
T1 Demographic dynamics: Subtrends
Growth – Global population on the rise
Young vs. old countries – A world full of contrasts
Migration – A world on the move
Urbanization – Megacities vs. wasteland
Subtrends of megatrend "Demographic dynamics"

6 Roland Berger Trend Compendium 2030 - Trends 1-7 Compact version.pptx
The global population will grow by almost 1.2 billion between 2015 and 2030 – But the speed of growth is slowing down
T1.1 Growth – Global population on the rise
Developing countries
Developed countries
World population1) 2015-2030 [bn]
6.1
15.8%
2030
8.6
1.3
7.3
2015
7.4
1.3
World
14
18
16
12
8
6
4
2
0
10
2100 2050 2000 1950 1900 1850 1800
1927: 2
2024: 8
1999: 6
World population 1800-2100 [bn]
+18.5%
1974: 4 2017: 7.6
2100: 11
Medium fertility variant High/Low fertility variant
Source: United Nations World Population Prospects: The 2017 Revision, HYDE
+2.9%
1) 2030 data: medium fertility variant

7 Roland Berger Trend Compendium 2030 - Trends 1-7 Compact version.pptx
Average population growth p.a. [m]1)
2.00 – 2.99 1.00 – 1.99 0.00 – 0.99 < 0.00 > 3.00
Nearly 30% of total global population growth between now and 2030 will take place in just three countries: India, Nigeria and Pakistan
T1.1 Growth – Global population on the rise
Key countries in terms of average population growth/decline 2015-2030 [m]
Source: United Nations World Population Prospects: The 2017 Revision
1) Medium fertility variant
8 Roland Berger Trend Compendium 2030 - Trends 1-7 Compact version.pptx
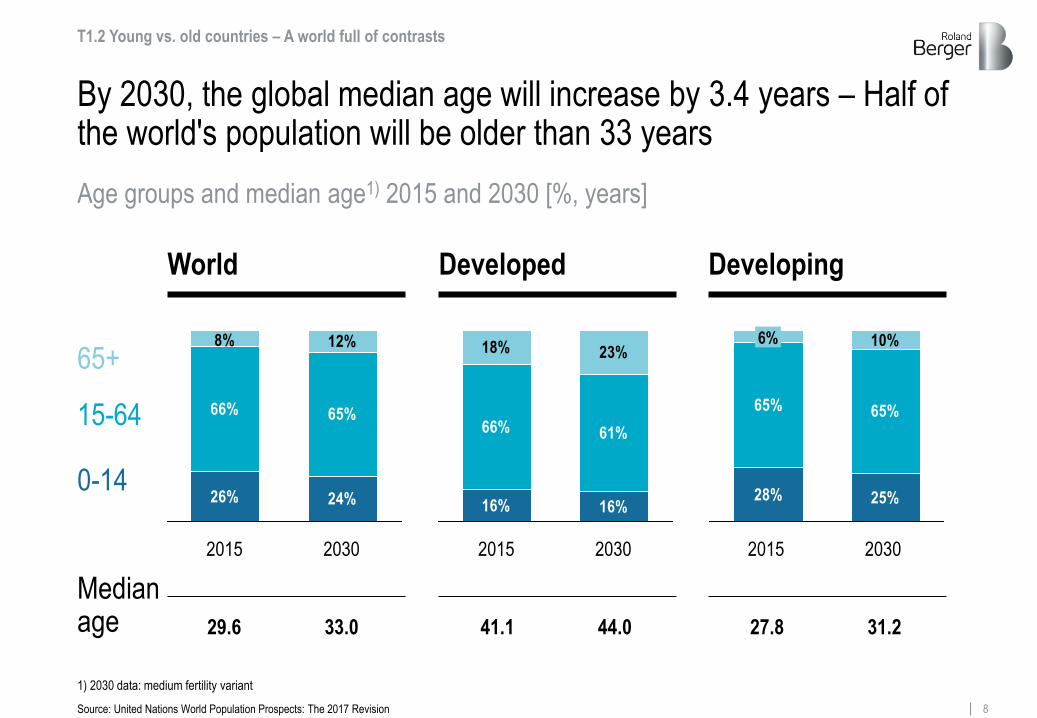
By 2030, the global median age will increase by 3.4 years – Half of the world's population will be older than 33 years
2015 2030
26% 24%
8% 12%
65%66%
29.6 33.0
World
16% 16%
18% 23%
61%66%
Developed
28% 25%
65%65%
10%6%
Developing
2015 2030 2015 2030
27.8 31.2 41.1 44.0
65+
0-14
15-64
Median age
T1.2 Young vs. old countries – A world full of contrasts
Age groups and median age1) 2015 and 2030 [%, years]
Source: United Nations World Population Prospects: The 2017 Revision
1) 2030 data: medium fertility variant

9 Roland Berger Trend Compendium 2030 - Trends 1-7 Compact version.pptx
25,000
45,000
35,000
15,000
5,000
0
The upside of demographics: In developed countries, the elderly save less and spend more
World High-income countries Low and middle income countries
Annual flows per capita
Age
CONSUMPTION
LABOR INCOME
0 10 20 30 40 50 60 70 80 90
Per capita consumption and labor income by age1) [PPP 2010 USD, years]
> Labor income and consumption levels change during a person's lifetime
> In high-income countries consumption has a high plateau between 60 and 80 and increases markedly from the age of 80
> In low and middle income countries spending slightly decreases in old age
T1.2 Young vs. old countries – A world full of contrasts
Source: National Transfer Accounts
1) Aggregating most recent country data ranging from 2005 to 2015

10 Roland Berger Trend Compendium 2030 - Trends 1-7 Compact version.pptx
International migration flows remain but are expected to decrease towards 2030
T1.3 Migration – A world on the move
Africa
Oceania
Asia
Europe Northern America
Latin America and the Caribbean
2000-2015 2015-2030
-22.8 -23.4
21.4
14.1
-6.9 -8.7
17.5 18.1
-4.4 -10.0
2.4 2.5
Source: United Nations World Population Prospects: The 2017 Revision
Selected net migration 2000-2015 vs. 2015-20301) [m]
1) 2030 data: medium fertility variant

11 Roland Berger Trend Compendium 2030 - Trends 1-7 Compact version.pptx
Since 2000, the number of international migrants has strongly increased – Only a minority of them are refugees
Development of international migrants1) and refugees2) 2000-2015 [m]
Migrants
1) According to the UN definition, an international migrant is any person who changes his or her country of usual residence for a period of at least three months 2) According to the UN definition, refugees are people owing to a well-founded fear of being persecuted for reasons of race, religion, nationality, membership of a particular social group or political opinion and being outside the country of their nationality. 3.8 million (2000) and 5.3 million (2015) of the refugees were Palestinians (incl. Palestinian population in the Gaza Strip and West Bank)
Refugees
2000 172.7 Million
2015 243.7 Million
15.9 Million 20.7 Million
+ 41.1%
T1.3 Migration – A world on the move
Source: UNESA, UNRWA, UNHCR

12 Roland Berger Trend Compendium 2030 - Trends 1-7 Compact version.pptx
81.5 78.3 74.2
The number of people living in urban areas continues to increase, especially in developing regions
Development of the share of people living in urban areas, 2000-20301) [%]
46.6
+6.0 pps
60.0 54.0
2015 2030 2000 2015 2030 2000 2015 2030 2000
World Developed Developing
+7.2 pps
49.0 56.2
39.9
1) Data of 2030 according to the medium fertility variant of UN's forecast. The definition of urban areas follows the definitions that are used in each country. These definitions can vary widely. The criteria for classifying an area as urban may be based on one or a combination of characteristics, such as: a minimum population threshold, population density, proportion employed in non-agricultural sectors, the presence of infrastructure such as paved roads, electricity, piped water or sewers, and the presence of education or health services
+7.4 pps +9.1 pps
+3.2 pps +4.1 pps
T1.4 Urbanization – Megacities vs. wasteland
Source: UN World Urbanization Prospects: The 2014 Revision

13 Roland Berger Trend Compendium 2030 - Trends 1-7 Compact version.pptx
By 2030, more than half of the 15 biggest urban agglomerations will be located in Asia, with Tokyo still being the largest megacity of all
Population development of the 15 biggest urban agglomerations 2015-20301) [m]
T1.4 Urbanization – Megacities vs. wasteland
Dhaka 2015: 17.6 2030: 27.4
Mexico City 2015: 21.0 2030: 23.9
New York City 2015: 18.6 2030: 19.9
São Paulo 2015: 21.1 2030: 23.4
Karachi 2015: 16.6 2030: 24.8
Lagos 2015: 13.1 2030: 24.2
Kolkata 2015: 14.9 2030: 19.1
Mumbai 2015: 21.0 2030: 27.8
Delhi 2015: 25.7 2030: 36.1
Cairo 2015: 18.8 2030: 24.5
Beijing 2015: 20.4 2030: 27.7
Kinshasa 2015: 11.6 2030: 20.0
Tokyo 2015: 38.0 2030: 37.2
Osaka 2015: 20.2 2030: 20.0
Shanghai 2015: 23.7 2030: 30.8
= 2015 = 2030
1) 15 biggest urban agglomerations in 2030 in descending order: Tokyo, Delhi, Shanghai, Mumbai (Bombay), Beijing, Dhaka, Karachi, Cairo, Lagos, Mexico City, São Paulo, Kinshasa, Osaka, New York City and Kolkata
Source: UN World Urbanization Prospects: The 2014 Revision
14 Roland Berger Trend Compendium 2030 - Trends 1-7 Compact version.pptx
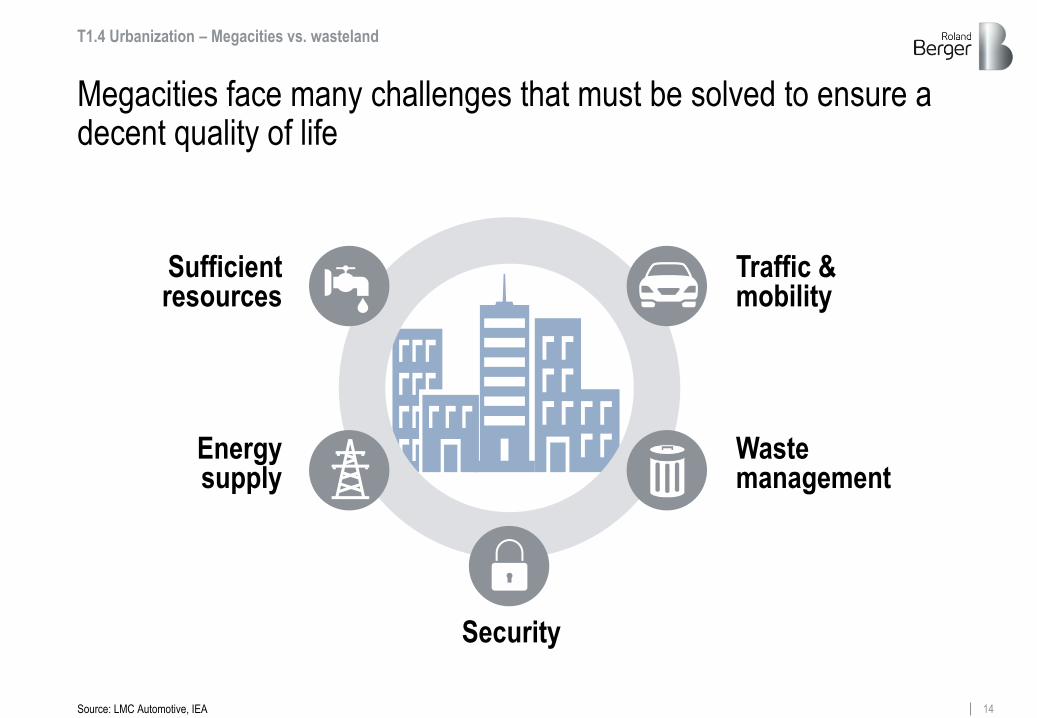
Megacities face many challenges that must be solved to ensure a decent quality of life
Traffic & mobility
Sufficient resources
Security
Energy supply
Waste management
T1.4 Urbanization – Megacities vs. wasteland
Source: LMC Automotive, IEA

Megatrend 2 Globalization & future markets
Roland Berger Trend Compendium 2030
16 Roland Berger Trend Compendium 2030 - Trends 1-7 Compact version.pptx
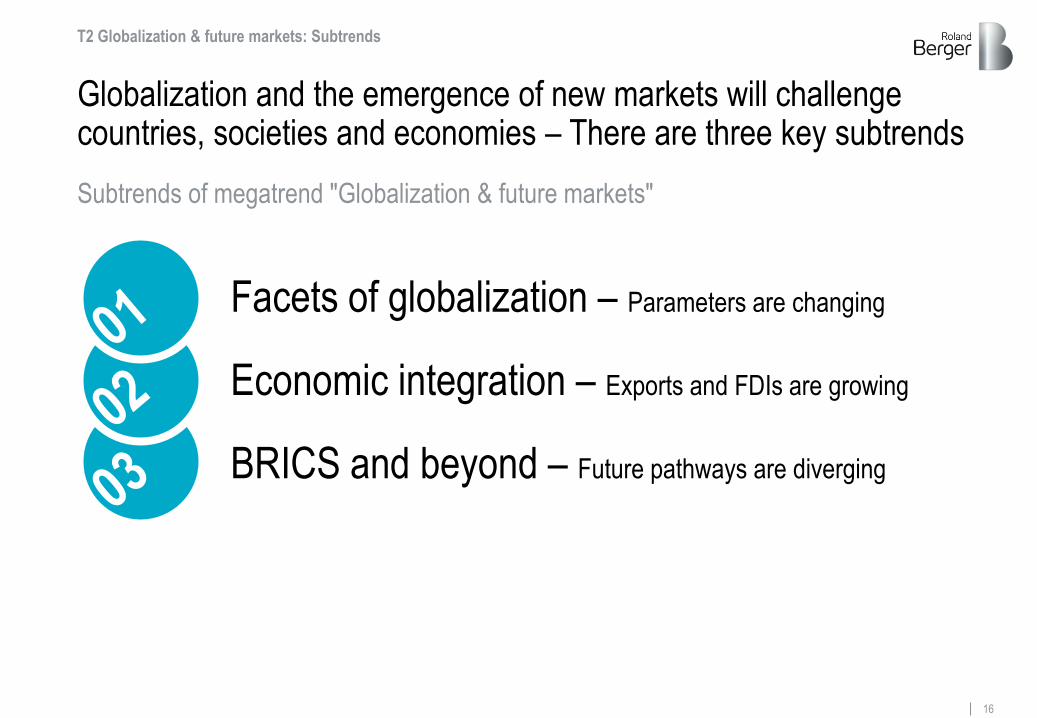
Globalization and the emergence of new markets will challenge countries, societies and economies – There are three key subtrends
T2 Globalization & future markets: Subtrends
Facets of globalization – Parameters are changing
Economic integration – Exports and FDIs are growing
BRICS and beyond – Future pathways are diverging
Subtrends of megatrend "Globalization & future markets"

17 Roland Berger Trend Compendium 2030 - Trends 1-7 Compact version.pptx
Globalization should be understood and analyzed in all its economic, political and social facets
> Imports and exports
> Trade agreements
> Cross-border investments
> Growth opportunities for developing countries
> Process of digitalization
> Globalized and connected society
> Linkage of governments
> Increasing reciprocity
> Trend of protectionism
T2.1 Facets of globalization – Parameters are changing
18 Roland Berger Trend Compendium 2030 - Trends 1-7 Compact version.pptx
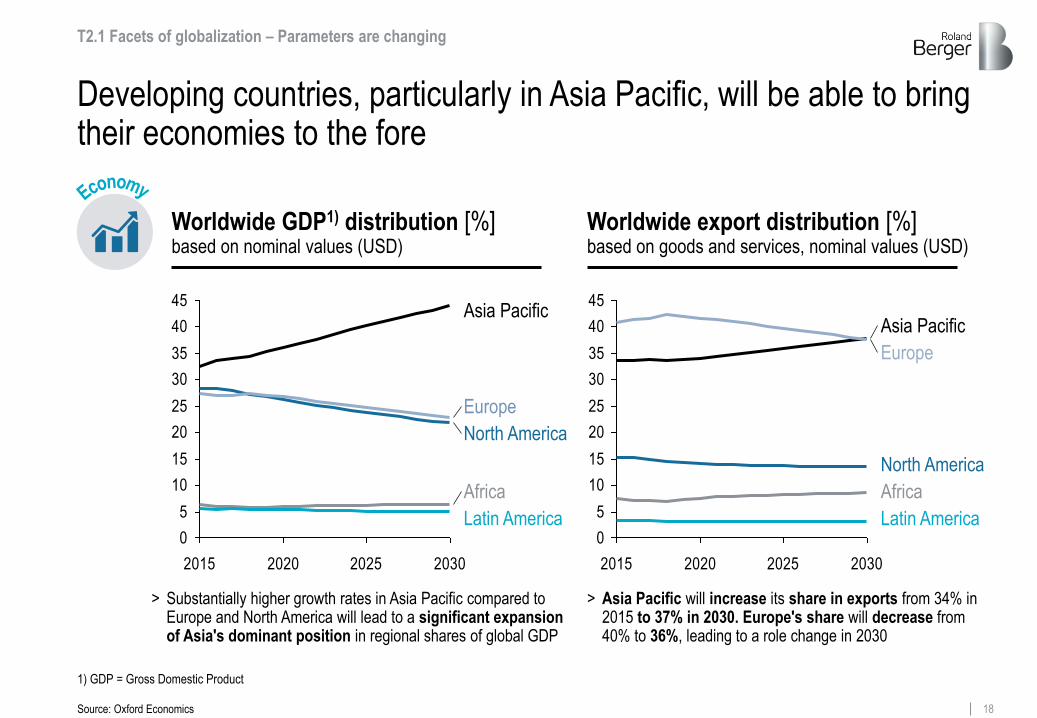
Developing countries, particularly in Asia Pacific, will be able to bring their economies to the fore
Worldwide GDP1) distribution [%] based on nominal values (USD)
Worldwide export distribution [%] based on goods and services, nominal values (USD)
> Substantially higher growth rates in Asia Pacific compared to Europe and North America will lead to a significant expansion of Asia's dominant position in regional shares of global GDP
> Asia Pacific will increase its share in exports from 34% in 2015 to 37% in 2030. Europe's share will decrease from 40% to 36%, leading to a role change in 2030
0
5
10
15
20
25
30
35
40
45
2015 2020 2025 2030
Europe
Asia Pacific
Latin America
North America
Africa
0
5
10
15
20
25
30
35
40
45
2015 2020 2025 2030
Africa
Europe
Asia Pacific
Latin America
North America
T2.1 Facets of globalization – Parameters are changing
Source: Oxford Economics
1) GDP = Gross Domestic Product
19 Roland Berger Trend Compendium 2030 - Trends 1-7 Compact version.pptx
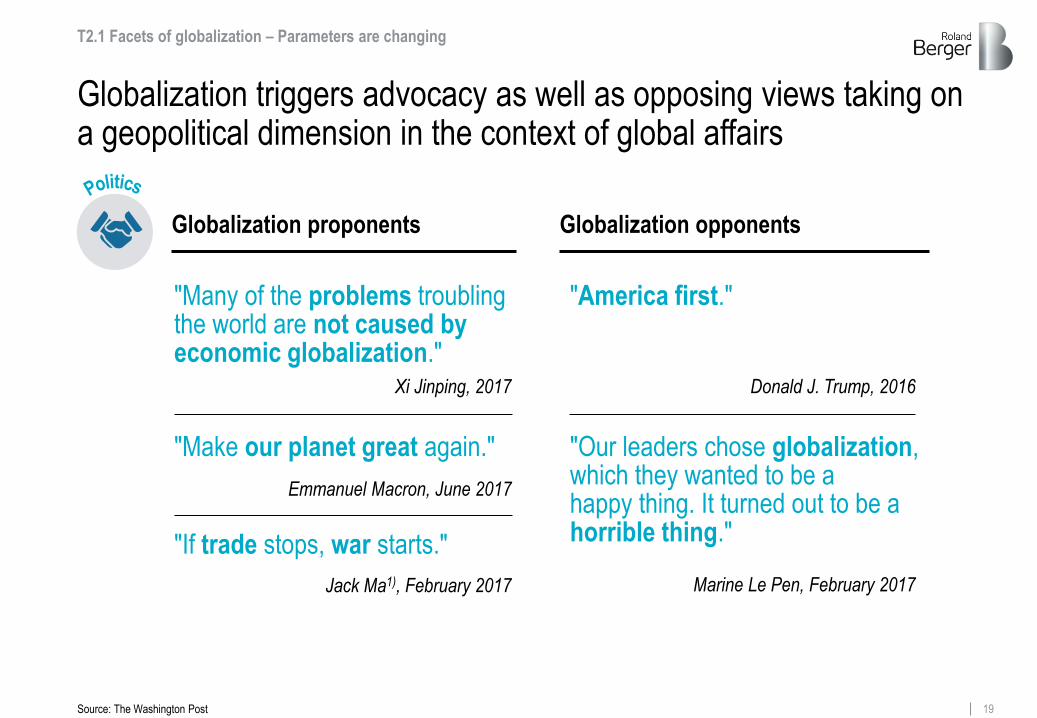
Globalization triggers advocacy as well as opposing views taking on a geopolitical dimension in the context of global affairs
T2.1 Facets of globalization – Parameters are changing
Globalization proponents Globalization opponents
Source: The Washington Post
"Make our planet great again."
"America first."
"Our leaders chose globalization, which they wanted to be a happy thing. It turned out to be a horrible thing."
Emmanuel Macron, June 2017
Donald J. Trump, 2016
Marine Le Pen, February 2017
"If trade stops, war starts."
Jack Ma1), February 2017
"Many of the problems troubling the world are not caused by economic globalization."
Xi Jinping, 2017

20 Roland Berger Trend Compendium 2030 - Trends 1-7 Compact version.pptx
Finally, digitalization and growing global data traffic has the potential to change key parameters of globalization
49
35
24
17
117
4
CAGR +52%
2021 2020 2019 2018 2017 2016 2015
> Growing interconnection between countries
> Data flows form the basis of economic and social interaction
> Asia Pacific will take over largest portion of data traffic
> 71% of internet users already come from developing countries
T2.1 Facets of globalization – Parameters are changing
Global mobile data traffic [Exabytes per month]
Digitalization changes markets & societies
Note: CAGR = Compound annual growth rate
Source: Cisco, Euromonitor, ITU

21 Roland Berger Trend Compendium 2030 - Trends 1-7 Compact version.pptx
Global trade flows show strong inter- and intraregional relationships
Interregional and intraregional merchandise exports, 2016 [bn USD, %]
Source: WTO
T2.2 Economic integration – Exports and FDIs are growing
Russia/CIS Total: 421
Asia Pacific Total: 5,274
52%
18%
North America Total: 2,215
South and Central America Total: 512
Africa Total: 348
Europe Total: 5,948
Middle East Total: 776
50%
Interregional merchandise exports [USD bn] Bubble: size = total merchandise exports f.o.b., light blue section = intraregional share (exports between countries inside a specific region); dark blue section = interregional share (exports between regions) 100-300 300-800 >800
22% 20%
69%
11%

22 Roland Berger Trend Compendium 2030 - Trends 1-7 Compact version.pptx
2015
22
Exports of goods and services as share of GDP are already at a high level – The global average will see little growth
Source: Oxford Economics
15.2% 18.7%
South/Central America
Europe Russia/
CIS
Africa
Middle East
Asia Pacific
North America 43.1% 51.1%
16.4% 17.5%
31.5% 32.3% 29.1%
25.6%
44.7% 53.1%
22.0% 25.6%
World
28.1% 29.8%
2030
Exports, goods and services as share of GDP (nominal) 2015 and 2030
T2.2 Economic integration – Exports and FDIs are growing
23 Roland Berger Trend Compendium 2030 - Trends 1-7 Compact version.pptx
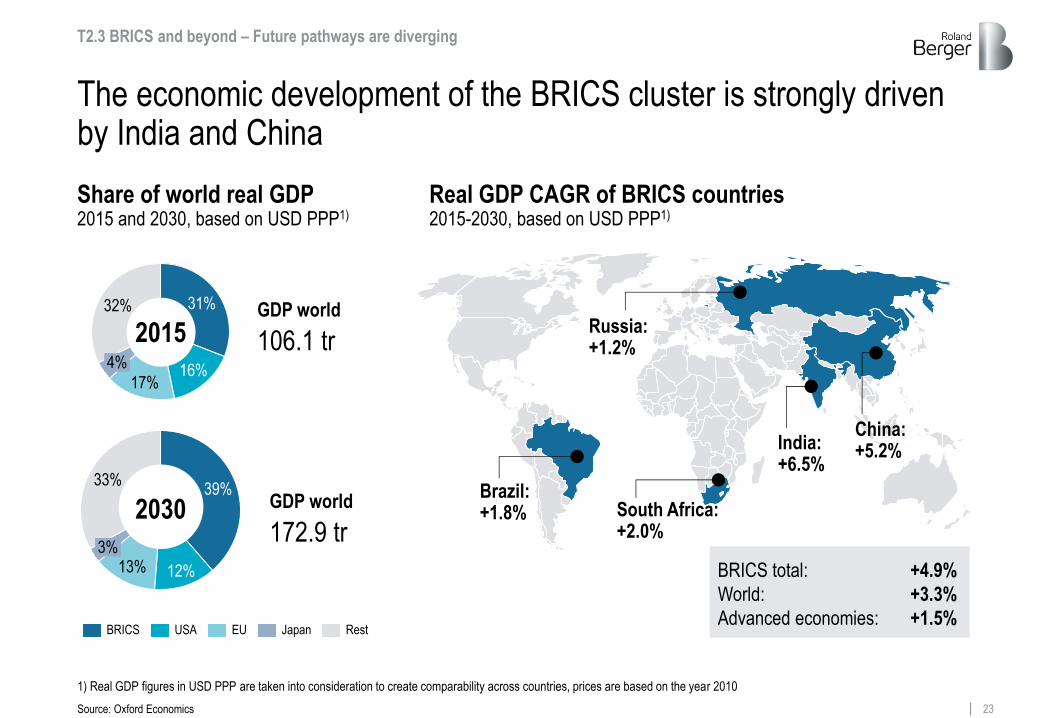
The economic development of the BRICS cluster is strongly driven by India and China
Real GDP CAGR of BRICS countries 2015-2030, based on USD PPP1)
Brazil: +1.8%
South Africa: +2.0%
Russia: +1.2%
India: +6.5%
China: +5.2%
Share of world real GDP 2015 and 2030, based on USD PPP1)
BRICS total:
World:
Advanced economies:
+4.9%
+3.3%
+1.5%
T2.3 BRICS and beyond – Future pathways are diverging
Source: Oxford Economics
1) Real GDP figures in USD PPP are taken into consideration to create comparability across countries, prices are based on the year 2010
17%
4% 16%
31% 32%
12% 13% 3%
39% 33%
Japan USA EU BRICS Rest
GDP world
106.1 tr
GDP world
172.9 tr
2015
2030
24 Roland Berger Trend Compendium 2030 - Trends 1-7 Compact version.pptx
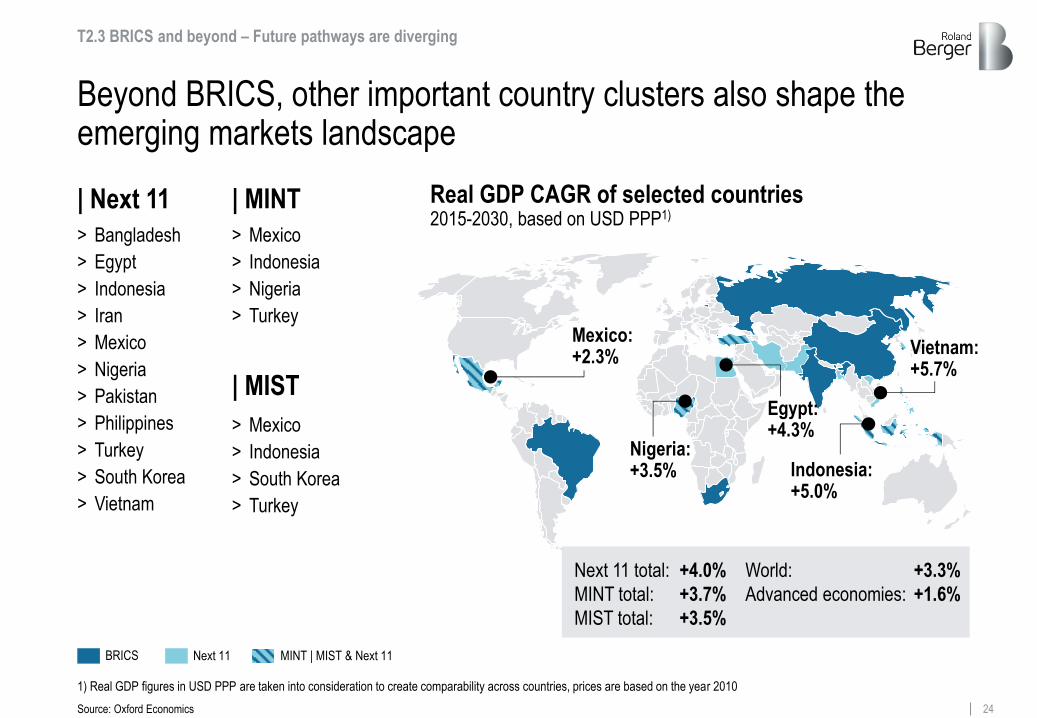
Beyond BRICS, other important country clusters also shape the emerging markets landscape
BRICS Next 11 MINT | MIST & Next 11
Real GDP CAGR of selected countries 2015-2030, based on USD PPP1)
Next 11 total:
MINT total:
MIST total:
+4.0%
+3.7%
+3.5%
Nigeria: +3.5%
Mexico: +2.3%
Egypt: +4.3%
Vietnam: +5.7%
Indonesia: +5.0%
T2.3 BRICS and beyond – Future pathways are diverging
Source: Oxford Economics
| Next 11
> Bangladesh
> Egypt
> Indonesia
> Iran
> Mexico
> Nigeria
> Pakistan
> Philippines
> Turkey
> South Korea
> Vietnam
> Mexico
> Indonesia
> Nigeria
> Turkey
> Mexico
> Indonesia
> South Korea
> Turkey
| MIST
| MINT
World:
Advanced economies:
+3.3%
+1.6%
1) Real GDP figures in USD PPP are taken into consideration to create comparability across countries, prices are based on the year 2010

Megatrend 3 Scarcity of resources
Roland Berger Trend Compendium 2030

26 Roland Berger Trend Compendium 2030 - Trends 1-7 Compact version.pptx
Scarcity of resources leads to global challenges – There are three key subtrends
T3 Scarcity of resources: Subtrends
Energy – GDP growth in emerging markets is fueling the demand for energy
Water and food – Satisfying the world's hunger and thirst with limited sources
Other commodities – Mastering regional imbalances
Subtrends of megatrend "Scarcity of resources"

27 Roland Berger Trend Compendium 2030 - Trends 1-7 Compact version.pptx
Global primary energy demand will increase by 17% to 2030 –predominantly driven by strong growth of demand in Asian countries
Evolution of primary energy demand 2015-2030 By sources [Gtoe1)] and by regions [Mtoe1)]
Fossil fuels Renewable & Others
+ 17%
14.2
16.7
79.1%
81.5%
14.3%
4.8%
13.7%
6.3%
2030
2015
GDP Growth
Population Growth
Urbanization
Expanding middle class
Energy efficiency gains
Sectoral Change
Drivers of Demand
T3.1 Energy – GDP growth in emerging markets is fueling the demand for energy
China
1,966 2,400
Asia/Pacific (excl. China, India)
2,990
3,744
India
1,309 883
2015 2030 Nuclear
1) Gtoe = Gigatonnes of oil equivalent, Mtoe = Megatonnes of oil equivalent
Source: ExxonMobil, Roland Berger

28 Roland Berger Trend Compendium 2030 - Trends 1-7 Compact version.pptx
North America, CIS and Austral-Asia have the largest energy resources – Middle East with strong reserves, but small resources
Reserves1)
Resources2)
Cumulative production
191 124 36 52
192 77
2,385
4,658 410
110
57
181
40 32
298
230 87
4,743
46 22
192
T3.1 Energy – GDP growth in emerging markets is fueling the demand for energy
1) Reserves: Deposits which are known in detail and can be recovered economically using current technologies 2) Resources: Deposits which are either proved but are at present not economically recoverable, or which are not demonstrated, but can be expected for geological reasons
Source: BGR
Fossil energy production, reserves and resources, 2015 [Gtoe]
Resources: Reserves: Production 2015: Cumulative production until 2015:
12,906 918 12
451
29 Roland Berger Trend Compendium 2030 - Trends 1-7 Compact version.pptx
4,500 2,500 2,000 1,500 1,000 500 0
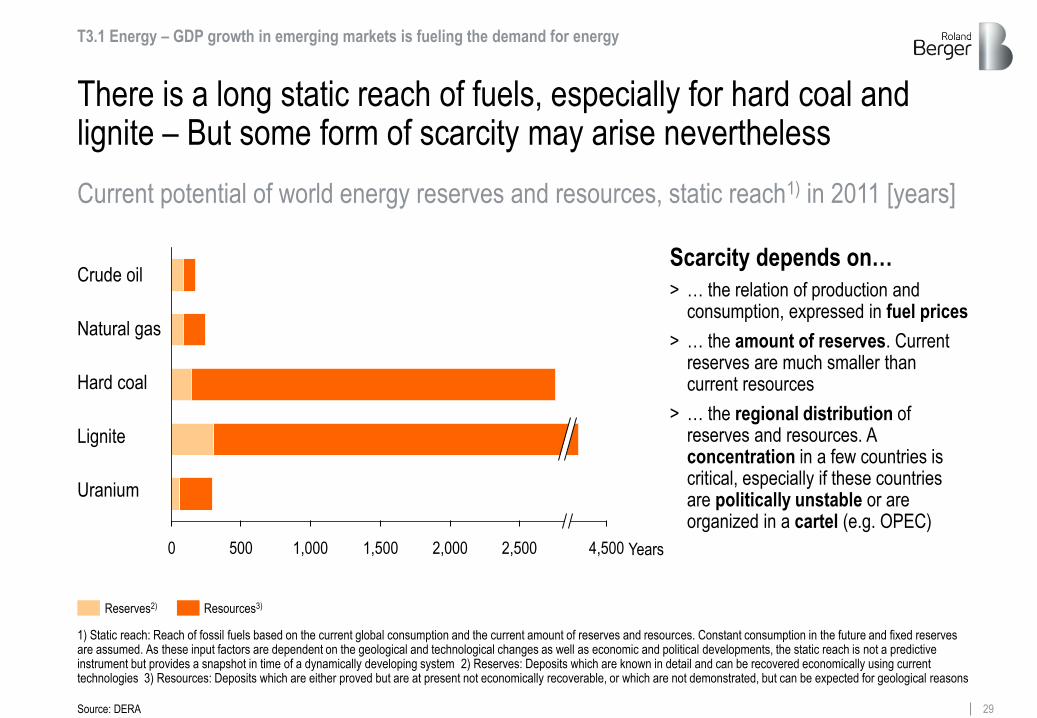
There is a long static reach of fuels, especially for hard coal and lignite – But some form of scarcity may arise nevertheless
Current potential of world energy reserves and resources, static reach1) in 2011 [years]
Scarcity depends on…
> … the relation of production and consumption, expressed in fuel prices
> … the amount of reserves. Current reserves are much smaller than current resources
> … the regional distribution of reserves and resources. A concentration in a few countries is critical, especially if these countries are politically unstable or are organized in a cartel (e.g. OPEC)
Hard coal
Lignite
Uranium
Crude oil
Natural gas
Years
T3.1 Energy – GDP growth in emerging markets is fueling the demand for energy
1) Static reach: Reach of fossil fuels based on the current global consumption and the current amount of reserves and resources. Constant consumption in the future and fixed reserves are assumed. As these input factors are dependent on the geological and technological changes as well as economic and political developments, the static reach is not a predictive instrument but provides a snapshot in time of a dynamically developing system 2) Reserves: Deposits which are known in detail and can be recovered economically using current technologies 3) Resources: Deposits which are either proved but are at present not economically recoverable, or which are not demonstrated, but can be expected for geological reasons
Reserves2) Resources3)
Source: DERA

30 Roland Berger Trend Compendium 2030 - Trends 1-7 Compact version.pptx
Global water demand will increase by 32% to 2050, driven heavily by the growing use for manufacturing and electricity
Global water demand 2015-20501) [km3]
Renewable internal freshwater resources 2014 [m3/inhabitant]
+ 32%
Irrigation & Livestock
No data < 500 500-1000 1000-1700 1700-5000 > 5000
56%
38%
20%
22%
13%
14%
Electricity Domestic Manufacturing
T3.2 Water and food – Satisfying the world's hunger and thirst with limited sources
5,467
4,135
12%
25%
2050
2015
GDP growth
Population growth
Growing food demand
Climate change
Efficiency gains
Drivers of demand
Source: OECD, FAO, Roland Berger
1) The values of 2015 are linearly extrapolated with the values of 2000 and 2050

31 Roland Berger Trend Compendium 2030 - Trends 1-7 Compact version.pptx
Future food price developments are difficult to predict – They are influenced by many factors and are subject to uncertainties
Demography Efficiency gains Population growth
Urbanization
Eating habits
Economic growth GDP growth emerging markets
Demand
Financial markets speculation
Trade policies
Geopolitical dynamics
Production
Wastage
Supply Prices Water and soil
Scarcity of resources
Climate change
Increasing temperature
Source: Barilla Centre, The European House-Ambrosetti, IPCC
Increase in calories
Changing consumer habits (more meat) ?
Oil and energy prices
Decline in nutritional value
Foreign exchange Fertilizer prices
T3.2 Water and food – Satisfying the world's hunger and thirst with limited sources
Influence factors on the development of food prices
32 Roland Berger Trend Compendium 2030 - Trends 1-7 Compact version.pptx
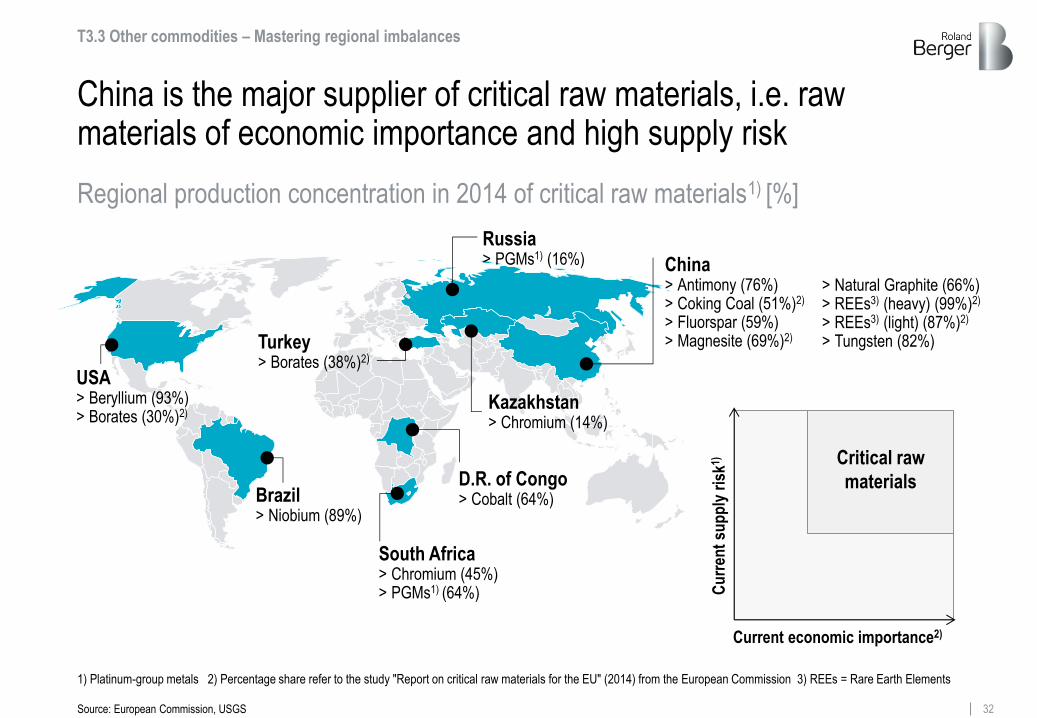
China is the major supplier of critical raw materials, i.e. raw materials of economic importance and high supply risk
T3.3 Other commodities – Mastering regional imbalances
China > Antimony (76%) > Coking Coal (51%)2) > Fluorspar (59%) > Magnesite (69%)2)
> Natural Graphite (66%) > REEs3) (heavy) (99%)2) > REEs3) (light) (87%)2) > Tungsten (82%)
USA > Beryllium (93%) > Borates (30%)2)
Brazil > Niobium (89%)
South Africa > Chromium (45%) > PGMs1) (64%)
D.R. of Congo > Cobalt (64%)
Turkey > Borates (38%)2)
Russia > PGMs1) (16%)
Kazakhstan > Chromium (14%)
Regional production concentration in 2014 of critical raw materials1) [%]
Current economic importance2)
Cu
rren
t su
pp
ly r
isk1)
Critical raw
materials
1) Platinum-group metals 2) Percentage share refer to the study "Report on critical raw materials for the EU" (2014) from the European Commission 3) REEs = Rare Earth Elements
Source: European Commission, USGS

Megatrend 4 Climate change & ecosystem at risk
Roland Berger Trend Compendium 2030
34 Roland Berger Trend Compendium 2030 - Trends 1-7 Compact version.pptx
Interdependencies of climate change and ecosystem trends require global answers and solutions – There are three key subtrends
Global warming – The core of climate change
Rising CO2 emissions – Non-OECD as accelerant
Ecosystem at risk – Threatened basis of life
T4 Climate change & ecosystem at risk: Subtrends
Subtrends of megatrend "Climate change & ecosystem at risk"
35 Roland Berger Trend Compendium 2030 - Trends 1-7 Compact version.pptx
250
300
350
400
450
500
550
1900 1920 1940 1960 1980 2000 2020
1.0
0.5
0.0
-0.5
1.5
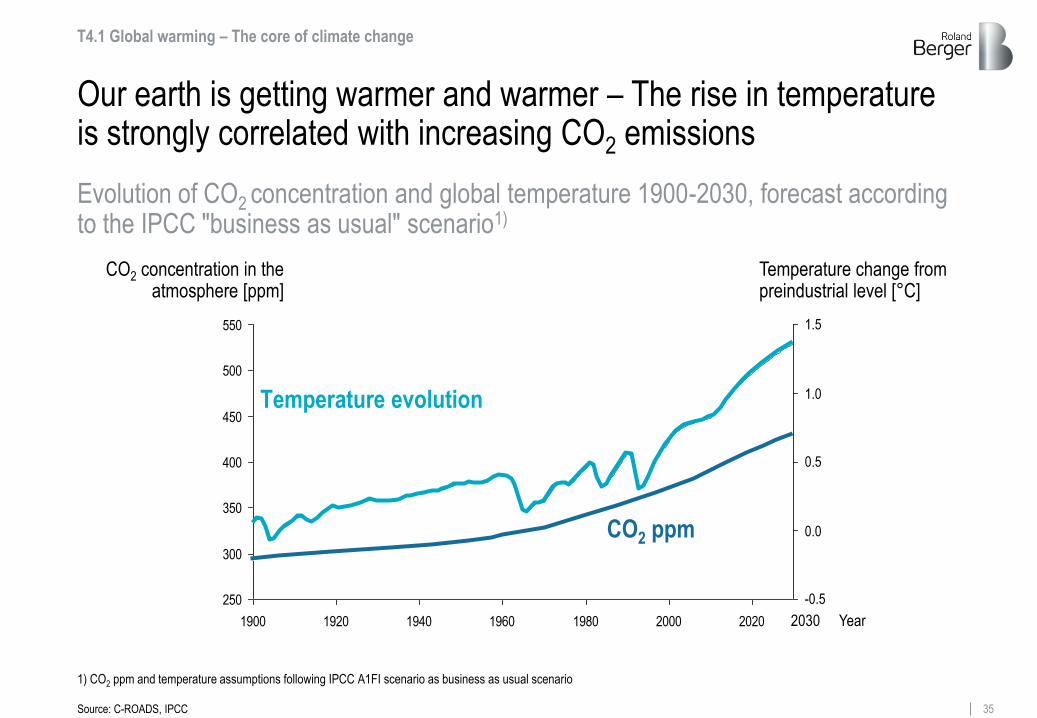
Our earth is getting warmer and warmer – The rise in temperature is strongly correlated with increasing CO2 emissions
Temperature change from preindustrial level [°C]
CO2 concentration in the atmosphere [ppm]
Year
T4.1 Global warming – The core of climate change
2030
Evolution of CO2 concentration and global temperature 1900-2030, forecast according to the IPCC "business as usual" scenario1)
CO2 ppm
Temperature evolution
Source: C-ROADS, IPCC
1) CO2 ppm and temperature assumptions following IPCC A1FI scenario as business as usual scenario

36 Roland Berger Trend Compendium 2030 - Trends 1-7 Compact version.pptx
Global warming has marked effects worldwide – yet regional impacts differ
Scarcity of fresh water Food scarcity Wildfire Extinction of species Flood damages Health problems (due to heat 6 diseases)
Loss of coastal infrastructure, settlements, natural habitats
North America
Central & South America
Europe
Africa
Small Islands (Maldives e.g.)
Asia
Australia/ Oceania
Oceans
Antarctica
Arctic
Natural disasters: Scarcity of resources: Impact on species: Impact on health:
Change of species appearance (concerning fishery e.g.)
Low crop yields
T4.1 Global warming – The core of climate change
Important impacts of climate change in different world regions
Source: IPCC, AFP, BZ

37 Roland Berger Trend Compendium 2030 - Trends 1-7 Compact version.pptx
20
25
30
35
40
45
2000 2005 2010 2015 2020 2025 2030
Limiting global warming requires measures to reduce greenhouse gas emissions – CO2 being the most significant
T4.2 Rising CO2 emissions – Non-OECD as accelerant
Global CO2 emissions under different scenarios1) and composition of GHG emissions2)
1) CO2 emissions from fuel combustion and industrial processing. 6°C and 2°C scenarios according to IEA describing different global warming scenarios, referring to average global
temperature rise above pre-industrial levels by 2100 2) GHG = Green house gas, emissions' split refers to 2010 data of IPCC 2014 report 3) Gt = Gigatonnes 4) GtCO2e = Gigatonnes
CO2 equivalent
Source: IEA, EIA, IPCC
IEA 6°C Scenario "Business as usual"
IEA 2°C Scenario
> Higher energy efficiency
> CO2 capture and storage
> More renewables
> …
Global GHG emissions 2013: 54 GtCO2e4)
Others
8%
16%
Methane 76% CO2
Global CO2 emissions under different scenarios
Gt3)
Composition of GHG emissions

38 Roland Berger Trend Compendium 2030 - Trends 1-7 Compact version.pptx Source: IEA
Total CO2 emissions in selected regions 2013 and 2030 according to the 6°C and the 2°C IEA scenarios [Gt1)]
Asia and North America are key: Future CO2 emissions highly depend on actions being taken by China, India and the USA
USA China
South Africa
Brazil
India Mexico
Global
European Union
ASEAN
5.5
3.0
5.3
0.6 0.4
0.4
0.7 0.4
0.5
13.2
8.7
10.0
5.4
3.3 2.0
3.4
2.2
3.7
2.9
1.9 1.4
0.6 0.4
0.5
45.1
28.6
33.9
2013 2030, 6°C scenario – "Business as usual" 2030, 2°C scenario
1) Gt = Gigatonnes
T4.2 Rising CO2 emissions – Non-OECD as accelerant
39 Roland Berger Trend Compendium 2030 - Trends 1-7 Compact version.pptx
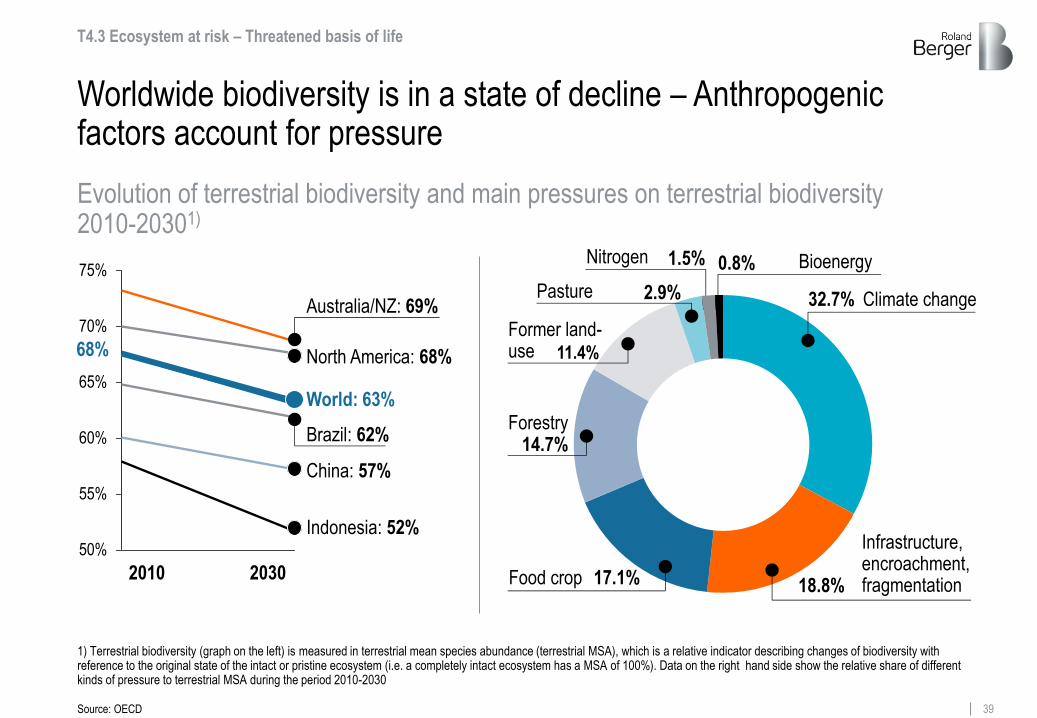
Worldwide biodiversity is in a state of decline – Anthropogenic factors account for pressure
2010 2030
50%
55%
60%
65%
70%
75%
Australia/NZ: 69%
North America: 68%
World: 63%
Brazil: 62%
China: 57%
Indonesia: 52%
Evolution of terrestrial biodiversity and main pressures on terrestrial biodiversity 2010-20301)
11.4%
14.7%
17.1%
Infrastructure, encroachment, fragmentation Food crop
Forestry
Former land-use
Bioenergy
Pasture
Nitrogen
1) Terrestrial biodiversity (graph on the left) is measured in terrestrial mean species abundance (terrestrial MSA), which is a relative indicator describing changes of biodiversity with reference to the original state of the intact or pristine ecosystem (i.e. a completely intact ecosystem has a MSA of 100%). Data on the right hand side show the relative share of different kinds of pressure to terrestrial MSA during the period 2010-2030
68%
Climate change 32.7%
0.8% 1.5%
2.9%
18.8%
T4.3 Ecosystem at risk – Threatened basis of life
Source: OECD

40 Roland Berger Trend Compendium 2030 - Trends 1-7 Compact version.pptx
Over 60% of the earth's biocapacity is held by only ten countries, most suffer from heavy land and forest degradation
Shares of global biocapacity Shares of global forest degradation
Brazil
China
D.R. Congo
Others
Argentina
Indonesia
USA
Russia
Canada
India
Australia
14.8
10.6
9.8
8.1
4.7
4.6
3.0 2.5
2.4
1.6
38.1 Brazil 14.2
China 0.5
USA 6.1
Russia 20.4
Canada 21.4
Australia 3.3
Indonesia 3.7
2.6 D.R. Congo
Others 27.8
National shares of global biocapacity and forest degradation1) in 2013 [%]
T4.3 Ecosystem at risk – Threatened basis of life
1) Measured as degradation of intact forest landscape (IFL): IFL is an unbroken expanse of natural ecosystems within the zone of current forest extent, showing no signs of significant human activity, and large enough that all native biodiversity could be maintained. Biocapacity is the ecosystems’ capacity to produce useful biological materials and to absorb waste
Source: Global Footprint Network, Intact Forest Landscapes
Megatrend 5 Dynamic technology & innovation
Roland Berger Trend Compendium 2030
42 Roland Berger Trend Compendium 2030 - Trends 1-7 Compact version.pptx
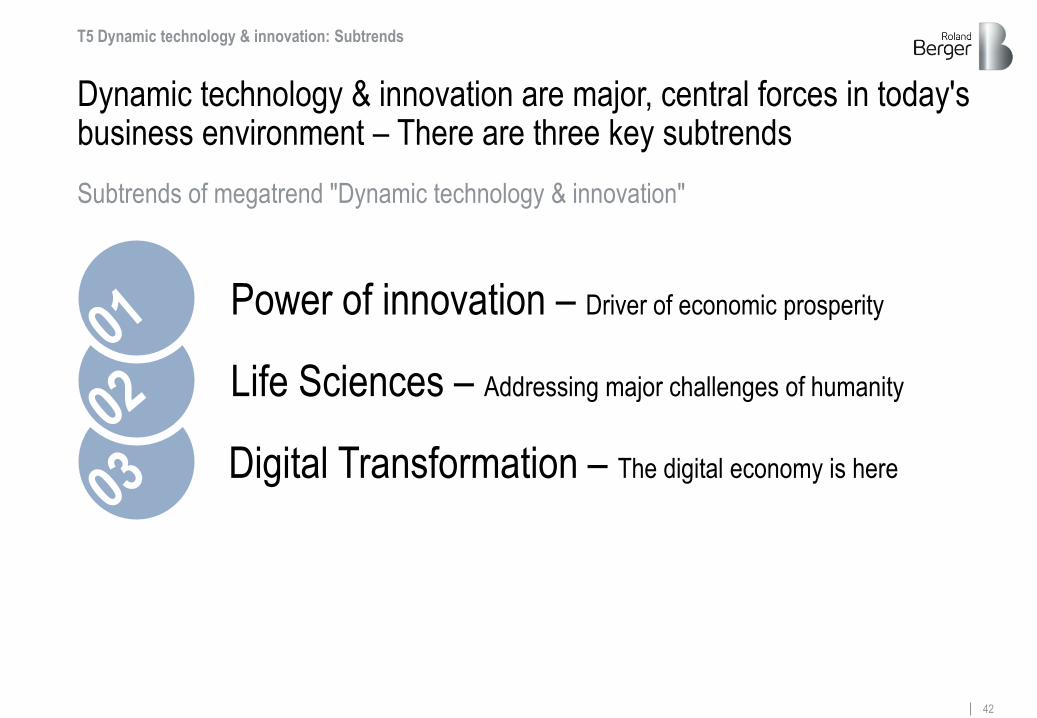
Dynamic technology & innovation are major, central forces in today's business environment – There are three key subtrends
T5 Dynamic technology & innovation: Subtrends
Power of innovation – Driver of economic prosperity
Life Sciences – Addressing major challenges of humanity
Digital Transformation – The digital economy is here
Subtrends of megatrend "Dynamic technology & innovation"

43 Roland Berger Trend Compendium 2030 - Trends 1-7 Compact version.pptx
Today we still face major challenges, yet many promising fields of innovation are poised to overcome these challenges by 2030
> Provide enough water, food and healthcare
> Use resources more efficiently
> Cope with increasing energy and transportation demand
> Reduce waste and pollution
> Fight climate change
> …
> Life Sciences
> Digital Transformation
> Materials science
> New mobility
> Environmental science
> …
Major challenges for humanity
Fields of innovation
2030
Selected major challenges and fields of innovation towards 2030
T5.1 Power of innovation – Driver of economic prosperity

44 Roland Berger Trend Compendium 2030 - Trends 1-7 Compact version.pptx
0 50 100 150 200 250 300 350 400 450
80,000
70,000
60,000
50,000
40,000
30,000
20,000
10,000
0
90,000
South Africa
Singapore Sweden
Spain
Russia
Netherlands
South Korea
Japan
Italy
India
Israel UK France
Germany
China
Switzerland
Brazil
Belgium Austria
USA
Developed countries BRICS
Innovation drives wealth – BRICS countries have to catch up, although two Chinese corporations among largest PCT applicants
Largest corporate PCT applicants 2015
GDP per capita and PCT1) applications relative to population in 2016
1.
2.
3.
4.
5.
6.
7.
8.
9.
10.
Huawei (3,898; CN)
Qualcomm(2,442; US)
ZTE (2,155; CN)
Samsung (1,683; KR)
Mitsubishi (1,593; JP)
Ericsson (1,481; SE)
LG (1,457; KR)
Sony (1,381; JP)
Philips (1,378; NL)
HP (1,310; US)
Patent applications per 1 mio inhabitants
GDP per capita [USD]
T5.1 Power of innovation – Driver of economic prosperity
Source: IMF, Wipo, WEForum
1) Patent Cooperation Treaty: Intellectual property rights enforced in 148 countries worldwide

45 Roland Berger Trend Compendium 2030 - Trends 1-7 Compact version.pptx
The powerful network of biology, chemistry and pharmaceuticals in Life Sciences provides answers to future challenges of humanity
T5.2 Life Sciences – Addressing major challenges of humanity
Medical devices
Ecology
Genetics
Neurosciences
Marine biology
Pharmaceutical sciences
Biophysics
Health sciences Biochemistry
Environ-mental pollution
Marine pollution
Chronic & age-related diseases
Growing demand for food & water
Contagious diseases
Source: PwC, Deloitte, Roland Berger
Selected fields of Life Sciences & important challenges associated with Life Sciences

46 Roland Berger Trend Compendium 2030 - Trends 1-7 Compact version.pptx
In terms of patent publications by origin of applicant, Asian countries are catching up – the US and Europe are loosing out
1) PCT (Patent Cooperation Treaty): Intellectual property rights enforced in 148 countries worldwide) applications here refer to analysis of biological materials, medical technology, biotechnology, pharmaceuticals, food chemistry, environmental technology
Selected PCT Life Sciences1) publications by origin of applicant [% of global total]
T5.2 Life Sciences – Addressing major challenges of humanity
2016 2006
8.9 Japan 12.5
China 1.5
South Korea 2.1
Other countries 8.6 Japan 14.2
China 6.9
South Korea 5.6
USA 36.6 Europe 28.1 USA 43.2 Europe 31.9
Other countries
28,199 34,736
Source: Wipo
47 Roland Berger Trend Compendium 2030 - Trends 1-7 Compact version.pptx
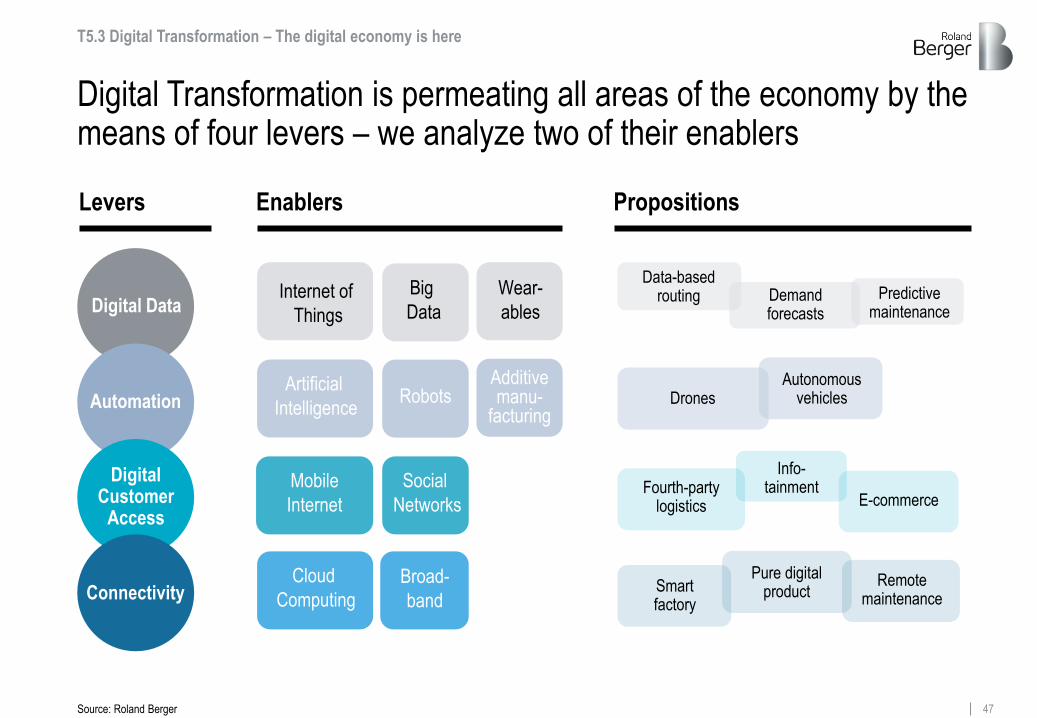
T5.3 Digital Transformation – The digital economy is here
Digital Transformation is permeating all areas of the economy by the means of four levers – we analyze two of their enablers
Source: Roland Berger
Automation
Connectivity
Digital Customer
Access
Artificial
Intelligence
Internet of
Things
Levers Enablers
Additive manu-
facturing
Social
Networks
Mobile
Internet
Cloud
Computing
Big
Data
Robots
Wear-
ables
Broad-
band
Propositions
Digital Data
Pure digital product Smart
factory
Remote maintenance
Info- tainment Fourth-party
logistics E-commerce
Drones Autonomous
vehicles
Demand forecasts
Data-based routing Predictive
maintenance

48 Roland Berger Trend Compendium 2030 - Trends 1-7 Compact version.pptx
The Internet of Things is an important enabler of Digital Transformation and its growth is accelerating
Source: Ericsson, Roland Berger
Development of connected devices 2015-2021 [bn]
2015 2021
T5.3 Digital Transformation – The digital economy is here
1.3
4.6
+83.1%
2.4
15.4
1.4
28.2
2.8
8.7
15.3
7.1
PC, labtop, tablet
M2M and consumer electronics Mobile phones
Fixed phones
Levers Enablers
Internet of
Things
Automation
Connectivity
Digital Customer
Access
Digital Data
49 Roland Berger Trend Compendium 2030 - Trends 1-7 Compact version.pptx
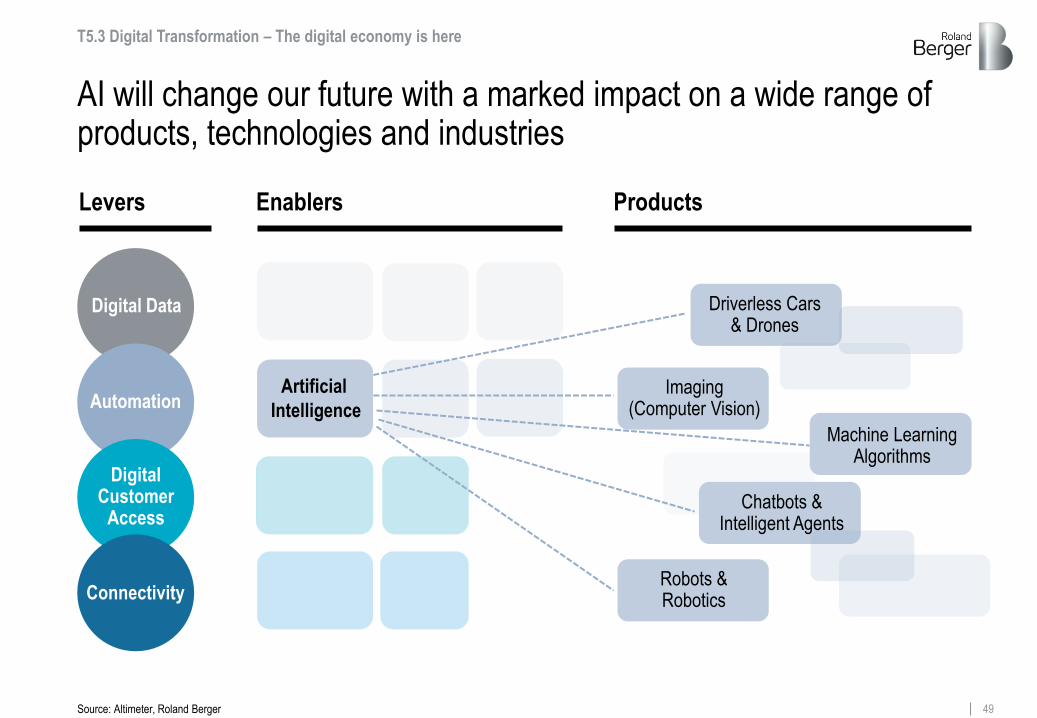
AI will change our future with a marked impact on a wide range of products, technologies and industries
Driverless Cars & Drones
Chatbots & Intelligent Agents
Machine Learning Algorithms
Imaging (Computer Vision)
Robots & Robotics
T5.3 Digital Transformation – The digital economy is here
Levers Enablers Products
Artificial
Intelligence
Source: Altimeter, Roland Berger
Automation
Connectivity
Digital Customer
Access
Digital Data
50 Roland Berger Trend Compendium 2030 - Trends 1-7 Compact version.pptx
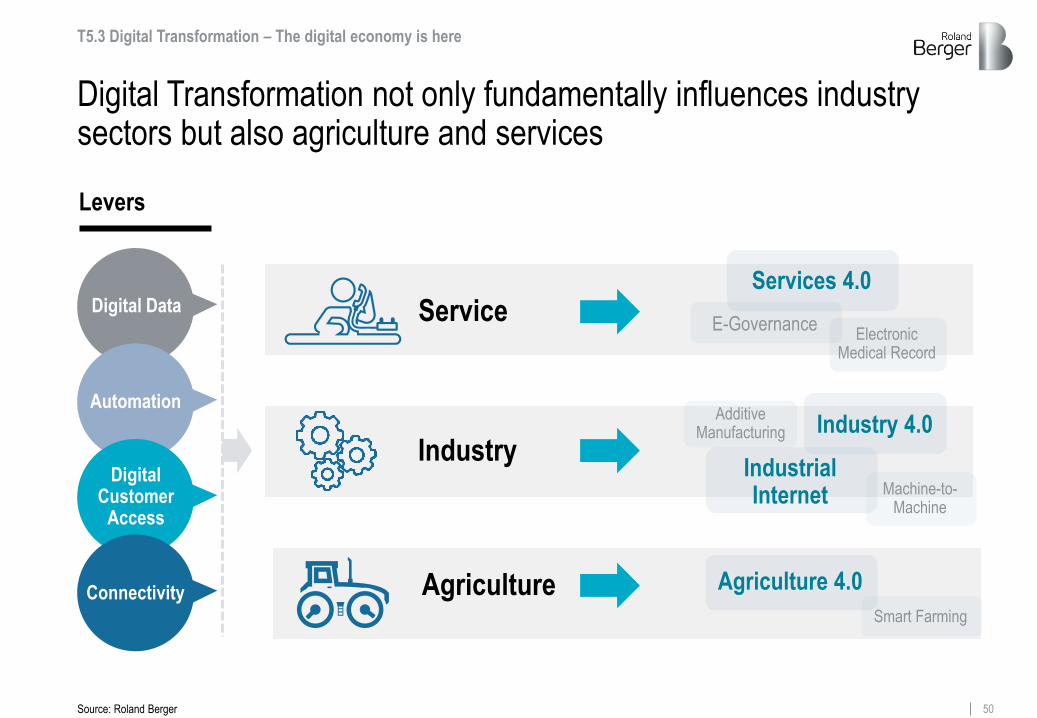
Digital Transformation not only fundamentally influences industry sectors but also agriculture and services
Industry
Agriculture
Service
T5.3 Digital Transformation – The digital economy is here
Levers
E-Governance
Services 4.0
Additive Manufacturing Industry 4.0
Industrial Internet
Electronic Medical Record
Machine-to-Machine
Agriculture 4.0
Smart Farming
Source: Roland Berger
Automation
Connectivity
Digital Customer
Access
Digital Data

51 Roland Berger Trend Compendium 2030 - Trends 1-7 Compact version.pptx
The digital economy requires platform thinking as the basis for new value creation – Leveraging network effects is key to success
Platform-driven business models
Source: Roland Berger, Yahoo Finance
Traditional thinking Platform thinking
Consumer Marketing Distribution Production
Platform Ecosystem
vs.
Revenues 8.2 bn 4.7 bn
Market Cap. 80 bn 74 bn (Time Warner Inc.)
Unique users >1 bn 140 mn
T5.3 Digital Transformation – The digital economy is here

Megatrend 6 Global knowledge society
Roland Berger Trend Compendium 2030

53 Roland Berger Trend Compendium 2030 - Trends 1-7 Compact version.pptx
Knowledge is becoming increasingly multidisciplinary, the war for talent will intensify and gender gaps will narrow
T6 Global knowledge society: Subtrends
Know-how base – Increasing knowledge diffusion
Gender gap – Bridging the distance
War for talent – Rising skills shortage as a key challenge
Subtrends of megatrend "Global knowledge society"

54 Roland Berger Trend Compendium 2030 - Trends 1-7 Compact version.pptx
5 6 7 8 9 10 11 12 13 14
60,000
50,000
40,000
30,000
10,000
0
20,000
United States
United Kingdom
Turkey Russia
Korea Japan Italy
Indonesia
India
Germany
France
China Brazil
Australia
Years spent in education – prerequisite and benchmark of a strong know-how base – clearly pay off in terms of financial prosperity
Years of education
GDP per capita PPP
Source: IMF, University of Denver
Average number of years of education completed in 2015 related to GDP per capita PPP in 20161) [years, USD]
1) Number of years of education completed by people aged 25 years and older; PPP stands for purchasing power parity. They are taken into consideration to create comparability across countries. Here measured in current international dollar
T6.1 Know-how base – Increasing knowledge diffusion
55 Roland Berger Trend Compendium 2030 - Trends 1-7 Compact version.pptx
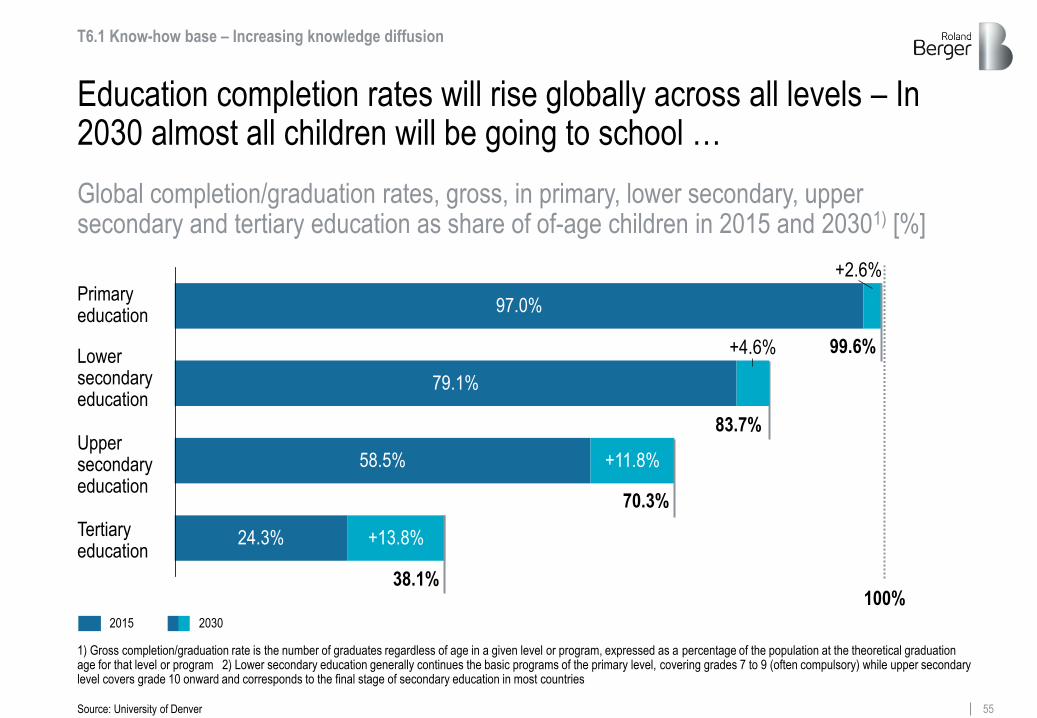
Education completion rates will rise globally across all levels – In 2030 almost all children will be going to school …
Global completion/graduation rates, gross, in primary, lower secondary, upper secondary and tertiary education as share of of-age children in 2015 and 20301) [%]
Tertiary education
Upper secondary education
Lower secondary education
Primary education
+2.6%
97.0%
24.3%
79.1%
58.5%
+4.6%
+11.8%
+13.8%
2015
100% 38.1%
70.3%
83.7%
99.6%
2030
T6.1 Know-how base – Increasing knowledge diffusion
1) Gross completion/graduation rate is the number of graduates regardless of age in a given level or program, expressed as a percentage of the population at the theoretical graduation age for that level or program 2) Lower secondary education generally continues the basic programs of the primary level, covering grades 7 to 9 (often compulsory) while upper secondary level covers grade 10 onward and corresponds to the final stage of secondary education in most countries
Source: University of Denver

56 Roland Berger Trend Compendium 2030 - Trends 1-7 Compact version.pptx
2015 2030
… having a vital impact on fundamental skills: Regarding literacy rates, Asia and Africa will strongly catch up in the next decades
Africa
81% 66%
Asia-Pacific
91% 84%
T6.1 Know-how base – Increasing knowledge diffusion
World
Niger
57% 19%
India
Nigeria
80% 60%
Afghanistan
70% 38%
84% 72%
91% 85%
Average literacy rates 2015 and 2030 [% of population aged 15+]
Source: University of Denver

57 Roland Berger Trend Compendium 2030 - Trends 1-7 Compact version.pptx
Developed countries with a declining population will feel talent shortages most acutely – bar some exceptions
Projected change in working age population 2015-20301) [%]
2.9
14.0
-4.8
2.3
Turkey
-10.2
Russia Japan
-10.5 -11.1 -9.7
-8.8
Germany Netherlands South Korea Italy UK USA
1) Based on medium fertility variant of UN population forecasts. Working age population is defined as those aged 15 to 64
T6.2 War for talent – Rising skills shortage as a key challenge
Source: UN World Population Prospects: The 2017 Revision, Roland Berger

58 Roland Berger Trend Compendium 2030 - Trends 1-7 Compact version.pptx
Even countries with growing populations such as Turkey, USA and UK already face difficulties in filling job vacancies
T6.2 War for talent – Rising skills shortage as a key challenge
86%
49%
Japan
Germany
India
France
USA
23%
China
UK
Switzerland
Turkey 66%
48% 46%
18% 20%
10%
Percentage of companies in having difficulties filling jobs 2016
Top 10 jobs employers are having difficulty in filling 2016
Skilled trade workers
Sales re-presentatives
Engineers Technicians
Accounting & finance staff
Management/ Executives
Office support staff
Production/ Machine operations
IT Staff
Drivers
1 3 4 2
7 6 10 9 8
5
Brazil 43%
Talent shortages in leading economies and top 10 jobs with shortages 2016
Sources: Manpower Group

59 Roland Berger Trend Compendium 2030 - Trends 1-7 Compact version.pptx
Globally speaking, the increasing number of graduates provides a chance to mitigate the intense war for talent
137m
2013 2030
Others 16% China 17%
Mexico 3%
UK 3%
Indonesia 4%
Brazil 4%
Korea 4%
Japan 6%
Russia 10% US 14%
India
14%
Others 18%
Japan 3%
Saudi Arabia 3%
Russia 4%
Indonesia 5%
Brazil 5%
US 8%
China 27%
India
23%
300m
Share of 25-34 year-olds with a tertiary degree across OECD and G20 countries
Developed countries Developing countries
Source: OECD
T6.2 War for talent – Rising skills shortage as a key challenge

60 Roland Berger Trend Compendium 2030 - Trends 1-7 Compact version.pptx
The war for talent calls for efforts to narrow the gender gap – In terms of education, labor force participation and disposable income
Years of education
Labor force participation
T6.3 Gender gap – Bridging the distance
Disposable income
> America & Europe enjoy gender parity in terms of years spent in education
> In Africa & Asia the gap is narrowing towards 2035
> Regarding labor participation, Scandinavian countries are the benchmark
> Forecasts show stagnation of current indicators
> Women earn significantly less than men
> The future will only bring slight improvements
Three factors that are important regarding the gender gap
Source: University of Denver, ILO, UN, Euromonitor

Megatrend 7 Sustainability & global responsibility
Roland Berger Trend Compendium 2030

62 Roland Berger Trend Compendium 2030 - Trends 1-7 Compact version.pptx
1
2
3
4
5
6
Sustainability comprises three actionable areas of responsibility, influenced by six megatrends and shaped by three stakeholders
STAKEHOLDER State
T7 Sustainability & global responsibility
Demographic
Dynamics
Globalization &
future markets
Scarcity of
resources
Climate change &
ecosystem at risk
Dynamic technology
& innovation
Global know-
ledge society
"Sustainability is the responsible development that meets the needs of the present without compromising the ability of future generations to meet their own needs."
(World Commission on Environment and Development – Brundtland Commission)
Sustainability
STAKEHOLDER Society
STAKEHOLDER Businesses
Source: Adams "The future of sustainability", Roland Berger, World Commission on Environment and Development

63 Roland Berger Trend Compendium 2030 - Trends 1-7 Compact version.pptx
We focus on what the three key stakeholders can do to foster a globally sustainable level of development
State – Cooperation or conflict
Society – Citizens and NGOs change the world
Businesses – Corporate citizens on duty
T7 Sustainability & global responsibility: Subtrends
Subtrends of megatrend "Sustainability & global responsibility"
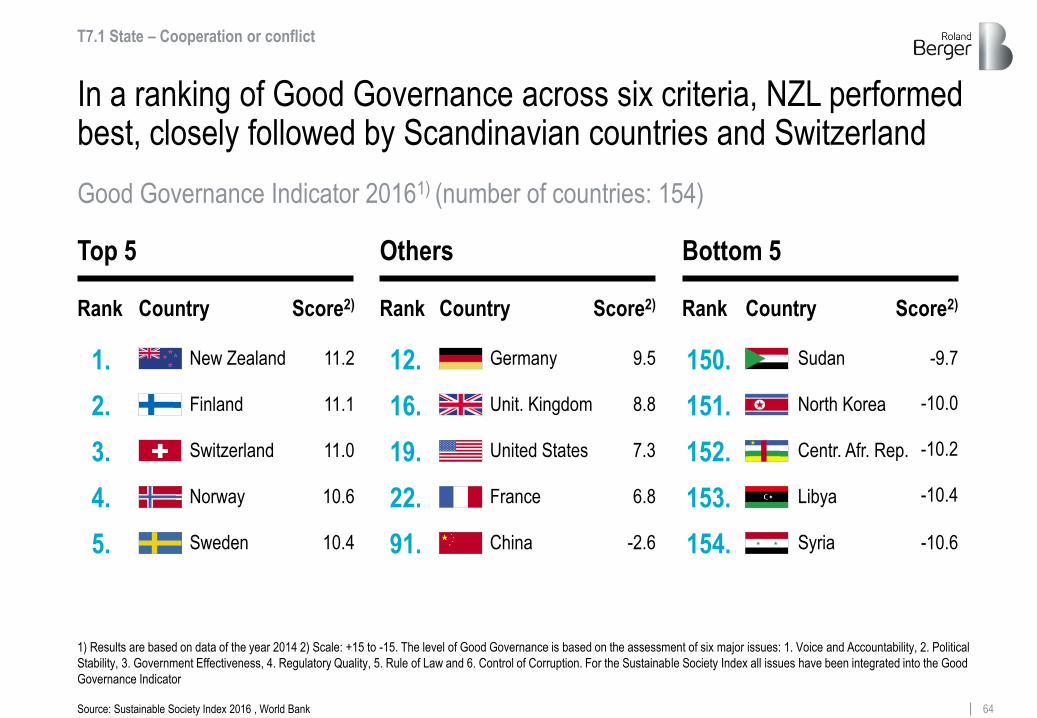
64 Roland Berger Trend Compendium 2030 - Trends 1-7 Compact version.pptx
Good Governance Indicator 20161) (number of countries: 154)
In a ranking of Good Governance across six criteria, NZL performed best, closely followed by Scandinavian countries and Switzerland
Source: Sustainable Society Index 2016 , World Bank
T7.1 State – Cooperation or conflict
Top 5
1.
2.
3.
4.
5.
Bottom 5 Others
Rank
New Zealand
Finland
Switzerland
Norway
Sweden
Country Score2)
11.2
11.1
11.0
10.6
10.4
12.
16.
19.
22.
91.
Rank
Germany
Unit. Kingdom
United States
France
China
Country Score2)
9.5
8.8
7.3
6.8
-2.6
150.
151.
152.
153.
154.
Rank
Sudan
North Korea
Centr. Afr. Rep.
Libya
Syria
Country Score2)
-9.7
-10.0
-10.2
-10.4
-10.6
1) Results are based on data of the year 2014 2) Scale: +15 to -15. The level of Good Governance is based on the assessment of six major issues: 1. Voice and Accountability, 2. Political
Stability, 3. Government Effectiveness, 4. Regulatory Quality, 5. Rule of Law and 6. Control of Corruption. For the Sustainable Society Index all issues have been integrated into the Good
Governance Indicator

65 Roland Berger Trend Compendium 2030 - Trends 1-7 Compact version.pptx
When it comes to the future of governmental sustainability there are both promising as well as worrying signs
Select examples of recent sustainable and non-sustainable governmental actions
Source: Roland Berger, Oxford Economics
> Many violent conflicts that threaten sustainable actions (e.g. Syria/Middle East)
> Closed-border policies towards refugees in many countries
> Failure of TTIP trade deal
> US withdrawal from the Paris Agreement
> Tensions between USA and North Korea
T7.1 State – Cooperation or conflict
> Strong efforts of many countries to reduce their fiscal deficit and government debt
> "Historic understanding" (Obama) with Iran about its nuclear program
> Intense international cooperation to manage the Greek crisis
> Strong efforts in many countries to foster a "green economy"
> Negotiation and signing of the Paris (Climate) Agreement
Sustainable government actions Non-sustainable government actions

66 Roland Berger Trend Compendium 2030 - Trends 1-7 Compact version.pptx
Official development assistance of many donor countries does not reach UN target, including some of the most developed ones
T7.1 State – Cooperation or conflict
0.08 0.07
0.12
UN target: 0.70% Three least assisting countries
Three most assisting countries
Sweden
0.70
0.70 0.38
0.26
0.26
0.20
0.18
1.11
1.00
0.94 Luxembourg
Norway
Other selected OECD countries
Israel
Japan
United States
Italy
Canada
France
United Kingdom
Germany
Latvia
Slovak Republic
Official development assistance of selected OECD countries 2016 [% of national GNI]
Source: OECD
67 Roland Berger Trend Compendium 2030 - Trends 1-7 Compact version.pptx
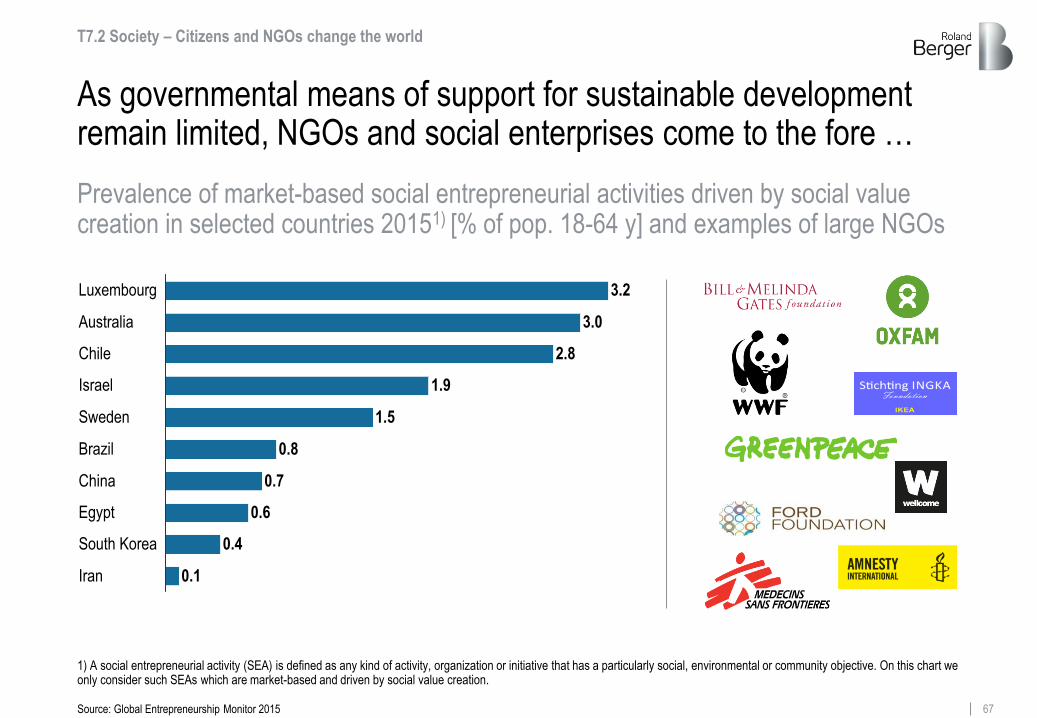
As governmental means of support for sustainable development remain limited, NGOs and social enterprises come to the fore …
0.6 Egypt
China 0.7
Brazil 0.8
Sweden 1.5
Israel 1.9
Chile 2.8
Australia 3.0
Luxembourg 3.2
0.1
South Korea
Iran
0.4
Prevalence of market-based social entrepreneurial activities driven by social value creation in selected countries 20151) [% of pop. 18-64 y] and examples of large NGOs
1) A social entrepreneurial activity (SEA) is defined as any kind of activity, organization or initiative that has a particularly social, environmental or community objective. On this chart we only consider such SEAs which are market-based and driven by social value creation.
T7.2 Society – Citizens and NGOs change the world
Source: Global Entrepreneurship Monitor 2015
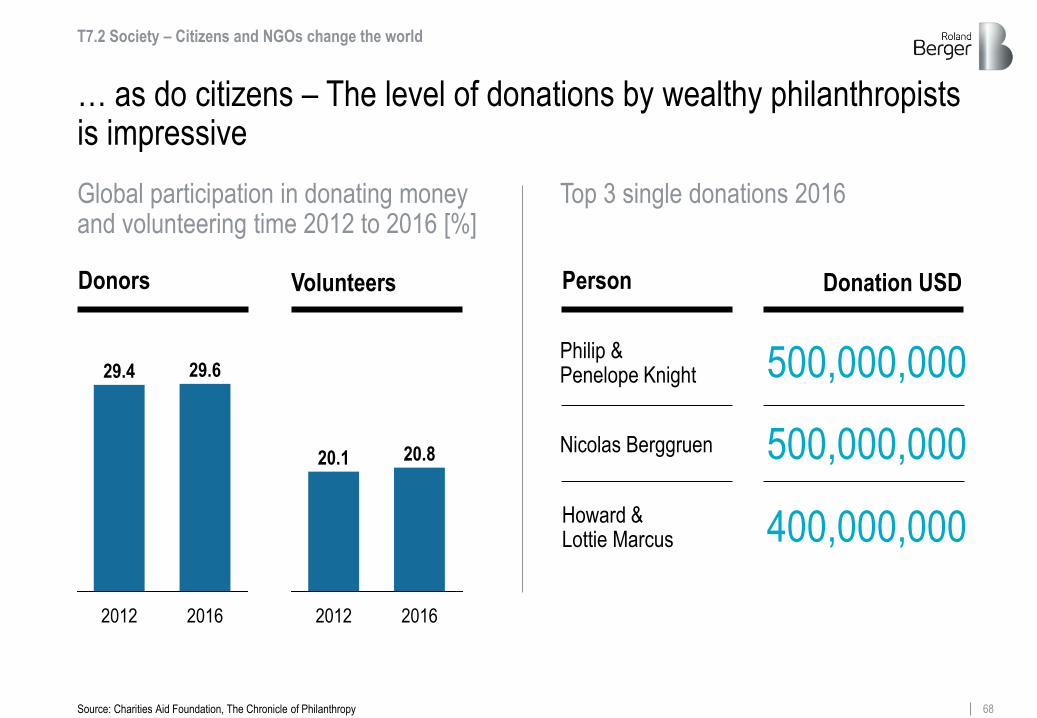
68 Roland Berger Trend Compendium 2030 - Trends 1-7 Compact version.pptx
… as do citizens – The level of donations by wealthy philanthropists is impressive
Donors Volunteers
Global participation in donating money and volunteering time 2012 to 2016 [%]
Top 3 single donations 2016
Person Donation USD
T7.2 Society – Citizens and NGOs change the world
Source: Charities Aid Foundation, The Chronicle of Philanthropy
Philip & Penelope Knight
Nicolas Berggruen
Howard & Lottie Marcus
500,000,000
500,000,000
400,000,000
2012
29.4
2016
29.6
2016
20.8
2012
20.1

69 Roland Berger Trend Compendium 2030 - Trends 1-7 Compact version.pptx
Customer demands and pressure from other stakeholder groups drive companies to act as good corporate citizens
Corporate Citizen
Customers Employees
Suppliers
Shareholders
Society & local
communities
Government
Media
T7.3 Businesses – Corporate citizens on duty
Corporate citizens stand up for:
Relevant stakeholders of companies acting as corporate citizens
> A respectful relationships with their employees
> A trust-based and sustainable cooperation with suppliers
> A 'green' supply chain
> Enhanced corporate value due to sustainable growth for their shareholders
> Environmental preservation & social contribution
> A "client first, quality first" strategy
Source: Toyota, Roland Berger
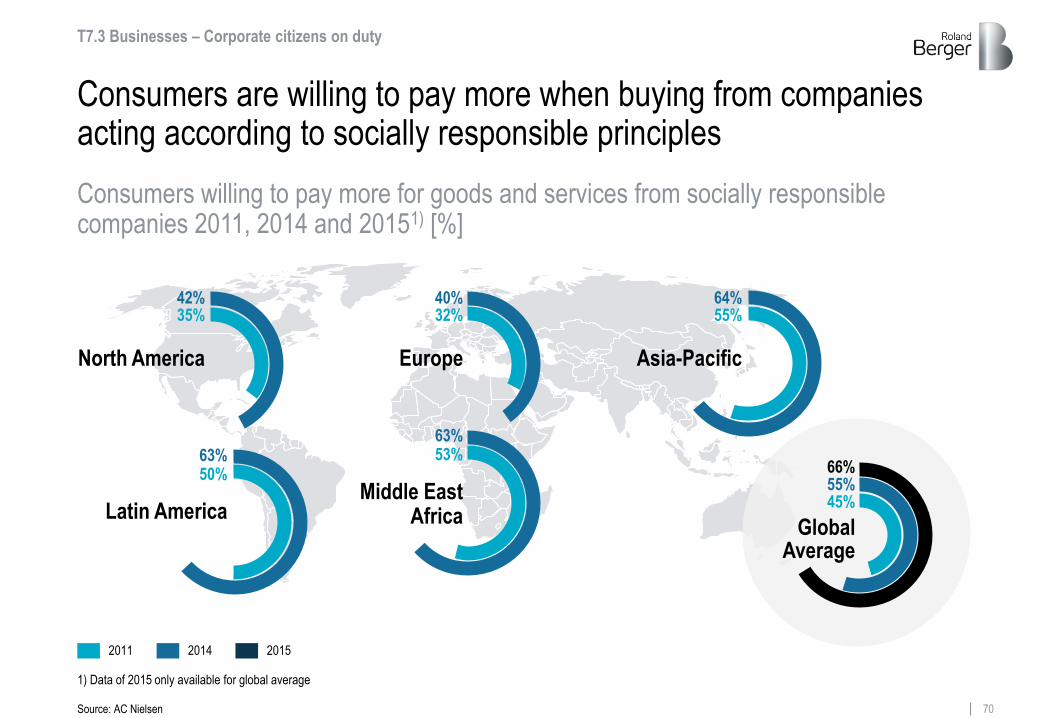
70 Roland Berger Trend Compendium 2030 - Trends 1-7 Compact version.pptx
Asia-Pacific
64% 55%
Latin America
63% 50%
Middle East Africa
63% 53%
North America
42% 35%
Europe
40% 32%
Global Average
55% 45%
2011 2014
Consumers are willing to pay more when buying from companies acting according to socially responsible principles
Consumers willing to pay more for goods and services from socially responsible companies 2011, 2014 and 20151) [%]
2015
66%
Source: AC Nielsen
1) Data of 2015 only available for global average
T7.3 Businesses – Corporate citizens on duty
71 Roland Berger Trend Compendium 2030 - Trends 1-7 Compact version.pptx
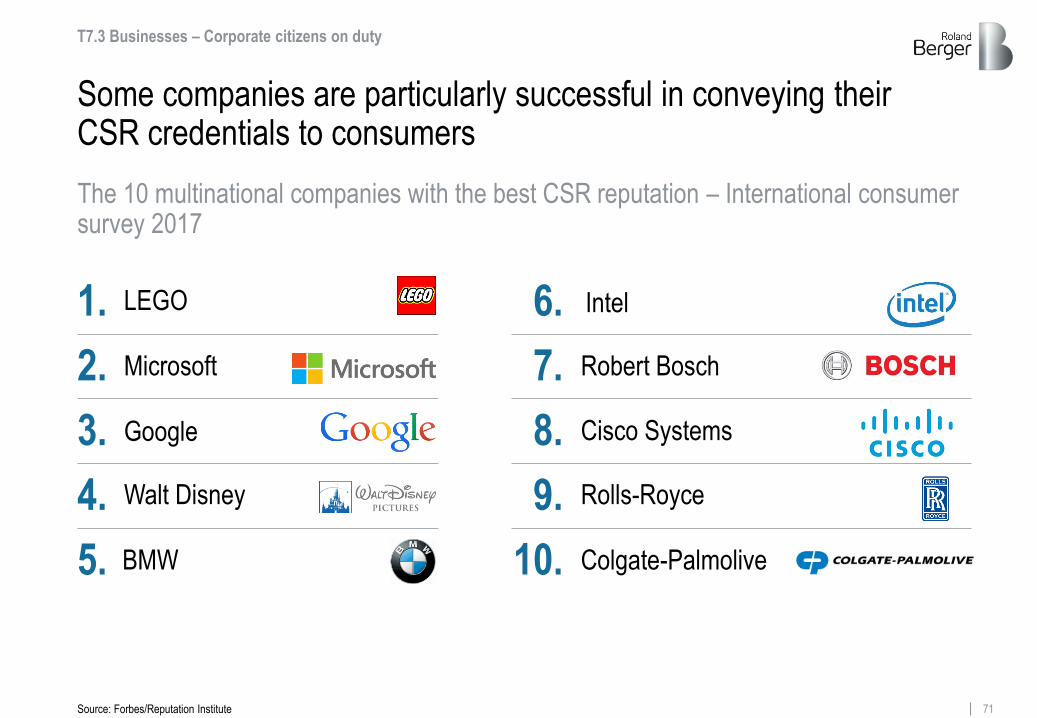
Some companies are particularly successful in conveying their CSR credentials to consumers
Microsoft
Walt Disney
BMW
LEGO
Rolls-Royce
Intel 1.
2.
3.
4.
5.
6.
7.
8.
9.
10.
Robert Bosch
Cisco Systems
Colgate-Palmolive
Source: Forbes/Reputation Institute
The 10 multinational companies with the best CSR reputation – International consumer survey 2017
T7.3 Businesses – Corporate citizens on duty

72 Roland Berger Trend Compendium 2030 - Trends 1-7 Compact version.pptx
Conclusion: Megatrends shape our societies, our economies and our natural environment
Demographic dynamics: World population is growing, aging, migrating and increasingly living in big cities
Globalization & future markets: Ongoing globalization caught between opponents and proponents, power shift to emerging markets
Scarcity of resources: Scarcity of energy resources nuanced, water stress increasing, China holds quasi-monopoly on critical raw materials
Climate change & ecosystem at risk: CO2 emissions and average global temperature increasing, biodiversity decreasing
1
3
4
5
6
7
Dynamic technology & innovation: Innovation drives prosperity, Life Sciences and digital transformation constitute two key fields of innovation
Global knowledge society: Improving educational provision in developing countries, global talent pool increasing, gender gap narrowing only in part
Sustainability & global responsibility: Sustainability is key for governments, citizens and businesses, consumers reward corporate social responsibility
2
73 Roland Berger Trend Compendium 2030 - Trends 1-7 Compact version.pptx
73
We are looking forward to your comments or questions – The full report, Trend Compendium 2030, can be accessed below
Klaus Fuest
The bigger picture for a better strategy
Dr. Christian Krys
Tel.: +49 211-4389-2231 [email protected]
Tel.: +49 211-4389-2917
Trend Compendium
https://www.rolandberger.com/en/Dossiers/Trend-Compendium.html
