rrvt nvttn f fndtn ndtn
TRANSCRIPT

GEOPHYSICS, VOL. 63, NO. 1 (JANUARY-FEBRUARY 1998); P. 95-103,6 FIGS.
Microgravity investigations of foundation conditions
Donald E. Yule *, Michael K. Sharp*, and Dwain K. Butler*
ABSTRACT
A microgravity investigation was conducted in theupstream and downstream switchyards of the WilsonDam powerplant, Florence, Alabama. The objective ofthe survey was the detection in the switchyard founda-tions of subsurface cavities or other anomalous condi-tions that could threaten the stability of the switchyardstructures. The survey consisted of 288 gravity stationsin the downstream switchyard and 347 stations in theupstream switchyard. Significant anomalous areas in theswitchyards were selected on the basis of residual gravityanomaly maps. These results were prioritized and used toguide an exploratory drilling program to investigate thecause of the anomalies. Highest-priority boring locationrecommendations were in negative gravity anomaly ar-eas, since negative anomalies could be caused by actualcavities or low-density zones that might represent incip-ient cavity formation. Remaining boring locations werein positive anomaly areas for verification purposes. Theresults of the borings confirm the presence of cavitiesand soft zones indicative of cavity formation.
BACKGROUND
A cavity was discovered in foundation fill material beneaththe upstream switchyard of Wilson Dam powerplant, Florence,Alabama (Figure 1). The cavity was approximately 3 m (10 ft)in diameter, extended to within 0.6 m (2 ft) of the surface, andwas manifested by a small surface depression resulting fromsettlement caused by piping of soils into the cavity. After thecavity was filled with concrete, subsequent exploratory drillingencountered no further cavities beneath the original cavity andabove the top of rock. Rock (limestone) was encountered atdepths of 11.6-17.4 m (38-57 ft), and within the formation,cavities up to 0.4 m (1.5 ft) in vertical extent were encoun-tered. Concern about the possible existence of other cavitiesbeneath the upstream switchyard as well as the downstreamswitchyard dictated a thorough foundation investigation (Yule
et al., 1990). An extensive exploratory drilling program in theseswitchyards would be very hazardous and expensive becauseof the confined working space and close proximity of high-voltage structures. Therefore, it was necessary to find a wayto rationally focus the drilling program while ensuring com-plete coverage of the site. All engineering geophysical meth-ods were considered, and several were selected for field test-ing (microgravity, resistivity, and seismic methods). Because ofthe need for a high-resolution survey to detect small targetswhile covering as much of the site as possible, noise effectsand method survey footprints were important considerations.The seismic methods were hindered by noise from the pow-erhouse activities and limited site access for source and re-ceivers and the small target features. The electrical methodswere negated by a near-surface buried copper mesh groundingmat. Ground-penetrating radar and electromagnetic methodswere not tried because of the dense assemblage of buried, sur-face, and overhead conductors and electromagnetic fields inthe switchyards. Microgravimetry-emerged as the only viablegeophysical method of measurement for application under thesevere constraints in the switchyards.
Microgravimetry indicates the accuracy and also generallythe scale of gravity surveys. A gravity measurement accuracyof 2-5 µGal is required to ensure anomaly significance in therange of 5-10 µGal. Station spacings for small-site micrograv-ity surveys are typically 1.5-6 m (5-20 ft). Gravity meters withinherent sensitivities of 1-2 µGal are required. Detection anddelineation of subsurface cavities are frequent applications formicrogravity surveys, although the technique also is used to de-tect bedrock channels, covered mine shafts, underground tanks,and landfill cells (Camacho et al., 1994; Hinze, 1990; Wenjin andJiajian, 1990). Results of a microgravity survey generally allowthe most definitive assessment of the presence or absence ofshallow cavities (depth, <6-8 effective cavity diameters) at asite (Butler, 1980, 1984a, 1984b).
SITE GEOLOGY
The project site is located on a river bluff with an approxi-mate elevation of 150 m (500 ft), national geodetic vertical da-tum (NGVD) along the Tennessee River, in the Black Warrior
Manuscript received by the Editor June 5, 1995; revised manuscript received March 5, 1997.`Waterways Experiment Station, 3909 Halls Ferry Road, Vicksburg, MS 39180. E-mail: [email protected]; [email protected]; but-led@exl .wes.army.mil.Prepared by an agency of the U.S. government.
95
Downloaded 19 Oct 2012 to 140.194.40.43. Redistribution subject to SEG license or copyright; see Terms of Use at http://segdl.org/

96
Yule et al.
Basin of the Interior Low Plateaus Province. The site geologiccross-section is engineered fill on overburden extending tobedrock at depths of 11.5-17.4 m (38-57 ft). The overburdensediments are sands, gravels, and clays. The bedrock is the FortPayne Formation, a member of the Osage group, of Mississip-pian age. This formation is a gray, crystalline, hard limestonewith chert beds. Site borings show solution features, open cavi-ties, voids, vugs, and weathering along bedding planes through-out the rock cores, which extend to depths of 30 m (100 ft).
SURVEY DETAILS AND FIELD PROCEDURES
The downstream and upstream switchyard gravity stationgrids consisted of 288 and 347 measurement stations, respec-tively. Each station on soil consisted of a 2 x 2 inch stake drivenflush with the ground surface, while stations on concrete weremarked with paint. The elevation of each station was deter-mined with a total-station surveying instrument to within anaccuracy of 0.3 cm (0.01 ft). A basic grid dimension of 3m (10 ft)was used in the interior of the areas and modified as requiredby locations of switchyard structures. In remote areas of theswitchyard, the grid dimension was increased to 6.1 m (20 ft).A detailed explanation of microgravity survey field procedures
FIG. 1. Site map showing location of Wilson Dam in Florence,Alabama.
is given in Butler (1980). Data were collected with a Lacoste& Romberg model D gravity meter. This meter has electroniclevels, a sensitivity of approximately 1 µGal, and an accuracyof 3-5 µGal for relative gravity measurements. Data collectionconsisted of loops of 6 to 10 "reasonably" random selectedgravity station measurements between two successive occupa-tions of the base station. A time limit of 30-45 minutes wasimposed between base station measurements. The base stationreoccupations were used to correct the survey data for time-varying gravity values caused by earth tides and instrumentdrift. Theoretical tide curves and/or tables were compared withthe site base station data and with recorded tidal data acquiredduring periods when grid stations were not being measured(Butler, 1980).
Each loop or set of readings included one or more stationsthat were occupied during a previous loop. During the up-stream microgravity survey, 33% of the stations were reoccu-pied (two or more measurements), and during the downstreamsurvey, 27% were reoccupied. Comparison of the repeat val-ues, after correction for the factors described in the followingsection, allowed the quality and accuracy of the data to bemonitored during the course of the survey.
GRAVITY CORRECTION CONSIDERATIONS
Corrections to microgravity data are required to compensatefor normal gravity variations at the site over the time span re-quired for the survey. Measured values are corrected for effectscaused by variations in latitude, elevation, topography, earthtides, and instrument drift. These normal gravity variations andcompensating corrections applied to microgravity data are dis-cussed in brief below. For a more in-depth discussion of gravitydata corrections, see Butler (1980) or Telford et al. (1990).
Corrections for time variations
Gravity values over a survey area change with time becauseof earth tides and instrument drift. Instrument drift is causedby creep of the metal components in the meter as a result ofthermal expansion or excessive movement. Over short time pe-riods (less than 60 minutes), tidal gravity variation is approx-imately linear with time. The procedure used for correctingtime variations is frequent reoccupation of a base station andassumption that the gravity values at all stations in the surveyarea vary in the same manner as at the base station. The driftcorrection Agzo for each station is determined directly fromthe base station data.
Latitude correction
Both the rotation of the earth and its nonspherical shapeproduce an increase in gravity values with latitude. For the rel-atively small areas of microgravity surveys, it is sufficient to as-sign a reference latitude to the base station and use equation (1)to compute latitude corrections Ag L for all other stations,
Ogzi = ±0.811 x sin(2) x Os, (1)
where Ag, L is given in µGals, As is the north-south distance (inmeters) between the measurement and the base station, and 0is the reference latitude of the base station (34.5 0 for this site).The correction term is added (subtracted) to the measured
Downloaded 19 Oct 2012 to 140.194.40.43. Redistribution subject to SEG license or copyright; see Terms of Use at http://segdl.org/

Microgravity Investigations 97
gravity value if the station is positioned south (north) of thebase station.
Free-air correction
The free-air correction Ag = FA compensates for variations ingravitational attraction caused by the changing distances ofthe measurement stations from the center of the earth and iswritten as
AgzFA = ±308.55 x Ah, (2)
where A9,FA is given in µGals and Ah is the difference be-tween the elevation (in meters) of the measurement stationand the reference elevation of the base station. The correctionterm is added (subtracted) to the measured gravity value if theelevation of the station is higher (lower) than the referenceelevation.
Bouguer correction
The Bouguer correction AgzB compensates for gravity valuesaffected by different masses of material beneath the measure-ment stations solely as a result of elevation variations and iswritten as
AgzB = +41.91 x p x Ah, (3)
where AgzB is given in µGals, p is the material density (ingrams per cubic centimeter; 1.8 g/cm 3 for this site), and Ah isthe elevation difference (in meters) between the measurementstation and the base station. The quantity AgzB is subtracted(added) from the measured gravity if the elevation of the sta-tion is above (below) the reference elevation.
Bouguer gravity values
When all of the preceding corrections have been applied tothe observed gravity data, the result is the Bouguer gravityvalue gB , which is written as
gB = gobs ± OgzL. + Ag z FA + Agz B f OSzn> (4)
where gobs is the observed gravity reading and the remainingterms are the gravity corrections discussed above. Subtractingthe gravity readings recorded at the base station gbase from theBouguer gravity values at each station with the equation
AgB = gB — gbase (5)
results in the Bouguer gravity anomaly.
Terrain correction and regional-residual field separation
Terrain correction compensates station gravity values forthe attraction of terrain features. Within the upstream anddownstream switchyard gravity grid areas, the only correc-tions were for the switchyard structures, including the transfertrack trenches, each approximately 0.8 x 1.2 m (2.5 x 4 ft) incross-section, since the areas were otherwise flat. Outside thedownstream survey grid area there are small dropoffs (approx-imately 2 m, or 6.5 ft) to the south and the east and a significantdropoff (> 30 m, or > 100 ft) resulting from the Tennessee Riverbluff to the north. Outside the upstream survey grid area, how-ever, there are significant topographic variations that must be
addressed: large dropoffs on the north and east boundaries ofthe survey area, resulting from the location of the switchyard onthe high bluffs above the Tennessee River and the impoundedreservoir.
Careful consideration was given to the terrain of effects onthe switchyard structures. The terrain corrections for the trans-fer track trenches were accomplished by modeling each trenchas a horizontal, rectangular cross-section prism of infinite ex-tent. Because of the impracticality of directly modeling thecomplex assemblage of the above-ground transformers andswitchbanks, other approaches were followed. Gravity mea-surements were made around one of the transformers in aneffort to detect its gravity effect. Also, the gravity anomaly fora simple model of a transformer was calculated. These effortsindicated that the effect of a transformer on gravity measure-ments was less than 5 µGal for distances of greater than 3 m(10 ft) from the base. Next, an overlay of the non—terrain-corrected gravity anomaly map and a switchyard structure loca-tion map was examined for correlations. There was no apparentcorrelation between structure locations and gravity anomalies.Therefore, it was concluded that the net effect of the denseassemblage of structures was approximately constant over theinterior of the survey grid.
Because of the small target size, 3 m in diameter or less,and the shallow depths of interest, less than 30 m, the gravityeffects of topographic features outside the survey areas gener-ally will have spatial wavelengths larger than that of the targetanomalies. Therefore, the topographic features outside the sur-vey area can be treated as components of the local regional fieldvariation and corrected in a single regional-residual field sep-aration step (Butler, 1980, 1985). The local regional field canbe estimated by row and column averaging of the gravity data,polynomial surface fitting to the gravity data, or analytical for-ward modeling (Balch and Thompson, 1989; Butler and Yule,1984; Butler, 1985). The procedures used to correct the data fortopographic variations are discussed in the following sections.
DATA PROCESSING
Initial processing
The initial field processing consisted of applying the drift, lat-itude, free-air, and Bouguer corrections to the gravity readings.The readings were inspected for agreement of repeat measure-ments and for anomalous high or low readings with respect toreadings for surrounding stations. The repeat station measure-ment differences (mean f standard deviation) were 5 f 3 µGalfor the downstream switchyard and 10 f 6 µGal for the up-stream switchyard. This procedure was instituted daily to allowmodifications to the data acquisition to investigate possible in-consistencies in the data.
Regional -residual field separation
A final grid file was used to generate the Bouguer grav-ity map, which was inspected to identify general regionalfield characteristics so that an appropriate regional-residualfield separation method could be selected. Postsurvey dataprocessing consisted of application of terrain corrections andregional field removal, producing the final residual gravity map.The residual gravity map was used for anomaly selection and
Downloaded 19 Oct 2012 to 140.194.40.43. Redistribution subject to SEG license or copyright; see Terms of Use at http://segdl.org/

98
Yule et al.
interpretation. The final processing step involved removing theeffects of the regional gravity field component and surround-ing terrain features. A direct approach is to calculate analyt-ically the gravity effects of surrounding terrain and shallowgeologic structures for each measurement station. Althoughthese methods are the most direct and rigorous, they requireadditional elevation data to define the surrounding terrain andmuch detail about the geologic structures below and aroundthe survey area. Another approach, which relies only on thegravity data set, is possible if there is a heavily populated, well-distributed data set for the survey area: "Best-fitting" surfacescan be generated for the Bouguer gravity map. Correcting thegravity data by removing a best-fitting surface through the dataaccomplishes local regional-residual field separation and cor-rects for the effects of terrain outside the survey area. Thedegree of the surface removed from the data determines thespatial wavelengths of the anomalies that will be removed andthose that will be passed over. It is desirable to remove spa-tial wavelengths on the order of and greater than the surveygrid dimensions from the gravity map. Since the spatial wave-length is proportional to the maximum possible depth of thecausative subsurface feature, these procedures result in a resid-ual map that contains gravity anomalies caused predominantlyby subsurface features shallower than the mean survey areadimension in depth.
A simple, direct approach to define and remove the site re-gional field and correct for nearby terrain is to use a row andcolumn average removal technique. This approach works wellif the regional field has components that are broad and welldefined in one direction, especially if the direction coincideswith a grid axis. Removal of row and column averages wassuccessfully implemented in the removal of the river bluffeffect in the survey of the downstream switchyard. Laterreprocessing of the downstream switchyard data with poly-nomial surface removal verified the appropriateness of theearlier approach. However, this simple approach is too crudefor the regional field that exists in the data from the upstreamswitchyard. The upstream switchyard survey requires a moreversatile approach to appropriately model the gravity data sur-face trends. A general polynomial surface removal can accountfor more complicated regional fields and terrain geometrieswith no preference for features aligned with the grid axes.
After the regional field separation step was accomplished,the resulting residual gravity map was examined to identifyanomalies. This is a judgement phase in which relative high-and low-gravity areas are selected for subsequent investigation.The residual anomalies, particularly their magnitudes, are afunction of the selected regional surface. The regional surfacedefines the local reference level over the site from which departrelative high- and low-gravity areas. However, if an anomalyis detectable, a possible error caused by selecting an arbitraryreference surface would incorrectly estimate the size and depthof the subsurface feature causing the anomaly. The grid locationof the feature would be relatively unaffected.
RESIDUAL ANOMALY MAPS
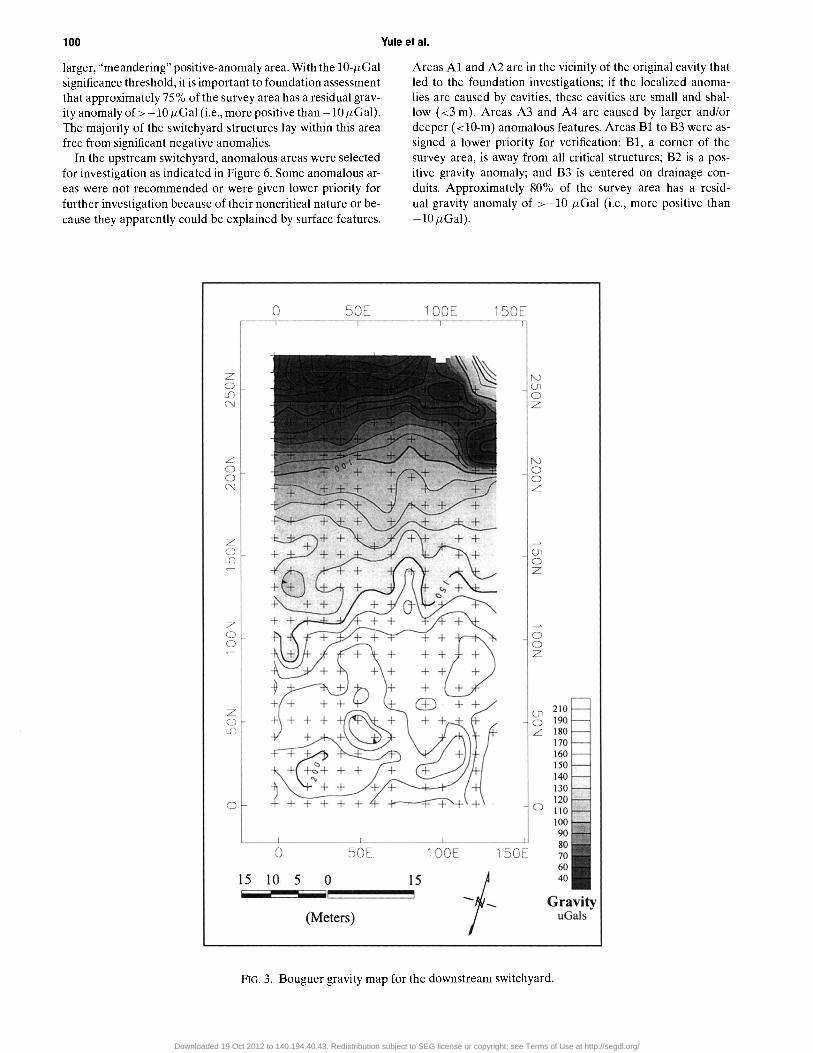
The Bouguer gravity map for the upstream switchyard isshown in Figure 2, and that for the downstream switchyardis shown in Figure 3. The local regional field and terrain ef-fects are evident as the broad surface trends, and the scattered,
relatively small surface deviations are gravity anomalies causedby shallow, subsurface density anomalies. The purpose of thesubsequent processing is to remove these broad trends and en-hance and reveal localized deviations from the overall trend.
Downstream switchyard
The row and column average removal technique, which in-volves finding the grid row and column averages and then sub-tracting these quantities from the Bouguer gravity, was usedsuccessfully for the data set from the downstream switchyard(Yule and Butler, 1984). As shown in Figure 4, a plot of row av-erages clearly defined the decreasing gravity values from southto north (toward the river bluff); this plot was closely predictedby the gravity response of the 2-D model shown below thedata in the figure. It is clear from a comparison of measuredand modeled gravity response data that the decrease in grav-ity observed in the row averages was caused predominantly bythe river bluff. Calculations such as those shown in Figure 4were made for various rock densities and bluff slopes (sincethe bluff slope is not well characterized). The best fit to thedata in Figure 4 was for a rock density of PR = 2.5 g/cm3 and abluff slope of 45°. Including the small dropoff to the south ofthe survey area in the model provided a nearly exact fit to themeasured data.
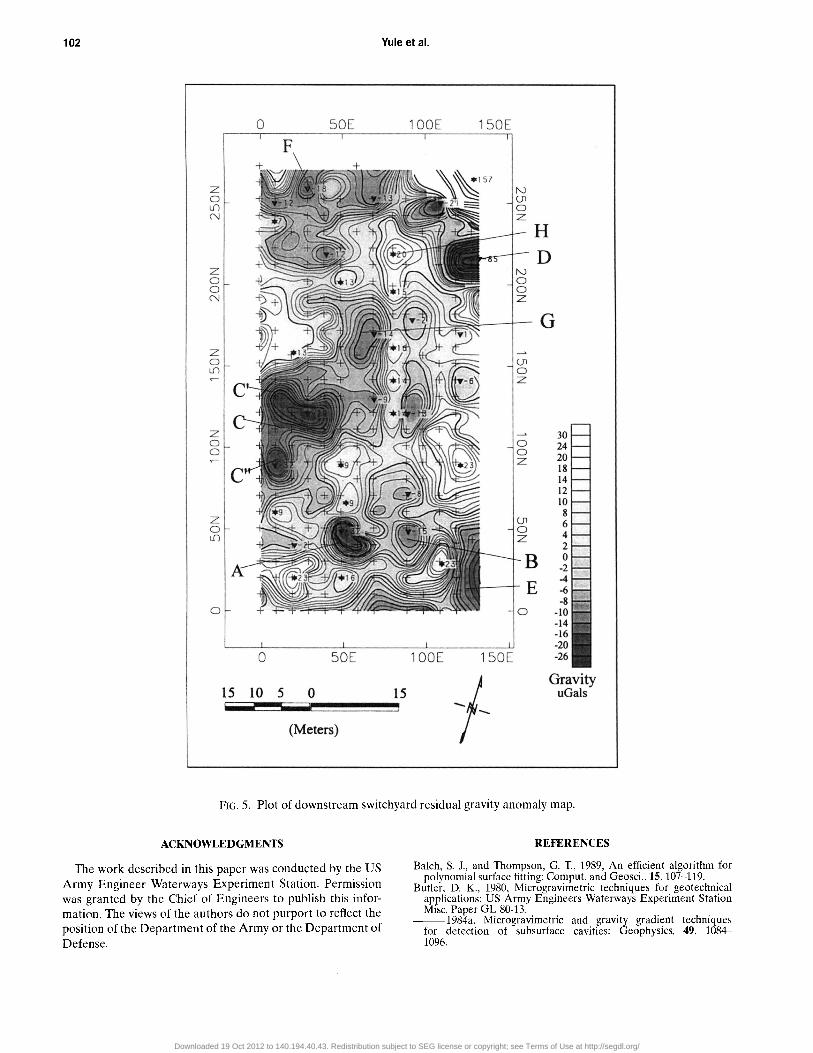
In later reprocessing of the downstream data set, polynomialsurface modeling was used for the regional-residual field sepa-ration (Camacho et al., 1994). In this method, a mathematicalsurface was generated to fit the non—terrain-corrected Bouguergravity data with a polynomial equation of various orders. Forthis data set, second-, third-, and fourth-order polynomial sur-faces were fit to the data with the calculated degrees of fit, ameasure of how well they approximated the original surface,91.3%, 91.4%, and 91.9%, respectively. These results led tothe conclusion that the second-order fit was appropriate, sup-porting the earlier row and column averaging approach in thiscase. The procedure described here accomplishes the externalterrain correction and local regional-residual field separationin a single step. The results from both regional-residual fieldseparation techniques were very similar. Figure 5 is a plot ofthe downstream switchyard residual gravity anomaly derivedfrom the polynomial surface fitting method.
Upstream switchyard
Because of the complexity of the upstream switchyard re-gional trend, the local regional field was removed by use ofpolynomial surface fitting. The nature of the Bouguer gravitysurface indicated a third-order polynomial surface as a mini-mum. Higher-order (fourth and fifth) surfaces also were gen-erated to model the regional field to help select the appro-priate fit. The calculated degrees of fit for third-, fourth-, andfifth-order polynomial surfaces to the Bouguer gravity, 86.5%,90.3%, and 90.9%, respectively, led to the conclusion that thefourth-order fit was appropriate and fit all the long-wavelengthfeatures of the surface. The residual gravity anomaly map (ob-tained by subtracting the fourth-order best-fit surface from theBouguer anomaly map; Figure 3) is shown in Figure 6.
ANOMALY SELECTION AND ASSESSMENT
Anomalous zones were identified on the residual gravitymaps and ranked. The zones were identified on the basis of
Downloaded 19 Oct 2012 to 140.194.40.43. Redistribution subject to SEG license or copyright; see Terms of Use at http://segdl.org/

Microgravity Investigations
99
whether they exceeded a threshold level (f10 µGal), possessedareal coherence, and were unexplained.
The ranking was based on considerations of location (nearcritical structures or the known past sinkhole) and anomalysense. Negative anomalies are of critical interest for this sur-vey, whereas verifying the positive anomalies is useful in de-termining the correctness of the data processing and to help inexplaining general subsurface conditions. In the downstreamswitchyard, anomalous areas, such as those indicated by A toH in Figure 5, were selected and prioritized as possible targets
for the verification drilling program. Anomalies A, B, C (C'and C"), F, and G are closed negative features that could indi-cate shallow (<10-m), compact cavities or low-density zones.Anomaly D is distinctive because of its large negative magni-tude (- —60 µGal) and relatively small spatial extent (<10 m);this anomaly could be caused by a near-vertical, cylindrical,low-density feature that lies very close to the surface. AnomalyE was identified as an artifact of the terrain correction processand assigned allow priority. Anomaly H is a positive-anomalyarea arbitrarily selected for validation and is embedded in a
FIG. 2. Bouguer gravity map for the upstream switchyard.
Downloaded 19 Oct 2012 to 140.194.40.43. Redistribution subject to SEG license or copyright; see Terms of Use at http://segdl.org/
100
Yule et al.
larger, "meandering" positive-anomaly area. With the 10-µGal
Areas Al and A2 are in the vicinity of the original cavity thatsignificance threshold, it is important to foundation assessment
led to the foundation investigations; if the localized anoma-
that approximately 75% of the survey area has a residual grav- lies are caused by cavities, these cavities are small and shal-ity anomaly of >-10 gGal (i.e., more positive than —10 µGal). low (<3 m). Areas A3 and A4 are caused by larger and/orThe majority of the switchyard structures lay within this area
deeper (<10-m) anomalous features. Areas Bl to B3 were as-free from significant negative anomalies. signed a lower priority for verification: B1, a corner of the
In the upstream switchyard, anomalous areas were selected survey area, is away from all critical structures; B2 is a pos-
for investigation as indicated in Figure 6. Some anomalous ar- itive gravity anomaly; and B3 is centered on drainage con-eas were not recommended or were given lower priority for
duits. Approximately 80% of the survey area has a resid-further investigation because of their noncritical nature or be- ual gravity anomaly of >-10 µGal (i.e., more positive thancause they apparently could be explained by surface features. —10 µGal).
FIG. 3. Bouguer gravity map for the downstream switchyard.
Downloaded 19 Oct 2012 to 140.194.40.43. Redistribution subject to SEG license or copyright; see Terms of Use at http://segdl.org/

Microgravity Investigations
101
VERIFICATION DRILLING
The selected anomalous areas were investigated through adrilling program (Tennessee Valley Authority, 1989). The rec-ommended drilling depth for all borings was to the top of lime-stone or refusal. In the downstream switchyard, 16 boringswere placed to validate the anomalous conditions. Of the 10borings into negative anomalies, 4 borings encountered mudzones (saturated) above the top of rock, 1 boring encountereda soft zone at a shallow depth (consistent with the gravity depthprediction), and 1 boring encountered a significant zone (about9 m thick above the top of rock) described as very soft and pos-sibly a void. The borings placed in positive-anomaly areas weredescribed as encountering no voids or soft zones.
In the upstream switchyard, 13 borings were placed to inves-tigate the anomalous conditions. Five were placed in negative-anomaly areas, six were placed in positive-anomaly areas, andtwo were placed in a transitional area (-10 µGal to +10 µGal).Four of the borings in positive-anomaly areas were closelyspaced in anomaly area B2. Two additional borings were placedon the basis of other, nongeophysical factors. Of the five bor-ings in negative-anomaly areas, three (in A3, A4, and B3) en-countered very soft zones in which the standard penetrationtest blow counts were very small (N value, <3). 1 The othertwo borings detected no voids. Of the six borings placed in
positive-anomaly areas, the four borings in anomaly area B2encountered an extensive, shallow, very hard chert mass (eithera large cherty limestone remnant or a pinnacle). The remainingborings encountered no voids. One of the two borings placedwithout the help of the microgravity survey detected a very softzone or possible void.
CONCLUSION
A microgravity survey of the upstream and downstreamswitchyards of the Wilson Dam powerplant was performedwith the objective of detecting subsurface cavities or otheranomalous conditions in the switchyard foundations that couldthreaten the stability of switchyard structures. The micrograv-ity survey and treatment of the terrain effects led to the devel-opment of residual gravity maps that allowed identification ofshallow foundation anomalies. Exploratory boring locationswere selected on the basis of a prioritization of the gravityanomalies in the two switchyards. The drilling program wasguided by anomaly size and depth estimates and encounteredzones classified as voids, mud zones, or very soft zones in bothswitchyards, as expected from the low gravity readings in theseareas. The microgravity surveys allowed the formulation andexecution of a limited and rational foundation investigationplan in a difficult and dangerous drilling environment.
FIG. 4. Plot of row averages for the downstream switchyard (south to north), with a 2-D model of the site shown below the plot.
'The standard penetration test is a geotechnical in-situ borehole testconducted during soil sampling to estimate soil strength and relativedensity. The SPT N value is the number of drops of a standard massrequired to drive a sampling tube 1 ft into the soil.
Downloaded 19 Oct 2012 to 140.194.40.43. Redistribution subject to SEG license or copyright; see Terms of Use at http://segdl.org/
102 Yule et al.
FIG. 5. Plot of downstream switchyard residual gravity anomaly map.
ACKNOWLEDGMENTS
The work described in this paper was conducted by the USArmy Engineer Waterways Experiment Station. Permissionwas granted by the Chief of Engineers to publish this infor-mation. The views of the authors do not purport to reflect theposition of the Department of the Army or the Department ofDefense.
REFERENCES
Balch, S. J., and Thompson, G. T., 1989, An efficient algorithm forpolynomial surface fitting: Comput. and Geosci.,15,107-119.
Butler, D. K., 1980, Microgravimetric techniques for geotechnicalapplications: US Army Engineers Waterways Experiment StationMisc. Paper GL-80-13.
1984a, Microgravimetric and gravity gradient techniquesfor detection of subsurface cavities: Geophysics, 49, 1084-1096.
Downloaded 19 Oct 2012 to 140.194.40.43. Redistribution subject to SEG license or copyright; see Terms of Use at http://segdl.org/

Microgravity Investigations
103
FIG. 6. Plot of upstream switchyard residual gravity anomaly map.
1984b, Microgravimetric techniques for detection and delin-eation of subsurface cavities, in National Symposium and Workshopson Abandoned Mine Lands Reclamation: Science Reviews Ltd. 63-100.
1985, Topographic effects considerations in microgravity sur-veying, in Proc. International Meeting on Potential Fields inRugged Topography: Institute de Geophysique, IGL Bull. No. 7,34-40.
Butler, D. K., and Yule, D. E., 1984, Microgravity survey of Wilson DamPowerplant switchyards, Florence, Alabama: US Army EngineersWaterways Experiment Station Misc. Paper GL-84-16.
Camacho, A. G., Vieira, R., Montesinos, F. G., and Cuellar, V., 1994. Agravimetric 3D inversion for cavity detection: Geophys. Prosp., 42,113-130.
Hinze, W. J., 1990, The role of gravity and magnetic methods in engi-neering and environmental studies, in Ward, S. H., Ed., Geotechnical
and environmental geophysics: Soc. Expl. Geophys., I, 75-126.Telford, W. M., Gedart, L. P., and Sheriff, R. E., 1990, Applied geo-
physics: Cambridge Univ. Press.Tennessee Valley Authority, 1989, Wilson project, upstream switchyard
subsurface investigation, Chattanooga, TN.Wenjin, L., and Jiajian, X., 1990, The effectiveness of the high-precision
gravity method in detecting sinkholes in Taian Railway Station ofShandong Province, in Ward, S. H., Geotechnical and environmentalgeophysics: Soc. Expl. Geophys., III, 169-174.
Yule, D. E., and Butler, D. K., 1984, Microgravity survey of a pow-erplant switchyard employing microcomputer data processing: 54thAnn. Internat. Mtg., Soc. Expl. Geophys., Expanded Abstracts, 142-146.
Yule, D. E., Butler, D. K., and Sharp, M. K., 1990, Foundation inves-tigation of a powerplant switchyard using microgravity: 60th Ann.Internat. Mtg., Soc. ExpL Geophys., Expanded Abstracts, 627-630.
Downloaded 19 Oct 2012 to 140.194.40.43. Redistribution subject to SEG license or copyright; see Terms of Use at http://segdl.org/