safety innovation performance customers
TRANSCRIPT

SAFETY INNOVATION
PERFORMANCE CUSTOMERS
Cabot CorporationAnnual Report 2009

Cabot Corporation is a global performance materials company,
headquartered in Boston, Massachusetts, U.S.A. We are dedicated
to creating products that matter to our customers and, ultimately,
the consumers who buy their products. Whether it’s carbon black
for tires, fumed silica for adhesives, tantalum for cell phones,
colorants for ink jet printers, cesium formate for oil and gas drilling,
or aerogels for insulation panels, Cabot materials are a vital part
of the world in which we live. While our product offerings have
changed since our founding in 1882, our commitment to innova-
tion, performance and long-term growth has not. For all these
reasons, our corporate slogan is “creating what matters”.

Letter to Shareholders
2007 2008 2009
Dear fellow shareholders,
The global economic slowdown of 2009 dramatically affectedour business performance, created tremendous uncertainty and ledto one of the most difficult financial years in Cabot's history. Thedownturn also took its toll on our customers, employees and share-holders. Through it all, I have been impressed with our company'sability to rise to the challenges, execute with razor sharp intensity,maintain a long-term focus, and plan for better days.
Developing and executing a comprehensive plan early in the crisis in many ways allowed us to take our fate into our own hands. Notwithstanding the unprecedented times, we were able to further our global strategy and stay on track to deliver on ourlong-term goals.
2009 in Review
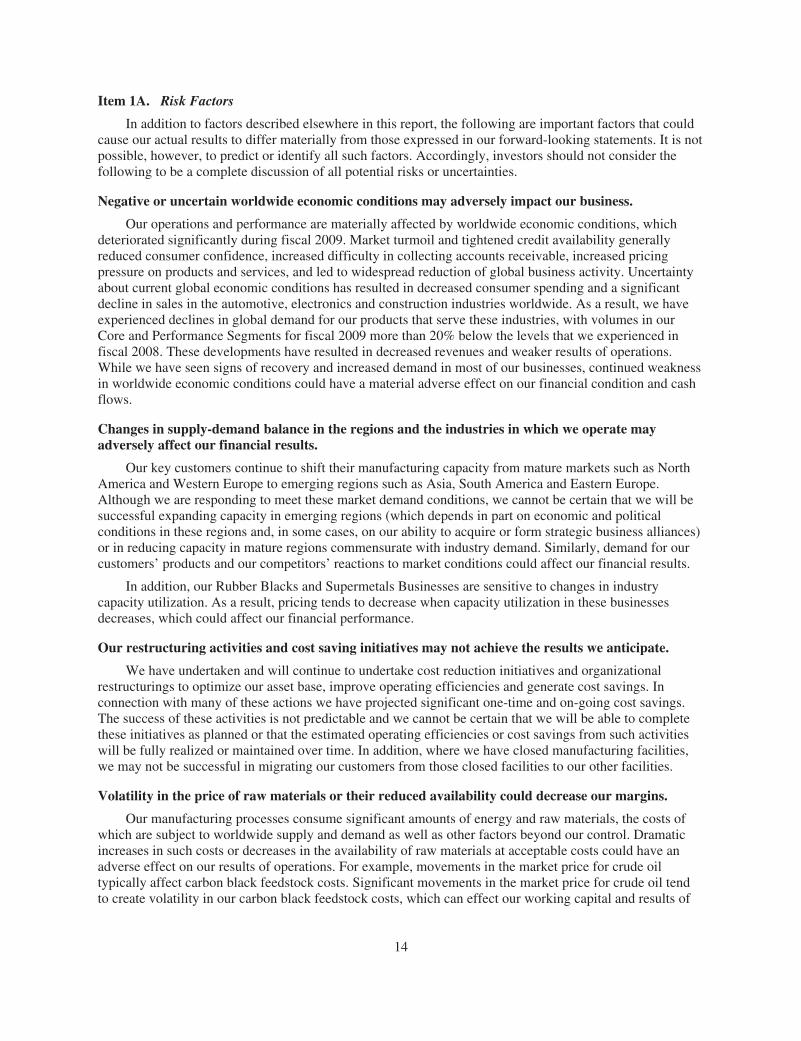
For many years, safety has been a critical element of our suc-cess. During 2009, we continued to perform at a world class level,ending the year with our best ever safety record. Our total record-able incident rate (TRIR)* was 0.36. This is a significant improve-ment from last year’s 0.47 and puts us in the top tier of chemicalcompanies worldwide. We also continue to make solid progress inreducing the risk of process safety events. We hold steadfast to ourbelief that all safety incidents are preventable and remain commit-ted to our goal of zero incidents.
The environmental area is becoming ever more critical to our busi-nesses, and, in 2009, we reduced our environmental non-confor-mances by 40%. Also during the year, we participated for the firsttime in the Carbon Disclosure Project, which publishes greenhousegas emissions data for over 3,000 global companies. The compari-son of our greenhouse gas program positioned us well against our
2007 2008 2009
Total RecordableIncident Rate
Environmental Non-Conformances
* includes all employees and con-tractors at all Cabot locations
.5
.4
.3
.2
.1
0
30
20
10
0

2
peers. We are actively working on multiple technology projects that haveboth financial and environmental performance benefits in the long-term.This remains an important strategic area for us.
On the financial front, for fiscal 2009 we recorded a loss per share of$1.23, including $1.38 per share of charges from certain items. This iscompared to earnings of $1.34 per share in fiscal 2008, including $0.15per share of charges from certain items. Our financial performance in2009 was mainly affected by volumes in our key end markets, whichdropped by as much as 30 to 40% at their lowest point.
In response to the crisis, and keeping our long-term goals in mind, weimplemented a restructuring of our operations. We developed thoroughmarket-based scenarios that led to the actions we put in place. Weacted early with a targeted program as we saw the potential for anextended slowdown. Our program required closing several of our manu-facturing sites, each of which has been part of our company for manyyears. As a result of these closures, we saw the departure of many of our valued colleagues and friends. These decisions were difficult butnecessary to ensure our future. Throughout the planning, our objectivewas to maximize results without sacrificing our ability to compete once a recovery commenced. As such, we mothballed or curtailed capacity in certain geographies on a temporary basis to ensure we could restartoperations quickly when demand increased. We also maintained invest-ment in our highest value R&D projects, new business opportunities, andcapacity expansions in emerging regions.
Our expected fixed cost savings from the restructuring, which willexceed $80 million, will be fully achieved in fiscal 2010. This provides usa more efficient platform from which to compete. The one-time costs toimplement the plan were originally estimated to be $150 million. Throughstrong discipline and project focus, we were able to reduce these coststo approximately $115 million.
During the year, we reaffirmed our financial targets of $3 of adjustedearnings per share by 2012 and a 13% adjusted return on invested capi-tal by 2014. The weak economic environment caused us to extend ourinitial timing to achieve these targets by one year. Given the strength ofour company and the strategic initiatives underway, we are confident in
Operating Cash Flow(dollars in millions)
Return on AverageStockholders’ Equity (%)
Fiscal Year
400
300
200
100
0
Fiscal Year
10
5
0
10 2007 2008 2009
2007 2008 2009
Cabot Corporation Financial Highlights(dollars in millions, except per share amounts)
2007 2008 2009Operating ResultsOperating revenues $2,616 $3,191 $2,243Income from continuing operations $127 $86 $(77)
Per diluted common share $1.87 $1.34 $(1.22)Net income $129 $86 $(77)
Per diluted common share $1.90 $1.34 $(1.23)
Financial PositionAssets $2,636 $2,858 $2,676Net property, plant and equipment $1,016 $1,082 $1,012Stockholders’ equity $1,194 $1,249 $1,134Return on average stockholders’ equity 11% 8% (6)%

3
our ability to meet these goals and delivervalue to our shareholders.
Business Performance
Fiscal 2009 was a difficult year for ourcore businesses principally as a result ofvery weak volumes and disruptive feedstockand finished product inventory effects. On apositive note, however, our new businessefforts produced continual improvementsdespite the weak economic environment.
Core Segment
In the Rubber Blacks business, a combina-tion of decreased demand and customer de-stocking in the tire and automotive marketsresulted in volumes that were 20 to 30%below last year's levels. We maintained ourresolve to eliminate the effects of the con-tract lag volatility on our business profitabili-ty and during 2009 we reduced the percent-age of our volumes subject to the lag from50% to 25%. We anticipate further progressin this area during 2010. We also continue toinvest in new product and process technologywith both near- and long-term value creationpotential.
The severe downturn in the electronicsindustry in early 2009 depressed demand forour products in the Supermetals business.We kept this business on a clear cash maxi-mization path during the year, generating$39 million in 2009. We have also furtherrestructured our operations with the aim ofimproving our performance in 2010.
Performance Segment
Due to its reliance on the automotive, construction andelectronics industries, the Performance segment experi-enced a sharp decline in its volumes with levels 30 to40% below 2008. The high value we bring to our cus-tomers' applications and the superior quality and serv-ice relationships we have built with our customers overthe years allowed us to maintain margins through thedownturn. We continue to enhance our marketing andapplications development capabilities as market-focusedpartnerships with our customers are key to the develop-ment of new and improved products.
New Business Segment
In 2008, we recommitted ourselves to improving theperformance of the New Business segment. Our focuson key projects and more near-term delivery of growthincreased revenue by 16% and cash flow by $43 millionin 2009. We are pleased with our prioritized pipeline ofopportunities and anticipate building on this success in 2010.
Specialty Fluids Segment
The Specialty Fluids segment produced solid resultsduring the year despite the economic crisis, a testamentto the value added nature of our technology. We againmade progress in expanding our geographic reach,increasing the percentage of revenue from business out-side of the North Sea to 29%, up from 21% in 2008.
From a corporate perspective, our cash and liquidityposition remained solid throughout 2009. We significantlyreduced working capital and maintained a strong balancesheet. This enabled us to retain our BBB+/Baa1 creditratings. In September, we raised $300 million in long-term public debt on very favorable terms. These accom-
Business Segments* Business Model Focus
Niche commodity costs, raw materials, process
Specialty sales, application development, marketing
Service technical service, sales
High growth research & development, marketing
Core: Rubber Blacks, Supermetals
Performance: Fumed Metal Oxides, PPBG
Specialty Fluids
New Business: Inkjet Colorants, Aerogel,Superior MicroPowders
*For a description of Cabot businesses, please refer to our 2009 Annual Report on Form 10-K.

4
plishments reflect positively on our long-term strategicapproach to managing the company's balance sheet.
2010 and Beyond
Since January 2009 we have seen consistentsequential improvement in our volumes and operatingresults driven by increased demand in our key end mar-kets. The improvements have been particularly strong inthe emerging markets of China, South America andSoutheast Asia where we are well positioned. As aresult, in August we commissioned the expansion of ourcarbon black capacity in Tianjin, China, making it thelargest and most technologically advanced carbon blackfacility in the world.
In all, 2009 was a significant test for our organizationand given the complexity of the challenge, I am proud ofthe Cabot team and its performance. We were notpleased with our financial performance or its impact onour shareholders. However, the speed of our responseand the early delivery of our cost reductions reaffirmedour team’s strong capabilities. Our decisive and well-implemented actions in 2009, our continued invest-ments in emerging markets, our focus on energy recov-ery technology and our new business development suc-cesses position us well for the future. I have full confi-dence in our ability to achieve our strategic objectivesand long-term financial targets.
As we begin 2010, we will maintain our focus on the keyelements of our success: safety, innovation, perform-ance and customers. Cabot remains a unique companyand one that I believe is stronger now than it was beforethe economic downturn. We look to the coming yearwith optimism and sincerely thank you for your contin-ued interest and investment.
Respectfully,
Patrick M. PrevostPresident and Chief Executive Officer
Cabot Corporation Vision - Goal
Deliver earnings growth through leadership in performance materials
margin improvement
capacity and emerging market
expansion
new product development
portfoliomanagement
safety innovation
performance customers

5
Directors
John F. O'Brien (Non-Executive Chairman of the
Board) retired President and Chief Executive
Officer, Allmerica Financial Corporation (holding
company for insurance and other financial
services)
Patrick M. Prevost President and Chief Executive
Officer, Cabot Corporation
John S. Clarkeson Chairman Emeritus, The Boston
Consulting Group, Inc. (management consulting)
Juan Enriquez-Cabot Chairman and Chief Executive
Officer, Biotechonomy (life sciences research
and investment firm)
Arthur L. Goldstein retired Chairman, Ionics,
Incorporated (water purification)
Gautam S. Kaji Founder and Chairman, Centennial
Group, Inc. (strategic advisory firm)
Roderick C.G. MacLeod Co-Founder and Principal,
Waverley Investments Ltd. and St. Martins
Finance Ltd. (private equity investment
companies)
Henry F. McCance Chairman Emeritus, Greylock
Management Corporation (private venture
capital firm)
John K. McGillicuddy retired Audit Partner,
KPMG, LLP
Ronaldo H. Schmitz retired Executive Director,
Deutsche Bank Group
Lydia W. Thomas retired President and Chief
Executive Officer, Noblis, Inc. (research and
development for public interest)
Mark S. Wrighton Chancellor and Professor of
Chemistry, Washington University in St. Louis
Shengman Zhang* President, Asia Pacific and
Vice Chairman of Global Banking, Citigroup
* Mr. Zhang's term on Cabot's Board of Directors expires on March 11, 2010.** Ms. Sudac has resigned from Cabot effective March 15, 2010.
Officers
Patrick M. Prevost President and Chief Executive
Officer
James A. Belmont Vice President
Brian A. Berube Vice President, General Counsel
Douglas A. Church Vice President, Chief
Information Officer
Eduardo E. Cordeiro Executive Vice President, Chief
Financial Officer
Nicholas S. Cross Vice President, General Manager,
Europe, Middle East, Africa Region
Peter M. Hunt Vice President, Tax
James P. Kelly Vice President, Controller
Sean D. Keohane Vice President, General Manager,
Performance Segment
Yakov Kutsovsky Vice President, Research &
Development
Helmut Lorat Vice President, Engineering
David A. Miller Executive Vice President, General
Manager, Core Segment and Americas Region
Martin J. O'Neill Vice President, Safety, Health, and
Environmental Affairs
Ravijit Paintal Vice President, General Manager,
Specialty Fluids Segment
Chang Loo Sih Vice President, South America
Robby D. Sisco Vice President, Human Resources
Irene S. Sudac** Vice President
James B. Turner Vice President, Operations,
Specialty Fluids Segment
Friedrich von Gottberg Vice President, General
Manager, New Business Segment
Xinsheng Zhang Vice President, General Manager,
Asia Pacific Region
Jane A. Bell Secretary
Karen Abrams Assistant Secretary
Lisa M. Dumont Assistant Controller
John F. Fox Assistant Treasurer

6
2004 2005 2006 2007 2008 2009
Cabot Corporation $100.00 $87.24 $100.15 $97.25 $89.09 $67.83
S&P 500 Chemicals Index $100.00 $103.03 $121.18 $161.36 $144.60 $138.79
S&P 500 Specialty Chemicals Index $100.00 $102.84 $126.58 $154.19 $165.37 $193.58
S&P 500 Stock Index $100.00 $112.25 $124.36 $144.81 $112.99 $105.18
S&P Midcap 400 Index $100.00 $122.16 $130.17 $154.59 $128.81 $124.80
S&P 400 Chemicals Index $100.00 $109.39 $114.78 $160.95 $142.22 $157.13
The following graphs compare the cumulative total stockholder return onCabot common stock for the five and ten year periods ending September 30,2009 with the S&P 500 Stock Index, the S&P Midcap 400 Index, the S&P 500Specialty Chemicals Index, the S&P 500 Chemicals Index, and the S&P 400Chemicals Index. The comparisons assume the investment of $100 onOctober 1, 2004 and October 1, 1999 in Cabot’s common stock and in each ofthe indices and the reinvestment of all dividends.
Comparison of Five Year Cumulative Total Return
September 30 . . .
Performance Graphs
250
200
150
100
50
0
2004 2005 2006 2007 2008 2009

7
Cabot Corporation
S&P 500 Chemicals Index
S&P 500 Specialty Chemicals Index
S&P 500 Stock Index
S&P Midcap 400 Index
S&P 400 Chemicals Index
1999 2000 2001 2002 2003 2004 2005 2006 2007 2008 2009
$100.00 $135.83 $279.69 $149.91 $207.83 $286.10 $249.60 $286.53 $278.24 $254.88 $194.06
$100.00 $79.91 $87.73 $88.38 $104.19 $132.13 $136.13 $160.10 $213.20 $191.06 $183.38
$100.00 $74.18 $87.81 $97.86 $108.44 $135.16 $139.00 $171.09 $208.40 $223.51 $261.63
$100.00 $113.28 $83.13 $66.10 $82.22 $93.63 $105.10 $116.44 $135.58 $105.79 $98.48
$100.00 $143.22 $116.00 $110.55 $140.19 $164.80 $201.32 $214.53 $254.77 $212.28 $205.67
$100.00 $86.87 $100.93 $102.32 $108.92 $151.44 $165.66 $173.82 $243.74 $215.38 $237.95
Comparison of Ten Year Cumulative Total Return
September 30 . . .
300
250
200
150
100
50
0
1999 2000 2001 2002 2003 2004 2005 2006 2007 2008 2009

8
Corporate Information
Corporate OfficesCabot CorporationTwo Seaport LaneSuite 1300Boston, Massachusetts 02210-2019(617) 345-0100
For information about Cabot Corporation and our businesses, visit our web site at: www.cabot-corp.com.
Investor RelationsInvestor inquiries are welcome and individuals areinvited to contact us by letter at the address above orby telephone at (617) 342-6129.
Stock ListingCabot Corporation common stock is listed on theNew York Stock Exchange under the symbol CBT.
Annual MeetingThe Annual Meeting of Stockholders will be held onThursday, March 11, 2010 at 4:00 p.m., at the corpo-rate headquarters of Cabot Corporation, Two SeaportLane, Floor 13, Boston, Massachusetts. All stockhold-ers are invited to attend.
Stock Transfer Agent and RegistrarRegistered shareholders may contact the transferagent through the Internet or by phone for informationor assistance with receiving proxy materials electroni-cally through the Internet, direct deposit of dividendpayments, dividend check replacements, account his-tory, lost stock certificates, taxable income or toreport address changes. The transfer agent providestelephone assistance Monday through Friday, 9:00a.m. to 5:00 p.m. (Eastern Time). Extended service isavailable 24 hours a day, seven days a week to callerswith touch-tone telephones via the transfer agent'sInteractive Voice Response System.
Please mention Cabot Corporation, your name asprinted on your stock certificates or account, yourSocial Security number and your address and tele-phone number in all correspondences with the transfer agent.
Computershare Trust Company, N.A.c/o Computershare Investor ServicesP.O. Box 43078Providence, Rhode Island 02940-3078
Stockholder inquiries: (781) 575-3170 or (800) 730-4001 For the hearing impaired: (800) 952-9245 (TTY/TDD)Web site: www.computershare.com/investor
Dividend Reinvestment PlanCabot Corporation offers a convenient dividend rein-vestment and cash purchase plan for registeredstockholders, providing a simple way to increaseinvestment in Cabot Corporation (CBT) commonstock. The plan allows stockholders to automaticallyreinvest all or part of their dividends in additionalCabot shares. Participation in the plan also allowsregistered stockholders to purchase shares of Cabotcommon stock with a value of up to $10,000, on aquarterly basis, free of brokerage fees and commis-sions. To request an enrollment form, write or callComputershare at the above address.

UNITED STATES SECURITIES AND EXCHANGE COMMISSIONWashington, D.C. 20549
Form 10-KÈ ANNUAL REPORT PURSUANT TO SECTION 13 OR 15(d) OF THE SECURITIES
EXCHANGE ACT OF 1934For the fiscal year ended September 30, 2009
or
‘ TRANSITION REPORT PURSUANT TO SECTION 13 OR 15(d) OF THE SECURITIESEXCHANGE ACT OF 1934For the transition period from to
Commission file number 1-5667
Cabot Corporation(Exact name of Registrant as specified in its charter)
Delaware 04-2271897(State or other jurisdiction ofincorporation or organization)
(I.R.S. EmployerIdentification No.)
Two Seaport Lane, Suite 1300Boston, Massachusetts 02210
(Address of Principal Executive Offices) (Zip Code)
(617) 345-0100(Registrant’s telephone number, including area code)
Securities registered pursuant to Section 12(b) of the Act:Title of Each Class Name of Each Exchange on Which Registered
Common stock, $1.00 par value per share New York Stock ExchangeIndicate by check mark if the Registrant is a well-known seasoned issuer, as defined in Rule 405 of the Securities
Act. Yes È No ‘
Indicate by check mark if the Registrant is not required to file reports pursuant to Section 13 or Section 15(d) of theAct. Yes ‘ No È
Indicate by check mark whether the Registrant (1) has filed all reports required to be filed by Section 13 or 15(d) of the SecuritiesExchange Act of 1934 during the preceding 12 months (or for such shorter period that the Registrant was required to file such reports),and (2) has been subject to such filing requirements for the past 90 days. Yes È No ‘
Indicate by check mark whether the registrant has submitted electronically and posted on its corporate Web site, if any, everyInteractive Data File required to be submitted and posted pursuant to Rule 405 of Regulation S-T (§232.405 of this chapter) during thepreceding 12 months (or for such shorter period that the registrant was required to submit and post such files). Yes ‘ No ‘
Indicate by check mark if disclosure of delinquent filers pursuant to Item 405 of Regulation S-K is not contained herein, and willnot be contained, to the best of the Registrant’s knowledge, in definitive proxy or information statements incorporated by reference inPart III of this Form 10-K or any amendment to this Form 10-K. È
Indicate by check mark whether the Registrant is a large accelerated filer, an accelerated filer, a non-accelerated filer or a smallerreporting company. See definitions of “large accelerated filer,” “accelerated filer” and “smaller reporting company” in Rule 12b-2 ofthe Exchange Act.
Large accelerated filer È Accelerated filer ‘
Non-accelerated filer ‘ (Do not check if a smaller reporting company) Smaller reporting company ‘
Indicate by check mark whether the Registrant is a shell company (as defined in Rule 12b-2 of the Exchange Act). Yes ‘ No È
As of the last business day of the Registrant’s most recently completed second fiscal quarter (March 31, 2009), the aggregatemarket value of the Registrant’s common stock held by non-affiliates was approximately $677,797,425. As of November 19, 2009,there were 65,326,403 shares of the Registrant’s common stock outstanding.
DOCUMENTS INCORPORATED BY REFERENCEPortions of the Registrant’s definitive proxy statement for its 2010 Annual Meeting of Shareholders are incorporated by reference
in Part III of this annual report on Form 10-K.

TABLE OF CONTENTS
PART IITEM 1. Business . . . . . . . . . . . . . . . . . . . . . . . . . . . . . . . . . . . . . . . . . . . . . . . . . . . . . . . . . . . . . . . . 3
ITEM 1A. Risk Factors . . . . . . . . . . . . . . . . . . . . . . . . . . . . . . . . . . . . . . . . . . . . . . . . . . . . . . . . . . . . . 14
ITEM 1B. Unresolved Staff Comments . . . . . . . . . . . . . . . . . . . . . . . . . . . . . . . . . . . . . . . . . . . . . . . . 19
ITEM 2. Properties . . . . . . . . . . . . . . . . . . . . . . . . . . . . . . . . . . . . . . . . . . . . . . . . . . . . . . . . . . . . . . . 19
ITEM 3. Legal Proceedings . . . . . . . . . . . . . . . . . . . . . . . . . . . . . . . . . . . . . . . . . . . . . . . . . . . . . . . . 21
ITEM 4. Submission of Matters to a Vote of Security Holders . . . . . . . . . . . . . . . . . . . . . . . . . . . . . 24
PART II
ITEM 5. Market for Registrant’s Common Equity, Related Stockholder Matters and IssuerPurchases of Equity Securities . . . . . . . . . . . . . . . . . . . . . . . . . . . . . . . . . . . . . . . . . . . . 25
ITEM 6. Selected Financial Data . . . . . . . . . . . . . . . . . . . . . . . . . . . . . . . . . . . . . . . . . . . . . . . . . . . . 26
ITEM 7. Management’s Discussion and Analysis of Financial Condition and Results ofOperations . . . . . . . . . . . . . . . . . . . . . . . . . . . . . . . . . . . . . . . . . . . . . . . . . . . . . . . . . . . . 28
ITEM 7A. Quantitative and Qualitative Disclosures About Market Risk . . . . . . . . . . . . . . . . . . . . . . 49
ITEM 8. Financial Statements and Supplementary Data . . . . . . . . . . . . . . . . . . . . . . . . . . . . . . . . . . 52
ITEM 9. Changes in and Disagreements with Accountants on Accounting and FinancialDisclosure . . . . . . . . . . . . . . . . . . . . . . . . . . . . . . . . . . . . . . . . . . . . . . . . . . . . . . . . . . . . 108
ITEM 9A. Controls and Procedures . . . . . . . . . . . . . . . . . . . . . . . . . . . . . . . . . . . . . . . . . . . . . . . . . . . 108
ITEM 9B. Other Information . . . . . . . . . . . . . . . . . . . . . . . . . . . . . . . . . . . . . . . . . . . . . . . . . . . . . . . . 111
PART III
ITEM 10. Directors, Executive Officers and Corporate Governance . . . . . . . . . . . . . . . . . . . . . . . . . 112
ITEM 11. Executive Compensation . . . . . . . . . . . . . . . . . . . . . . . . . . . . . . . . . . . . . . . . . . . . . . . . . . . 112
ITEM 12. Security Ownership of Certain Beneficial Owners and Management and RelatedStockholder Matters . . . . . . . . . . . . . . . . . . . . . . . . . . . . . . . . . . . . . . . . . . . . . . . . . . . . 112
ITEM 13. Certain Relationships and Related Transactions, and Director Independence . . . . . . . . . . 112
ITEM 14. Principal Accounting Fees and Services . . . . . . . . . . . . . . . . . . . . . . . . . . . . . . . . . . . . . . . 112
PART IV
ITEM 15. Exhibits, Financial Statement Schedules . . . . . . . . . . . . . . . . . . . . . . . . . . . . . . . . . . . . . . . 113
Signatures . . . . . . . . . . . . . . . . . . . . . . . . . . . . . . . . . . . . . . . . . . . . . . . . . . . . . . . . . . . . . . . . . . . . . . . . 118
Exhibit Index . . . . . . . . . . . . . . . . . . . . . . . . . . . . . . . . . . . . . . . . . . . . . . . . . . . . . . . . . . . . . . . . . . . . . 120

Information Relating to Forward-Looking Statements
This annual report on Form 10-K contains “forward-looking statements” under the Federal securitieslaws. These forward-looking statements include statements relating to our future business performance andoverall prospects; the benefits we expect to receive from our restructuring activities; when we expect tocommence manufacturing operations at our new facility in Dubai; the adequacy of our supply of tantalumore for the near term; our expectations for geographic expansion of business activity by our Specialty FluidsBusiness outside of the North Sea; the life of our pollucite ore reserves; anticipated capital spending,including environmental-related capital expenditures; cash requirements and uses of available cash,including future cash outlays associated with long-term contractual obligations, restructurings, contributionsto employee benefit plans, environmental remediation costs and future respirator litigation costs; exposureto interest rate and foreign exchange risk; future benefit payments we expect to make; our expected tax ratefor fiscal 2010; our ability to recover deferred tax assets; and the possible outcome of legal proceedings.From time to time, we also provide forward-looking statements in other materials we release to the publicand in oral statements made by authorized officers.
Forward-looking statements are based on our current expectations, assumptions, estimates andprojections about Cabot’s businesses and strategies, market trends and conditions, economic conditions andother factors. These statements are not guarantees of future performance and are subject to risks,uncertainties, potentially inaccurate assumptions, and other factors, some of which are beyond our controland difficult to predict. If known or unknown risks materialize, or should underlying assumptions proveinaccurate, our actual results could differ materially from past results and from those expressed in theforward-looking statements. Important factors that could cause our actual results to differ materially fromthose expressed in our forward-looking statements are described in Item 1A in this report.
We undertake no obligation to publicly update forward-looking statements, whether as a result of newinformation, future events or otherwise, except as required by law. Investors are advised, however, toconsult any further disclosures we make on related subjects in our 10-Q and 8-K reports filed with theSecurities and Exchange Commission (the “SEC”).
PART I
Item 1. Business
General
Cabot’s business was founded in 1882 and incorporated in the State of Delaware in 1960. Cabot is aglobal specialty chemicals and performance materials company headquartered in Boston, Massachusetts.Our principal products are rubber and specialty grade carbon blacks, fumed metal oxides, tantalum andrelated products, inkjet colorants, aerogels and cesium formate drilling fluids. Cabot and its affiliates havemanufacturing facilities and operations in the United States and approximately 20 other countries. Theterms “Cabot”, “Company”, “we”, and “our” as used in this report refer to Cabot Corporation and itsconsolidated subsidiaries.
Our strategy is to deliver earnings growth through leadership in performance materials. We intend toachieve this goal by focusing on margin improvement, capacity expansion and emerging market growth,developing new products and businesses and actively managing our portfolio of businesses.
Our products are generally based on technical expertise and innovation in one or more of our three corecompetencies: making and handling very fine particles; modifying the surfaces of very fine particles to altertheir functionality; and designing particles to impart specific properties to a composite. We focus oncreating particles with the composition, morphology, surface functionalities and formulations to supportexisting and emerging applications.
3

We are organized into four business segments: the Core Segment, which is further disaggregated forfinancial reporting purposes into the Rubber Blacks and the Supermetals Businesses; the PerformanceSegment; the New Business Segment and the Specialty Fluids Segment. For operational purposes, we are alsoorganized into three geographic regions: The Americas, which includes North and South America; Europe,Middle East and Africa (“EMEA”); and Asia Pacific, including China. The business segments are discussed inmore detail later in this section. Financial information about our business segments appears in Management’sDiscussion and Analysis of Financial Condition and Results of Operations in Item 7 below (“MD&A”) and inNote V of the Notes to our Consolidated Financial Statements in Item 8 below (“Note V”). Financialinformation about our sales and long-lived assets in certain geographic areas appears in Note V.
Our internet address is www.cabot-corp.com. We make available free of charge on or through ourinternet website our annual reports on Form 10-K, quarterly reports on Form 10-Q, current reports onForm 8-K, and amendments to those reports filed or furnished pursuant to Section 13(a) or 15(d) of theSecurities Exchange Act of 1934 as soon as reasonably practicable after electronically filing such materialwith, or furnishing it to, the SEC.
Core Segment
The Core Segment is comprised of the Rubber Blacks Business and the Supermetals Business. Adiscussion of each of these Businesses follows.
Rubber Blacks Business
Products
Carbon black is a form of elemental carbon that is manufactured in a highly controlled process toproduce particles and aggregates of varied structure and surface chemistry, resulting in many differentperformance characteristics for a wide variety of applications. Rubber grade carbon blacks are used toenhance the physical properties of the systems and applications in which they are incorporated.
Our rubber blacks products are used in tires and industrial products. Rubber blacks have traditionallybeen used in the tire industry as a rubber reinforcing agent and are also used as a performance additive. Inindustrial products such as hoses, belts, extruded profiles and molded goods, rubber blacks are used toimprove the physical performance of the product. In addition to the carbon black we make usingconventional carbon black manufacturing methods, we have developed elastomer composite products(referred to as Cabot Elastomer Composites or “CEC”) that are compounds of natural rubber and carbonblack made by a patented liquid phase process. Our CEC products are currently targeted primarily for tireapplications because we believe these compounds improve wear resistance, reduce fatigue and reducerolling resistance compared to natural rubber/carbon black compounds made by conventional methods.
Sales and Customers
Sales of rubber blacks products are made by Cabot employees and through distributors and salesrepresentatives. Sales to three major tire customers represent a material portion of the Rubber BlacksBusiness’s total net sales and operating revenues. The loss of any of these customers could have a materialadverse effect on the Rubber Blacks Business. In fiscal 2009, sales to The Goodyear Tire and RubberCompany and its affiliates amounted to 10% of Cabot’s consolidated revenues. We did not have salesduring the fiscal year to any other customer in an amount equal to or greater than 10% of our consolidatedrevenues for the year.
Under appropriate circumstances, we have pursued a strategy of entering into annual and long-termsupply contracts (those with an initial term longer than one year) with certain customers. These contracts aredesigned to provide our customers with a secure supply of rubber blacks and help us reduce the volatility involumes and margins over time. Many of these contracts provide for sales price adjustments to account for
4

changes in feedstock costs and, in some cases, changes in other relevant costs (such as the cost of naturalgas). In fiscal 2009, approximately half of our rubber blacks volume was sold under long-term or annualcontracts in effect during the fiscal year. The majority of the volumes sold under these contracts are sold tocustomers in North America and Western Europe.
Much of the rubber blacks we sell is used in automotive products and, therefore, our financial resultsmay be affected by the cyclical nature of the automotive industry. However, a large portion of the marketfor our products is in replacement tires that historically have been less subject to automotive industry cycles.
Competition
We are one of the leading manufacturers of carbon black in the world. We compete in the manufactureof carbon black primarily with four companies with a global presence and a significant number of othercompanies which have a regional presence. Competition for products within the Rubber Blacks Business isbased on product performance, quality, reliability, service, technical innovation and price, as well as on theproximity of our manufacturing operations to those of our customers. We believe our technologicalleadership, global manufacturing presence, operations excellence and customer service provide us acompetitive advantage.
Raw Materials
The principal raw material used in the manufacture of carbon black is a portion of the residual heavyoils derived from petroleum refining operations and from the distillation of coal tars and the production ofethylene throughout the world. Natural gas is also used in the production of carbon black. Raw materialcosts generally are influenced by the availability of various types of carbon black feedstock and natural gas,and related transportation costs. Importantly, movements in the market price for crude oil typically affectcarbon black feedstock costs.
Operations
We own, or have a controlling interest in, and operate plants that produce rubber blacks in Argentina,Brazil, Canada, China, Colombia, the Czech Republic, France, India, Indonesia, Italy, Japan, Malaysia, TheNetherlands, and the United States. Our equity affiliates operate carbon black plants in Mexico andVenezuela. The following table shows our ownership interest as of September 30, 2009 in rubber blacksoperations in which we own less than 100%:Location Percentage Interest
Shanghai, China 70% (consolidated subsidiary)Tianjin, China 70% (consolidated subsidiary)Valasske Mezirici (Valmez), Czech Republic 52% (consolidated subsidiary)Thane, India 97.7% (consolidated subsidiary)Cilegon and Merak, Indonesia 84.8% (consolidated subsidiary)Port Dickson, Malaysia 51% (consolidated subsidiary)Tampico, Mexico 40% (equity affiliate)Valencia, Venezuela 47.5% (equity affiliate)
We continue to expand the manufacturing capacity of our Rubber Blacks Business in emergingmarkets. In fiscal 2009 we completed constructing and began operating two additional rubber blacksproduction units at our carbon black plant in Tianjin, China, increasing our capacity at that facility by150,000 metric tons.
As part of our 2009 global restructuring plan, during fiscal 2009 we closed our rubber blacksmanufacturing operations in Stanlow, U.K., and in October 2009 we closed our manufacturing operations inBerre, France.
5

Supermetals Business
Products
We produce tantalum, niobium (columbium) and their alloys. Tantalum, which accounts forsubstantially all of this Business’s sales, is produced in various forms. Electronics is the largest applicationfor tantalum powder, which is used to make capacitors for computers, networking devices, wireless phones,electronics for automobiles and other devices. Tantalum, niobium and their alloys are also produced inwrought form for applications such as the production of superalloys and chemical process equipment andfor various other industrial and aerospace applications, including fiber optic filters, sodium vapor lamps,turbine blades and aerospace propulsion systems. In addition, the Supermetals Business sells the startingmetals (high-purity grade tantalum powders, plates and ingots) used to manufacture finished tantalumsputtering targets used in thin film applications, including semiconductors, inkjet heads, magnetics and flatpanel displays.
Sales and Customers
Sales are made primarily through Cabot employees. In fiscal 2009, sales to four capacitor materialscustomers represented a material portion of the total net sales and operating revenues of the SupermetalsBusiness. The loss of any of these customers could have a material adverse effect on the SupermetalsBusiness.
Many of our tantalum products are used in products for the electronics industry, which is cyclical innature.
Competition
We are a leading producer of electronic grade tantalum powder products. Competition in the tantalumbusiness is based on technical innovation, product performance, quality, reliability, service and price. Wecompete principally with three other producers of tantalum powder and believe our technological leadershipin high capacitance tantalum powder provides us with a competitive advantage.
Raw Materials
Tantalum ore is the principal raw material used in this business. Historically, we obtained a largeportion of our raw material under long-term supply contracts with third-parties and from a mine we own inManitoba, Canada, although during fiscal 2009 we suspended our tantalum mining operations. Given ourcurrent ore inventory levels and other currently available sources of ore, we believe we have an adequatesupply of raw material for this Business for the foreseeable future.
We have not purchased or sourced any material containing tantalum, including coltan, from theDemocratic Republic of the Congo.
Operations
We operate manufacturing facilities for this business in Boyertown, Pennsylvania and Kawahigashi-machi, Japan. We have a license from the Department of Environmental Protection for the receipt, storageand processing of tantalum containing Class 7 ores at our Boyertown facility, and transport this materialunder a license from the U.S. Nuclear Regulatory Commission.
As part of our 2009 global restructuring plan, we suspended our tantalum mining operations inManitoba in fiscal 2009 and plan to close our tantalum powder operations in Boyertown, Pennsylvania incalender 2010. We will continue to operate our tantalum mill and ore processing operations in Boyertown.
6

Performance Segment
The Performance Segment is comprised of two product lines: specialty grades of carbon black andthermoplastic concentrates (referred to together as “performance products”); and fumed silica, fumedalumina and dispersions thereof (referred to together as “fumed metal oxides”). In each product line, wedesign, manufacture and sell materials that deliver performance in a broad range of customer applications.Products are used in a wide variety of applications across the automotive, construction and infrastructure,and electronics and consumer products sectors.
Products
Carbon black is a form of elemental carbon that is manufactured in a highly controlled process toproduce particles and aggregates of varied structure and surface chemistry, resulting in many differentperformance characteristics for a wide variety of applications. Our specialty grades of carbon black are usedto impart color, provide rheology control, enhance conductivity and static charge control, provide UVprotection, enhance mechanical properties, and provide chemical flexibility through surface treatment.These products are used in a wide variety of applications, such as inks, coatings, cables, pipes, toners andelectronics. In addition, we manufacture and source thermoplastic concentrates and compounds that aremarketed to the plastics industry.
Fumed silica is an ultra-fine, high-purity particle used as a reinforcing, thickening, abrasive,thixotropic, suspending or anti-caking agent in a wide variety of products produced for the automotive,construction, microelectronics, and consumer products industries. These products include adhesives,sealants, cosmetics, inks, toners, silicone rubber, coatings, polishing slurries and pharmaceuticals. Fumedalumina, also an ultra-fine, high-purity particle, is used as an abrasive, absorbent or barrier agent in a varietyof products, such as inkjet media, lighting, coatings, cosmetics and polishing slurries.
Sales and Customers
Sales of these products are made by Cabot employees and through distributors and salesrepresentatives. Under appropriate circumstances, we have entered into long-term supply arrangements withcertain customers for sales of our products. In fiscal 2009, sales under these contracts accounted forapproximately 25% of the Performance Segment’s revenue. For the performance products line of business,these contracts are with a broad number of customers. In contrast, sales under long term contracts with twocustomers account for a substantial portion of the revenue of the fumed metal oxides line of business. Themajority of volume sold under long-term contracts in the Performance Segment are sold to customerslocated in North America and Western Europe.
Competition
We are one of the leading manufacturers of carbon black in the world. We compete in the manufactureof carbon black primarily with four companies with a global presence and a significant number of othercompanies which have a regional presence. We are also a leading producer of thermoplastic concentrates inEurope and Asia. We are a leading producer and seller of fumed silica and compete primarily with threecompanies with a global presence and at least four other companies which have a regional presence.
Competition for these products is based on product performance, quality, reliability, service, technicalinnovation and price, as well as on the proximity of our manufacturing operations to those of our customers.We believe our technological leadership, global manufacturing presence, operations excellence andcustomer service provide us a competitive advantage.
Raw Materials
The principal raw material used in the manufacture of carbon black is a portion of the residual heavyoils derived from petroleum refining operations and from the distillation of coal tars and the production of
7

ethylene throughout the world. Natural gas is also used in the production of carbon black. Raw materialcosts generally are influenced by the availability of various types of carbon black feedstock and natural gas,and related transportation costs. Importantly, movements in the market price for crude oil typically affectcarbon black feedstock costs.
Other than carbon black feedstock, the primary materials used for thermoplastic concentrates aretitanium dioxide, thermoplastic resins and mineral fillers. Raw materials for these concentrates are, ingeneral, readily available.
Raw materials for the production of fumed silica are various chlorosilane feedstocks. We purchasefeedstocks and for some customers convert their feedstock to product on a fee-basis (so called “tollconversion”). We also purchase aluminum chloride as feedstock for the production of fumed alumina. Wehave long-term procurement contracts or arrangements in place for the purchase of fumed silica feedstock,which we believe will enable us to meet our raw material requirements for the foreseeable future. Inaddition, we buy some raw materials in the spot market to help ensure flexibility and minimize costs.
Operations
We own, or have a controlling interest in, and operate plants that produce specialty grades of carbonblack in China, The Netherlands and the United States. Our thermoplastic concentrates and compounds areproduced in facilities in Belgium, Italy, and China (Hong Kong). We also own, or have a controlling interestin, manufacturing plants that produce fumed metal oxides in the United States; China; the United Kingdom;and Germany. An equity affiliate operates a fumed metal oxides plant in Mettur Dam, India. The followingtable shows our ownership interest as of September 30, 2009 in these segment operations in which we ownless than 100%:Location Percentage Interest
Tianjin, China (performance products) 90% (consolidated subsidiary)Jiangxi Province, China (fumed metal oxides) 90% (consolidated subsidiary)Mettur Dam, India (fumed metal oxides) 50% (equity affiliate)
We continue to expand the manufacturing capacity of our Performance Products and Fumed MetalOxides Businesses in emerging markets. During fiscal 2007, we commissioned a specialty carbon blackmanufacturing unit at our plant in Tianjin with an annual nameplate capacity of approximately 20,000metric tons. We also continue to work to expand our fumed silica capacity in China. In addition, in fiscal2009 we purchased a facility in Dubai for the manufacture of masterbatch to serve increasing plasticsdemand in the Middle East. We expect to commence manufacturing operations at that facility in the firsthalf of 2010.
As part of our 2009 global restructuring plan, during fiscal 2009 we closed our performance productsmanufacturing operations in Dukinfield, U.K. and our carbon black manufacturing operations in Stanlow,U.K. and in October 2009 we closed our manufacturing operations in Berre, France. During fiscal 2010, weplan to close our remaining manufacturing operations in Stanlow.
New Business Segment
Our New Business Segment includes the Inkjet Colorants and Aerogel Businesses and the businessdevelopment activities of Cabot Superior Micropowders. A discussion of each of these Businesses follows.
Inkjet Colorants
Products
We produce and sell aqueous inkjet colorants primarily to the inkjet printing market. Our inkjetcolorants are high-quality pigment-based black and other colorant dispersions we manufacture by surfacetreating specialty grades of carbon black and other pigments. The dispersions are used in aqueous inkjet
8

inks to impart color (optical density or chroma) with improved durability (waterfastness, lightfastness andrub resistance) while maintaining high printhead reliability. Our inkjet colorants are produced for variousinkjet printing applications, including small office and home office, corporate office, and commercial andindustrial printing, as well as for other niche applications that require a high level of dispersibility andcolloidal stability.
Sales and Customers
Sales of inkjet colorants are made by Cabot employees to inkjet printer manufacturers and to suppliersof inkjet inks in the inkjet cartridge aftermarket. Many of our commercialized products have been developedthrough joint research and development initiatives with inkjet printer manufacturers. These initiatives haveled to the development of exclusive differentiated products for these inkjet customers.
Competition
Our inkjet colorants are designed to replace traditional pigment dispersions and dyes used in inkjetprinting applications. Competitive products for inkjet colorants are organic dyes and other dispersedpigments manufactured and marketed by large chemical companies and small independent producers.Competition is based on product performance, technical innovation, quality, reliability, service and price.We believe our commercial strengths include technical innovation, product performance and service.
Raw Materials
Raw materials for inkjet colorants include carbon black sourced from our carbon black plants, organicpigments and other treating agents available from various sources. We believe that all raw materials toproduce inkjet colorants are in adequate supply.
Operations
Our inkjet colorants are manufactured at our facility in Haverhill, Massachusetts.
Aerogel Business
Products
Cabot’s aerogel is a nano-structured, high surface area, hydrophobic, silica-based particle that is usedin a variety of thermal insulation and specialty chemical applications. In the construction industry, theproduct is used in skylight, window, wall and roof systems for insulating eco-daylighting applications. Inthe oil and gas industry, aerogel is used to insulate subsea pipelines. In the specialty chemicals industry, theproduct is used to provide matte finishing, insulating and thickening properties for use in a variety ofapplications. We continue to focus on application and market development activities for use of aerogel inthese and other new applications.
Sales and Customers
Sales of aerogel products are made principally by Cabot employees.
Competition
Although the manufacturing processes used are different, in premium insulation applications, ouraerogel products compete principally with aerogel products manufactured by Aspen Aerogel, Inc. andnon-aerogel insulation products manufactured by primarily regional companies throughout the world.
Raw Materials
The principal raw materials for the production of aerogels are silica sol and/or sodium silicate, whichwe believe are in adequate supply.
9

Operations
We manufacture our aerogel products at our facility in Frankfurt, Germany using a unique and patentedmanufacturing process. Finished products for use in the oil and gas industry are fabricated at a facility inBillerica, Massachusetts.
Cabot Superior MicroPowders (“CSMP”)
CSMP is a research and development enterprise with multiple technology platforms and corecompetencies in advanced particle manufacturing across a wide range of materials and the related materialschemistries. Its principal areas of commercial focus are in developing advanced materials for anti-counterfeiting security applications, fuel cell applications, solar energy applications, environmental andindustrial catalyst applications, and for other performance material applications. We expect the CSMPplatforms to support the development of new technologies that complement existing applications andprovide opportunities for new business growth. Most of these activities are conducted at our facilities inAlbuquerque, New Mexico.
Specialty Fluids Segment
Products
Our Specialty Fluids Segment produces and markets cesium formate as a drilling and completion fluidfor use primarily in high pressure and high temperature oil and gas well construction. Cesium formateproducts are solids-free, high-density fluids that have a low viscosity, enabling safe and efficient wellconstruction and workover operations. The fluid is resistant to high temperatures, minimizes damage toproducing reservoirs and is readily biodegradable in accordance with the testing guidelines set by theOrganization for Economic Cooperation and Development. In a majority of applications, cesium formate isblended with other formates or products.
Sales, Rental and Customers
Sales of our cesium formate products are made to oil and gas operating companies directly by Cabotemployees and sales representatives and indirectly through oil field service companies. We generally rentcesium formate to our customers for use in drilling operations on a short-term basis. After completion of ajob, the customer returns the fluid to Cabot and it is reprocessed for use in subsequent well operations. Anyfluid that is lost during use and not returned to Cabot is paid for by the customer. The rates to be charged tothe customer for the daily product rental and for lost product are agreed to before a job begins.
Since 2003, a large portion of our fluids have been used for drilling and completion of wells in theNorth Sea, where we have been supplying cesium formate-based fluids for both reservoir drilling andcompletion activities on large gas and condensate field projects in the Norwegian Continental Shelf. Morerecently, we have expanded the use of our fluids to drilling operations outside of the North Sea.
Competition
Formate fluids, which were introduced to the market in the mid-1990s, are a relatively small butgrowing part of the drilling and completion fluids market and compete mainly with traditional drilling fluidtechnologies. Competition in the well fluids business is based on product performance, quality, reliability,service, technical innovation and price, and proximity of inventory to customers’ drilling operations. Webelieve our commercial strengths include our unique product offerings and their performance.
Raw Materials
The principal raw material used in this business is pollucite (cesium ore), which we obtain from ourmine in Manitoba, Canada. We own a substantial portion of the world’s known pollucite reserves, ensuringus an adequate supply of our principal raw material. Considering our current production rates, our current
10

estimate of reserve levels in the mine and inventory on hand, we expect our supply to last at least 10 years.The process of estimating mineral reserves is inherently uncertain and requires making subjectiveengineering, geological, geophysical and economic assumptions. Accordingly, there is likely to bevariability in the estimated reserve life of the ore body over time. In addition, we have identified technicalprojects to recover cesium from low grade ore not currently in our reserve estimates. These proposedtechnical projects may require different, although well-established, recovery techniques than we currentlyuse.
Most jobs for which cesium formate is used require a large volume of the product. Accordingly, theSpecialty Fluids Segment maintains a large inventory of fluid.
Operations
We have a mine and a cesium formate manufacturing facility in Manitoba, Canada, as well as fluidblending and reclamation facilities in Aberdeen, Scotland and in Bergen and Kristiansund, Norway. Inaddition, fluid is warehoused at various locations around the world to support existing and potentialoperations. In fiscal 2007, we established a regional sales office in Singapore in order to increase marketinginitiatives to prospective customers in China, Southeast Asia, Australia and New Zealand.
Patents and Trademarks
We own and are a licensee of various patents, which expire at different times, covering many of ourproducts as well as processes and product uses. Although the products made and sold under these patentsand licenses are important to Cabot, the loss of any particular patent or license would not materially affectour business, taken as a whole. We sell our products under a variety of trademarks, the loss of any one ofwhich would not materially affect our business, taken as a whole.
Backlog
Our businesses are generally not seasonal in nature, although we typically experience some decline inEuropean and North American sales in the fourth fiscal quarter due to summer plant shutdowns and in AsiaPacific sales in the second fiscal quarter because of the New Year holidays in that region.
We do not consider backlog to be a significant indicator of the level of future sales activity. In general,we do not manufacture our products against a backlog of orders. Production and inventory levels are basedon the level of incoming orders as well as projections of future demand. Therefore, we believe that backloginformation is not material to understanding our overall business and is not a reliable indicator of our abilityto achieve any particular level of revenue or financial performance.
Employees
As of September 30, 2009, we had approximately 3,950 employees. Some of our employees in theUnited States and abroad are covered by collective bargaining or similar agreements. We believe that ourrelations with our employees are generally satisfactory.
Research and Development
Cabot develops new and improved products and higher efficiency processes through Company-sponsored research and technical service activities, including those initiated in response to customerrequests. Our expenditures for such activities generally are spread among our businesses and are shown inthe consolidated statements of operations.
Safety, Health and Environment (“SH&E”)
Cabot has been named as a potentially responsible party under the Comprehensive EnvironmentalResponse, Compensation, and Liability Act of 1980 (the “Superfund law”) and comparable state statutes
11

with respect to several sites primarily associated with our divested businesses. (See “Legal Proceedings”below.) During the next several years, as remediation of various environmental sites is carried out, weexpect to spend against our $6 million environmental reserve for costs associated with such remediation.Adjustments are made to the reserve based on our continuing analysis of our share of costs likely to beincurred at each site. Inherent uncertainties exist in these estimates due to unknown conditions at the varioussites, changing governmental regulations and legal standards regarding liability, and changing technologiesfor handling site investigation and remediation. While the reserve represents our best estimate of the costswe expect to incur, the actual costs to investigate and remediate these sites may exceed the amounts accruedin the environmental reserve. While it is always possible that an unusual event may occur with respect to agiven site and have a material adverse effect on our results of operations in a particular period, we do notbelieve that the costs relating to these sites, in the aggregate, are likely to have a material adverse effect onour financial position. Furthermore, it is possible that we may also incur future costs relating toenvironmental liabilities not currently known to us or as to which it is currently not possible to make anestimate.
Our ongoing operations are subject to extensive federal, state, local, and foreign laws, regulations,rules, and ordinances relating to safety, health, and environmental matters (“SH&E Requirements”). TheseSH&E Requirements include requirements to obtain and comply with various environmental-related permitsfor constructing any new facilities and operating all of our existing facilities. We have expendedconsiderable sums to construct, maintain, operate, and improve facilities for safety, health andenvironmental protection and to comply with SH&E Requirements. We spent approximately $21 million inenvironmental-related capital expenditures at existing facilities in fiscal 2009 and anticipate spendingapproximately $21 million for such matters in fiscal 2010.
In recognition of the importance of SH&E Requirements to Cabot, our Board of Directors has a Safety,Health, and Environmental Affairs Committee. The Committee, which is comprised of independentdirectors, meets at least three times a year and provides oversight and guidance to Cabot’s safety, health andenvironmental management programs. In particular, the Committee reviews Cabot’s environmental reserve,risk assessment and management processes, environmental and safety audit reports, performance metrics,performance as benchmarked against industry peer groups, assessed fines or penalties, site security andsafety issues, health and environmental training initiatives, and the SH&E budget and capital expenditures.The Committee also consults with our outside and internal advisors regarding management of Cabot’ssafety, health and environmental programs.
In February 2006, the International Agency for Research on Cancer (“IARC”) reaffirmed itsclassification of carbon black as a Group 2B substance (known animal carcinogen, possible humancarcinogen). We have communicated IARC’s classification of carbon black to our customers and employeesand have included that information in our material safety data sheets and elsewhere, as appropriate. Wecontinue to believe that the available evidence, taken as a whole, indicates that carbon black is notcarcinogenic to humans, and does not present a health hazard when handled in accordance with goodhousekeeping and safe workplace practices as described in our material safety data sheets.
In February 2003, the California Office of Environmental Health Hazard Assessment (“OEHHA”)published a notice adding “carbon black (airborne, unbound particles of respirable size)” to the CaliforniaSafe Drinking Water and Toxic Enforcement Act, commonly referred to as Proposition 65. Proposition 65requires businesses to warn individuals before they knowingly or intentionally expose them to chemicalssubject to its requirements, and it prohibits businesses from knowingly discharging or releasing thechemicals into water or onto land where they could contaminate drinking water. We worked with theInternational Carbon Black Association, as well as various customers and carbon black user groups, toensure our compliance with the requirements associated with the Proposition 65 listing of carbon black,which became effective in February 2004. We have been informed that OEHHA is considering certainchanges that may result in removing the “airborne, unbound particles of respirable size” qualifying language
12

from its listing of carbon black. If this change is adopted by OEHHA, it would result in increased labelingand other requirements for our customers under Proposition 65.
In October 2003, the European Commission (“EC”) developed a new European Union (“EU”) regulatoryframework for chemicals called REACH (Registration, Evaluation and Authorization of Chemicals). REACH,which became effective in June 2007, applies to all existing and new chemical substances produced orimported into the EU in quantities greater than one metric ton a year. Manufacturers or importers of thesechemical substances are required to submit specified health, safety, risk and use information about thesubstance to the European Chemical Agency. As we are committed to continuing to supply our EU customers,we have registered silica and cesium formate under REACH, and carbon black is expected to be registered inlate 2009 or early 2010. We are also working with the manufacturers and importers of our other substances,including our feedstocks, to ensure their registration prior to the applicable deadline.
We are experiencing increased regulations by environmental agencies worldwide relating to the airemissions from our manufacturing operations. This increased regulation is resulting in more restrictive airemission limits globally, particularly as they relate to nitrogen oxide and sulphur dioxide emissions. Inaddition, global efforts to reduce greenhouse gas emissions impact the carbon black industry as carbondioxide is emitted in the carbon black manufacturing process. In December 2005, the EC published adirective that includes carbon black manufacturing in the combustion sector and in Phase II of the EmissionTrading Scheme, which establishes a maximum allowable emission credit for each ton of CO 2 emitted, forthe period 2008 to 2012. Various EU member states have included carbon black facilities in their nationalallocation plans and a number of our carbon black plants in Europe were required to comply with theEmission Trading Scheme beginning in calendar year 2008. We generally expect to purchase credits wherenecessary to respond to allocation shortfalls. We are also pursuing certain Clean Development Mechanismprojects at various facilities in an effort to generate carbon credits to offset potential allocation shortfalls.There are also ongoing discussions in other regions and countries, including the United States, Canada,China, and Brazil regarding greenhouse gas emission reporting and reduction programs, but those programshave not yet been fully defined and their impact on us cannot be estimated at this time. Finally, Cabot’s U.S.carbon black facilities will be required to report their greenhouse gas emissions under the U.S.Environmental Protection Agency’s new rule for the Mandatory Reporting of Greenhouse Gases in 2011.
Since the terrorist attacks in the U.S. on September 11, 2001, various U.S. agencies and internationalbodies have adopted security requirements applicable to certain manufacturing and industrial facilities andmarine port locations. These security-related requirements involve the preparation of security assessmentsand security plans in some cases, and in other cases the registration of certain facilities with specifiedgovernmental authorities. We are closely monitoring all security related regulatory developments andbelieve we are in compliance with all existing requirements. Compliance with such requirements is notexpected to have a material adverse effect on our operations.
Foreign and Domestic Operations and Export Sales
A significant portion of our revenues and operating profits is derived from overseas operations. Theprofitability of our segments is affected by fluctuations in the value of the U.S. dollar relative to foreigncurrencies. (See MD&A and the Geographic Information portion of Note V for further information relatingto sales and long-lived assets by geographic area.) Currency fluctuations, nationalization and expropriationof assets are risks inherent in international operations. We have taken steps we deem prudent in ourinternational operations to diversify and otherwise to protect against these risks, including the use of foreigncurrency financial instruments to reduce the risk associated with changes in the value of certain foreigncurrencies compared to the U.S. dollar. (See the Risk Management discussion contained in “Quantitativeand Qualitative Disclosures About Market Risk” in Item 7A below and Note V of the Notes to theCompany’s Consolidated Financial Statements).
13
Item 1A. Risk Factors
In addition to factors described elsewhere in this report, the following are important factors that couldcause our actual results to differ materially from those expressed in our forward-looking statements. It is notpossible, however, to predict or identify all such factors. Accordingly, investors should not consider thefollowing to be a complete discussion of all potential risks or uncertainties.
Negative or uncertain worldwide economic conditions may adversely impact our business.
Our operations and performance are materially affected by worldwide economic conditions, whichdeteriorated significantly during fiscal 2009. Market turmoil and tightened credit availability generallyreduced consumer confidence, increased difficulty in collecting accounts receivable, increased pricingpressure on products and services, and led to widespread reduction of global business activity. Uncertaintyabout current global economic conditions has resulted in decreased consumer spending and a significantdecline in sales in the automotive, electronics and construction industries worldwide. As a result, we haveexperienced declines in global demand for our products that serve these industries, with volumes in ourCore and Performance Segments for fiscal 2009 more than 20% below the levels that we experienced infiscal 2008. These developments have resulted in decreased revenues and weaker results of operations.While we have seen signs of recovery and increased demand in most of our businesses, continued weaknessin worldwide economic conditions could have a material adverse effect on our financial condition and cashflows.
Changes in supply-demand balance in the regions and the industries in which we operate mayadversely affect our financial results.
Our key customers continue to shift their manufacturing capacity from mature markets such as NorthAmerica and Western Europe to emerging regions such as Asia, South America and Eastern Europe.Although we are responding to meet these market demand conditions, we cannot be certain that we will besuccessful expanding capacity in emerging regions (which depends in part on economic and politicalconditions in these regions and, in some cases, on our ability to acquire or form strategic business alliances)or in reducing capacity in mature regions commensurate with industry demand. Similarly, demand for ourcustomers’ products and our competitors’ reactions to market conditions could affect our financial results.
In addition, our Rubber Blacks and Supermetals Businesses are sensitive to changes in industrycapacity utilization. As a result, pricing tends to decrease when capacity utilization in these businessesdecreases, which could affect our financial performance.
Our restructuring activities and cost saving initiatives may not achieve the results we anticipate.
We have undertaken and will continue to undertake cost reduction initiatives and organizationalrestructurings to optimize our asset base, improve operating efficiencies and generate cost savings. Inconnection with many of these actions we have projected significant one-time and on-going cost savings.The success of these activities is not predictable and we cannot be certain that we will be able to completethese initiatives as planned or that the estimated operating efficiencies or cost savings from such activitieswill be fully realized or maintained over time. In addition, where we have closed manufacturing facilities,we may not be successful in migrating our customers from those closed facilities to our other facilities.
Volatility in the price of raw materials or their reduced availability could decrease our margins.
Our manufacturing processes consume significant amounts of energy and raw materials, the costs ofwhich are subject to worldwide supply and demand as well as other factors beyond our control. Dramaticincreases in such costs or decreases in the availability of raw materials at acceptable costs could have anadverse effect on our results of operations. For example, movements in the market price for crude oiltypically affect carbon black feedstock costs. Significant movements in the market price for crude oil tendto create volatility in our carbon black feedstock costs, which can effect our working capital and results of
14

operations. Although our long-term and some of our annual carbon black supply contracts provide for aprice adjustment to account for changes in feedstock costs, there is a lag between the time when we incurfeedstock costs and the time when prices are adjusted under some of these contracts. Accordingly, we maynot be able to pass increased costs along to our customers when they occur, which can have a significantnegative impact on results of operations and cash flows in a given quarter. We have reduced the time lag inmany of our long-term contracts as they have come up for renewal, but we may not be successful inreducing the time lag in some or all of the remainder of these contracts as they come up for renewal in thefuture. In addition, it is possible that a supply contract with a price adjustment mechanism could expire byits terms before we are able to recapture fully our raw material cost increases. We attempt to offset theeffects of increases in raw material costs through selling price increases in our non-contract sales,productivity improvements and cost reduction efforts. Success in offsetting increased raw material costswith price increases is largely influenced by competitive and economic conditions and could varysignificantly depending on the segment served. Such increases may not be accepted by our customers, maynot be sufficient to compensate for increased raw material and energy costs or may decrease demand for ourproducts and our volume of sales. If we are not able to fully offset the effects of increased raw material orenergy costs, it could have a significant impact on our financial results.
We depend on a group of key customers for a significant portion of our sales. A significant adversechange in a customer relationship or in a customer’s performance or financial position could harmour business and financial condition.
Our success in strengthening relationships and growing business with our largest customers andretaining their business over extended time periods could affect our future results. We have a total of ninecustomers in the tire, silicones, capacitor materials and microelectronics industries that together represent asignificant portion of our total net sales and operating revenues. In fiscal 2009, sales to The Goodyear Tireand Rubber Company by our Rubber Blacks Business accounted for approximately 10% of our consolidatedrevenues. The loss of any of our important customers, or a reduction in volumes sold to them because of awork stoppage or other disruption, could adversely affect our results of operations until such business isreplaced or the disruption ends. Any deterioration of the financial condition of any of our customers or theindustries they serve that impairs our customers’ ability to make payments to us also could increase ouruncollectible receivables and could affect our future results and financial condition.
Our operations involve the handling of hazardous and, in some instances, radioactive materials, andwe are subject to extensive safety, health and environmental requirements, which could increase ourcosts and/or reduce our revenues.
Our ongoing operations are subject to extensive federal, state, local and foreign laws, regulations,rules and ordinances relating to safety, health and environmental matters (“SH&E Requirements”), many ofwhich provide for substantial monetary fines and criminal sanctions for violations. These SH&ERequirements include requirements to obtain and comply with various environmental-related permits forconstructing any new facilities and operating all of our existing facilities. In June 2009, we received aninformation request from the United States Environmental Protection Agency (“EPA”) as part of an EPAnational initiative focused on the U.S. carbon black manufacturing sector. The information request relates toour Pampa, Texas facility’s compliance with certain regulatory and permitting requirements under the CleanAir Act, including the New Source Review (“NSR”) construction permitting requirements. We responded toEPA’s information request in August 2009 and are awaiting a response from EPA. As a result of thisinitiative, based upon how EPA has handled similar NSR initiatives with other industrial sectors, it ispossible that EPA could attempt to compel us to employ additional technology control devices orapproaches with respect to emissions at certain facilities and/or seek a civil penalty from us.
In addition, the operation of a chemical manufacturing business as well as the sale and distribution ofchemical products involve safety, health and environmental risks. For example, the production and/orprocessing of carbon black, fumed metal oxides, tantalum, niobium, aerogel and other chemicals involve thehandling, transportation, manufacture or use of certain substances or components that may be considered
15

toxic or hazardous within the meaning of applicable SH&E Requirements. The processing of tantalum orealso involves radioactive substances. The transportation of chemical products and other activities associatedwith the manufacturing process have the potential to cause environmental or other damage as well as injuryor death to employees or third parties.
We could incur significant expenditures in connection with such operational risks. We believe that ourongoing operations comply with current SH&E Requirements in a manner that should not materially affectour earnings or cash flow in an adverse manner. We cannot be certain, however, that significant costs orliabilities will not be incurred with respect to SH&E Requirements and our operations. Moreover, we arenot able to predict whether future changes or developments in SH&E Requirements will affect our earningsor cash flow in a materially adverse manner.
Fluctuations in foreign currency exchange and interest rates could affect our financial results.
We earn revenues, pay expenses, own assets and incur liabilities in countries using currencies otherthan the U.S. dollar. In fiscal 2009, we derived a majority of our revenues from sales outside the UnitedStates. Because our consolidated financial statements are presented in U.S. dollars, we must translaterevenues, income and expenses as well as assets and liabilities into U.S. dollars at exchange rates in effectduring or at the end of each reporting period. Therefore, increases or decreases in the value of the U.S.dollar against other currencies in countries where we operate will affect our results of operations and thevalue of balance sheet items denominated in foreign currencies. Because of the geographic diversity of ouroperations, weaknesses in some currencies might be offset by strengths in others over time. In addition, weare exposed to adverse changes in interest rates. We manage these risks through normal operating andfinancing activities and, when deemed appropriate, through the use of derivative instruments as well asforeign currency debt. We cannot be certain, however, that we will be successful in reducing the risksinherent in exposures to foreign currency and interest rate fluctuations.
We rely on our committed lines of credit to provide us with working capital.
At September 30, 2009, we had $460 million in committed lines of credit, including $400 millionunder a revolving credit facility that matures in August 2010. We plan to replace our revolving creditfacility. A replacement facility may be for a lesser amount and a shorter term, and at borrowing costs thatare higher than those under our current revolving credit facility. In addition, a new facility may containmore restrictive terms and covenants than our current facility.
We have entered into a number of derivative contracts with financial counterparties. Theeffectiveness of these contracts is dependent on the ability of these financial counterparties to performtheir obligations and their nonperformance could harm our financial condition.
We have entered into interest rate swap contracts, foreign currency derivatives and forward commoditycontracts as part of our financial strategy. The effectiveness of our hedging programs using theseinstruments is dependent, in part, upon the counterparties to these contracts honoring their financialobligations. While we have not experienced any losses due to counterparty nonperformance, if any of ourcounterparties are unable to perform their obligations in the future, we could be exposed to increasedearnings and cash flow volatility due to an instrument’s failure to hedge a financial risk.
We are exposed to political or country risk inherent in doing business in some countries.
Sales outside of the United States constituted a majority of our revenues in fiscal 2009. Our operationsin some countries may be subject to the following risks: changes in the rate of economic growth; unsettledpolitical or economic conditions; possible expropriation or other governmental actions; social unrest, war,terrorist activities or other armed conflict; confiscatory taxation or other adverse tax policies; deprivation ofcontract rights; trade regulations affecting production, pricing and marketing of products; reduced
16

protection of intellectual property rights; restrictions on the repatriation of income or capital; exchangecontrols; inflation; currency fluctuations and devaluation; the effect of global health, safety andenvironmental matters on economic conditions and market opportunities; and changes in financial policyand availability of credit.
Plant capacity expansions may be delayed and not achieve the expected benefits.
Our ability to complete capacity expansions as planned may be delayed or interrupted by the need toobtain environmental and other regulatory approvals, availability of labor and materials, unforeseen hazardssuch as weather conditions, and other risks customarily associated with construction projects. Moreover,capacity expansion in our Rubber Blacks, Performance Products and Fumed Metal Oxides Businesses couldhave a negative impact on the financial performance of these businesses until capacity utilization issufficient to absorb the incremental costs associated with the expansion.
The money we spend developing new businesses may not result in a proportional increase in ourrevenues or profits.
We cannot be certain that the costs we incur investing in new businesses will result in a proportionalincrease in revenues or profits. In addition, the timely commercialization of products that we are developingmay be disrupted or delayed by manufacturing or other technical difficulties, market acceptance orinsufficient market size to support a new product, competitors’ new products, and difficulties in movingfrom the experimental stage to the production stage. These disruptions or delays could affect our futureresults.
Any failure to realize benefits from joint ventures, acquisitions or alliances could adversely affectfuture financial results.
As part of our strategies for growth and improved profitability, we have made and may continue tomake acquisitions and investments and enter into joint ventures. The success of acquisitions of newtechnologies, companies and products, or arrangements with third parties is not predictable and we may notbe successful in realizing our objectives as anticipated.
We may be required to impair or write off certain assets if our assumptions about future sales andprofitability prove incorrect.
In our analysis of the recoverability of certain assets, namely inventory, property, plant and equipment,investments, intangible assets and deferred tax assets, we have made assumptions about future sales(pricing, volume and region of sale), costs, cash generation and the ultimate profitability of the businessand/or tax jurisdiction. These assumptions were based on management’s best estimates and if the actualresults differ significantly from these assumptions, we may not be able to realize the value of the assetsrecorded as of September 30, 2009, which could lead to an impairment or write-off of certain of these assetsin the future.
Increases in our tax rate may reduce our net income.
Our future tax rates may be adversely affected by a number of factors including the enactment of thecurrently proposed U.S. tax legislation; other changes in tax laws or the interpretation of such tax laws;changes in the estimated realization of our deferred tax assets and liabilities; the jurisdictions in whichprofits are determined to be earned and taxed; the repatriation of non-U.S. earnings for which we have notpreviously provided for U.S. taxes; adjustments to estimated taxes upon finalization of various tax returns;increases in expenses that are not always deductible for tax purposes, including write-offs of acquiredin-process research and development and impairment of goodwill in connection with acquisitions; changesin available tax credits; changes in share-based compensation expense and the resolution of issues arisingfrom tax audits with various tax authorities. Losses for which no tax benefits can be recorded couldmaterially impact our tax rate and its volatility from one quarter to another. Any significant increase in ourfuture tax rates could reduce net income in those periods.
17

Regulations requiring a reduction of greenhouse gas emissions will impact the carbon black industry,including us.
Carbon dioxide is emitted in the carbon black manufacturing process. In December 2005, the EuropeanCommission published a new directive that includes carbon black manufacturing in the combustion sectorand in Phase II of the Emissions Trading Scheme for the period 2008 to 2012. Various European Unionmember states have included carbon black facilities in their national allocation plans and we have takenactions to comply with applicable carbon dioxide emission requirements. However, there can be noassurance that we will be able to purchase emissions credits if our carbon black operations generate morecarbon dioxide than our allocations permit or that the cost of such credits will be acceptable to us. There arealso ongoing discussions in other regions and countries, including the United States, Canada, China andBrazil regarding greenhouse gas emission reporting and reduction programs, but those programs have notyet been defined and their potential impact on our manufacturing operations or financial results cannot beestimated at this time.
Litigation or legal proceedings could expose us to significant liabilities and thus negatively affect ourfinancial results.
As more fully described in “Item 3—Legal Proceedings”, we are a party to or the subject of lawsuits,claims, and proceedings, including those involving contract, environmental, and health and safety matters aswell as product liability and personal injury claims relating to asbestosis, silicosis, coal worker’spneumoconiosis and berylliosis, and exposure to various chemicals. Adverse rulings, judgments orsettlements in pending or future litigation (including contract litigation and liabilities associated withrespirator claims and our former beryllium operations) could cause our results to differ materially fromthose expressed or forecasted in any forward-looking statements.
The continued protection of our patents and other proprietary intellectual property rights areimportant to our success.
Our patent and other intellectual property rights are important to our success and competitive position.We own various patents and other intellectual property rights in the U.S. and other countries covering manyof our products, as well as processes and product uses. In addition, we are a licensee of various patents andintellectual property rights belonging to others in the U.S. and other countries. Because the laws andenforcement mechanisms of some countries may not allow us to protect our proprietary rights to the sameextent as we are able to in the U.S., the strength of our intellectual property rights will vary from country tocountry.
Irrespective of our proprietary intellectual property rights, we may be subject to claims that ourproducts, processes or product uses infringe the intellectual property rights of others. These claims, even ifthey are without merit, could be expensive and time consuming to defend and if we were to lose suchclaims, we could be subject to injunctions and/or damages, or be required to enter into licensing agreementsrequiring royalty payments and/or use restrictions. Licensing agreements may not be available to us, and ifavailable, may not be available on acceptable terms.
We may be subject to information technology system failures, network disruptions and breaches indata security.
Information technology system failures, network disruptions and breaches of data security coulddisrupt our operations by impeding our processing of transactions, our ability to protect customer orcompany information and our financial reporting. Our computer systems, including our back-up systems,could be damaged or interrupted by power outages, computer and telecommunications failures, computerviruses, internal or external security breaches, catastrophic events such as fires, earthquakes, tornadoes andhurricanes, and/or errors by our employees. Although we have taken steps to address these concerns by
18

implementing sophisticated network security and internal control measures, there can be no assurance that asystem failure or data security breach will not have a material adverse effect on our financial condition andresults of operations.
Natural disasters could affect our operations and financial results.
We operate facilities in areas of the world that are exposed to natural hazards, such as hurricanes andearthquakes. Such events could disrupt our supply of raw materials or otherwise affect production,transportation and delivery of our products or affect demand for our products.
Item 1B. Unresolved Staff Comments
None.
Item 2. Properties
Cabot’s corporate headquarters are in leased office space in Boston, Massachusetts. We also own orlease office, manufacturing, storage, distribution, marketing and research and development facilities in theUnited States and in foreign countries. The locations of our principal manufacturing and/or administrativefacilities are set forth in the table below. Unless otherwise indicated, all the properties are owned.
Location by Region
Core Segment
PerformanceSegment
New BusinessSegment
Specialty FluidsSegment
RubberBlacksBusiness
SupermetalsBusiness
Americas RegionAlpharetta, GA*(1) . . . . . . . . . . . . . . . . . . . . . . . . . . X X X X XTuscola, IL . . . . . . . . . . . . . . . . . . . . . . . . . . . . . . . . XCanal, LA . . . . . . . . . . . . . . . . . . . . . . . . . . . . . . . . . X XVille Platte, LA . . . . . . . . . . . . . . . . . . . . . . . . . . . . . XBillerica, MA . . . . . . . . . . . . . . . . . . . . . . . . . . . . . . X X X XBillerica, MA (plant)* . . . . . . . . . . . . . . . . . . . . . . . XHaverhill, MA . . . . . . . . . . . . . . . . . . . . . . . . . . . . . XMidland, MI . . . . . . . . . . . . . . . . . . . . . . . . . . . . . . . XAlbuquerque, NM (2 plants)* . . . . . . . . . . . . . . . . . XBoyertown, PA . . . . . . . . . . . . . . . . . . . . . . . . . . . . . XPampa, TX . . . . . . . . . . . . . . . . . . . . . . . . . . . . . . . . X XThe Woodlands, TX* . . . . . . . . . . . . . . . . . . . . . . . . XCampana, Argentina . . . . . . . . . . . . . . . . . . . . . . . . . XMaua, Brazil . . . . . . . . . . . . . . . . . . . . . . . . . . . . . . . X XSao Paulo, Brazil*(1) . . . . . . . . . . . . . . . . . . . . . . . . X X X X XCartagena, Colombia . . . . . . . . . . . . . . . . . . . . . . . . XLac du Bonnet, Manitoba** . . . . . . . . . . . . . . . . . . . XSarnia, Ontario . . . . . . . . . . . . . . . . . . . . . . . . . . . . . X X
(1) Regional Shared Service Center* Leased premises** Building(s) owned by Cabot on leased land
19

Location by Region
Core Segment
PerformanceSegment
New BusinessSegment
Specialty FluidsSegment
RubberBlacksBusiness
SupermetalsBusiness
EMEA RegionLoncin, Belgium . . . . . . . . . . . . . . . . . . . . . . . . . . . . XLeuven, Belgium*(1) . . . . . . . . . . . . . . . . . . . . . . . . . X X X X XPepinster, Belgium . . . . . . . . . . . . . . . . . . . . . . . . . . XValasske Mezirici (Valmez), Czech Republic** . . . XPort Jerome, France** . . . . . . . . . . . . . . . . . . . . . . . XSuresnes, France* . . . . . . . . . . . . . . . . . . . . . . . . . . . X XFrankfurt, Germany* . . . . . . . . . . . . . . . . . . . . . . . . XRheinfelden, Germany . . . . . . . . . . . . . . . . . . . . . . . XGrigno, Italy . . . . . . . . . . . . . . . . . . . . . . . . . . . . . . . XRavenna, Italy . . . . . . . . . . . . . . . . . . . . . . . . . . . . . . XBergen, Norway* . . . . . . . . . . . . . . . . . . . . . . . . . . . XKristiansund, Norway* . . . . . . . . . . . . . . . . . . . . . . . XAberdeen, Scotland* . . . . . . . . . . . . . . . . . . . . . . . . XBoltek, The Netherlands** . . . . . . . . . . . . . . . . . . . . X XDubai, United Arab Emirates . . . . . . . . . . . . . . . . . . XBarry, Wales** . . . . . . . . . . . . . . . . . . . . . . . . . . . . . X
Asia Pacific RegionHong Kong, China** . . . . . . . . . . . . . . . . . . . . . . . . XJiangxi Province, China** . . . . . . . . . . . . . . . . . . . . XTianjin, China** . . . . . . . . . . . . . . . . . . . . . . . . . . . . X XShanghai, China*(1) . . . . . . . . . . . . . . . . . . . . . . . . . . X X X X XShanghai, China** (plant) . . . . . . . . . . . . . . . . . . . . XMaharashtra, India** . . . . . . . . . . . . . . . . . . . . . . . . XMumbai, India* . . . . . . . . . . . . . . . . . . . . . . . . . . . . X XCilegon, Indonesia** . . . . . . . . . . . . . . . . . . . . . . . . XJakarta, Indonesia* . . . . . . . . . . . . . . . . . . . . . . . . . . X XMerak, Indonesia . . . . . . . . . . . . . . . . . . . . . . . . . . . XKawahigashi-machi, Japan** . . . . . . . . . . . . . . . . . . XIchihara, Japan . . . . . . . . . . . . . . . . . . . . . . . . . . . . . XShimonoseki, Japan** . . . . . . . . . . . . . . . . . . . . . . . X XTokyo, Japan* . . . . . . . . . . . . . . . . . . . . . . . . . . . . . . X X X XPort Dickson, Malaysia** . . . . . . . . . . . . . . . . . . . . X
(1) Regional Shared Service Center* Leased premises** Building(s) owned by Cabot on leased land
We conduct research and development for our various businesses primarily at facilities in Billerica,MA; Albuquerque, NM; Pampa, TX; Pepinster, Belgium; Frankfurt and Rheinfelden, Germany;Kawahigashi-machi, Japan; and Port Dickson, Malaysia.
Our existing manufacturing plants, together with announced capacity expansion plans, will generallyhave sufficient production capacity to meet current requirements and expected near-term growth. Theseplants are generally well maintained, in good operating condition and suitable and adequate for theirintended use. Our administrative offices and other facilities are generally suitable and adequate for theirintended purposes.
20

Item 3. Legal Proceedings
Cabot is a party in various lawsuits and environmental proceedings wherein substantial amounts areclaimed. The following is a description of the significant proceedings pending on September 30, 2009,unless otherwise specified.
Environmental Proceedings
In June 2009, Cabot received an information request from the United States Environmental ProtectionAgency (“EPA”) regarding Cabot’s carbon black manufacturing facility in Pampa, Texas. The informationrequest relates to the Pampa facility’s compliance with certain regulatory and permitting requirements underthe Clean Air Act, including the New Source Review (“NSR”) construction permitting requirements. EPAhas indicated that this information request is part of an EPA national initiative focused on the U.S. carbonblack manufacturing sector. Cabot responded to EPA’s information request in August 2009 and is awaitinga response from EPA. As a result of this initiative, based upon how EPA has handled similar NSRinitiatives with other industrial sectors, it is possible that EPA could attempt to compel Cabot to employadditional technology control devices or approaches with respect to emissions and/or seek a civil penaltyfrom Cabot.
Cabot is one of fourteen companies, collectively the Ashtabula River Cooperating Group II(“ARCG II”), which participated in the remediation of the Ashtabula River in Ohio. Our liability at this siteis associated with the former Cabot Titania business, which operated two manufacturing facilities inAshtabula in the 1960s and early 1970s. The ARCG II is part of a public/private partnership (the AshtabulaRiver Partnership) established to conduct dredging and environmental restoration of the Ashtabula River. Inaddition to funding provided by the ARCG II and the State of Ohio, the federal government also providedfunding toward the project under the Great Lakes Legacy Act and the Water Resources Development Act.Dredging of the river was completed in 2008 and the landfill that was constructed to contain all of thedredged materials was capped in 2009. The ARCG II also is in the process of finalizing a settlement withthe Ashtabula River Natural Resource Trustees for alleged natural resource damages to the river. TheConsent Decree memorializing this settlement is expected to be signed in late 2009 or early 2010.
In 1986, Cabot sold a beryllium manufacturing facility in Reading, Pennsylvania to NGK Metals, Inc.(“NGK”). In doing so, we agreed to share with NGK the costs of certain environmental remediation of theReading plant site. After the sale, the EPA issued an order to NGK pursuant to the Resource Conservationand Recovery Act (“RCRA”) requiring NGK to address soil and groundwater contamination at the site. Soilremediation at the site has been completed and the groundwater remediation activities are ongoing pursuantto the RCRA order. We are contributing to the costs of the groundwater remediation activities pursuant tothe cost-sharing agreement with NGK.
We have several environmental-related lawsuits pending in Campana, Argentina related to our carbonblack plant in Campana. Those lawsuits were filed between 2003 and 2006 by several residential neighborsliving near the industrial area where our plant is located. The lawsuits also name other industrial companiesoperating in the Campana area. The plaintiffs seek monetary damages for property damage and other injuryallegedly caused by emissions from neighboring industrial facilities. We believe the claims relative to Cabotare without merit.
As of September 30, 2009, we had a $6 million reserve on a discounted basis ($6 million on anundiscounted basis) for environmental remediation costs at various sites. The operation and maintenancecomponent of this reserve was $3 million on a discounted basis ($4 million on an undiscounted basis). Thisamount represents our current best estimate of costs likely to be incurred for remediation based on ouranalysis of the extent of cleanup required, alternative cleanup methods available, abilities of otherresponsible parties to contribute and our interpretation of laws and regulations applicable to each of oursites.
21

Other Proceedings
Respirator Liabilities
We have exposure in connection with a safety respiratory products business that a subsidiary acquiredfrom American Optical Corporation (“AO”) in an April 1990 asset purchase transaction. The subsidiarymanufactured respirators under the AO brand and disposed of that business in July 1995. In connection withits acquisition of the business, the subsidiary agreed, in certain circumstances, to assume a portion of AO’sliabilities, including costs of legal fees together with amounts paid in settlements and judgments, allocableto AO respiratory products used prior to the 1990 purchase by the Cabot subsidiary. In exchange for thesubsidiary’s assumption of certain of AO’s respirator liabilities, AO agreed to provide to the subsidiary thebenefits of: (i) AO’s insurance coverage for the period prior to the 1990 acquisition and (ii) a formerowner’s indemnity of AO holding it harmless from any liability allocable to AO respiratory products usedprior to May 1982.
Generally, these respirator liabilities involve claims for personal injury, including asbestosis, silicosisand coal worker’s pneumoconiosis, allegedly resulting from the use of respirators that are claimed to havebeen negligently designed or labeled. Neither Cabot, nor its past or present subsidiaries, at any timemanufactured asbestos or asbestos-containing products. Moreover, not every person with exposure toasbestos giving rise to an asbestos claim used a form of respiratory protection. At no time did thisrespiratory product line represent a significant portion of the respirator market. In addition, other parties,including AO, AO’s insurers, and another former owner and its insurers (collectively, the “Payor Group”),are responsible for significant portions of the costs of these liabilities, leaving Cabot’s subsidiary with aportion of the liability in only some of the pending cases.
The subsidiary transferred the business to Aearo Corporation (“Aearo”) in July 1995. Cabot agreed tohave the subsidiary retain certain liabilities allocable to respirators used prior to the 1995 transaction so longas Aearo paid, and continues to pay, Cabot an annual fee of $400,000. Aearo can discontinue payment ofthe fee at any time, in which case it will assume the responsibility for and indemnify Cabot against theliabilities allocable to respirators manufactured and used prior to the 1995 transaction. We anticipate that wewill continue to receive payment of the $400,000 fee from Aearo and thereby retain these liabilities for theforeseeable future. We have no liability in connection with any products manufactured by Aearo after 1995.
As of September 30, 2009, there were approximately 52,000 claimants in pending cases assertingclaims against AO in connection with respiratory products. Cabot has contributed to the Payor Group’sdefense and settlement costs with respect to a percentage of pending claims depending on several factors,including the period of alleged product use. In order to quantify our estimated share of liability for pendingand future respirator liability claims, we engaged, through counsel, the assistance of Hamilton,Rabinovitz & Alschuler, Inc. (“HR&A”), a leading consulting firm in the field of tort liability valuation.The methodology developed by HR&A addresses the complexities surrounding our potential liability bymaking assumptions about future claimants with respect to periods of asbestos exposure and respirator use.Using those and other assumptions, HR&A estimated the number of future claims that would be filed andthe related costs that would be incurred in resolving those claims. On this basis, HR&A then estimated thenet present value of the share of these liabilities that reflected our period of direct manufacture and ouractual contractual obligations assuming that all other members of the Payor Group meet their obligations.Based on the HR&A estimates, we have recorded on a net present value basis a $13 million reserve ($23million on an undiscounted basis) to cover our estimated share of liability for pending and future respiratorclaims.
Our current estimate of the cost of our share of existing and future respirator liability claims is basedon facts and circumstances existing at this time. Developments that could affect our estimate include, butare not limited to, (i) significant changes in the number of future claims, (ii) changes in the rate ofdismissals without payment of pending silica and non-malignant asbestos claims, (iii) significant changes inthe average cost of resolving claims, (iv) significant changes in the legal costs of defending these claims,
22

(v) changes in the nature of claims received, (vi) changes in the law and procedure applicable to theseclaims, (vii) the financial viability of members of the Payor Group, (viii) a change in the availability ofAO’s insurance coverage, (ix) changes in the allocation of costs among the Payor Group and (x) adetermination that our interpretation of the contractual obligations on which we have estimated our share ofliability is inaccurate. We cannot determine the impact of these potential developments on our currentestimate of our share of liability for these existing and future claims. Accordingly, the actual amount ofthese liabilities for existing and future claims could be different than the reserved amount. Further, if thetiming of our actual payments made for respirator claims differs significantly from our estimated paymentschedule, and we could no longer reasonably predict the timing of such payments, we could then berequired to record the reserve amount on an undiscounted basis on our consolidated balance sheets, causingan immediate impact to earnings.
Carbon Black Antitrust Litigation
Cabot was one of several carbon black manufacturer defendants in federal and state class actionsinitially filed in 2003 alleging that the defendants violated federal and state antitrust laws in connection withthe sale of carbon black. As of September 30, 2009, the only pending state action was in Florida, with all ofthe other federal and state class actions having been previously settled. The parties in the Florida actionentered into a settlement agreement, which received final court approval in October 2009. We deny anywrongdoing of any kind in these cases and strongly believe we have good defenses to the claims, but agreedto the settlements to avoid further expense, inconvenience, risk and the distraction of burdensome andprotracted litigation.
Beryllium Claims
We are a party to several pending actions in connection with our discontinued beryllium operations inReading, Pennsylvania. We entered the beryllium industry through an acquisition in 1978. We ceasedmanufacturing beryllium products at one of the acquired facilities in 1979, and the balance of our formerberyllium business was sold to NGK Metals, Inc. in 1986. The actions involve claims for personal injuryand medical monitoring relating to alleged contact with beryllium in various ways and are pending in thestate and federal courts in Pennsylvania and in the state court in California. All of the personal injury andmedical monitoring actions filed in the Pennsylvania courts have either been settled or resolved in our favorat the trial court level, although the plaintiffs in some cases have filed appeals. The actions pending in theCalifornia state court all involve claims for medical monitoring. We believe that we have valid defenses toall of these beryllium actions and will assert them vigorously in the various venues in which claims havebeen asserted. In addition, there is a contractual indemnification obligation running from NGK to Cabot inconnection with many of these matters.
AVX Contract Dispute
In March 2004, AVX Corporation (“AVX”) filed an action against us in the United States DistrictCourt for the District of Massachusetts. The complaint alleged that we violated the federal antitrust laws inconnection with the parties’ January 1, 2001 tantalum supply agreement (the “Supply Agreement”) bypurportedly tying AVX’s purchases of Cabot’s “flake” tantalum powder to its purchases of Cabot’s“nodular” tantalum powder. In February 2009, the court granted Cabot’s motion for summary judgment inthis matter and dismissed this case against Cabot, which AVX appealed. In addition, in September 2005,AVX filed an action in the Superior Court of Massachusetts for Suffolk County, which was moved to theBusiness Litigation Section of the Superior Court of Massachusetts in November 2005, alleging that Cabotimproperly administered the “most favored customer” provisions of the parties’ Supply Agreement for theyears 2003 through 2005. Cabot filed counterclaims against AVX asserting that AVX actually underpaid fortantalum products during that period. AVX’s damage claim had been limited by the court to approximately$30 million, not including pre-judgment interest. In October 2009, Cabot and AVX entered into an
23
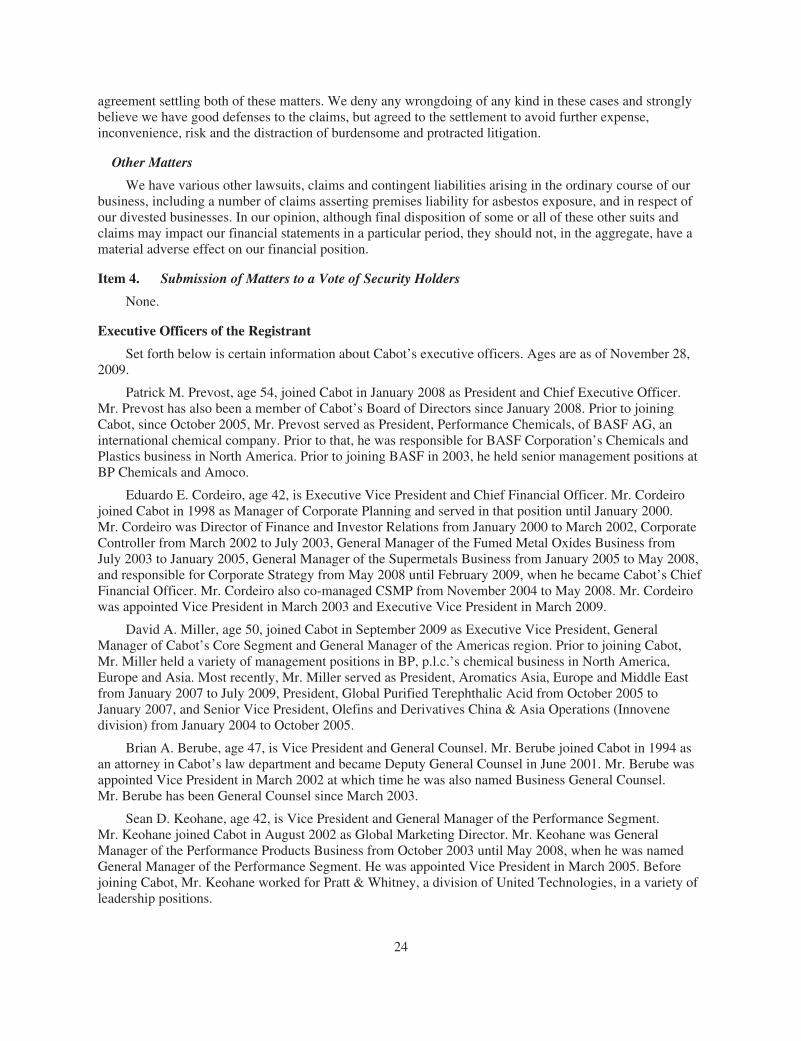
agreement settling both of these matters. We deny any wrongdoing of any kind in these cases and stronglybelieve we have good defenses to the claims, but agreed to the settlement to avoid further expense,inconvenience, risk and the distraction of burdensome and protracted litigation.
Other Matters
We have various other lawsuits, claims and contingent liabilities arising in the ordinary course of ourbusiness, including a number of claims asserting premises liability for asbestos exposure, and in respect ofour divested businesses. In our opinion, although final disposition of some or all of these other suits andclaims may impact our financial statements in a particular period, they should not, in the aggregate, have amaterial adverse effect on our financial position.
Item 4. Submission of Matters to a Vote of Security Holders
None.
Executive Officers of the Registrant
Set forth below is certain information about Cabot’s executive officers. Ages are as of November 28,2009.
Patrick M. Prevost, age 54, joined Cabot in January 2008 as President and Chief Executive Officer.Mr. Prevost has also been a member of Cabot’s Board of Directors since January 2008. Prior to joiningCabot, since October 2005, Mr. Prevost served as President, Performance Chemicals, of BASF AG, aninternational chemical company. Prior to that, he was responsible for BASF Corporation’s Chemicals andPlastics business in North America. Prior to joining BASF in 2003, he held senior management positions atBP Chemicals and Amoco.
Eduardo E. Cordeiro, age 42, is Executive Vice President and Chief Financial Officer. Mr. Cordeirojoined Cabot in 1998 as Manager of Corporate Planning and served in that position until January 2000.Mr. Cordeiro was Director of Finance and Investor Relations from January 2000 to March 2002, CorporateController from March 2002 to July 2003, General Manager of the Fumed Metal Oxides Business fromJuly 2003 to January 2005, General Manager of the Supermetals Business from January 2005 to May 2008,and responsible for Corporate Strategy from May 2008 until February 2009, when he became Cabot’s ChiefFinancial Officer. Mr. Cordeiro also co-managed CSMP from November 2004 to May 2008. Mr. Cordeirowas appointed Vice President in March 2003 and Executive Vice President in March 2009.
David A. Miller, age 50, joined Cabot in September 2009 as Executive Vice President, GeneralManager of Cabot’s Core Segment and General Manager of the Americas region. Prior to joining Cabot,Mr. Miller held a variety of management positions in BP, p.l.c.’s chemical business in North America,Europe and Asia. Most recently, Mr. Miller served as President, Aromatics Asia, Europe and Middle Eastfrom January 2007 to July 2009, President, Global Purified Terephthalic Acid from October 2005 toJanuary 2007, and Senior Vice President, Olefins and Derivatives China & Asia Operations (Innovenedivision) from January 2004 to October 2005.
Brian A. Berube, age 47, is Vice President and General Counsel. Mr. Berube joined Cabot in 1994 asan attorney in Cabot’s law department and became Deputy General Counsel in June 2001. Mr. Berube wasappointed Vice President in March 2002 at which time he was also named Business General Counsel.Mr. Berube has been General Counsel since March 2003.
Sean D. Keohane, age 42, is Vice President and General Manager of the Performance Segment.Mr. Keohane joined Cabot in August 2002 as Global Marketing Director. Mr. Keohane was GeneralManager of the Performance Products Business from October 2003 until May 2008, when he was namedGeneral Manager of the Performance Segment. He was appointed Vice President in March 2005. Beforejoining Cabot, Mr. Keohane worked for Pratt & Whitney, a division of United Technologies, in a variety ofleadership positions.
24

PART IIItem 5. Market for Registrant’s Common Equity, Related Stockholder Matters and Issuer Purchases
of Equity SecuritiesCabot’s common stock is listed for trading (symbol CBT) on the New York Stock Exchange. As of
November 19, 2009, there were 1,242 holders of record of Cabot’s common stock. The tables below showthe high and low sales price for Cabot’s common stock for each of the fiscal quarters endedDecember 31, March 31, June 30, and September 30 and the quarterly cash dividend paid on Cabot’scommon stock for the past two fiscal years.
Stock Price and Dividend DataQuarters Ended
December 31 March 31 June 30 September 30
Fiscal 2009Cash dividends per share . . . . . . . . . . . . . . . . . . . . . . . . . . . . . $ 0.18 $ 0.18 $ 0.18 $ 0.18Price range of common stock:High . . . . . . . . . . . . . . . . . . . . . . . . . . . . . . . . . . . . . . . . . . . . $32.00 $16.66 $18.42 $24.67Low . . . . . . . . . . . . . . . . . . . . . . . . . . . . . . . . . . . . . . . . . . . . $13.42 $ 7.97 $10.12 $12.18
Fiscal 2008Cash dividends per share . . . . . . . . . . . . . . . . . . . . . . . . . . . . . $ 0.18 $ 0.18 $ 0.18 $ 0.18Price range of common stock:High . . . . . . . . . . . . . . . . . . . . . . . . . . . . . . . . . . . . . . . . . . . . $40.49 $33.50 $33.72 $33.46Low . . . . . . . . . . . . . . . . . . . . . . . . . . . . . . . . . . . . . . . . . . . . $30.44 $25.47 $24.24 $21.98
Issuer Purchases of Equity SecuritiesThe table below sets forth information regarding Cabot’s purchases of its equity securities during the
quarter ended September 30, 2009:
Period
Total Numberof Shares
Purchased(1)
AveragePrice Paidper Share
Total Number ofShares Purchasedas Part of PubliclyAnnounced Plansor Programs(1)
Maximum Number (orApproximate DollarValue) of Shares thatMay Yet Be PurchasedUnder the Plans or
Programs(1)
July 1, 2009—July 31, 2009 . . . . . . . . . . . . . 2,050 $11.25 — 4,311,122August 1, 2009—August 31, 2009 . . . . . . . . 42,301 $18.98 — 4,311,122September 1, 2009—September 30, 2009 . . . 57,559 $13.09 — 4,311,122
Total . . . . . . . . . . . . . . . . . . . . . . . . . . . . . . 101,910 —
(1) On May 11, 2007, we publicly announced that the Board of Directors authorized us to repurchase fivemillion shares of our common stock on the open market or in privately negotiated transactions. OnSeptember 14, 2007, the Board of Directors increased the share repurchase authorization to 10 millionshares (the “2007 Authorization”). This authority does not have a set expiration date. We did notrepurchase any shares under the 2007 Authorization in the fourth quarter of fiscal 2009.
In addition to the 2007 Authorization, the Board has authorized us to repurchase shares of restrictedstock purchased by recipients of long-term incentive awards in 2006, 2007 and 2008 at any date on orafter such shares vest to satisfy tax withholding obligations that arise on the vesting of such shares andto satisfy associated loan repayment liabilities. The shares are repurchased from employees at fairmarket value. During the fourth quarter of fiscal 2009, we repurchased 54,260 shares from employeesto satisfy loan repayment liabilities.
From time to time, we also repurchase shares of unvested restricted stock from employees whoseemployment is terminated before such shares vest. These shares are repurchased pursuant to the termsof our equity incentive plans and are not included in the shares repurchased under the authorizationsdescribed above. During the fourth quarter of fiscal 2009, we repurchased 47,650 forfeited sharespursuant to the terms of our equity incentive plans.
25

Item 6. Selected Financial DataYears Ended September 30
2009 2008 2007 2006 2005
(Dollars in millions, except per share amounts and ratios)Consolidated Net Income (Loss)Net sales and other operating revenues . . . . . . . . . . . . . . $2,243 $3,191 $2,616 $2,543 $2,125
Gross profit . . . . . . . . . . . . . . . . . . . . . . . . . . . . . . . . . . . 227 484 505 419 433Selling and administrative expenses . . . . . . . . . . . . . . . . 211 246 249 235 240Research and technical expense . . . . . . . . . . . . . . . . . . . 71 74 69 58 59Goodwill and long-lived asset impairment charge . . . . . — — — — 211
(Loss) income from operations(a) . . . . . . . . . . . . . . . . (55) 164 187 126 (77)Net interest expense and other charges(b) . . . . . . . . . . . . (47) (52) (19) (29) (16)
(Loss) income from continuing operations . . . . . . . . . (102) 112 168 97 (93)Benefit (provision) for income taxes(c) . . . . . . . . . . . . . . 22 (14) (38) (9) 45Equity in net income of affiliated companies . . . . . . . . . 5 8 12 12 12Minority interest in net income . . . . . . . . . . . . . . . . . . . . (2) (20) (15) (12) (12)Income from operations of discontinued businesses . . . — — 2 2 —Charge from cumulative effect of changes inaccounting principles . . . . . . . . . . . . . . . . . . . . . . . . . — — — (2) —
Net (loss) income . . . . . . . . . . . . . . . . . . . . . . . . . . . . $ (77) $ 86 $ 129 $ 88 $ (48)
Common Share DataDiluted net income (loss):(Loss) income from continuing operations . . . . . . . . . $ (1.22) $ 1.34 $ 1.87 $ 1.28 $ (0.84)
Discontinued operations:(Loss) income from operations of discontinuedbusinesses . . . . . . . . . . . . . . . . . . . . . . . . . . . . . . . . (0.01) — 0.03 0.03 —
(Loss) from cumulative effect of changes in accountingprinciples . . . . . . . . . . . . . . . . . . . . . . . . . . . . . . . . . . . — — — (0.03) —
Net (loss) income . . . . . . . . . . . . . . . . . . . . . . . . . . . . . . $ (1.23) $ 1.34 $ 1.90 $ 1.28 $ (0.84)
Dividends . . . . . . . . . . . . . . . . . . . . . . . . . . . . . . . . . . . . $ 0.72 $ 0.72 $ 0.72 $ 0.64 $ 0.64Closing prices . . . . . . . . . . . . . . . . . . . . . . . . . . . . . . . . . $23.11 $31.78 $35.53 $37.20 $33.01
Average diluted shares outstanding—millions(d) . . . . 63 64 68 68 60Shares outstanding at year end—millions(e) . . . . . . . . 65 65 65 64 63
Consolidated Financial PositionTotal current assets . . . . . . . . . . . . . . . . . . . . . . . . . . . . . $1,200 $1,408 $1,275 $1,255 $1,246Net property, plant and equipment . . . . . . . . . . . . . . . . . 1,012 1,082 1,016 964 834Other assets . . . . . . . . . . . . . . . . . . . . . . . . . . . . . . . . . . . 464 368 345 315 294
Total assets . . . . . . . . . . . . . . . . . . . . . . . . . . . . . . . . . $2,676 $2,858 $2,636 $2,534 $2,374
Total current liabilities . . . . . . . . . . . . . . . . . . . . . . . . . . $ 477 $ 601 $ 547 $ 505 $ 433Long-term debt . . . . . . . . . . . . . . . . . . . . . . . . . . . . . . . . 623 586 503 459 463Other long-term liabilities and minority interest . . . . . . 442 422 392 374 379Stockholders’ equity . . . . . . . . . . . . . . . . . . . . . . . . . . . . 1,134 1,249 1,194 1,196 1,099
Total liabilities and stockholders’ equity . . . . . . . . . . $2,676 $2,858 $2,636 $2,534 $2,374
Working capital . . . . . . . . . . . . . . . . . . . . . . . . . . . . . . . . $ 723 $ 807 $ 728 $ 750 $ 813
Selected Financial RatiosIncome (loss) from continuing operations as apercentage of sales . . . . . . . . . . . . . . . . . . . . . . . . . . . (4)% 3% 6% 4% (4)%
Return on average stockholders’ equity(f) . . . . . . . . . . . . (6)% 8% 11% 9% (4)%Net debt to capitalization ratio(g) . . . . . . . . . . . . . . . . . . . 22% 30% 25% 22% 24%Earnings to fixed charges ratio(h) . . . . . . . . . . . . . . . . . . NA 3x 5x 4x NA
26

(a) Loss from operations for fiscal 2009 includes charges of $91 million for the Company’s restructuringactivities, $89 million of which related to the 2009 global restructuring plan, $4 million for executivetransition costs, $1 million for the write-down of impaired investments, and $7 million for environmentalreserves and legal settlements. Income from operations for fiscal 2008 includes charges of $16 million forthe closure of our carbon black facility in Waverly, West Virginia, $6 million for the Company’s 2008global restructuring plan, $4 million for executive transition costs, $3 million for environmental and legalreserves, $2 million related to the closure of a former carbon black facility, and $2 million for debtissuance costs, offset by a gain of $18 million for the sale of land in Altona, Australia and a $2 millionreduction in the reserve for respirator claims. Income from operations for fiscal 2007 includes charges of$18 million for legal and environmental reserves and settlements, $12 million for restructuring activities,and $4 million related to the acquisition of in-process research and development technology in theSupermetals Business. Income from operations for fiscal 2006 includes charges of $10 million for globalrestructuring activities, $11 million of charges related to the closure of our Altona, Australia facility, $3million for cost reduction initiatives and a $27 million payment in connection with a new tantalum oreagreement. Loss from operations for fiscal 2005 includes charges of $16 million for restructurings and$15 million of charges for cost reduction initiatives in the Supermetals Business.
(b) Net interest expense and other charges for fiscal 2009 include foreign currency losses of approximately $17million. Net interest expense and other charges for fiscal 2008 include foreign currency losses ofapproximately $5 million. Net interest expense and other charges for fiscal 2007 include foreign currencygains of approximately $8 million. Net interest expense and other charges for fiscal 2006 include an $8million charge related to a foreign currency translation adjustment write-off due to the substantialliquidation of our Altona, Australia entity. Net interest expense and other charges for fiscal 2005 include $2million of insurance recoveries and $2 million of income related to foreign currency translation adjustments.
(c) The Company’s tax rate for fiscal 2009 was a benefit of 22%, which includes $12 million of net taxbenefits resulting from settlements of various tax audits and tax credits during the year. TheCompany’s tax rate for fiscal 2008 was a provision of 13%, which includes approximately $11 millionof net tax benefits resulting from settlements of various tax audits and tax credits during the year. TheCompany’s tax rate for fiscal 2007 was a provision of 23%, which includes $3 million in tax benefitsresulting from the settlement of various tax audits during the year. The Company’s tax rate for fiscal2006 was a provision of 9%, which includes $18 million in tax benefits from the settlement of varioustax audits during the year. The Company’s tax rate for fiscal 2005 was a benefit of 48%, whichincludes the effect of a $23 million tax settlement benefit.
(d) The weighted average common shares outstanding for fiscal 2009 excludes approximately 2 millionshares as those shares would have had an antidilutive effect due to the Company’s net loss position.The weighted average common shares outstanding for fiscal 2005 excludes approximately 8 millionshares as those shares would have had an antidilutive effect due to the Company’s net loss position.
(e) The shares outstanding as of September 30, 2007 reflect the issuance in July 2007 of approximately4.7 million shares of common stock upon the conversion of all of our then outstanding shares of SeriesB ESOP Convertible Preferred Stock and the repurchase of approximately 4.6 million shares ofcommon stock during fiscal 2007.
(f) Return on average stockholders’ equity is calculated using net income excluding minority interestexpense divided by the average stockholders’ equity plus minority interest.
(g) Net debt to capitalization is calculated by dividing total debt (the sum of short-term and long-term debt lesscash and short-term marketable securities) by the sum of total stockholder’s equity plus minority interest.
(h) Earnings to fixed charges is calculated as follows: the sum of (i) earnings, defined as (loss) incomefrom continuing operations plus dividends received from equity affiliates and (ii) fixed charges,defined as the sum of interest on indebtedness, implied interest on rental payments, and preferred stockdividends, divided by fixed charges. For fiscal 2009 and 2005 the earnings to fixed charges ratio isnegative because of the losses in those years. The dollar amount of the deficiency is $102 million and$93 million for fiscal 2009 and 2005, respectively.
27

Item 7. Management’s Discussion and Analysis of Financial Condition and Results of Operations
Critical Accounting Policies
The preparation of our financial statements requires management to make estimates and judgments thataffect the reported amounts of assets, liabilities, revenues, and expenses and related disclosure of contingentassets and liabilities. We consider an accounting estimate to be critical to the financial statements if i) theestimate is complex in nature or requires a high degree of judgment and ii) different estimates andassumptions were used, the result could have a material impact on the consolidated financial statements. Onan ongoing basis, we evaluate our policies and estimates. We base our estimates on historical experience,current conditions and on various other assumptions that we believe are reasonable under the circumstances,the results of which form the basis for making judgments about the carrying values of assets and liabilitiesthat are not readily apparent from other sources. Actual results may differ from these estimates underdifferent assumptions or conditions. The estimates that we believe are critical to the preparation of theConsolidated Financial Statements are presented below.
Revenue Recognition and Accounts Receivable
We recognize revenue when persuasive evidence of a sales arrangement exists, delivery has occurred,the sales price is fixed or determinable and collectibility is probable. We generally are able to ensure thatproducts meet customer specifications prior to shipment. If we are unable to determine that the product hasmet the specified objective criteria prior to shipment, the revenue is deferred until product acceptance hasoccurred.
Shipping and handling charges related to sales transactions are recorded as sales revenue when billedto customers or included in the sales price. Shipping and handling costs are included in cost of sales.
The following table summarizes the percentages of total net sales and other operating revenuesrecognized in each of our reportable segments. Other operating revenues, which represent less than twopercent of total revenues, are primarily royalties for licensed technology:
Years ended September 30
2009 2008 2007
Core SegmentRubber Blacks Business . . . . . . . . . . . . . . . . . . . . . . . . . . . . . . . . . . . . . . . . . . . . . . 59% 60% 55%Supermetals Business . . . . . . . . . . . . . . . . . . . . . . . . . . . . . . . . . . . . . . . . . . . . . . . . 6% 6% 9%
Performance Segment . . . . . . . . . . . . . . . . . . . . . . . . . . . . . . . . . . . . . . . . . . . . . . . . . 29% 30% 32%New Business Segment . . . . . . . . . . . . . . . . . . . . . . . . . . . . . . . . . . . . . . . . . . . . . . . . 3% 2% 2%Specialty Fluids Segment . . . . . . . . . . . . . . . . . . . . . . . . . . . . . . . . . . . . . . . . . . . . . . . 3% 2% 2%
As indicated above, we derive a substantial majority of revenues from the sale of products in our Coreand Performance Segments. Revenue from these products is typically recognized when the product isshipped and title and risk of loss have passed to the customer. We offer certain customers cash discountsand volume rebates as sales incentives. The discounts and volume rebates are recorded as a reduction insales at the time revenue is recognized and are estimated based on historical experience and contractualobligations. We periodically review the assumptions underlying the estimates of discounts and volumerebates and adjust revenues accordingly. Certain Rubber Blacks Business and Performance Segmentcustomer contracts contain price protection clauses that provide for the potential reduction in past or futuresales prices under specific circumstances. We analyze these contract provisions to determine if an obligationrelated to these clauses exists and record revenue net of any estimated protection commitments.
The majority of the revenue in the Specialty Fluids Segment arises from the rental of cesium formate.This revenue is recognized throughout the rental period based on the contracted rental terms. Customers arealso billed and revenue is recognized, typically at the end of the job, for cesium formate product that is notreturned.
28

We maintain allowances for doubtful accounts based on an assessment of the collectibility of specificcustomer accounts, the aging of accounts receivable and other economic information on both an historicaland prospective basis. Customer account balances are charged against the allowance when it is probable thereceivable will not be recovered. Changes in the allowance during fiscal 2009 and 2008 were not material.There is no off-balance sheet credit exposure related to customer receivable balances.
Inventory Valuation
The cost of most raw materials, work in process and finished goods inventories in the U.S. isdetermined by the last-in, first-out (“LIFO”) method. Total U.S. inventories utilizing this cost flowassumption were $64 million and $75 million at September 30, 2009 and 2008, respectively. Theseinventories represent 18% and 14% of total worldwide inventories at the respective year-ends. Had we usedthe first-in, first-out (“FIFO”) method instead of the LIFO method for such inventories, the value of thoseinventories would have been $119 million and $140 million higher as of September 30, 2009 andSeptember 30, 2008, respectively. The cost of other U.S. and all non-U.S. inventories is determined usingthe average cost method or the FIFO method. In periods of rapidly rising or declining raw material costs,the inventory method we employ can have a significant impact on our profitability. Under our current LIFOmethod, when raw material costs are rising, our most recent higher priced purchases are the first to becharged to cost of sales. If, however, we were using a FIFO method, our purchases from 60 days earlier,which were at lower prices, would instead be the first charged to cost of sales. The opposite result couldoccur during a period of rapid decline in raw material costs.
At certain times, we may decrease inventory levels to the point where layers of inventory recordedunder the LIFO method that were purchased in preceding years are liquidated. The inventory in these layersmay be valued at an amount that is different than our current costs. If there is a liquidation of an inventorylayer, there may be an impact to our cost of sales and net income for that period. If the liquidated inventoryis at a cost lower than our current cost, there would be a reduction in our cost of sales and an increase to ournet income during the period. Conversely, if the liquidated inventory is at a cost higher than our currentcost, there will be an increase in our cost of sales and a reduction to our net income during the period.
During fiscal 2009, 2008 and 2007, inventory quantities were reduced at our U.S. Supermetals site.Additionally, during fiscal 2009 and 2008 inventory quantities were reduced at our U.S. Rubber Blacks andPerformance Products sites, leading to liquidations of LIFO inventory quantities. These LIFO layerliquidations resulted in a decrease of cost of goods sold of $6 million, $14 million and $4 million and anincrease in net income of $4 million ($0.07 per diluted common share), $9 million ($0.14 per dilutedcommon share) and $3 million ($0.04 per diluted common share) for fiscal 2009, 2008 and 2007,respectively.
We review inventory for both potential obsolescence and potential loss of value periodically. In thisreview, we make assumptions about the future demand for and market value of the inventory and based onthese assumptions estimate the amount of any obsolete, unmarketable or slow moving inventory. We writedown our inventories if they are considered to be obsolete or unsaleable by an amount equal to thedifference between the cost of inventory and the estimated market value. In cases where inventories are stillsaleable but the market value is below cost, the inventory is adjusted to its market value. Historically, suchwrite-downs have not been significant. If actual market conditions are less favorable than those projected bymanagement at the time of the assessment, however, additional inventory write-downs may be required,which could reduce our gross profit and our earnings.
Stock-based Compensation
We issue restricted stock and stock options under our equity compensation plans. The fair value ofrestricted stock is based on intrinsic value at the grant date and is recognized as expense over the serviceperiod, which generally represents the vesting period. There are no significant estimates involved in
29

recording compensation costs under the intrinsic value method with the exception of estimates we makearound the probability of forfeitures. Changes in the forfeiture assumptions could impact our earnings butwould not impact our cash flows.
We use the Black-Scholes option pricing model to calculate the fair value of stock options issued underour equity compensation plans. In determining the fair value of stock options, we make a variety ofassumptions and estimates, including discount rates, forfeiture rates, volatility measures, expected dividendsand expected option lives. Changes to such assumptions and estimates can result in different fair values andcould therefore impact our earnings. Such changes would not impact our cash flows.
Goodwill and Other Intangible Assets
We perform an impairment test for goodwill at least annually and when events or changes in businesscircumstances indicate that the carrying value may not be recoverable. To test whether an impairmentexists, the fair value of the applicable reporting unit is estimated based on discounted future cash flows. Thecalculation of fair value is sensitive to both the estimated future cash flows and the discount rate applied tothose cash flows. The assumptions used to estimate the discounted cash flows are based on management’sbest estimates about selling prices, production and sales volumes, costs, future growth rates, capitalexpenditures and market conditions over an estimate of the remaining operating period at the reporting unit.The discount rate is based on the weighted average cost of capital that is determined by evaluating the risk-free rate of return, cost of debt and expected equity premiums. If an impairment exists, a loss to write downthe value of goodwill to its implied fair value is recorded. While this would have no direct impact on ourcash flows, it would reduce our earnings. No impairments were recorded in fiscal 2009, 2008 or 2007.
Valuation of Long-Lived Assets
Our long-lived assets primarily include property, plant, equipment, long-term investments and assetsheld for rent. We review the carrying values of long-lived assets for impairment whenever events orchanges in business circumstances indicate that the carrying amount of an asset may not be recoverable.Such circumstances would include, but are not limited to, a significant decrease in the market price of thelong-lived asset, a significant adverse change in the way the asset is being used, a decline in the physicalcondition of the asset or a history of operating or cash flow losses associated with the use of the asset.
We make various estimates and assumptions when analyzing whether there is an impairment of ourlong-lived assets, excluding goodwill and long-term investments. These estimates and assumptions includedetermining which cash flows are directly related to the potentially impaired asset, the useful life of theasset over which the cash flows will occur, their amounts and the asset’s residual value, if any. An assetimpairment exists when the carrying value of the asset is not recoverable based on the undiscountedestimated cash flows expected from the asset. The impairment loss is determined by the excess of theasset’s carrying value over its fair value. Our estimated future cash flows reflect management’s assumptionsabout selling prices, production and sales volume, costs, and market conditions over an estimate of theremaining useful life of the asset. While an impairment charge would have no direct impact on our cashflows, it would reduce our earnings.
The fair values of long-term investments are dependent on the financial performance of the entities inwhich we invest and the external factors inherent in the markets in which these entities operate. We considerthese factors as well as the forecasted financial performance of the investment entities when assessing thepotential impairment of these investments.
Financial Instruments
Our financial instruments consist primarily of cash and cash equivalents, short-term and long-termdebt, and derivative instruments. The carrying values of our financial instruments approximate fair valuewith the exception of certain long-term debt that has not been designated with a fair value hedge. This
30

portion of long-term debt is recorded at face value. The fair values of our derivative instruments are basedon quoted market prices. We use derivative financial instruments primarily for purposes of hedgingexposures to fluctuations in interest rates and foreign currency exchange rates, which exist as part of ouron-going business operations. We do not enter into contracts for speculative purposes, nor do we hold orissue any financial instruments for trading purposes.
All derivatives are recognized on the consolidated balance sheets at fair value. The changes in the fairvalue of derivatives are recorded in either earnings or other comprehensive income, depending on whetheror not the instrument is designated as part of a hedge transaction and, if designated as part of a hedgetransaction, the type of hedge transaction. The gains or losses on derivative instruments reported in othercomprehensive income are reclassified to earnings in the period in which earnings are affected by theunderlying hedged item. The ineffective portion of all hedges is recognized in earnings immediately.
In accordance with our risk management strategy, we may enter into certain derivative instruments thatmay not be designated as hedges for hedge accounting purposes. Although these derivatives are notdesignated as hedges, we believe that such instruments are closely correlated with the underlying exposure,thus managing the associated risk. We record directly to earnings the gains or losses from changes in thefair value of derivative instruments that are not designated as hedges.
In the recent past, the ability of financial counterparties to perform under these financial instrumentshas become less certain. We attempt to take into account the financial viability of counterparties in bothvaluing the instruments and determining their effectiveness as hedging instruments. If a counterparty wasunable to perform, our ability to qualify for hedge accounting for certain transactions would becompromised and the realizable value of these financial instruments would be uncertain. As a result, ourresults of operations and cash flows could be impacted.
We carry a variety of different cash and cash equivalents on our consolidated balance sheets. Wecontinually assess the liquidity of cash and cash equivalents and as of September 30, 2009, we havedetermined that they are readily convertible to cash.
Pensions and Other Postretirement Benefits
We maintain both defined benefit and defined contribution plans for our employees. In addition, weprovide certain postretirement health care and life insurance benefits for our retired employees. Planobligations and annual expense calculations are based on a number of key assumptions. The assumptions,which are specific for each of our U.S. and foreign plans, are related to both the assets we hold to fund ourplans (where applicable) and the characteristics of the benefits that will ultimately be provided to ouremployees. The most significant assumptions relative to our plan assets include the anticipated rates ofreturn on these assets. Assumptions relative to our pension obligations are more varied; they includeestimated discount rates, rates of compensation increases for employees, mortality, employee turnover andother related demographic data. Projected health care and life insurance obligations also rely on the abovementioned demographic assumptions and assumptions surrounding health care cost trends.
We compute our recorded obligations globally in accordance with U.S. generally accepted accountingprinciples. Under such principles, if actual results differ from what is projected, the differences are generallyaccumulated and amortized over future periods and could therefore affect the recognized expense andrecorded obligation in such future periods. However, cash flow requirements may be different from theamounts of expense that are recorded in the consolidated financial statements. In fiscal 2009, restructuringactivities resulted in certain pension plan curtailments and settlements, which tend to accelerate therecognition of the deferred gains and losses.
Self-Insurance Reserves
We are partially self-insured for certain third-party liability, workers’ compensation and employeemedical benefits in the United States. The third-party and workers’ compensation liabilities are managed
31

through a wholly-owned insurance captive and the related liabilities are included in the consolidatedfinancial statements. The employee medical obligations are managed by a third-party provider and therelated liabilities are included in the consolidated financial statements. To limit our potential liabilities forthese risks, however, we purchase insurance from third-parties that provides individual and aggregate stoploss protection. The aggregate self-insured liability for combined workers’ compensation and third-partyliabilities in the United States in fiscal 2009 is $5 million, and the retention for medical costs in the UnitedStates is at most $200,000 per person per annum. We have accrued amounts equal to the actuariallydetermined future liabilities. We determine the actuarial assumptions in collaboration with third-partyactuaries, based on historical information along with certain assumptions about future events. Changes inassumptions for such matters as legal actions, medical costs and changes in actual experience could causethese estimates to change and impact our earnings and cash flows.
Asset Retirement Obligations
We account for asset retirement obligations by estimating incremental costs for special handling,removal and disposal costs of materials that may or will give rise to conditional asset retirement obligations(“AROs”) and then discount the expected costs back to the current year using a credit adjusted risk-freerate. ARO liabilities and costs are recognized when the timing and/or settlement can be reasonablyestimated. If it is unclear when, or if, an ARO will be triggered, we use probability weightings for possibletiming scenarios to determine the amounts that should be recognized in our financial statements.
The estimation of AROs is subject to a number of inherent uncertainties including: (a) the timing ofwhen any ARO may be incurred, (b) the ability to accurately identify and reasonably estimate the costs ofall materials that may require special handling or treatment, (c) the ability to assess the relative probabilityof different scenarios that could give rise to an ARO, and (d) other factors outside our control, includingchanges in regulations, costs and interest rates.
AROs have not been recognized for certain of our facilities because either the present value of theobligation cannot be reasonably estimated due to an indeterminable facility life or we do not have a legalobligation associated with the retirement of those facilities. In most circumstances where AROs have beenrecorded, the anticipated cash outflows will likely take place far into the future. Accordingly, actual costsand the timing of such costs may vary significantly from our estimates, which may, in turn, impact ourearnings. In general, however, when such estimates change, the impact is spread over future years and thusthe impact on any individual year is unlikely to be material.
Litigation and Contingencies
We are involved in litigation in the ordinary course of business, including personal injury andenvironmental litigation. After consultation with counsel, as appropriate, we accrue a liability for litigationwhen it is probable that a liability has been incurred and the amount can be reasonably estimated. Theestimated reserves are recorded based on our best estimate of the liability associated with such matters orthe low end of the estimated range of liability if we are unable to identify a better estimate within that range.Our best estimate is determined through the evaluation of various information, including claims, settlementoffers, demands by government agencies, estimates performed by independent third parties, identification ofother responsible parties and an assessment of their ability to contribute, and our prior experience. Litigationis highly uncertain and there is always the possibility of an unusual result in any particular case that mayreduce our earnings and cash flows.
The most significant reserves that we have established are for environmental remediation andrespirator litigation claims. The amount accrued for environmental matters reflects our assumptions aboutremediation requirements at the contaminated sites, the nature of the remedies, the outcome of discussionswith regulatory agencies and other potentially responsible parties at multi-party sites, and the number andfinancial viability of other potentially responsible parties. A portion of the reserve for environmental matters
32

is recognized on a discounted basis, which requires the use of estimated discount rates and estimates offuture cash flows associated with the liability. These liabilities can be affected by the availability of newinformation, changes in the assumptions on which the accruals are based, unanticipated governmentenforcement action or changes in applicable government laws and regulations, which could result in higheror lower costs.
Our current estimate of the cost of our share of existing and future respirator liability claims is basedon facts and circumstances existing at this time. Developments that could affect our estimate include, butare not limited to, (i) significant changes in the number of future claims, (ii) changes in the rate ofdismissals without payment of pending silica and non-malignant asbestos claims, (iii) significant changes inthe average cost of resolving claims, (iv) significant changes in the legal costs of defending these claims,(v) changes in the nature of claims received, (vi) changes in the law and procedure applicable to theseclaims, (vii) the financial viability of other parties that contribute to the settlement of respirator claims,(viii) a change in the availability of American Optical’s insurance coverage, (ix) changes in the allocation ofcosts among other parties that contribute to the settlement of respirator claims and (x) a determination thatour interpretation of the contractual obligations on which we have estimated our share of liability isinaccurate. We cannot determine the impact of these potential developments on our current estimate of ourshare of liability for these existing and future claims. Accordingly, the actual amount of these liabilities forexisting and future claims could be different than the reserved amount. Further, if the timing of our actualpayments made for respirator claims differs significantly from our estimated payment schedule, and wecould no longer reasonably predict the timing of such payments, we could then be required to record thereserve amount on an undiscounted basis on our consolidated balance sheets, causing an immediate impactto earnings.
Income Taxes
Our business operations are global in nature, and we are subject to taxes in numerous jurisdictions. Taxlaws and tax rates vary substantially in these jurisdictions and are subject to change based on the politicaland economic climate in those countries. We file our tax returns in accordance with our interpretations ofeach jurisdiction’s tax laws.
Significant judgment is required in determining our worldwide provision for income taxes andrecording the related tax assets and liabilities. In the ordinary course of our business, there are operationaldecisions, transactions, facts and circumstances, and calculations which make the ultimate tax determinationuncertain. Furthermore, our tax positions are periodically subject to challenge by taxing authoritiesthroughout the world. We have recorded reserves for taxes and associated interest and penalties that maybecome payable in future years as a result of audits by tax authorities. Certain of these reserves are foruncertain income tax positions taken on income tax returns.
We record obligations for uncertain tax positions based on an assessment of whether the position ismore likely than not to be sustained by the taxing authorities. If this threshold is not met, the full amount ofthe uncertain tax position is recorded as a liability. If the threshold is met, the tax benefit that is recognizedis the largest amount that is greater than 50 percent likely of being realized upon ultimate settlement. Thisanalysis presumes the taxing authorities’ full knowledge of the positions taken and all relevant facts, butdoes not consider the time value of money. We also accrue for interest and penalties on these uncertain taxpositions and include such charges in the income tax provision in the consolidated statements of operations.
Additionally, we have established valuation allowances against a variety of deferred tax assets,including net operating loss carry-forwards, foreign tax credits, and other income tax credits. Valuationallowances take into consideration our ability to use these deferred tax assets and reduce the value of suchitems to the amount that is deemed more likely than not to be recoverable. Our ability to utilize thesedeferred tax assets is dependent on achieving our forecast of future taxable operating income over anextended period of time. We review our forecast in relation to actual results and expected trends on aquarterly basis. Failure to achieve our operating income targets may change our assessment regarding the
33

recoverability of our net deferred tax assets and such change could result in a valuation allowance beingrecorded against some or all of our net deferred tax assets. An increase in a valuation allowance wouldresult in additional income tax expense and lower stockholders’ equity, and could have a significant impacton our earnings in future periods. The release of valuation allowances in periods when these tax attributesbecome realizable would reduce our effective tax rate.
Highly Inflationary Environments
We monitor the currencies of countries in which we operate in order to determine if the country shouldbe considered a highly inflationary environment. If and when a currency is determined to be highlyinflationary (cumulative inflation of approximately 100 percent or more over a 3-year period), thefunctional currency of the affected operation would be changed to our reporting currency, the U.S. dollar.This change in functional currency to the U.S. Dollar would result in (i) a one time remeasurement of ournet monetary assets and liabilities, directly impacting our statement of operations, and (ii) foreign exchangegains or losses being recognized on all transactions and monetary assets and liabilities denominated incurrencies other than the U.S. Dollar. As of September 30, 2009, Venezuela is on our watch list and weexpect the Bolivar will trigger highly inflationary accounting during fiscal 2010.
Restructuring Activities
Our consolidated financial statements detail specific charges relating to restructuring activities as wellas the actual spending that has occurred against the restructuring accruals. Our restructuring charges areestimates based on our preliminary assessments of numerous factors, including (i) severance benefits to begranted to employees which are based on known benefit formulas and identified job grades, (ii) thetimeframe and costs to vacate certain facilities and (iii) asset impairments. Because these accruals areestimates, they are subject to change as a result of deviations from initial restructuring plans or subsequentinformation that may come to our attention. These deviations may lead to changes in estimates, whichwould then be reflected in our consolidated financial statements.
Significant Accounting Policies
We have other significant accounting policies that are discussed in Note A of the Notes to ourConsolidated Financial Statements and in Item 8 below. Certain of these policies include the use ofestimates, but do not meet the definition of critical because they generally do not require estimates orjudgments that are as difficult or subjective to measure. However, these policies are important to anunderstanding of the consolidated financial statements.
Newly Issued Accounting Pronouncements Not Yet Adopted
In December 2007, the Financial Accounting Standards Board (“FASB”) issued authoritative guidanceon business combinations that will become effective for all business combinations completed by us on orafter October 1, 2009. The guidance establishes principles and requirements for how an acquirer in abusiness combination recognizes and measures in its financial statements the identifiable assets acquired,the liabilities assumed, and any non-controlling interest in the acquiree. It also provides guidance forrecognizing and measuring the goodwill acquired in the business combination and determines whatinformation to disclose to enable users of the financial statements to evaluate the nature and financial effectsof business combinations.
In December 2007, the FASB issued authoritative guidance that changes the accounting and reportingfor non-controlling interests that will become effective for us beginning October 1, 2009. The guidanceestablishes accounting and reporting standards for the ownership interests in subsidiaries held by partiesother than the parent, the amount of consolidated net income attributable to the parent and to thenoncontrolling interest, changes in the parent’s ownership interest and the valuation of retainednoncontrolling equity investments when a subsidiary is deconsolidated. It also establishes disclosurerequirements that clearly identify and distinguish between the interests of the parent and the interests of the
34

noncontrolling owners. Adoption of the guidance is not expected to have a material impact on ourconsolidated financial statements.
In June 2009, the FASB issued authoritative guidance on the consolidation of variable interest entities,which is effective for us beginning October 1, 2010. The new guidance requires revised evaluations ofwhether entities represent variable interest entities, ongoing assessments of control over such entities, andadditional disclosures for variable interests. We are evaluating the impact of this guidance on ourconsolidated financial statements.
Results of Operations
Definition of Terms
The following discussion of results includes information about our reportable segment sales andsegment (or business) operating profit (loss) before tax (“PBT”). Segment PBT is a non-GAAP financialmeasure and is not intended to replace income (loss) from operations before taxes, the most directlycomparable GAAP financial measure. In calculating segment PBT we exclude certain items, meaning itemsthat are significant and unusual or infrequent, as these amounts are not believed to reflect our trueunderlying business performance. In addition, in calculating segment PBT we include equity in net incomeof affiliated companies, royalties paid by equity affiliates and minority interest but exclude interest expense,foreign currency transaction gains and losses, interest income, dividend income and unallocated corporatecosts. Our Chief Operating Decision-Maker uses segment PBT to evaluate changes in the operating resultsof each segment and to allocate resources to the segments. We believe that this non-GAAP measure alsoassists our investors in evaluating the changes in our results and performance. A reconciliation of segmentPBT to income (loss) from operations is set forth within this section.
When discussing our business activities we use several terms. The term “operating expenses” meansfixed costs, including both fixed manufacturing costs, which includes utilities, and selling, technical andadministrative expenses. The term “product mix” refers to the various types and grades, or mix, of productssold in a particular Business or Segment during the period, and the positive or negative impact of that mixon the revenue or profitability of the Business or Segment. The term “LIFO benefit” or “LIFO impact”includes two factors: (i) the impact of current inventory costs being recognized immediately in cost of goodssold (“COGS”) under a last-in first-out method, compared to the older costs that would have been includedin COGS under a first-in first-out method (“COGS impact”); and (ii) the impact of reductions in inventoryquantities, causing historical inventory costs to flow through COGS (“liquidation impact”). The term“contract lag” refers to the time lag of the price adjustments in certain of our rubber blacks supply contractsto account for changes in feedstock costs and, in some cases, changes in other relevant costs. The term“unallocated corporate costs” refers to costs that are not controlled by the segments which primarily benefitcorporate interests.
Cabot is organized into four business segments: the Core Segment, which is further disaggregated forfinancial reporting purposes into the Rubber Blacks and the Supermetals Businesses, the PerformanceSegment, the New Business Segment and the Specialty Fluids Segment. Cabot is also organized foroperational purposes into three geographic regions: the Americas, which includes North and South America;Europe, Middle East and Africa; and Asia Pacific, including China. Discussions of all periods reflect thesestructures.
Our analysis of financial condition and operating results should be read with our ConsolidatedFinancial Statements and accompanying notes. Unless a calendar year is specified, all references to years inthis discussion are to our fiscal years ended September 30.
Drivers of Demand and Key Factors Affecting Profitability
Drivers of demand and key factors affecting our profitability differ by Segment. In our Core Segment,demand in the Rubber Blacks Business is influenced on a long term basis primarily by the number of tiresproduced resulting from vehicle miles driven and automotive builds. Over the past several years, the Rubber
35

Blacks Business’ results have been driven by increases or decreases in sales volumes, changes in raw materialcosts, our ability to obtain sales price increases for our products commensurate with increases in raw materialcosts, global and regional capacity utilization, fixed cost savings achieved through restructuring and other costsaving activities, our growth in emerging markets, capacity management and technology investment, includingthe impact of energy utilization technology at our manufacturing facilities. Historically, the timing of salesprice increases has been influenced by the time lag of pricing adjustments in our annual and long term supplycontracts that contain feedstock related pricing formulas. Since 2008, we have been actively renegotiatingthese contracts in an attempt to reduce this time delay and during 2009 substantially reduced the percentage ofvolume subject to this time lag. In the Supermetals Business, longer term demand for tantalum is largelydriven by the number of electronic devices produced using tantalum capacitors versus competing materials.Over the past several years capacitors have been made using higher efficiency powders that require a lowervolume of tantalum powder to achieve the same capacitance, thus reducing overall demand. Profitability inrecent years has largely been determined by volume changes associated with fluctuations in the electronicsmarket, our cost of ore, our ability to implement cost reduction initiatives, a highly competitive marketenvironment and our ability to increase prices to stabilize margins.
In our Performance Segment, longer term demand is driven primarily by the construction andinfrastructure, automotive, electronics and consumer products industries. In recent years, results in thePerformance Segment have been driven by growth in emerging markets, delivering differentiated productsthat drive enhanced performance in customers’ applications, our ability to obtain value pricing for thisdifferentiation, changes in raw material and energy costs and our ability to obtain sales price increases forour products commensurate with increases in these costs.
In our New Business Segment drivers of demand are specific to the various businesses. In the InkjetColorants Business, demand has been driven by a relative increase of printer platforms using our pigmentsat both new and existing customers and the broader adoption of inkjet technology in office and commercialprinting applications. Demand in our Aerogel Business has been driven by an increasing number of projectsusing our products in the oil and gas and daylighting markets. In recent years, demand in SuperiorMicroPowders has been driven principally by the number of security taggant applications incorporating ourunique and proprietary particles. Results in the New Business Segment have been influenced by our abilityto improve the pace of revenue generation in the Segment, by choosing the highest value opportunities andworking with lead users in the appropriate markets, and by ensuring that the overall cost platform of theSegment is sized appropriately for the opportunities.
In our Specialty Fluids Segment, demand for cesium formate is primarily driven by the level of drillingof high pressure oil and gas wells and by the petroleum industry’s acceptance of our product as a drillingand completion fluid for this application. Results in the Specialty Fluids Segment have been driven by thesize and type of jobs, the mix of rental versus sale revenue and our ability to expand the use of our fluidsinto regions outside of the North Sea.
Results for Fiscal 2009
During fiscal 2009, profitability decreased compared to fiscal 2008. The decrease was principallycaused by lower volumes from weak demand and destocking in the tire, automotive, construction andelectronics markets due to the global economic slowdown and credit crisis. Lower sales volumes resulted inexcess levels of inventory in our Rubber Blacks and Performance Products Businesses. These inventorieswere not sold until later in the year when finished product prices had been adjusted downward due to fallingraw material costs. The resulting unit margin compression reduced profitability. These factors were partiallyoffset by contract lag and LIFO benefits from lower carbon black feedstock costs and lower operatingexpenses from restructuring and cost saving actions implemented during fiscal 2009. We substantiallyimproved the performance of our New Business Segment during the year, increasing revenue, profitabilityand cash flow. Our cash and liquidity position remained solid during fiscal 2009 as we significantly reducedworking capital. In September 2009 we raised $300 million in long term public debt. A portion of the net
36

proceeds was used to pay down borrowings under our revolving credit facility, and the remainder will beused for general corporate purposes.
During the second half of fiscal 2009 we experienced sequential improvement in volumes andoperating results. The improvement was driven by a trend of increasing demand in our key end markets.Volume increases were particularly strong in emerging markets. Additionally, the unfavorable impact ofolder higher cost inventories on our results was significantly less in the second half of fiscal 2009 than itwas in the first half.
Outlook for Fiscal 2010
Although the improvement in volume we experienced from increasing demand in our key end marketsduring the second half of fiscal 2009 was positive, we remain cautiously optimistic about the speed of a fullvolume recovery to fiscal 2008 levels given the broader economic environment. The actions we have takenduring fiscal 2009, including our restructuring program, and investments in emerging market capacity andenergy recovery technology, position us well to benefit from a continued recovery. We anticipate buildingon the progress we made in the New Business Segment during fiscal 2009 with opportunities for additionalrevenue growth. Given our success over the past several years in the Specialty Fluids Segment at expandingthe use of our fluids outside of the North Sea, we are optimistic about our ability to continue this trend infiscal 2010.
Fiscal 2009 compared to Fiscal 2008 and Fiscal 2008 compared to Fiscal 2007—Consolidated
Net Sales and Gross ProfitYears Ended September 30
2009 2008 2007
(Dollars in millions)
Net Sales . . . . . . . . . . . . . . . . . . . . . . . . . . . . . . . . . . . . . . $2,243 $3,191 $2,616Gross Profit . . . . . . . . . . . . . . . . . . . . . . . . . . . . . . . . . . . . $ 227 $ 484 $ 505
The $948 million decrease in sales in fiscal 2009, when compared to fiscal 2008, was primarily due tolower volumes ($757 million) from weaker demand in our key end markets resulting from the globaleconomic downturn, lower prices ($119 million) driven by lower carbon black raw material costs and theunfavorable effect of foreign currency translation ($87 million). The $575 million increase in sales in fiscal2008, when compared to fiscal 2007, was primarily due to higher prices ($354 million) and the benefit offoreign currency translation ($215 million). These positive factors were partially offset by slightly lowervolumes ($12 million), principally associated with the expiration in fiscal 2007 of a fixed price, fixedvolume contract in the Supermetals Business that resulted in an unfavorable comparison for fiscal 2008.
Our gross profit was 10% of net sales in fiscal 2009, compared to 15% in fiscal 2008 and 19% in fiscal2007. Gross profit decreased by $257 million in fiscal 2009 when compared to fiscal 2008 principally dueto lower volumes from weaker demand in our end markets, charges recorded as cost of sales during fiscal2009 principally related to restructuring expenses and the unfavorable impact of older, high cost inventoriesin our carbon black related businesses. These factors were partially offset by contract lag and LIFO benefitsresulting from lower carbon black feedstock costs, reduced operating expenses from the implementation ofrestructuring and cost saving actions and improved performance in our New Business Segment.
Gross profit decreased by $21 million in fiscal 2008 relative to fiscal 2007 as increases in raw materialcosts outpaced sales price increases. This was partially offset by lower restructuring related chargesrecorded as cost of sales in fiscal 2008 when compared to fiscal 2007.
Selling and Administrative ExpensesYears Ended September 30
2009 2008 2007
(Dollars in millions)
Selling and Administrative Expenses . . . . . . . . . . . . . . . . $211 $246 $249
37

Selling and administrative expenses decreased by $35 million in fiscal 2009 when compared to fiscal2008. The decrease is principally due to restructuring and cost saving actions implemented during fiscal2009, partially offset by restructuring related charges. Selling and administrative expenses decreased by $3million in fiscal 2008 when compared to fiscal 2007. Charges related to the fiscal 2007 settlement of thefederal carbon black antitrust litigation did not reoccur in fiscal 2008, leading to a favorable comparison.This was partially offset by unfavorable foreign currency translation on our expenses in fiscal 2008.
Research and Technical ExpensesYears Ended September 30
2009 2008 2007
(Dollars in millions)
Research and Technical Expenses . . . . . . . . . . . . . . . . . . . . . . $71 $74 $69
In fiscal 2009, research and technical expenses decreased by $3 million when compared to fiscal 2008.The lower expenses were principally associated with cost reduction efforts and a greater focus on theefficiency of our new business development activities. Research and technical expenses increased by $5million in fiscal 2008 when compared to fiscal 2007, primarily due to increased spending in thePerformance Segment for the continued development of differentiated products.
Interest and Dividend IncomeYears Ended September 30
2009 2008 2007
(Dollars in millions)
Interest and Dividend Income . . . . . . . . . . . . . . . . . . . . . . . . . $3 $4 $10
Interest and dividend income decreased by $1 million in fiscal 2009 when compared to fiscal 2008 dueto lower interest rates in fiscal 2009. Interest and dividend income decreased by $6 million in fiscal 2008when compared to fiscal 2007 due principally to lower cash balances in fiscal 2008 available for interestearning investments.
Interest ExpenseYears Ended September 30
2009 2008 2007
(Dollars in millions)
Interest Expense . . . . . . . . . . . . . . . . . . . . . . . . . . . . . . . . . . . . $30 $38 $34
Interest expense decreased by $8 million in fiscal 2009 when compared to fiscal 2008. The decreasewas due to a lower level of borrowing, as we materially reduced our debt during most of fiscal 2009, andthe benefit of lower interest rates associated with our floating rate debt. Interest expense increased by$4 million in fiscal 2008 when compared to fiscal 2007. The increase was due principally to increases indebt levels.
Other (Charges) IncomeYears Ended September 30
2009 2008 2007
(Dollars in millions)
Other (Charges) Income . . . . . . . . . . . . . . . . . . . . . . . . . . . . . $(20) $(18) $5
Other charges in fiscal 2009 increased by $2 million when compared to fiscal 2008. The increase isprimarily attributable to an increased unfavorable impact from foreign currency transactions ($12 million),including from the write-down in value of Bolivars that had accumulated over several years in Venezuela to aparallel exchange rate ($6 million). These factors were partially offset by a reduced impact of fair market valuecurrency hedges ($7 million) and a lower impact of certain items recorded as other charges in our statement of
38

operations ($2 million). When comparing other charges of $18 million in fiscal 2008 to other income of $5million in fiscal 2007, the difference was principally attributable to foreign currency transaction gains or lossesin the comparative periods driven by fluctuations in foreign currencies against the U.S. dollar.
Benefit (Provision) for Income TaxesYears Ended September 30
2009 2008 2007
(Dollars in millions)
Benefit (Provision) for Income Taxes . . . . . . . . . . . . . . . . . . . $22 $(14) $(38)Tax Rate on Income from Continuing Operations . . . . . . . . . 22% 13% 23%
The benefit for income taxes was $22 million for fiscal 2009, resulting in an overall 22% tax rate. Werecorded benefits of approximately $9 million (9%) in the current year related to the settlement of varioustax audits, $2 million (2%) for the renewal of the U.S. research and experimentation credit, and $1 million(1%) for reinvestment credits earned. Excluding settlement and credit benefits, our tax rate would have beenapproximately 10% for fiscal 2009 primarily due to our geographic earnings mix.
The provision for income taxes was $14 million for fiscal 2008, resulting in an overall 13% tax rate onincome from continuing operations. Our tax rate varies from the U.S. statutory rate of 35% for a variety ofreasons. Specifically, our global tax structure provided us with a benefit of approximately $11 million(10%) from the U.S. statutory rate owing primarily to the recognition of income in jurisdictions with lowereffective tax rates. We also recorded benefits of $8 million (7%) in fiscal 2008 related to the settlement ofvarious tax audits, $3 million (3%) for reinvestment tax credits earned and $4 million (4%) for theutilization of a previously unrecognized capital loss carryforward, partially offset by a $2 million(2%) charge from miscellaneous adjustments. Excluding settlement and credit benefits, our tax rate wouldhave been approximately 23% for fiscal 2008.
The provision for income taxes was $38 million for fiscal 2007, resulting in an overall 23% tax rate onincome from continuing operations. Our global tax structure provided us with a benefit of approximately$16 million (10%) from the U.S. statutory rate owing primarily to the recognition of income in jurisdictionswith lower effective tax rates. In addition, we recorded benefits of approximately $4 million (2%) forresearch and experimentation credits and $3 million (2%) from various audit settlements, partially offset bya $2 million (1%) charge from miscellaneous adjustments. Excluding the $3 million in settlement taxbenefits, our tax rate would have been approximately 25% for fiscal 2007.
Our anticipated tax rate for fiscal 2010 is between 25% and 28%, absent tax settlements and otherchanges in tax estimates. The IRS is currently examining our 2005 and 2006 tax years. In addition, certainCabot subsidiaries are under audit in a number of jurisdictions outside of the U.S. It is possible that some ofthese audits will be resolved in fiscal 2010. We have filed our tax returns in accordance with the tax laws ineach jurisdiction and maintain tax reserves for differences between tax expense as finally determined andestimated tax expense for exposures that can be reasonably estimated.
Equity in Net Income of Affiliates and Minority Interest in Net Income, net of taxYears Ended September 30
2009 2008 2007
(Dollars in millions)
Equity in net income of affiliates . . . . . . . . . . . . . . . . . . . . . . $ 5 $ 8 $ 12Minority interest in net income, net of tax . . . . . . . . . . . . . . . (2) (20) (15)
Equity in net income of affiliates decreased by $3 million in fiscal 2009 when compared to fiscal 2008due to the impact of the global economic downturn, primarily on our affiliate in Mexico. Equity in netincome of affiliates decreased by $4 million in fiscal 2008 when compared to fiscal 2007 due to a $3 milliondecrease in our share of earnings from our affiliates in Venezuela and Mexico and a $1 million decreasefrom the April 1, 2008 consolidation of results of our equity affiliate in Malaysia.
39

Minority interest in net income, net of tax, is the means by which the minority shareholders’ portion ofthe income or loss in our consolidated joint ventures is removed from our consolidated statement ofoperations. In fiscal 2009 losses in our consolidated joint ventures in Malaysia and Indonesia offset earningsin our other consolidated joint ventures. Additionally, the earnings of our profitable ventures, particularly inChina were significantly lower than in fiscal 2008 explaining the $18 million reduction in minority interest.The increase in minority interest in net income, net of tax, of $5 million in fiscal 2008 when compared tofiscal 2007 was primarily due to increased earnings from our joint ventures in China.
Discontinued Operations
In fiscal 2009 we recorded a loss from our discontinued operations of less than $1 million ($0.01 perdiluted common share) for legal settlements in connection with our discontinued operations. In fiscal 2008we did not have material income or charges related to discontinued operations. In fiscal 2007, we recordedincome from discontinued operations of $2 million ($0.03 per diluted common share) which included taxbenefits of $3 million, partially offset by a charge of less than $1 million for legal settlements.
Net (Loss) Income
In fiscal 2009 we reported a net loss of $77 million ($1.23 per diluted common share). This comparedto net income for fiscal 2008 of $86 million ($1.34 per diluted common share) and net income of $129million ($1.90 per diluted common share) for fiscal 2007.
Fiscal 2009 compared to Fiscal 2008 and Fiscal 2008 compared to Fiscal 2007—By Business Segment
Total segment PBT, certain items, other unallocated items and (loss) income from continuingoperations before taxes for fiscal 2009, 2008 and 2007 are set forth in the table below. The details of certainitems and other unallocated items are shown below and in Note V of our Consolidated Financial Statements.
Years Ended September 30
2009 2008 2007
(Dollars in millions)
Total segment PBT . . . . . . . . . . . . . . . . . . . . . . . . . . . . . . . . . . . . $ 84 $215 $267
Certain items . . . . . . . . . . . . . . . . . . . . . . . . . . . . . . . . . . . . . . . . . (103) (13) (34)Other unallocated items . . . . . . . . . . . . . . . . . . . . . . . . . . . . . . . . (83) (90) (65)
(Loss) income from continuing operations before taxes . . . . . . . . $(102) $112 $168
In fiscal 2009, total segment PBT decreased by $131 million when compared to fiscal 2008. Thedecrease was principally due to lower volumes from weaker demand in our end markets ($283 million)resulting from the global economic downturn and the unfavorable impact of older, high cost inventories($62 million). These factors were partially offset by contract lag and LIFO benefits from lower carbon blackraw material costs relative to unfavorable impacts in fiscal 2008 (net $129 million benefit). Additionally,lower operating expenses ($44 million) from restructuring and cost saving actions and foreign currencytranslation ($39 million) benefited results in fiscal 2009 when compared to fiscal 2008. The LIFO benefitduring fiscal 2009 was a favorable $21 million, comprised of $15 million of COGS impact and $6 millionof liquidation impact. This is compared to $41 million of unfavorable LIFO impact during fiscal 2008,which was comprised of $55 million of unfavorable COGS impact partially offset by $14 million offavorable liquidation impact.
The $52 million decrease in total segment PBT in fiscal 2008 when compared to fiscal 2007 wasprimarily driven by the unfavorable impact of rising raw material costs that could not be fully offset byprice increases (net $55 million) and lower volumes ($11 million), principally in the Supermetals Businessfrom the expiration of a fixed price, fixed volume contract in fiscal 2007. These unfavorable factors werepartially offset by the benefit of foreign currency translation ($16 million).
40

Certain Items:
In recent years we have undertaken restructuring initiatives, which were recorded as certain items, andthus not included in segment results. During fiscal 2009 we implemented a restructuring of our operations,including closing four of our manufacturing operations and one regional office, mothballing assets atseveral additional sites and suspending mining of tantalum and spodumene at our mine in Manitoba,Canada. During the third quarter of fiscal 2008, we terminated work on under-performing projects in theNew Business Segment resulting in workforce reductions. In March 2008, we closed our carbon black plantin Waverly, West Virginia.
Details of the certain items for fiscal 2009, 2008 and 2007 are as follows:Years Ended September 30
2009 2008 2007
(Dollars in millions)
Environmental reserves and legal settlements . . . . . . . . . . . . . . $ (7) $ (3) $ (8)Write-down of impaired investments . . . . . . . . . . . . . . . . . . . . . (1) — —Reserve for respirator claims . . . . . . . . . . . . . . . . . . . . . . . . . . . — 2 —Carbon Black federal antitrust litigation . . . . . . . . . . . . . . . . . . . — — (10)Executive transition costs . . . . . . . . . . . . . . . . . . . . . . . . . . . . . . (4) (4) —Debt issuance costs . . . . . . . . . . . . . . . . . . . . . . . . . . . . . . . . . . . — (2) —Acquisition of in-process research and developmenttechnology . . . . . . . . . . . . . . . . . . . . . . . . . . . . . . . . . . . . . . . . — — (4)
Restructuring initiatives:2009 Global . . . . . . . . . . . . . . . . . . . . . . . . . . . . . . . . . . . . . . . (89) — —Other . . . . . . . . . . . . . . . . . . . . . . . . . . . . . . . . . . . . . . . . . . . . (2) (6) (12)
Total certain items . . . . . . . . . . . . . . . . . . . . . . . . . . . . . . . . . . $(103) $(13) $(34)
In fiscal 2009, $103 million of charges principally related to restructuring initiatives were recorded ascertain items. In fiscal 2008, $13 million of charges principally from restructuring activities, executivetransition costs and environmental reserves and legal settlements were recorded as certain items. In fiscal2007, certain items included $34 million of charges principally from restructuring activities, the settlementof the carbon black federal antitrust litigation and environmental reserves and other legal settlements.
Other unallocated items
Details of other unallocated items for fiscal 2009, 2008 and 2007 are as follows:Years Ended September 30
2009 2008 2007
(Dollars in millions)
Interest expense . . . . . . . . . . . . . . . . . . . . . . . . . . . . . . . . . . . . $(30) $(38) $(34)Equity in net income of affiliated companies . . . . . . . . . . . . . (5) (8) (12)Unallocated corporate costs . . . . . . . . . . . . . . . . . . . . . . . . . . . (28) (28) (36)Foreign currency transaction (losses) gains and other . . . . . . . (20) (16) 17
Total other unallocated items . . . . . . . . . . . . . . . . . . . . . . . $(83) $(90) $(65)
41
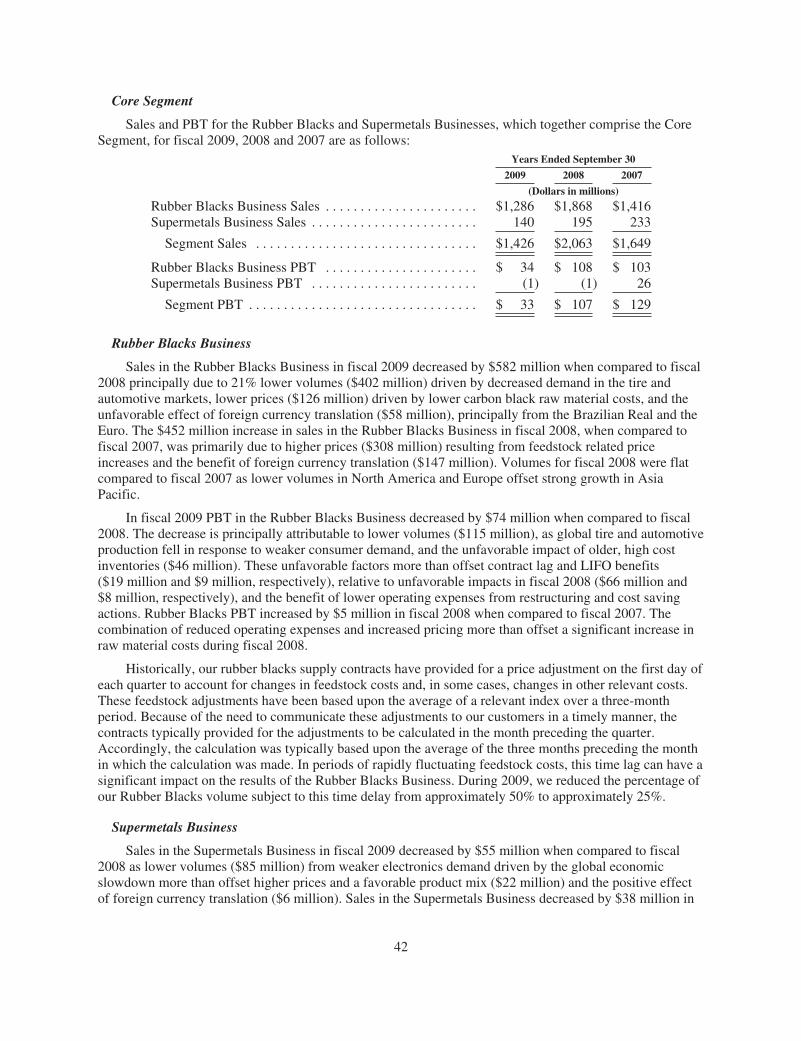
Core Segment
Sales and PBT for the Rubber Blacks and Supermetals Businesses, which together comprise the CoreSegment, for fiscal 2009, 2008 and 2007 are as follows:
Years Ended September 30
2009 2008 2007
(Dollars in millions)
Rubber Blacks Business Sales . . . . . . . . . . . . . . . . . . . . . . $1,286 $1,868 $1,416Supermetals Business Sales . . . . . . . . . . . . . . . . . . . . . . . . 140 195 233
Segment Sales . . . . . . . . . . . . . . . . . . . . . . . . . . . . . . . . $1,426 $2,063 $1,649
Rubber Blacks Business PBT . . . . . . . . . . . . . . . . . . . . . . $ 34 $ 108 $ 103Supermetals Business PBT . . . . . . . . . . . . . . . . . . . . . . . . (1) (1) 26
Segment PBT . . . . . . . . . . . . . . . . . . . . . . . . . . . . . . . . . $ 33 $ 107 $ 129
Rubber Blacks Business
Sales in the Rubber Blacks Business in fiscal 2009 decreased by $582 million when compared to fiscal2008 principally due to 21% lower volumes ($402 million) driven by decreased demand in the tire andautomotive markets, lower prices ($126 million) driven by lower carbon black raw material costs, and theunfavorable effect of foreign currency translation ($58 million), principally from the Brazilian Real and theEuro. The $452 million increase in sales in the Rubber Blacks Business in fiscal 2008, when compared tofiscal 2007, was primarily due to higher prices ($308 million) resulting from feedstock related priceincreases and the benefit of foreign currency translation ($147 million). Volumes for fiscal 2008 were flatcompared to fiscal 2007 as lower volumes in North America and Europe offset strong growth in AsiaPacific.
In fiscal 2009 PBT in the Rubber Blacks Business decreased by $74 million when compared to fiscal2008. The decrease is principally attributable to lower volumes ($115 million), as global tire and automotiveproduction fell in response to weaker consumer demand, and the unfavorable impact of older, high costinventories ($46 million). These unfavorable factors more than offset contract lag and LIFO benefits($19 million and $9 million, respectively), relative to unfavorable impacts in fiscal 2008 ($66 million and$8 million, respectively), and the benefit of lower operating expenses from restructuring and cost savingactions. Rubber Blacks PBT increased by $5 million in fiscal 2008 when compared to fiscal 2007. Thecombination of reduced operating expenses and increased pricing more than offset a significant increase inraw material costs during fiscal 2008.
Historically, our rubber blacks supply contracts have provided for a price adjustment on the first day ofeach quarter to account for changes in feedstock costs and, in some cases, changes in other relevant costs.These feedstock adjustments have been based upon the average of a relevant index over a three-monthperiod. Because of the need to communicate these adjustments to our customers in a timely manner, thecontracts typically provided for the adjustments to be calculated in the month preceding the quarter.Accordingly, the calculation was typically based upon the average of the three months preceding the monthin which the calculation was made. In periods of rapidly fluctuating feedstock costs, this time lag can have asignificant impact on the results of the Rubber Blacks Business. During 2009, we reduced the percentage ofour Rubber Blacks volume subject to this time delay from approximately 50% to approximately 25%.
Supermetals Business
Sales in the Supermetals Business in fiscal 2009 decreased by $55 million when compared to fiscal2008 as lower volumes ($85 million) from weaker electronics demand driven by the global economicslowdown more than offset higher prices and a favorable product mix ($22 million) and the positive effectof foreign currency translation ($6 million). Sales in the Supermetals Business decreased by $38 million in
42

fiscal 2008 compared to fiscal 2007. Over the past several years, sales and PBT in the Supermetals Businesshave been unfavorably impacted by the expiration of fixed volume, fixed price contracts, which led to lowerprices and volumes. The last of these contracts expired at the end of the first quarter of fiscal 2007 causingan unfavorable sales and PBT comparison for fiscal 2008. During fiscal 2008 lower tantalum volumesunfavorably affected sales by $31 million while lower tantalum pricing affected sales by $12 million whencompared to fiscal 2007. Partially offsetting these unfavorable factors was a $6 million benefit of foreigncurrency translation.
In fiscal 2009, PBT in the Supermetals Business was flat when compared to fiscal 2008. Substantiallylower volumes from weaker demand in the electronics industry ($31 million) were offset by higher prices($23 million), lower operating expenses from cost reduction actions ($5 million) and lower ore costs($3 million). During fiscal 2009, the Supermetals Business generated $39 million in cash, on a constantcurrency basis, principally from lower working capital. PBT in the Supermetals Business decreased by$27 million in fiscal 2008 compared to fiscal 2007. This comparison was heavily influenced by theexpiration of a fixed volume, fixed price customer supply contract in 2007. Lower volumes unfavorablyimpacted fiscal 2008 PBT by $14 million when compared to fiscal 2007, while the unfavorable impact oflower pricing was $12 million. These unfavorable factors were partially offset by lower operating expenses($6 million).
Performance Segment
Sales and PBT for the Performance Segment for fiscal 2009, 2008 and 2007 are as follows:Years Ended September 30
2009 2008 2007
(Dollars in millions)
Performance Products Business Sales . . . . . . . . . . . . . . . . . . . . $411 $646 $541Fumed Metal Oxides Business Sales . . . . . . . . . . . . . . . . . . . . . 210 287 270
Segment Sales . . . . . . . . . . . . . . . . . . . . . . . . . . . . . . . . . . . . . $621 $933 $811
Segment PBT . . . . . . . . . . . . . . . . . . . . . . . . . . . . . . . . . . . . . $ 40 $119 $148
For fiscal 2009, the $312 million decrease in sales in the Performance Segment when compared tofiscal 2008 was due principally to lower volumes ($258 million) from weaker demand in our key endmarkets, the unfavorable effect of foreign currency translation ($36 million) and lower prices from lowercarbon black feedstock costs ($22 million). Volumes in the Performance Products and Fumed Metal OxidesBusinesses decreased by 29% and 26%, respectively, in fiscal 2009 when compared to fiscal 2008. The$122 million increase in sales in fiscal 2008, when compared to fiscal 2007, was primarily due to the benefitof foreign currency translation ($59 million), higher prices ($53 million), due in part to rising carbon blackfeedstock costs, and increased volumes ($11 million). Volumes in the Performance Products and FumedMetal Oxides Businesses increased by 1% and 2%, respectively, in fiscal 2008 when compared to fiscal2007.
PBT in the Performance Segment decreased by $79 million in fiscal 2009 when compared to fiscal2008. The decrease was driven principally by lower volumes from weaker demand in our key end markets($127 million). The unfavorable impact of older, higher cost inventories ($16 million) was more than offsetby favorable commercial efforts leading to expanded unit margins. Additionally, a $10 million favorableLIFO impact, relative to a $17 million unfavorable impact in fiscal 2008, and lower operating expensesfrom restructuring and cost saving actions benefited results. Fiscal 2008 PBT was $29 million lower thanfiscal 2007 PBT driven principally by the impact of higher raw material costs that could not be fully offsetby increased pricing, a $17 million unfavorable LIFO impact relative to an unfavorable $1 million LIFOimpact in fiscal 2007, and continued investment in the development of differentiated products andgeographic expansion. These unfavorable factors were partially offset by higher volumes ($8 million) andthe benefit of foreign currency translation.
43

New Business Segment
Sales and PBT for the New Business Segment for fiscal 2009, 2008 and 2007 are as follows:Years Ended September 30
2009 2008 2007
(Dollars in millions)
Inkjet Colorants Business Sales . . . . . . . . . . . . . . . . . . . . . . . $ 46 $ 43 $ 46Aerogel Business Sales . . . . . . . . . . . . . . . . . . . . . . . . . . . . . . 15 10 3Superior MicroPowders Sales . . . . . . . . . . . . . . . . . . . . . . . . . 6 4 2
Segment Sales . . . . . . . . . . . . . . . . . . . . . . . . . . . . . . . . . . . $ 67 $ 57 $ 51
Segment PBT . . . . . . . . . . . . . . . . . . . . . . . . . . . . . . . . . . . $(10) $(35) $(34)
Sales in the New Business Segment increased by $10 million in fiscal 2009 when compared to fiscal2008 driven by increased revenue in all businesses as the Segment focused on improving its pace of revenuegeneration. Sales in the New Business Segment increased by $6 million in fiscal 2008 when compared tofiscal 2007 primarily due to higher revenues in the Aerogel Business and Superior MicroPowders. Theseincreases were partially offset by lower volumes and an unfavorable product mix in the Inkjet ColorantsBusiness.
Net losses in the New Business Segment for fiscal 2009 improved by $25 million from fiscal 2008.Results for fiscal 2009 benefited from increased sales revenue and lower operating expenses from theimproved discipline of our business development process, and the elimination of underperforming projectsduring fiscal 2008. In fiscal 2009 cash generation in the New Business Segment improved by $43 millionwhen compared to fiscal 2008. The loss in the New Business Segment increased slightly in fiscal 2008when compared to fiscal 2007. Higher volumes were offset by an unfavorable product mix and slightlyhigher fixed costs in the Aerogel Business as we fulfilled orders for the oil and gas and construction marketsegments.
In 2006, we entered into a cross license agreement with Aspen Aerogel, Inc. (“Aspen”) under whicheach party granted certain intellectual property rights to the other. In consideration for the license of certainpatents granted by Cabot we are entitled to payments totaling $38 million. We received $4 million, $4million and $2 million in fiscal 2009, 2008 and 2007, respectively, of installment payments which havebeen recorded in earnings. The remaining $27 million is payable in installments over the next four years,and will be recognized in earnings if and when collectibility is reasonably assured.
Specialty Fluids Segment
Sales and PBT for the Specialty Fluids Segment for fiscal 2009, 2008 and 2007 are as follows:Years Ended September 30
2009 2008 2007
(Dollars in millions)
Segment Sales . . . . . . . . . . . . . . . . . . . . . . . . . . . . . . . . . . . . . . . $59 $68 $58Segment PBT . . . . . . . . . . . . . . . . . . . . . . . . . . . . . . . . . . . . . . . $21 $24 $24
During fiscal 2009, sales in the Specialty Fluids Segment decreased by $9 million, when compared tofiscal 2008. The decrease was due principally to lower volumes partially offset by favorable pricing. Duringfiscal 2008, sales in the Specialty Fluids Segment increased by $10 million compared to fiscal 2007 drivenby an increase in the number of jobs using our fluid during the year.
In fiscal 2009 PBT in the Specialty Fluids Segment was $3 million lower than in fiscal 2008. Lowervolumes were partially offset by favorable pricing, and lower operating expenses. When comparing fiscal2008 to fiscal 2007, Segment PBT was flat.
44

We remain focused on expanding the use of our fluids outside of the North Sea as one of the elementsof continued growth in this Segment. During fiscal 2009, 29% of sales in the Specialty Fluids Segment weregenerated from regions outside of the North Sea, compared to 21% in fiscal 2008 and 17% in fiscal 2007.
Cash Flows and Liquidity
Overview
In September 2009 we issued $300 million of public notes that will mature on October 1, 2016. Thenet proceeds of this offering were $296 million after deducting discounts and issuance costs. As ofSeptember 30, 2009, we had cash or cash equivalents of $304 million, and current availability under ourrevolving and other credit facilities of approximately $460 million. Our cash worldwide was either investedin Money Market Funds or on deposit with our main cash management banks throughout the world. Werecorded a $6 million loss on our cash on deposit in Venezuela as a result of a write-down to a parallelexchange rate intended to approximate the rate at which we can repatriate this cash. Other than this loss, wehad no material losses on our cash and marketable securities investments during fiscal 2009.
Looking forward to 2010, we anticipate sufficient liquidity from cash on hand, cash flows and accessto existing credit facilities to meet our operational needs and financial obligations. Our revolving creditfacility expires in August 2010. Our intent is to replace this facility and the terms of any new line of creditcould differ from the terms of our current facility. Our liquidity derived from cash flows is, to a largedegree, predicated on our ability to collect our receivables in a timely manner, the cost of our raw materialsand our ability to manage inventory levels.
The following discussion of the changes in our cash balance refers to the various sections of ourConsolidated Statements of Cash Flows, which appears in Item 8 of this report.
Cash Flows from Operating Activities
Cash generated by operating activities, which consists of net income adjusted for the various non-cashitems included in income, changes in working capital and changes in certain other balance sheet accounts,totaled $399 million in fiscal 2009 compared to $124 million in fiscal 2008. Cash generated from operatingactivities in fiscal 2009 was due principally to a decrease in working capital of $356 million. Specifically,we had a $215 million decrease in accounts receivable primarily attributable to lower sales and improvedcollections as well as a decrease of $184 million in inventories as a result of lower feedstock costs, and ourefforts to reduce inventory quantities. Accounts payable and accrued liabilities decreased by $43 million asa result of the timing of raw material deliveries and payments. The positive cash flow for fiscal 2008 wasprimarily generated from net income of $86 million and depreciation and amortization of $163 million,partially offset by an increase in working capital of $142 million.
Restructurings
As of September 30, 2009, we had $21 million of total restructuring costs in accrued expenses in theconsolidated balance sheet related to our 2009 global restructuring plan. We made cash payments of $30million during fiscal 2009 related to all of our restructuring plans. We expect to make cash payments relatedto these restructuring activities of approximately $40 million in fiscal 2010, including the $21 millionalready accrued.
Environmental and Litigation
We have recorded a $6 million reserve on a discounted basis ($6 million on an undiscounted basis) asof September 30, 2009, for environmental remediation costs at various sites. These sites are primarilyassociated with businesses divested in prior years. We anticipate that the expenditures at these sites will be
45

made over a number of years, and will not be concentrated in any one year. Additionally, as ofSeptember 30, 2009 we have recorded a $13 million reserve on a discounted basis ($23 million on anundiscounted basis) for respirator claims. These expenditures will also be spread over a long period of time.We also have other litigation costs associated with lawsuits arising in the ordinary course of businessincluding claims filed against us in connection with certain discontinued operations.
The following table represents the estimated future undiscounted payments related to ourenvironmental and respirator reserves.
Future Payments by Fiscal Year
2010 2011 2012 2013 2014 Thereafter Total
(Dollars in millions)
Environmental . . . . . . . . . . . . . . . . . . . . . . . . . . . . . . . . . . . $2 $1 $— $— $1 $ 2 $ 6Respirator . . . . . . . . . . . . . . . . . . . . . . . . . . . . . . . . . . . . . . . 1 2 1 1 1 17 23
Total . . . . . . . . . . . . . . . . . . . . . . . . . . . . . . . . . . . . . . . . . $3 $3 $ 1 $ 1 $2 $19 $29
Employee Benefit Plans
We provide benefits under defined benefit plans for all U.S. and some foreign employees. As ofSeptember 30, 2009 we have a consolidated unfunded plan liability of $152 million, comprised of $68million for our pension benefit plans and $84 million for our postretirement benefit plans.
The $68 million of unfunded pension benefit plan liability is derived as follows at September 30, 2009:U.S. Foreign Total
(Dollar in millions)
Fair Value of Plan Assets . . . . . . . . . . . . . . . . . . . . . . . . . . . . . $104 $193 $297Benefit Obligation . . . . . . . . . . . . . . . . . . . . . . . . . . . . . . . . . . . 137 228 365
Unfunded Status . . . . . . . . . . . . . . . . . . . . . . . . . . . . . . . . . . . . $ 33 $ 35 $ 68
In fiscal 2009, we made cash contributions totaling approximately $5 million to our U.S. pensionbenefit plan and approximately $10 million to our foreign pension benefit plans. For fiscal 2010, wecurrently do not anticipate that we will be required to make a cash contribution to our U.S. pension plan,while we expect to make an approximate $8 million cash contribution to our foreign pension plans.
The $84 million of unfunded postretirement benefit plan liability is comprised of $69 million for ourU.S. and $15 million for our foreign postretirement benefit plans. These postretirement benefit plansprovide certain health care and life insurance benefits for retired employees. Typical of such plans, ourpostretirement plans are unfunded and therefore have no plan assets. We fund these plans as claims orinsurance premiums come due. In fiscal 2009, we paid postretirement benefits of $5 million under our U.S.plans and $1 million under our foreign plans and expect to make aggregate benefit payments ofapproximately $7 million under these plans in fiscal 2010.
Cash Flows from Investing Activities
Cash flows from investing activities consumed $105 million of cash in fiscal 2009 compared to$176 million in fiscal 2008, primarily as a result of reduced capital spending. Capital expenditures in fiscal2009 of $106 million included spending to complete the expansion of rubber blacks capacity at an existingfacility in China, new energy centers at other rubber blacks facilities and to acquire a new facility in Dubai forthe manufacture of masterbatch.
Capital expenditures in fiscal 2008 of $199 million included spending for rubber blacks capacityexpansion at an existing facility in China, residual spending on our new performance productsmanufacturing unit in China and new energy centers at other rubber blacks facilities. Capital spending in
46

fiscal 2008 was partially offset by proceeds of $18 million received from the sale of the land on which ourAltona, Australia carbon black plant was located and by $7 million related to the consolidation of one of ourequity affiliates.
During fiscal 2007, we purchased $95 million and received proceeds of $95 million from short terminvestments, which were mainly auction rate securities that generally reset every twenty-eight days eventhough their ultimate maturities were 20 years and longer. During fiscal 2008, we ceased investing inauction rate securities.
Capital expenditures for fiscal 2010 are expected to be approximately $150 million.
Cash Flows from Financing Activities
Financing activities consumed $127 million of cash in fiscal 2009 compared to cash provided byfinancing activities of $23 million in fiscal 2008. In both years, financing cash flows were primarily drivenby changes in debt levels and dividend payments.
Debt
The following table provides a summary of our outstanding long-term debt.September 30
2009 2008
(Dollars in millions)
Variable Rate Debt:$400 million Revolving Credit Facility:Yen drawdown, due 2010 . . . . . . . . . . . . . . . . . . . . . . . . . . . . . . . . . . . . . . . . . . . . . $ — $ 88US Dollar drawdowns, due 2010 . . . . . . . . . . . . . . . . . . . . . . . . . . . . . . . . . . . . . . . — 155
Chinese Renminbi Notes, due 2010 – 2012 . . . . . . . . . . . . . . . . . . . . . . . . . . . . . . . . . 23 40Derivative Instruments:Interest Rate Swaps—Fixed to variable . . . . . . . . . . . . . . . . . . . . . . . . . . . . . . . . . . 58 73Interest Rate Swaps—Variable to fixed . . . . . . . . . . . . . . . . . . . . . . . . . . . . . . . . . . — (88)
Total variable rate debt . . . . . . . . . . . . . . . . . . . . . . . . . . . . . . . . . . . . . . . . . . . . . . . 81 268Fixed Rate Debt:5% Notes due 2016, net of discount . . . . . . . . . . . . . . . . . . . . . . . . . . . . . . . . . . . . . . . $298 $ —Medium Term Notes, due 2011 – 2027, 7.26% to 8.28% . . . . . . . . . . . . . . . . . . . . . . . 98 128Eurobond, due 2013, 5.25%, net of discount . . . . . . . . . . . . . . . . . . . . . . . . . . . . . . . . 178 176Guarantee of ESOP Note, due 2013, 8.29% . . . . . . . . . . . . . . . . . . . . . . . . . . . . . . . . . 25 30Other, due 2027, 2% . . . . . . . . . . . . . . . . . . . . . . . . . . . . . . . . . . . . . . . . . . . . . . . . . . . 5 6Derivative Instruments:Interest Rate Swaps—Fixed to variable . . . . . . . . . . . . . . . . . . . . . . . . . . . . . . . . . . (58) (73)Interest Rate Swaps—Variable to fixed . . . . . . . . . . . . . . . . . . . . . . . . . . . . . . . . . . — 88
Total fixed rate debt . . . . . . . . . . . . . . . . . . . . . . . . . . . . . . . . . . . . . . . . . . . . . 546 355Capital lease, due 2010 – 2021 . . . . . . . . . . . . . . . . . . . . . . . . . . . . . . . . . . . . . . . . . . . 1 2
Total debt . . . . . . . . . . . . . . . . . . . . . . . . . . . . . . . . . . . . . . . . . . . . . . . . . . . . . 628 625Less current portion of long-term debt . . . . . . . . . . . . . . . . . . . . . . . . . . . . . . . . . . . . . (5) (39)
Total long-term debt . . . . . . . . . . . . . . . . . . . . . . . . . . . . . . . . . . . . . . . . . . . . . $623 $586
During fiscal 2009, we issued or borrowed $312 million, offset by debt repayments of $321 million,bringing our total debt to $628 million as of September 30, 2009. Our primary borrowing and repaymentrelated to the issuance of notes in September 2009 and the subsequent pay down of borrowings under ourrevolving credit facility. Our total debt, of which $5 million is current, matures at various times over the
47

next eighteen years. The weighted-average interest rate on our fixed rate long-term debt is 5.6%, includingthe effects of the interest rate swaps. The weighted-average interest rate on variable interest rate long-termdebt was 3.7% as of September 30, 2009, including the effects of the interest rate swaps.
Under our existing revolving credit facility we may borrow up to $400 million. The revolving line ofcredit permits us to borrow funds on an unsecured basis in multiple currencies that are freely tradable andconvertible into U.S. dollars at floating interest rates. The credit facility expires in August 2010. We intendto replace the revolving line of credit when it expires and the terms of any new line of credit could differfrom the terms of the current facility. As of September 30, 2009, we had no outstanding borrowings and$16 million in standby letters of credit issued but not drawn on under this agreement. The remainingavailability under the revolving credit facility as of September 30, 2009 was approximately $384 million.The credit facility contains various affirmative, negative and financial covenants which are customary forfinancings of this type, including financial covenants for maximum indebtedness and, under certainconditions, minimum cash flow requirements. As of September 30, 2009, we were in compliance with all ofthe covenants. In addition, we have $76 million in committed facilities available to us at various locationsthroughout the world.
At September 30, 2009, in addition to the $16 million of standby letters of credit issued under ourrevolving credit facility, we have provided standby letters of credit and bank guarantees totaling$25 million, which expire through fiscal 2011.
A downgrade of one level in our credit rating is not anticipated. Should it occur, however, it would notaffect our ability to borrow money under our existing revolving credit facility but would affect the cost ofthis borrowing and we would be subject to one additional cash flow financial covenant.
Share repurchases
During fiscal 2009, we did not repurchase any shares of our common stock on the open market. As ofSeptember 30, 2009, we have approximately 4.3 million shares remaining for repurchase under the Board ofDirectors’ share repurchase authorization. In fiscal 2009, however, we repurchased approximately 123,400shares from employees to satisfy tax withholding obligations at a cost of approximately $2 million. Duringfiscal 2008, we repurchased 935,400 shares of our common stock on the open market for a total cost of $28million. Additionally, we repurchased approximately 277,000 shares from employees who sold us shares tosatisfy tax withholding obligations at a cost of approximately $11 million.
Dividend payments
In each of fiscal 2009, 2008 and 2007, we paid cash dividends on our common stock of $0.72 per shareof common stock. These cash dividend payments totaled $48 million in fiscal 2009, $47 million in fiscal2008 and $48 million in fiscal 2007.
Off-balance sheet arrangements
We had no material transactions that meet the definition of an off-balance sheet arrangement.
48
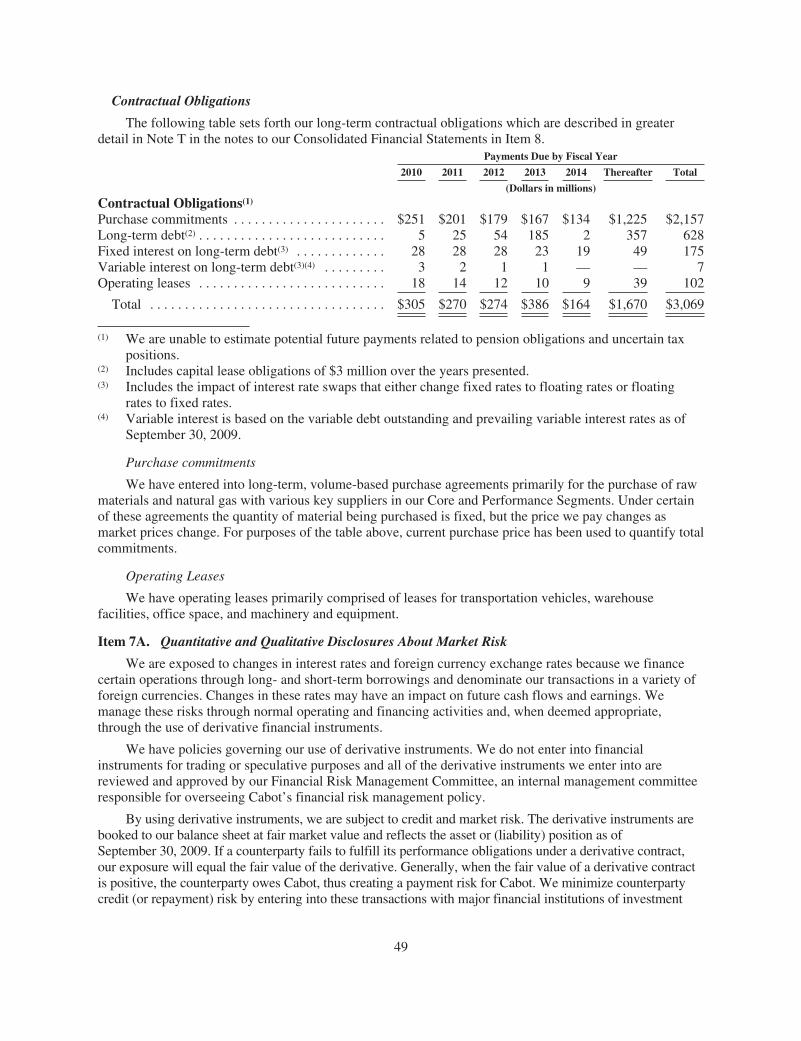
Contractual Obligations
The following table sets forth our long-term contractual obligations which are described in greaterdetail in Note T in the notes to our Consolidated Financial Statements in Item 8.
Payments Due by Fiscal Year
2010 2011 2012 2013 2014 Thereafter Total
(Dollars in millions)
Contractual Obligations(1)Purchase commitments . . . . . . . . . . . . . . . . . . . . . . $251 $201 $179 $167 $134 $1,225 $2,157Long-term debt(2) . . . . . . . . . . . . . . . . . . . . . . . . . . . 5 25 54 185 2 357 628Fixed interest on long-term debt(3) . . . . . . . . . . . . . 28 28 28 23 19 49 175Variable interest on long-term debt(3)(4) . . . . . . . . . 3 2 1 1 — — 7Operating leases . . . . . . . . . . . . . . . . . . . . . . . . . . . 18 14 12 10 9 39 102
Total . . . . . . . . . . . . . . . . . . . . . . . . . . . . . . . . . . $305 $270 $274 $386 $164 $1,670 $3,069
(1) We are unable to estimate potential future payments related to pension obligations and uncertain taxpositions.
(2) Includes capital lease obligations of $3 million over the years presented.(3) Includes the impact of interest rate swaps that either change fixed rates to floating rates or floating
rates to fixed rates.(4) Variable interest is based on the variable debt outstanding and prevailing variable interest rates as of
September 30, 2009.
Purchase commitments
We have entered into long-term, volume-based purchase agreements primarily for the purchase of rawmaterials and natural gas with various key suppliers in our Core and Performance Segments. Under certainof these agreements the quantity of material being purchased is fixed, but the price we pay changes asmarket prices change. For purposes of the table above, current purchase price has been used to quantify totalcommitments.
Operating Leases
We have operating leases primarily comprised of leases for transportation vehicles, warehousefacilities, office space, and machinery and equipment.
Item 7A. Quantitative and Qualitative Disclosures About Market Risk
We are exposed to changes in interest rates and foreign currency exchange rates because we financecertain operations through long- and short-term borrowings and denominate our transactions in a variety offoreign currencies. Changes in these rates may have an impact on future cash flows and earnings. Wemanage these risks through normal operating and financing activities and, when deemed appropriate,through the use of derivative financial instruments.
We have policies governing our use of derivative instruments. We do not enter into financialinstruments for trading or speculative purposes and all of the derivative instruments we enter into arereviewed and approved by our Financial Risk Management Committee, an internal management committeeresponsible for overseeing Cabot’s financial risk management policy.
By using derivative instruments, we are subject to credit and market risk. The derivative instruments arebooked to our balance sheet at fair market value and reflects the asset or (liability) position as ofSeptember 30, 2009. If a counterparty fails to fulfill its performance obligations under a derivative contract,our exposure will equal the fair value of the derivative. Generally, when the fair value of a derivative contractis positive, the counterparty owes Cabot, thus creating a payment risk for Cabot. We minimize counterpartycredit (or repayment) risk by entering into these transactions with major financial institutions of investment
49

grade credit rating. As of September 30, 2009, the counterparties that we have executed derivatives with wererated between AA and A, inclusive, by Standard and Poor’s. Our exposure to market risk is not hedged in amanner that completely eliminates the effects of changing market conditions on earnings or cash flow.
Interest Rate Risk
As of September 30, 2009, we had long-term debt, including the current portion, totaling $628 million,which has both variable and fixed interest rate components. We have entered into interest rate swaps as ahedge of the underlying debt instruments to effectively change the characteristics of the interest rate withoutchanging the debt instrument. For fixed rate debt, interest rate changes affect the fair market value, but donot impact earnings or cash flows. Conversely, for floating rate debt, interest rate changes generally do notaffect the fair market value, but do impact future earnings and cash flows, assuming other factors are heldconstant. We endeavor to maintain a certain fixed-to-floating interest rate mix on our long-term debt. Asmost of our long-term debt was issued at fixed rates, we use interest rate swaps to achieve the desiredfixed-to-floating interest rate mix.
The table below summarizes the principal terms of our interest rate swap transactions, including thenotional amount of the swap, the interest rate payment we receive from and pay to our swap counterparty,the term of the transaction, and its fair market value at September 30, 2009.
Description Notional Amount Receive PayFiscal YearEntered Into
Maturity(Fiscal Year)
Fair MarketValue at
September 30,2009
(USD)Interest RateSwaps—Fixedto Variable
USD 35 million 5.25% Fixed US-6 monthLIBOR + 0.62%
2003 2013 2 million
USD 8 million 8.28% Fixed US-6 monthLIBOR + 3.14%
2007 2012 1 million
USD 15 million 7.26% Fixed US-3 monthLIBOR +6.38%
2009 2011 —
Foreign Currency Risk
Our international operations are subject to certain risks, including currency exchange rate fluctuationsand government actions. Currently, we have issued debt denominated in U.S. dollars and then entered intocross currency swaps that exchange our dollar principal and interest payments into a currency where weexpect long-term, stable cash receipts. The following table summarizes the principal terms of our long-termforeign currency swap transactions, including the notional amount of the swap, the interest rate payment wereceive from and pay to our swap counterparty, the term of the transaction and its fair market value atSeptember 30, 2009.
Description Notional Amount Receive PayFiscal YearEntered Into
Maturity(Fiscal Year)
Fair MarketValue at
September 30,2009
(USD)Cross Currency
SwapsUSD 20 millionswapped to
JPY 2.5 billion
US-3 monthLIBOR
JPY-3 monthLIBOR + 0.12%
2002 2010 (7 million)
USD 140 millionswapped to
EUR 124 million
5.25% Fixed 5.1% Fixed 2003 2013 (47 million)
USD 35 millionswapped to
EUR 31 million
US-6 monthLIBOR
EUR-6 monthLIBOR
2003 2013 (11 million)
50

Foreign currency exposures also relate to current assets and current liabilities denominated in foreigncurrencies other than the functional currency of a given subsidiary as well as the risk that currencyfluctuations could affect the dollar value of future cash flows generated in foreign currencies. Accordingly,we use short-term forward contracts to minimize the exposure to foreign currency risk. These forwardcontracts typically have a duration of 30 days. In fiscal 2009 and fiscal 2008, none of our forward contractswere designated hedging instruments. As of September 30, 2009, we had $60 million in net notional foreigncurrency forward contracts, which were denominated in Japanese yen, British pound sterling, Canadiandollar, Australian dollar and Euros. These forwards had a fair value of less than $1 million as ofSeptember 30, 2009.
In certain situations where we have a long-term commitment denominated in a foreign currency wemay enter into appropriate financial instruments in accordance with our risk management policy to hedgefuture cash flow exposures.
Commodity Risk
For the calendar year 2009, certain of our carbon black plants in Europe were subject to mandatorygreenhouse gas emission (“GHG”) trading schemes. Our objective is to ensure compliance with theEuropean Union (“EU”) Emission Trading Scheme, which is based upon a Cap-and-Trade system thatestablishes a maximum allowable emission credit for each ton of CO2 emitted. European Union Allowances(“EUAs”) originate from the individual EU state’s country allocation process and are issued by thatcountry’s government. A company that has an excess of EUAs based on the CO2 emissions limits may sellEUAs in the Emission Trading Scheme and if they have a shortfall, a company can buy EUAs or CertifiedEmission Reduction (“CER”) units to comply.
In order to limit the variability in cost to our European operations, we committed to current prices byentering into agreements which run from fiscal years 2010 to 2013 to purchase CERs and to sell EUAs. Thefollowing table provides details of the derivatives held as of September 30, 2009 used to managecommodity risk.
DescriptionNet NotionalAmount
Net Buyer/Net Seller
Fiscal YearEntered Into
Maturity(Fiscal Year)
Fair MarketValue at
September 30,2009
(USD)
EUAs EUR 2 million Net Seller 2008 & 2009 2010-2013 3 millionCERs EUR 2 million Net Buyer 2008 & 2009 2010-2013 (2 million)
51

Item 8. Financial Statements and Supplementary Data
INDEX TO FINANCIAL STATEMENTSDescription Page
(1) Consolidated Statements of Operations for each of the fiscal years ended September 30, 2009,2008 and 2007 . . . . . . . . . . . . . . . . . . . . . . . . . . . . . . . . . . . . . . . . . . . . . . . . . . . . . . . . . . . . . . . 53
(2) Consolidated Balance Sheets at September 30, 2009 and 2008 . . . . . . . . . . . . . . . . . . . . . . . . . . . 54(3) Consolidated Statements of Cash Flows for each of the fiscal years ended September 30, 2009,
2008 and 2007 . . . . . . . . . . . . . . . . . . . . . . . . . . . . . . . . . . . . . . . . . . . . . . . . . . . . . . . . . . . . . . . 56(4) Consolidated Statements of Changes in Stockholders’ Equity for each of the fiscal years ended
September 30, 2009, 2008 and 2007 . . . . . . . . . . . . . . . . . . . . . . . . . . . . . . . . . . . . . . . . . . . . . . 57(5) Notes to Consolidated Financial Statements . . . . . . . . . . . . . . . . . . . . . . . . . . . . . . . . . . . . . . . . . . 60(6) Report of Independent Registered Public Accounting Firm . . . . . . . . . . . . . . . . . . . . . . . . . . . . . . 107
52

CABOT CORPORATION
CONSOLIDATED STATEMENTS OF OPERATIONSYears Ended September 30
2009 2008 2007
(In millions, exceptper share amounts)
Net sales and other operating revenues . . . . . . . . . . . . . . . . . . . . . . . . . . . . . . . . . $2,243 $3,191 $2,616Cost of sales . . . . . . . . . . . . . . . . . . . . . . . . . . . . . . . . . . . . . . . . . . . . . . . . . . . . . . 2,016 2,707 2,111
Gross profit . . . . . . . . . . . . . . . . . . . . . . . . . . . . . . . . . . . . . . . . . . . . . . . . . . . . . 227 484 505Selling and administrative expenses . . . . . . . . . . . . . . . . . . . . . . . . . . . . . . . . . . . 211 246 249Research and technical expenses . . . . . . . . . . . . . . . . . . . . . . . . . . . . . . . . . . . . . . 71 74 69
(Loss) income from operations . . . . . . . . . . . . . . . . . . . . . . . . . . . . . . . . . . . . . (55) 164 187Interest and dividend income . . . . . . . . . . . . . . . . . . . . . . . . . . . . . . . . . . . . . . . . . 3 4 10Interest expense . . . . . . . . . . . . . . . . . . . . . . . . . . . . . . . . . . . . . . . . . . . . . . . . . . . (30) (38) (34)Other (charges) income . . . . . . . . . . . . . . . . . . . . . . . . . . . . . . . . . . . . . . . . . . . . . (20) (18) 5
(Loss) income from continuing operations before taxes, equity in net incomeof affiliated companies and minority interest . . . . . . . . . . . . . . . . . . . . . . . . . (102) 112 168
Benefit (provision) for income taxes . . . . . . . . . . . . . . . . . . . . . . . . . . . . . . . . . . . 22 (14) (38)Equity in net income of affiliated companies, net of tax of $1, $3 and $2 . . . . . . 5 8 12Minority interest in net income, net of tax of $1, $4 and $6 . . . . . . . . . . . . . . . . . (2) (20) (15)
(Loss) income from continuing operations . . . . . . . . . . . . . . . . . . . . . . . . . . . . (77) 86 127Income from discontinued businesses, net of tax . . . . . . . . . . . . . . . . . . . . . . . . . . — — 2
Net (loss) income . . . . . . . . . . . . . . . . . . . . . . . . . . . . . . . . . . . . . . . . . . . . . . . . (77) 86 129Dividends on preferred stock, net of tax of none, none and $1 . . . . . . . . . . . . . . . — — (1)
(Loss) income available to common shares . . . . . . . . . . . . . . . . . . . . . . . . . . . . $ (77) $ 86 $ 128
Weighted-average common shares outstanding, in millions:Basic . . . . . . . . . . . . . . . . . . . . . . . . . . . . . . . . . . . . . . . . . . . . . . . . . . . . . . . . . . 63 63 62
Diluted . . . . . . . . . . . . . . . . . . . . . . . . . . . . . . . . . . . . . . . . . . . . . . . . . . . . . . . . 63 64 68
(Loss) income per common share:Basic:(Loss) income from continuing operations . . . . . . . . . . . . . . . . . . . . . . . . . . $ (1.22) $ 1.37 $ 2.03(Loss) income from discontinued businesses . . . . . . . . . . . . . . . . . . . . . . . . . (0.01) — 0.03
Net (loss) income per share . . . . . . . . . . . . . . . . . . . . . . . . . . . . . . . . . . . . $ (1.23) $ 1.37 $ 2.06
Diluted:(Loss) income from continuing operations . . . . . . . . . . . . . . . . . . . . . . . . . . $ (1.22) $ 1.34 $ 1.87(Loss) income from discontinued businesses . . . . . . . . . . . . . . . . . . . . . . . . . (0.01) — 0.03
Net (loss) income per share . . . . . . . . . . . . . . . . . . . . . . . . . . . . . . . . . . . . $ (1.23) $ 1.34 $ 1.90
The accompanying notes are an integral part of these consolidated financial statements.
53

CABOT CORPORATION
CONSOLIDATED BALANCE SHEETS
ASSETSSeptember 30
2009 2008
(In millions, exceptshare and per share amounts)
Current assets:Cash and cash equivalents . . . . . . . . . . . . . . . . . . . . . . . . . . . . . . . . . . . . . . . . $ 304 $ 129Short-term marketable securities investments . . . . . . . . . . . . . . . . . . . . . . . . . 1 1Accounts and notes receivable, net of reserve for doubtful accounts of $6and $5 . . . . . . . . . . . . . . . . . . . . . . . . . . . . . . . . . . . . . . . . . . . . . . . . . . . . . . 452 646
Inventories . . . . . . . . . . . . . . . . . . . . . . . . . . . . . . . . . . . . . . . . . . . . . . . . . . . . . 358 523Prepaid expenses and other current assets . . . . . . . . . . . . . . . . . . . . . . . . . . . . 53 72Deferred income taxes . . . . . . . . . . . . . . . . . . . . . . . . . . . . . . . . . . . . . . . . . . . 32 30Assets held for sale . . . . . . . . . . . . . . . . . . . . . . . . . . . . . . . . . . . . . . . . . . . . . . — 7
Total current assets . . . . . . . . . . . . . . . . . . . . . . . . . . . . . . . . . . . . . . . . . . . . 1,200 1,408
Investments:Equity affiliates . . . . . . . . . . . . . . . . . . . . . . . . . . . . . . . . . . . . . . . . . . . . . . . . . 60 53Long-term marketable securities and cost investments . . . . . . . . . . . . . . . . . . 1 1
Total investments . . . . . . . . . . . . . . . . . . . . . . . . . . . . . . . . . . . . . . . . . . . . . 61 54
Property, plant and equipment . . . . . . . . . . . . . . . . . . . . . . . . . . . . . . . . . . . . . . . 3,000 2,921Accumulated depreciation and amortization . . . . . . . . . . . . . . . . . . . . . . . . . . . . . (1,988) (1,839)
Net property, plant and equipment . . . . . . . . . . . . . . . . . . . . . . . . . . . . . . . . . . 1,012 1,082
Goodwill . . . . . . . . . . . . . . . . . . . . . . . . . . . . . . . . . . . . . . . . . . . . . . . . . . . . . . 37 34Intangible assets, net of accumulated amortization of $11 and $10 . . . . . . . . . 2 3Assets held for rent . . . . . . . . . . . . . . . . . . . . . . . . . . . . . . . . . . . . . . . . . . . . . . 43 45Deferred income taxes . . . . . . . . . . . . . . . . . . . . . . . . . . . . . . . . . . . . . . . . . . . 235 173Other assets . . . . . . . . . . . . . . . . . . . . . . . . . . . . . . . . . . . . . . . . . . . . . . . . . . . . 86 59
Total assets . . . . . . . . . . . . . . . . . . . . . . . . . . . . . . . . . . . . . . . . . . . . . . . . . . . . . . $ 2,676 $ 2,858
The accompanying notes are an integral part of these consolidated financial statements.
54

CABOT CORPORATION
CONSOLIDATED BALANCE SHEETS
LIABILITIES AND STOCKHOLDERS’ EQUITYSeptember 30
2009 2008
(In millions, exceptshare and per share amounts)
Current liabilities:Notes payable to banks . . . . . . . . . . . . . . . . . . . . . . . . . . . . . . . . . . . . . . . . . . . . $ 29 $ 91Accounts payable and accrued liabilities . . . . . . . . . . . . . . . . . . . . . . . . . . . . . . . 407 426Income taxes payable . . . . . . . . . . . . . . . . . . . . . . . . . . . . . . . . . . . . . . . . . . . . . . 31 38Deferred income taxes . . . . . . . . . . . . . . . . . . . . . . . . . . . . . . . . . . . . . . . . . . . . . 5 7Current portion of long-term debt . . . . . . . . . . . . . . . . . . . . . . . . . . . . . . . . . . . . 5 39
Total current liabilities . . . . . . . . . . . . . . . . . . . . . . . . . . . . . . . . . . . . . . . . . . . 477 601
Long-term debt . . . . . . . . . . . . . . . . . . . . . . . . . . . . . . . . . . . . . . . . . . . . . . . . . . . . . 623 586Deferred income taxes . . . . . . . . . . . . . . . . . . . . . . . . . . . . . . . . . . . . . . . . . . . . . . . 11 18Other liabilities . . . . . . . . . . . . . . . . . . . . . . . . . . . . . . . . . . . . . . . . . . . . . . . . . . . . . 328 294Commitments and contingencies (Note T)Minority interest . . . . . . . . . . . . . . . . . . . . . . . . . . . . . . . . . . . . . . . . . . . . . . . . . . . . 103 110Stockholders’ equity:Preferred stock:Authorized: 2,000,000 shares of $1 par valueIssued and outstanding: None and none . . . . . . . . . . . . . . . . . . . . . . . . . . . . . . . . — —
Common stock:Authorized: 200,000,000 shares of $1 par valueIssued: 65,401,485 and 65,403,100 shares . . . . . . . . . . . . . . . . . . . . . . . . . . . . . 65 65Outstanding: 65,309,155 and 65,277,715 sharesLess cost of 92,330 and 125,385 shares of common treasury stock . . . . . . . . . . (2) (4)
Additional paid-in capital . . . . . . . . . . . . . . . . . . . . . . . . . . . . . . . . . . . . . . . . . . . . . 18 21Retained earnings . . . . . . . . . . . . . . . . . . . . . . . . . . . . . . . . . . . . . . . . . . . . . . . . . . . 1,018 1,143Deferred employee benefits . . . . . . . . . . . . . . . . . . . . . . . . . . . . . . . . . . . . . . . . . . . (25) (30)Notes receivable for restricted stock . . . . . . . . . . . . . . . . . . . . . . . . . . . . . . . . . . . . — (21)Accumulated other comprehensive income . . . . . . . . . . . . . . . . . . . . . . . . . . . . . . . 60 75
Total stockholders’ equity . . . . . . . . . . . . . . . . . . . . . . . . . . . . . . . . . . . . . . . . 1,134 1,249
Total liabilities and stockholders’ equity . . . . . . . . . . . . . . . . . . . . . . . . . . . . . . . . . $2,676 $2,858
The accompanying notes are an integral part of these consolidated financial statements.
55

CABOT CORPORATION
CONSOLIDATED STATEMENTS OF CASH FLOWSYears Ended September 30
2009 2008 2007
(In millions)Cash Flows from Operating Activities:Net (loss) income . . . . . . . . . . . . . . . . . . . . . . . . . . . . . . . . . . . . . . . . . . . . . . . . . . . . . . . . . . . $ (77) $ 86 $ 129Adjustments to reconcile net (loss) income to cash provided by operating activities:Depreciation and amortization . . . . . . . . . . . . . . . . . . . . . . . . . . . . . . . . . . . . . . . . . . . . . . . 169 163 149Deferred tax (provision) . . . . . . . . . . . . . . . . . . . . . . . . . . . . . . . . . . . . . . . . . . . . . . . . . . . . (51) (30) (27)Loss (gain) on sale of property, plant and equipment . . . . . . . . . . . . . . . . . . . . . . . . . . . . . . 11 (12) —Equity in net income of affiliated companies . . . . . . . . . . . . . . . . . . . . . . . . . . . . . . . . . . . . (5) (8) (12)Minority interest in net income . . . . . . . . . . . . . . . . . . . . . . . . . . . . . . . . . . . . . . . . . . . . . . . 2 20 15Non-cash compensation . . . . . . . . . . . . . . . . . . . . . . . . . . . . . . . . . . . . . . . . . . . . . . . . . . . . 27 30 23Expense of acquired in-process research and development technology . . . . . . . . . . . . . . . . — — 4Other non-cash charges (income), net . . . . . . . . . . . . . . . . . . . . . . . . . . . . . . . . . . . . . . . . . . 2 (1) 2Changes in assets and liabilities, net of the effect of consolidation of equity affiliate:Accounts and notes receivable . . . . . . . . . . . . . . . . . . . . . . . . . . . . . . . . . . . . . . . . . . . . . 215 (63) (6)Inventories . . . . . . . . . . . . . . . . . . . . . . . . . . . . . . . . . . . . . . . . . . . . . . . . . . . . . . . . . . . . . 184 (68) (8)Prepaid expenses and other current assets . . . . . . . . . . . . . . . . . . . . . . . . . . . . . . . . . . . . . 1 29 16Accounts payable and accrued liabilities . . . . . . . . . . . . . . . . . . . . . . . . . . . . . . . . . . . . . (43) (11) 20Income taxes payable . . . . . . . . . . . . . . . . . . . . . . . . . . . . . . . . . . . . . . . . . . . . . . . . . . . . (15) 8 2Other liabilities . . . . . . . . . . . . . . . . . . . . . . . . . . . . . . . . . . . . . . . . . . . . . . . . . . . . . . . . . (26) (22) (11)Cash dividends received from equity affiliates . . . . . . . . . . . . . . . . . . . . . . . . . . . . . . . . . 1 2 7Other . . . . . . . . . . . . . . . . . . . . . . . . . . . . . . . . . . . . . . . . . . . . . . . . . . . . . . . . . . . . . . . . . 4 1 6
Cash provided by operating activities . . . . . . . . . . . . . . . . . . . . . . . . . . . . . . . . . . . . . . 399 124 309
Cash Flows from Investing Activities:Additions to property, plant and equipment . . . . . . . . . . . . . . . . . . . . . . . . . . . . . . . . . . . . . . . (106) (199) (141)Acquisition of interest in equity affiliate . . . . . . . . . . . . . . . . . . . . . . . . . . . . . . . . . . . . . . . . . . (3) 7 —Acquisition of in-process research and development technology . . . . . . . . . . . . . . . . . . . . . . . — — (4)Proceeds from sales of property, plant and equipment . . . . . . . . . . . . . . . . . . . . . . . . . . . . . . . 2 18 5Decrease (increase) in assets held for rent . . . . . . . . . . . . . . . . . . . . . . . . . . . . . . . . . . . . . . . . 2 (2) (3)Purchase of marketable securities investments . . . . . . . . . . . . . . . . . . . . . . . . . . . . . . . . . . . . . — — (95)Proceeds from maturity of marketable securities investments . . . . . . . . . . . . . . . . . . . . . . . . . — — 95
Cash used in investing activities . . . . . . . . . . . . . . . . . . . . . . . . . . . . . . . . . . . . . . . . . . (105) (176) (143)
Cash Flows from Financing Activities:Borrowings under financing arrangements . . . . . . . . . . . . . . . . . . . . . . . . . . . . . . . . . . . . . . . . 25 126 70Repayments under financing arrangements . . . . . . . . . . . . . . . . . . . . . . . . . . . . . . . . . . . . . . . (69) (130) (55)Proceeds from long-term debt, net of issuance costs . . . . . . . . . . . . . . . . . . . . . . . . . . . . . . . . 312 110 72Repayments of long-term debt . . . . . . . . . . . . . . . . . . . . . . . . . . . . . . . . . . . . . . . . . . . . . . . . . (321) (13) (47)(Decrease) increase in notes payable to banks, net . . . . . . . . . . . . . . . . . . . . . . . . . . . . . . . . . . (16) 14 (8)Repayments of debt related to Cabot Japan . . . . . . . . . . . . . . . . . . . . . . . . . . . . . . . . . . . . . . . — — (1)Proceeds from cash contributions received from minority interest stockholders . . . . . . . . . . . — 8 —Proceeds from sales of common stock . . . . . . . . . . . . . . . . . . . . . . . . . . . . . . . . . . . . . . . . . . . — 1 9Purchases of common stock . . . . . . . . . . . . . . . . . . . . . . . . . . . . . . . . . . . . . . . . . . . . . . . . . . . (2) (35) (202)Cash dividends paid to minority interest stockholders . . . . . . . . . . . . . . . . . . . . . . . . . . . . . . . (9) (18) (12)Cash dividends paid to stockholders . . . . . . . . . . . . . . . . . . . . . . . . . . . . . . . . . . . . . . . . . . . . . (48) (47) (48)Proceeds from restricted stock loan repayments . . . . . . . . . . . . . . . . . . . . . . . . . . . . . . . . . . . . 1 7 11
Cash (used in) provided by financing activities . . . . . . . . . . . . . . . . . . . . . . . . . . . . . . (127) 23 (211)
Effect of exchange rate changes on cash . . . . . . . . . . . . . . . . . . . . . . . . . . . . . . . . . . . . . . . . . . . . 8 4 10
Increase (decrease) in cash and cash equivalents . . . . . . . . . . . . . . . . . . . . . . . . . . . . . . . . . . . . . 175 (25) (35)Cash and cash equivalents at beginning of year . . . . . . . . . . . . . . . . . . . . . . . . . . . . . . . . . . . . . . 129 154 189
Cash and cash equivalents at end of year . . . . . . . . . . . . . . . . . . . . . . . . . . . . . . . . . . . . . . . . . . . $ 304 $ 129 $ 154
Income taxes paid . . . . . . . . . . . . . . . . . . . . . . . . . . . . . . . . . . . . . . . . . . . . . . . . . . . . . . . . . . . . . $ 30 $ 41 $ 39Interest paid . . . . . . . . . . . . . . . . . . . . . . . . . . . . . . . . . . . . . . . . . . . . . . . . . . . . . . . . . . . . . . . . . . 24 34 30Restricted stock issued for notes receivable, net of forfeitures . . . . . . . . . . . . . . . . . . . . . . . . . . . — 8 10
The accompanying notes are an integral part of these consolidated financial statements.
56

CABOTCORPORATIO
N
CONSO
LID
ATEDST
ATEMENTSOFCHANGESIN
STOCKHOLDERS’
EQUIT
Y
Years
endedSeptem
ber30
(Inmillions,exceptshares
inthou
sand
s)Preferred
Stock,
netof
Treasury
Stock
Com
mon
Stock,
netof
Treasury
Stock
Add
itiona
lPaid-In
Cap
ital
Retained
Earning
s
Deferred
Employee
Benefits
Notes
Receivable
for
Restricted
Stock
Accum
ulated
Other
Com
prehensive
Income
Total
Stockh
olders’
Equ
ity
Total
Com
prehensive
Income
Shares
Cost
Shares
Cost
2007
Balance
atSeptem
ber30,2006................
39$18
63,433
$59
$7
$1,160
$(38)
$(20)
$10
$1,196
Netincome
...............................
129
$129
Foreigncurrency
translationadjustment,neto
ftaxof
$12......................
.......
5151
Changein
unrealized
gain
onderivativ
einstruments,netof
taxof
$4..............
88
Minim
umpensionliabilityadjustment,neto
ftaxof
$3..............................
66
Other
comprehensive
income
.................
65
Com
prehensive
income......................
194
$194
Com
mon
dividendspaid
.....................
(47)
(47)
Issuance
ofstockunderem
ployee
compensation
plans,neto
fforfeitures....................
1,041
126
(11)
16Amortiz
ationof
share-basedcompensation
......
2323
Tax
benefito
nvestingof
restricted
stock........
66
Purchase
andretirem
ento
fcommon
andtreasury
stock
............................
......
(4,864)
(5)
(96)
(101)
(202)
Preferredstockconversion
...................
(39)
(18)
5,670
534
(21)
—Preferreddividendspaid
toEmployee
Stock
OwnershipPlan,netof
taxbenefito
f$1
.......
(1)
(1)
Principalp
aymentb
yEmployee
StockOwnership
Plan
underguaranteed
loan
.................
44
Notes
receivableforrestricted
stock—
paym
ents
andforfeitures...........................
1212
Effecto
ftheadoptio
nof
FAS158,neto
ftax
of$1
...................................
(7)
(7)
Balance
atSeptem
ber30,2007................
—$—
65,280
$60
$—
$1,119
$(34)
$(19)
$68
$1,194
The
accompanyingnotesarean
integral
partof
theseconsolidated
financialstatements.
57

CABOTCORPORATIO
N
CONSO
LID
ATEDST
ATEMENTSOFCHANGESIN
STOCKHOLDERS’
EQUIT
Y
Years
endedSeptem
ber30
(Inmillions,exceptshares
inthou
sand
s)Preferred
Stock,
netof
Treasury
Stock
Com
mon
Stock,
netof
Treasury
Stock
Add
itiona
lPaid-In
Cap
ital
Retained
Earning
s
Deferred
Employee
Benefits
Notes
Receivable
for
Restricted
Stock
Accum
ulated
Other
Com
prehensive
Income
Total
Stockh
olders’
Equ
ity
Total
Com
prehensive
Income
Shares
Cost
Shares
Cost
2008
Balance
atSeptem
ber30,2007................
—$—
65,280
$60
$—
$1,119
$(34)
$(19)
$68
$1,194
Netincome................................
8686
Foreigncurrency
translationadjustment,neto
ftaxof
$12.............................
77
Changein
unrealized
loss
onmarketable
securities,neto
ftaxof
$—...............
(1)
(1)
Changein
unrealized
gain
onderivativ
einstruments,netof
taxof
$—.............
——
Other
comprehensive
income
.................
6
Com
prehensive
income......................
92$92
Com
mon
dividendspaid
.....................
(47)
(47)
Issuance
ofstockunderem
ployee
compensation
plans,neto
fforfeitures
....................
1,188
212
(10)
4Amortiz
ationof
share-basedcompensation.......
2626
Tax
benefito
nvestingof
restricted
stock
........
55
Purchase
andretirem
ento
fcommon
andtreasury
stock...................................
(1,190)
(1)
(22)
(12)
(35)
Principalp
aymentb
yEmployee
StockOwnership
Plan
underguaranteed
loan
.................
44
Notes
receivableforrestricted
stock—
paym
ents
andforfeitures...........................
88
Changein
funded
status
ofretirem
entp
lans,n
etof
taxof
$1................................
11
Cum
ulativeeffectof
change
inaccountin
gprinciple—
adoptio
nof
FIN48
andthe
measurementd
ateprovisionof
FAS158,neto
ftaxof
$1................................
(3)
(3)
Balance
atSeptem
ber30,2008................
—$—
65,278
$61
$21
$1,143
$(30)
$(21)
$75
$1,249
The
accompanyingnotesarean
integral
partof
theseconsolidated
financialstatements.
58

CABOTCORPORATIO
N
CONSO
LID
ATEDST
ATEMENTSOFCHANGESIN
STOCKHOLDERS’
EQUIT
Y
Years
endedSeptem
ber30
(Inmillions,exceptshares
inthou
sand
s)Preferred
Stock,
netof
Treasury
Stock
Com
mon
Stock,
netof
Treasury
Stock
Add
itiona
lPaid-In
Cap
ital
Retained
Earning
s
Deferred
Employee
Benefits
Notes
Receivable
for
Restricted
Stock
Accum
ulated
Other
Com
prehensive
Income
Total
Stockh
olders’
Equ
ity
Total
Com
prehensive
Income
Shares
Cost
Shares
Cost
2009
Balance
atSeptem
ber30,2008................
——
65,278
$61
$21
$1,143
$(30)
$(21)
$75
$1,249
Net(loss)
.................................
(77)
(77)
Foreigncurrency
translationadjustment.......
2222
Chang
ein
employee
benefitp
lans,n
etof
tax
of$4
..........................
.......
(36)
(36)
Changein
unrealized
gain
(loss)on
investments
andderivativ
einstruments,netof
taxof
$1..
(1)
(1)
Other
comprehensive
loss
....................
(15)
Com
prehensive
loss
.........................
(92)
(92)
Com
mon
dividendspaid
.....................
(48)
(48)
Issuance
ofstockunderem
ployee
compensation
plans,neto
fforfeitures
....................
172
23
5Applicationof
stockoptio
naccountin
gfor
restricted
stockaw
ards
.....................
(19)
19—
Amortizationof
share-basedcompensation.......
1414
Purchase
andretirem
ento
fcommon
andtreasury
stock...................................
(141)
—(1)
(1)
Principalp
aymentb
yEmployee
StockOwnership
Plan
underguaranteed
loan
.................
55
Notes
receivableforrestricted
stock—
paym
ents
andforfeitures...........................
22
Balance
atSeptem
ber30,2009................
—$—
65,309
$63
$18
$1,018
$(25)
$—
$60
$1,134
The
accompanyingnotesarean
integral
partof
theseconsolidated
financialstatements.
59

Notes to Consolidated Financial Statements
Note A. Significant Accounting Policies
The consolidated financial statements have been prepared in conformity with accounting principlesgenerally accepted in the United States. The significant accounting policies of Cabot Corporation (“Cabot”or “the Company”) are described below.
Principles of Consolidation
The consolidated financial statements include the accounts of Cabot and its wholly-owned subsidiariesand majority-owned and controlled U.S. and non-U.S. subsidiaries. Additionally, Cabot considersconsolidation of entities over which control is achieved through means other than voting rights, of whichthere were none in the periods presented. Intercompany transactions have been eliminated in consolidation.
Cabot evaluated all subsequent events through November 30, 2009, the issuance date of these financialstatements, to determine if such events should be reflected in these financial statements as of September 30,2009. No significant subsequent events were noted during this evaluation.
Cash and Cash Equivalents
Cash equivalents include all highly liquid investments with a maturity of three months or less at date ofacquisition. The Company carries a variety of different cash and cash equivalents on its consolidatedbalance sheets. Cabot continually assesses the liquidity of cash and cash equivalents and, as ofSeptember 30, 2009, has determined that they are readily convertible to cash.
Inventories
Inventories are stated at the lower of cost or market. The cost of most U.S. inventories is determinedusing the last-in, first-out (“LIFO”) method. The cost of other U.S. and all non-U.S. inventories isdetermined using the average cost method or the first-in, first-out (“FIFO”) method.
Investments
The Company has investments in equity affiliates and marketable securities. As circumstances warrant,all investments are subject to periodic impairment reviews. Unless consolidation is required, investments inequity affiliates, where Cabot generally owns between 20% and 50% of the affiliate, are accounted for usingthe equity method. Cabot records its share of the equity affiliate’s results of operations based on itspercentage of ownership of the affiliate. Dividends received from equity affiliates are a return on investmentand are recorded as a reduction to the equity investment value. All investments in marketable securities areclassified as available-for-sale and are recorded at their fair market values with the corresponding unrealizedholding gains or losses, net of taxes, recorded as a separate component of other comprehensive incomewithin stockholders’ equity. Unrealized losses that are determined to be other than temporary, based oncurrent and expected market conditions, are recognized in net income. The fair value of marketablesecurities is determined based on quoted market prices at the balance sheet dates. The cost of marketablesecurities sold is determined by the specific identification method. Investments that do not have readilydeterminable market values are recorded at cost. Short-term investments consist of investments inmarketable securities with maturities of one year or less.
Property, Plant and Equipment
Property, plant and equipment are recorded at cost. Depreciation of property, plant and equipment iscalculated using the straight-line method over the estimated useful lives. The depreciable lives for buildings,machinery and equipment, and other fixed assets are twenty to twenty-five years, ten to twenty years, andthree to twenty-five years, respectively. The cost and accumulated depreciation for property, plant and
60

equipment sold, retired, or otherwise disposed of are removed from the consolidated balance sheets andresulting gains or losses are included in income from continuing operations in the consolidated statementsof operations.
Expenditures for repairs and maintenance are charged to expenses as incurred. Expenditures for majorrenewals and betterments, which significantly extend the useful lives of existing plant and equipment, arecapitalized and depreciated.
Cabot capitalizes interest costs when they are part of the historical cost of acquiring and constructingcertain assets that require a period of time to get them ready for their intended use. During fiscal 2009, 2008and 2007, Cabot capitalized $4 million, $3 million, and $1 million of interest costs, respectively. Theseamounts will be amortized over the life of the related assets.
Goodwill and Other Intangible Assets
Goodwill is comprised of the cost of business acquisitions in excess of the fair value assigned to thenet tangible and identifiable intangible assets acquired. Goodwill is not amortized but is reviewed forimpairment at least annually. The annual review consists of the comparison of each reporting unit’s carryingvalue to its fair value, which is performed as of March 31. The fair value of a reporting unit is based ondiscounted estimated future cash flows. The assumptions used to estimate fair value include management’sbest estimates of future growth rates, capital expenditures, discount rates and market conditions over anestimate of the remaining operating period. If an impairment exists, a loss is recorded to writedown thevalue of goodwill to its implied fair value.
Cabot’s intangible assets are primarily comprised of patented and unpatented technology and otherintellectual property. Finite lived intangible assets are amortized over their estimated useful lives.Amortization expense was less than $1 million in each of fiscal 2009, 2008, and 2007.
Assets Held for Rent
Assets held for rent represent cesium formate product in the Specialty Fluids Segment that will berented to customers in the normal course of business. Assets held for rent are stated at average cost.
Assets Held for Sale
Cabot classifies its long-lived assets as held for sale when management commits to a plan to sell theassets, the assets are ready for immediate sale in their present condition, an active program to locate buyershas been initiated, the sale of the assets is probable and expected to be completed within one year, the assetsare marketed at reasonable prices in relation to their fair value and it is unlikely that significant changes willbe made to the plan to sell the assets. The Company measures the value of long-lived assets held for sale atthe lower of the carrying amount or fair value, less cost to sell.
As of September 30, 2008, the Company classified $7 million of land as held for sale in current assetson the consolidated balance sheet. As of June 30, 2009, the Company determined that this land, while notimpaired, is unlikely to be sold within the next twelve months and, therefore, has reclassified the balancefrom assets held for sale in current assets to other assets in non-current assets in the September 30, 2009consolidated balance sheet.
Asset Retirement Obligations
Cabot estimates incremental costs for special handling, removal and disposal of materials that may orwill give rise to conditional asset retirement obligations (“AROs”) and then discounts the expected costsback to the current year using a credit adjusted risk free rate. Cabot recognizes ARO liabilities and costswhen the timing and/or settlement can be reasonably estimated. The ARO reserves were $12 million and$11 million at September 30, 2009 and 2008, respectively.
61

Impairment of Long-Lived Assets
Cabot’s long-lived assets include property, plant and equipment, long-term investments and intangibleassets. The carrying values of long-lived assets are reviewed for impairment whenever events or changes inbusiness circumstances indicate that the carrying amount of an asset may not be recoverable. An assetimpairment is recognized when the carrying value of the asset is not recoverable based on the undiscountedestimated future cash flows to be generated by the asset. Cabot’s estimates reflect management’sassumptions about selling prices, production and sales volumes, costs and market conditions over anestimate of the remaining operating period. If an impairment is indicated, the asset is written down to fairvalue. In circumstances when an asset does not have separate identifiable cash flows, an impairment chargeis recorded when Cabot is no longer using the asset.
Foreign Currency Translation
The functional currency of the majority of Cabot’s foreign subsidiaries is the local currency in whichthe subsidiary operates. Assets and liabilities of foreign subsidiaries are translated into U.S. dollars atexchange rates in effect at the balance sheet dates. Income and expense items are translated at averagemonthly exchange rates during the year. Unrealized currency translation adjustments are accumulated as aseparate component of other comprehensive income within stockholders’ equity. Realized and unrealizedforeign currency gains and losses arising from transactions denominated in currencies other than thesubsidiary’s functional currency are reflected in net income with the exception of (i) intercompanytransactions considered to be of a long-term investment nature; and (ii) foreign currency borrowingsdesignated as net investment hedges. Gains or losses arising from these transactions are included as acomponent of other comprehensive income. Included in Other income (charges) are net foreign currencytransaction losses of $17 million in fiscal 2009, losses of $5 million in fiscal 2008 and gains of $7 million infiscal 2007. The foreign currency transaction losses recorded in fiscal 2009 included a loss of $6 millionrelated to the remeasurement of Venezuelan Bolivars using a parallel exchange intended to reflect the rate atwhich Cabot is able to repatriate Bolivars to U.S. dollars.
Financial Instruments
Cabot’s financial instruments consist primarily of cash and cash equivalents, short-term and long-termdebt, and derivative instruments. The carrying values of Cabot’s financial instruments approximate fairvalue with the exception of certain long-term debt that has not been designated with a fair value hedge. Thisportion of long-term debt is recorded at face value. The fair values of the Company’s derivative instrumentsare based on quoted market prices, if such prices are available. In situations where quoted market prices arenot available, the Company relies on valuation models to derive fair value. Such valuation takes intoaccount the ability of the financial counterparty to perform. Cabot uses derivative financial instrumentsprimarily for purposes of hedging exposures to fluctuations in interest rates and foreign currency exchangerates, which exist as part of its on-going business operations. Cabot does not enter into contracts forspeculative purposes, nor does it hold or issue any financial instruments for trading purposes.
All derivatives are recognized on the consolidated balance sheets at fair value. The changes in the fairvalue of derivatives are recorded in either earnings or other comprehensive income, depending on whether ornot the instrument is designated as part of a hedge transaction and, if designated as part of a hedge transaction,the type of hedge transaction. The gains or losses on derivative instruments reported in other comprehensiveincome are reclassified to earnings in the period in which earnings are affected by the underlying hedged item.The ineffective portion of all hedges is recognized in earnings. Each quarter, the Company analyzesderivatives designated as hedges using prospective and retrospective tests. In the event that the hedgingrelationship fails the retrospective test, hedge accounting is suspended for the period in which the test failed,resulting in the change in the value of the derivative being recognized in net income with no offset by thehedged item. If the prospective test fails, then the derivative is dedesignated as a hedge, hedge accounting issuspended, and any accumulated balance in equity is immediately recognized in net income.
62

In accordance with Cabot’s risk management strategy, the Company may enter into certain derivativeinstruments that may not be designated as hedges for hedge accounting purposes. Although thesederivatives are not designated as hedges, the Company believes that such instruments are closely correlatedwith the underlying exposure, thus managing the associated risk. The Company records in earnings thegains or losses from changes in the fair value of derivative instruments that are not designated as hedges.
Revenue Recognition
Cabot recognizes revenue when persuasive evidence of a sales arrangement exists, delivery hasoccurred, the sales price is fixed or determinable and collectibility is probable. Cabot generally is able toensure that products meet customer specifications prior to shipment. If the Company is unable to determinethat the product has met the specified objective criteria prior to shipment, the revenue is deferred untilproduct acceptance has occurred.
Shipping and handling charges related to sales transactions are recorded as sales revenue when billedto customers or included in the sales price. Shipping and handling costs are included in cost of sales.
The following table summarizes the percentages of total net sales and other operating revenuesrecognized in each of the Company’s reportable segments. Other operating revenues, which represent lessthan two percent of total revenues, are primarily royalties for licensed technology:
Years ended September 30
2009 2008 2007
Core SegmentRubber Blacks Business . . . . . . . . . . . . . . . . . . . . . . . . . . . . . . . . . . . . . . . . . . . . . . 59% 60% 55%Supermetals Business . . . . . . . . . . . . . . . . . . . . . . . . . . . . . . . . . . . . . . . . . . . . . . . . 6% 6% 9%
Performance Segment . . . . . . . . . . . . . . . . . . . . . . . . . . . . . . . . . . . . . . . . . . . . . . . . . 29% 30% 32%New Business Segment . . . . . . . . . . . . . . . . . . . . . . . . . . . . . . . . . . . . . . . . . . . . . . . . 3% 2% 2%Specialty Fluids Segment . . . . . . . . . . . . . . . . . . . . . . . . . . . . . . . . . . . . . . . . . . . . . . . 3% 2% 2%
As indicated above, Cabot derives a substantial majority of its revenues from the sale of products in theCore and Performance Segments. Revenue from these products is typically recognized when the product isshipped and title and risk of loss have passed to the customer. The Company offers certain of its customerscash discounts and volume rebates as sales incentives. The discounts and volume rebates are recorded as areduction in sales at the time revenue is recognized and are estimated based on historical experience andcontractual obligations. Cabot periodically reviews the assumptions underlying its estimates of discountsand volume rebates and adjusts its revenues accordingly. Certain Rubber Blacks Business and PerformanceSegment customer contracts contain price protection clauses that provide for the potential reduction in pastor future sales prices under specific circumstances. Cabot analyzes these contract provisions to determine ifan obligation related to these clauses exists and records revenue net of any estimated protectioncommitments.
The majority of the revenue in the Specialty Fluids Segment arises from the rental of cesium formate.This revenue is recognized throughout the rental period based on the contracted rental terms. Customers arealso billed and revenue is recognized, typically at the end of the job, for cesium formate product that is notreturned.
Accounts Receivable
Trade receivables are recorded at the invoiced amount and do not bear interest. Trade receivables inChina may be settled with the receipt of bank issued non-interest bearing notes. These notes totaled62 million Chinese Renminbi (“RMB”) ($9 million) and 82 million RMB ($12 million) as of September 30,2009 and 2008, respectively, and are included in accounts and notes receivable. Cabot periodically sells aportion of the trade receivables in China at a discount. The difference between the proceeds from the saleand the carrying value of the receivables is recognized as a loss on the sale of receivables and is included in
63

other income (charges) in the accompanying consolidated statements of operations. During fiscal 2009,2008 and 2007, the Company recorded charges of $1 million, $4 million and $2 million, respectively, forthe sale of these receivables.
Cabot maintains allowances for doubtful accounts based on an assessment of the collectibility ofspecific customer accounts, the aging of accounts receivable and other economic information on both anhistorical and prospective basis. Customer account balances are charged against the allowance when it isprobable the receivable will not be recovered. Changes in the allowance during fiscal 2009 and 2008 werenot material. There is no off-balance sheet credit exposure related to customer receivable balances.
Stock-based Compensation
Cabot recognizes stock-based awards granted to employees as compensation expense on a fair valuemethod. Under the fair value recognition provisions, stock-based compensation cost is measured at the grantdate based on the fair value of the award and is recognized as expense over the service period, whichgenerally represents the vesting period, and includes an estimate of the awards that will be forfeited. Cabotcalculates the fair value of its stock options using the Black-Scholes option pricing model and the fair valueof restricted stock using the intrinsic value method.
Research and Technical Expenses
Research and technical expenses disclosed in the consolidated statements of operations are expensed asincurred. Research and technical expenses include salaries, equipment and material expenditures, andcontractor fees.
Income Taxes
Deferred income taxes are determined based on the estimated future tax effects of differences betweenfinancial statement carrying amounts and the tax bases of existing assets and liabilities. Deferred tax assetsare recognized to the extent that realization of those assets is considered to be more likely than not.
A valuation allowance is established for deferred taxes when it is more likely than not that all or aportion of the deferred tax assets will not be realized. Provisions are made for the U.S. income tax liabilityand additional non-U.S. taxes on the undistributed earnings of non-U.S. subsidiaries, except for amountsCabot has designated to be indefinitely reinvested.
Cabot records its obligation for uncertain tax positions based on an assessment of whether the positionis more likely than not to be sustained by the taxing authorities. If this threshold is not met, the full amountof the uncertain tax position is recorded as a liability. If the threshold is met, the tax benefit that isrecognized is the largest amount that is greater than 50 percent likely of being realized upon ultimatesettlement. This analysis presumes the taxing authorities’ full knowledge of the positions taken and allrelevant facts, but does not consider the time value of money. The Company also accrues for interest andpenalties on its uncertain tax positions and includes such charges in its income tax provision in theconsolidated statements of operations.
Accumulated Other Comprehensive Income
Accumulated other comprehensive income, which is included as a component of stockholders’ equity,includes unrealized gains or losses on available-for-sale marketable securities and derivative instruments,currency translation adjustments in foreign subsidiaries, translation adjustments on foreign equity securitiesand minimum pension liability adjustments.
64

Environmental Costs
Cabot accrues environmental costs when it is probable that a liability has been incurred and the amountcan be reasonably estimated. When a single liability amount cannot be reasonably estimated, but a range canbe reasonably estimated, Cabot accrues the amount that reflects the best estimate within that range or thelow end of the range if no estimate within the range is better. The amount accrued reflects Cabot’sassumptions about remediation requirements at the contaminated site, the nature of the remedy, the outcomeof discussions with regulatory agencies and other potentially responsible parties at multi-party sites, and thenumber and financial viability of other potentially responsible parties. Cabot discounts all, or a portion, ofenvironmental and other long-term liabilities to reflect the time value of money if the amount of the liabilityand the amount and timing of cash payments for the liability are fixed and reliably determinable. Theliability will be discounted at a rate that will produce an amount at which the liability theoretically could besettled in an arm’s length transaction with a third party. This discounted rate may not exceed the risk-freerate for maturities comparable to those of the liability. Cabot does not reduce its estimated liability forpossible recoveries from insurance carriers. Proceeds from insurance carriers are recorded when realized byeither the receipt of cash or a contractual agreement.
Use of Estimates
The preparation of consolidated financial statements in conformity with generally accepted accountingprinciples in the United States requires management to make certain estimates and assumptions that affectthe reported amount of assets and liabilities and the disclosure of contingent assets and liabilities at the dateof the consolidated financial statements and the reported amounts of revenues and expenses during thereported period. Actual results could differ from those estimates.
Note B. Accounting Pronouncements
New and Adopted
On October 1, 2008 Cabot adopted the authoritative guidance issued by the FASB on fair valuemeasurements, which (i) provides guidance for using fair value to measure assets and liabilities; and(ii) requires additional disclosure about the use of fair value measures, the information used to measure fairvalue, and the effect fair-value measurements have on earnings. The primary areas in which Cabot utilizesfair value measures are in valuing pension plan assets and liabilities, valuing hedge-related derivativefinancial instruments, allocating purchase price to the assets and liabilities of acquired companies, andevaluating long-term assets for potential impairment. The guidance does not require any new fair valuemeasurements. In February 2008, the FASB issued an update which defers the effective date of theguidance for nonfinancial assets and nonfinancial liabilities, except for items that are recognized ordisclosed at fair value in the financial statements on a recurring basis, to fiscal years beginning afterNovember 15, 2008. Effective October 1, 2008, Cabot adopted the portion of the guidance that was notdeferred, which includes the disclosures in Note K, and applied the provisions of the statementprospectively to assets and liabilities measured and disclosed at fair value. The adoption of the deferredportion of the guidance on October 1, 2009 is not expected to have a material impact on the Company’sconsolidated financial statements.
On January 1, 2009 Cabot adopted the authoritative guidance issued by the FASB on disclosures aboutderivative instruments and hedging activities. The guidance was intended to improve financial reportingabout derivative instruments and hedging activities by requiring enhanced disclosures to enable investors tobetter understand their effects on an entity’s financial position, financial performance and cash flows. Thedisclosures are included in Note M, and the provisions of the statement have been applied prospectively.Therefore, comparative figures are not provided. The disclosure regarding the impact on earnings ofamounts reclassified from other comprehensive income has not been included for the full year as it is notmaterial and the guidance was effective only for the last three quarters of the fiscal year.
65

Not Yet Adopted
In December 2007, the FASB issued authoritative guidance on business combinations that will becomeeffective for all business combinations completed by Cabot on or after October 1, 2009. The guidanceestablishes principles and requirements for how an acquirer in a business combination recognizes andmeasures in its financial statements the identifiable assets acquired, the liabilities assumed, and anynon-controlling interest in the acquiree. It also provides guidance for recognizing and measuring thegoodwill acquired in the business combination and determines what information to disclose to enable usersof the financial statements to evaluate the nature and financial effects of business combinations.
In December 2007, the FASB issued authoritative guidance that changes the accounting and reportingfor non-controlling interests that will become effective for Cabot beginning October 1, 2009. The guidanceestablishes accounting and reporting standards for the ownership interests in subsidiaries held by partiesother than the parent, the amount of consolidated net income attributable to the parent and to thenoncontrolling interest, changes in the parent’s ownership interest and the valuation of retainednoncontrolling equity investments when a subsidiary is deconsolidated. It also establishes disclosurerequirements that clearly identify and distinguish between the interests of the parent and the interests of thenoncontrolling owners. Adoption of the guidance is not expected to have a material impact on theCompany’s consolidated financial statements.
In June 2009, the FASB issued authoritative guidance on the consolidation of variable interest entities,which is effective for Cabot beginning October 1, 2010. The new guidance requires revised evaluations ofwhether entities represent variable interest entities, ongoing assessments of control over such entities, andadditional disclosures for variable interests. The Company is evaluating the impact of this guidance on itsconsolidated financial statements.
Note C. Acquisitions
Cabot Malaysia
On April 1, 2008, Cabot purchased additional shares of its equity affiliate in Malaysia, Cabot MalaysiaSdn. Bhd. (“Cabot Malaysia”) for less than $1 million. This purchase increased Cabot’s equity ownership inCabot Malaysia from 49% to approximately 51%, resulting in Cabot’s control of the affiliate and, therefore,consolidation of Cabot Malaysia’s operating results in the Company’s consolidated financial statements asof April 1, 2008.
Prior to the acquisition, Cabot’s investment in Cabot Malaysia was accounted for as an equity methodinvestment and the earnings or losses were reflected through the single line item “Equity in net income ofaffiliated companies” in the consolidated statements of operations. Cabot’s investment was included in theline item “Investments: Equity affiliates” in the consolidated balance sheets. As of April 1, 2008, Cabot’sshare of the earnings or losses are reflected through several line items within the consolidated statements ofoperations while the minority shareholders’ share of the earnings or losses are reflected in “Minority interestin net income”, and Cabot’s investment in the entity is reflected in each of the relevant asset and liabilityaccounts in the consolidated balance sheets as of September 30, 2009 and 2008.
Note D. Discontinued Operations
In fiscal 2009, Cabot recorded a loss from discontinued operations of less than $1 million ($0.01 perdiluted common share) for legal settlements in connection with its discontinued operations. In fiscal 2008,Cabot did not have material income or charges related to discontinued operations. In fiscal 2007, Cabotrecorded income from discontinued operations of $2 million ($0.03 per diluted common share) whichincluded tax benefits of $3 million, partially offset by a charge of less than $1 million for legal settlements.
66

Note E. Inventories
Inventories, net of LIFO, are as follows:September 30
2009 2008
(Dollars in millions)
Raw materials . . . . . . . . . . . . . . . . . . . . . . . . . . . . . . . . . . . . . . . . . $118 $193Work in process . . . . . . . . . . . . . . . . . . . . . . . . . . . . . . . . . . . . . . . 44 58Finished goods . . . . . . . . . . . . . . . . . . . . . . . . . . . . . . . . . . . . . . . . 165 246Other . . . . . . . . . . . . . . . . . . . . . . . . . . . . . . . . . . . . . . . . . . . . . . . . 31 26
Total . . . . . . . . . . . . . . . . . . . . . . . . . . . . . . . . . . . . . . . . . . . . . . $358 $523
Inventories valued under the LIFO method comprised approximately 18% and 14% of total inventoriesin fiscal 2009 and 2008, respectively. At September 30, 2009 and 2008, the LIFO reserve was $119 millionand $140 million, respectively. Other inventory is comprised of certain spare parts and supplies.
During fiscal 2009, 2008 and 2007, inventory quantities were reduced at the Company’s U.S.Supermetals site. Additionally, during fiscal 2009 and 2008 inventory quantities were reduced at theCompany’s U.S. Rubber Blacks and Performance Products sites. These reductions led to liquidations ofLIFO inventory quantities and resulted in a decrease of cost of goods sold of $6 million, $14 million and $4million and an increase in net income of $4 million ($0.07 per diluted common share), $9 million ($0.14 perdiluted common share) and $3 million ($0.04 per diluted common share) for fiscal 2009, 2008 and 2007,respectively.
Cabot reviews inventory for both potential obsolescence and potential loss of value periodically. In thisreview, Cabot makes assumptions about the future demand for and market value of the inventory and, basedon these assumptions, estimates the amount of obsolete, unmarketable or slow moving inventory. AtSeptember 30, 2009 and 2008, the obsolete inventory reserve was $13 million and $14 million, respectively.
Note F. Investments
Equity Affiliates—Cabot has investments in equity affiliates in the Rubber Blacks and Fumed MetalOxides Businesses. These investments are accounted for using the equity method. Cabot does not discloseits equity affiliate financial statements separately by entity because none of them are individually material tothe consolidated financial statements. The following summarized results of operations and financial positioninclude Cabot’s equity based affiliates for the periods presented below.
67

As discussed in Note C, the Company purchased additional shares of its equity affiliate, CabotMalaysia, for less than $1 million in fiscal 2008, increasing its ownership from 49% to approximately 51%.Prior to this additional investment, the Company accounted for Cabot Malaysia as an equity methodinvestment. Upon purchase of the additional shares, the Company began accounting for Cabot Malaysia as aconsolidated subsidiary. The condensed income statement and balance sheet information for CabotMalaysia is included in the fiscal 2007 amounts below but excluded from the fiscal 2009 and 2008 amounts:
September 30
2009 2008 2007
(Dollars in millions)
Condensed Income Statement Information:Net sales . . . . . . . . . . . . . . . . . . . . . . . . . . . . . . . . . . . . . . . . . . . . . . . . . . . . . . . . . . . $172 $262 $261Gross profit . . . . . . . . . . . . . . . . . . . . . . . . . . . . . . . . . . . . . . . . . . . . . . . . . . . . . . . . . 33 48 71Net income . . . . . . . . . . . . . . . . . . . . . . . . . . . . . . . . . . . . . . . . . . . . . . . . . . . . . . . . . 10 16 26
Condensed Balance Sheet Information:Current assets . . . . . . . . . . . . . . . . . . . . . . . . . . . . . . . . . . . . . . . . . . . . . . . . . . . . . . . $ 87 $102 $ 93Non-current assets . . . . . . . . . . . . . . . . . . . . . . . . . . . . . . . . . . . . . . . . . . . . . . . . . . . . 64 65 87Current liabilities . . . . . . . . . . . . . . . . . . . . . . . . . . . . . . . . . . . . . . . . . . . . . . . . . . . . . 34 56 33Non-current liabilities . . . . . . . . . . . . . . . . . . . . . . . . . . . . . . . . . . . . . . . . . . . . . . . . . 7 8 20Net assets . . . . . . . . . . . . . . . . . . . . . . . . . . . . . . . . . . . . . . . . . . . . . . . . . . . . . . . . . . . 110 103 127
At September 30, 2009 and 2008, Cabot had equity affiliate investments of $60 million and$53 million, respectively. Dividends received from these investments were $1 million, $2 million and$10 million in fiscal 2009, 2008 and 2007, respectively.
Marketable Securities—Cabot holds short-term and long-term investments in available-for-salemarketable securities. These investments had a fair market value of $1 million as of September 30, 2009and 2008. Any unrealized losses are reported as a separate component of other comprehensive incomewithin stockholders’ equity.
During fiscal 2009, the Company recorded a charge of $1 million of unrealized losses from othercomprehensive income to earnings as a result of investment impairments that were deemed other thantemporary. No such charges to earnings occurred in fiscal 2008 or 2007.
Cabot made no purchases or sales of available-for-sale securities during fiscal 2009 or 2008. Duringfiscal 2007, Cabot paid $95 million and received proceeds of $95 million for purchases and sales ofavailable-for-sale securities. There were no gross realized gains (losses) from the sale of available-for-salesecurities in fiscal 2009, 2008 or 2007.
No dividends were received from available-for-sale marketable securities during fiscal 2009, 2008 or2007.
Cost Investments—Cabot had cost-based investments of less than $1 million at September 30, 2009and 2008, which are classified as long-term. No sales of cost-based investments occurred during fiscal2009, 2008 or 2007.
68

Note G. Property, Plant and Equipment
Property, plant and equipment is summarized as follows:September 30
2009 2008
(Dollars in millions)
Land and improvements . . . . . . . . . . . . . . . . . . . . . . . . . . . . . . . . . . $ 68 $ 67Buildings . . . . . . . . . . . . . . . . . . . . . . . . . . . . . . . . . . . . . . . . . . . . . 483 416Machinery and equipment . . . . . . . . . . . . . . . . . . . . . . . . . . . . . . . . 2,182 2,136Other . . . . . . . . . . . . . . . . . . . . . . . . . . . . . . . . . . . . . . . . . . . . . . . . . 149 130Construction in progress . . . . . . . . . . . . . . . . . . . . . . . . . . . . . . . . . 118 172
Total property, plant and equipment . . . . . . . . . . . . . . . . . . . . . . 3,000 2,921Less: accumulated depreciation . . . . . . . . . . . . . . . . . . . . . . . . . . . . (1,988) (1,839)
Net property, plant and equipment . . . . . . . . . . . . . . . . . . . . . . . . $ 1,012 $ 1,082
Depreciation expense was $169 million, $162 million and $148 million for fiscal 2009, 2008 and 2007,respectively.
Note H. Goodwill and Other Intangible Assets
Cabot had goodwill balances of $37 million and $34 million at September 30, 2009 and 2008,respectively. The carrying amount of goodwill attributable to each reportable segment with goodwillbalances and the changes in those balances during the years ended September 30, 2009 and 2008 are asfollows:
Rubber BlacksBusiness
PerformanceSegment Total
(Dollars in millions)
Balance at September 30, 2008 . . . . . . . . . . . . . . . . $23 $11 $34Foreign currency translation adjustment . . . . . . . . . 3 — 3
Balance at September 30, 2009 . . . . . . . . . . . . . . . . $26 $11 $37
Impairment tests are performed at least annually. The Company performed its annual impairmentassessment as of March 31, 2009 and determined that there was no impairment.
Cabot does not have any indefinite-lived intangible assets. Finite-lived intangible assets consist of thefollowing:
Years Ended September 30
2009 2008
GrossCarryingValue
AccumulatedAmortization
NetIntangibleAssets
GrossCarryingValue
AccumulatedAmortization
NetIntangibleAssets
(Dollars in millions)
Patents . . . . . $13 $(11) $2 $13 $(10) $3
Intangible assets are amortized over their estimated useful lives, which range from ten to fourteenyears, with a weighted average amortization period of ten years. Amortization expense amounted to lessthan $1 million in each of fiscal 2009, 2008 and 2007 and is included in cost of goods sold. Amortizationexpense is estimated to be less than $1 million in each of the next two fiscal years.
In 2006, Cabot entered into a cross license agreement with Aspen Aerogel, Inc. (“Aspen”) where eachparty granted certain intellectual property rights to the other. In consideration for the license of certainpatents granted by Cabot, the Company is entitled to payments totaling $38 million. Cabot received $4million, $4 million and $2 million in fiscal 2009, 2008 and 2007, respectively, of installment paymentswhich have been recorded in earnings. The remaining $27 million is payable in installments over the nextfour years, and will be recognized in earnings if and when collectibility is reasonably assured.
69

Note I. Accounts Payable, Accrued Liabilities and Other Liabilities
Accounts payable and accrued liabilities included in current liabilities consisted of the following:September 30
2009 2008
(Dollars in millions)
Accounts payable . . . . . . . . . . . . . . . . . . . . . . . . . . . . . . . . . . . . . . . $269 $314Accrued employee compensation . . . . . . . . . . . . . . . . . . . . . . . . . . . 38 39Accrued severance, termination and restructuring . . . . . . . . . . . . . . 34 4Other accrued liabilities . . . . . . . . . . . . . . . . . . . . . . . . . . . . . . . . . . 66 69
Total . . . . . . . . . . . . . . . . . . . . . . . . . . . . . . . . . . . . . . . . . . . . . . . $407 $426
Other long-term liabilities consisted of the following:September 30
2009 2008
(Dollars in millions)
Employee benefit plan liabilities . . . . . . . . . . . . . . . . . . . . . . . . . . $153 $113Non-current tax liabilities . . . . . . . . . . . . . . . . . . . . . . . . . . . . . . . . 58 62Financial instrument liabilities . . . . . . . . . . . . . . . . . . . . . . . . . . . . 55 48Other accrued liabilities . . . . . . . . . . . . . . . . . . . . . . . . . . . . . . . . . 62 71
Total . . . . . . . . . . . . . . . . . . . . . . . . . . . . . . . . . . . . . . . . . . . . . . $328 $294
70

Note J. Debt and Other Obligations
The Company’s long-term obligations, the calendar year in which they mature and their respectiveinterest rates are summarized below:
September 30
2009 2008
(Dollars in millions)
Variable Rate Debt:$400 million Revolving Credit Facility:Yen drawdown, due 2010 . . . . . . . . . . . . . . . . . . . . . . . . . . . . . . . . . . . . . . . . . . . . . $ — $ 88US Dollar drawdowns, due 2010 . . . . . . . . . . . . . . . . . . . . . . . . . . . . . . . . . . . . . . . — 155
Chinese Renminbi Notes, due 2010 – 2012, 5.00% to 5.40% . . . . . . . . . . . . . . . . . . . 23 40
Total variable rate debt . . . . . . . . . . . . . . . . . . . . . . . . . . . . . . . . . . . . . . . . . . . . . . . 23 283Fixed Rate Debt:5% Notes due 2016, net of discount . . . . . . . . . . . . . . . . . . . . . . . . . . . . . . . . . . . . . . . $298 $ —Medium Term Notes (average stated rate):Notes due 2011, 7.26% . . . . . . . . . . . . . . . . . . . . . . . . . . . . . . . . . . . . . . . . . . . . . . . $ 15 $ 45Notes due 2012 – 2022, 8.28% . . . . . . . . . . . . . . . . . . . . . . . . . . . . . . . . . . . . . . . . . 44 44Notes due 2018, 7.42% . . . . . . . . . . . . . . . . . . . . . . . . . . . . . . . . . . . . . . . . . . . . . . . 30 30Note due 2027, 7.28% . . . . . . . . . . . . . . . . . . . . . . . . . . . . . . . . . . . . . . . . . . . . . . . . 8 8Note due 2027, 6.57% . . . . . . . . . . . . . . . . . . . . . . . . . . . . . . . . . . . . . . . . . . . . . . . . 1 1
Total Medium Term Notes . . . . . . . . . . . . . . . . . . . . . . . . . . . . . . . . . . . . . . . . . . 98 128Eurobond, due 2013, 5.25%, net of discount . . . . . . . . . . . . . . . . . . . . . . . . . . . . . . . . 178 176Guarantee of ESOP Note, due 2013, 8.29% . . . . . . . . . . . . . . . . . . . . . . . . . . . . . . . . . 25 30Other, due 2027, 2% . . . . . . . . . . . . . . . . . . . . . . . . . . . . . . . . . . . . . . . . . . . . . . . . . . . 5 6
Total fixed rate debt . . . . . . . . . . . . . . . . . . . . . . . . . . . . . . . . . . . . . . . . . . . . . . . 604 340Capital lease, due 2010 – 2021 . . . . . . . . . . . . . . . . . . . . . . . . . . . . . . . . . . . . . . . . . . . 1 2
Total debt . . . . . . . . . . . . . . . . . . . . . . . . . . . . . . . . . . . . . . . . . . . . . . . . . . . . . . . 628 625Less current portion of long-term debt . . . . . . . . . . . . . . . . . . . . . . . . . . . . . . . . . . . . . (5) (39)
Total long-term debt . . . . . . . . . . . . . . . . . . . . . . . . . . . . . . . . . . . . . . . . . . . . . . . $623 $586
$400 million Revolving Credit Facility—Cabot has a $400 million revolving credit facility thatpermits the Company to borrow funds on an unsecured basis in various currencies at floating interest rates.These floating interest rates are dependent upon the currency in which its borrowings are denominated.Generally, the rates are determined based upon LIBOR plus a spread, which is based on the Company’scredit rating. The credit facility expires on August 3, 2010. Cabot did not have any outstanding indebtednessunder this facility as of September 30, 2009. However, the Company has $16 million of committed butundrawn letters of credit against this facility. The revolving credit facility agreement contains affirmative,negative and financial covenants, including financial covenants for certain maximum indebtedness and,under certain conditions, minimum cash flow requirements.
Chinese Renminbi Debt—The Company’s consolidated Chinese subsidiaries had $23 million and $40million of unsecured long-term debt outstanding at September 30, 2009 and 2008, respectively. As ofSeptember 30, 2009, $4 million was available under a committed line that expires in 2011.
Other Committed Lines of Credit—The Company has approximately $72 million in borrowingcapacity under certain foreign currency denominated facilities. These are unsecured and bear variableinterest, if used, at local overnight rates.
71

5% Notes—On September 24, 2009, Cabot issued $300 million in public notes with a coupon of 5%that will mature on October 1, 2016. These notes are unsecured and will pay interest on April 1 andOctober 1 of each year. The net proceeds of this offering were $296 million after deducting discounts andissuance costs. The discount of approximately $2 million was recorded at issuance and it is being amortizedover the life of the notes. A portion of the proceeds was used to repay the outstanding indebtedness underthe Company’s revolving credit facility. The remaining portion of the proceeds will be used for generalcorporate purposes.
Medium Term Notes—At September 30, 2009 and 2008, there were $98 million and $128 million,respectively, of unsecured medium term notes outstanding issued to numerous lenders with various fixedinterest rates and maturity dates. The weighted average maturity of the total outstanding medium term notesis 7.5 years with a weighted average interest rate of 7.8%. As described in Note M, the Company hasentered into variable interest rate swaps for certain designated medium term notes to offset the changes inthe fair value of the underlying debt.
Eurobond—A European subsidiary issued an unsecured $175 million bond with a fixed coupon rate of5.25% in fiscal 2003. The bond matures on September 1, 2013, with interest due on March 1 andSeptember 1 of each year. A discount of approximately $1 million was recorded at issuance and is beingamortized over the life of the bond. Amortization of the discount was immaterial for fiscal 2009, 2008 and2007. As described in Note M, the Company has entered into cross-currency swaps and a floating interestrate swap to hedge the variability in cash flows for changes in the exchange rates and to offset a portion ofthe changes in the fair value of the underlying debt.
ESOP Debt—In November 1988, Cabot’s Employee Stock Ownership Plan (“ESOP”) borrowed$75 million from an institutional lender in order to finance its purchase of 75,000 shares of Cabot’s Series BESOP Convertible Preferred Stock. This debt bears interest at 8.29% per annum and is to be repaid inquarterly installments through December 31, 2013. Cabot, as guarantor, has reflected the outstandingbalance of $25 million and $30 million as long-term debt in the consolidated balance sheets atSeptember 30, 2009 and 2008, respectively. An equal amount, representing deferred employee benefits, hasbeen recorded as a reduction to stockholders’ equity. All of Cabot’s outstanding preferred stock wasconverted to common stock during the fourth quarter of fiscal 2007.
Capital Lease Obligations—Cabot has capital lease obligations for certain equipment with a netpresent value of $1 million. Cabot will make payments totaling $3 million over the next twelve years,including $2 million of imputed interest. Cabot has assets under capital leases of which the original costs atboth September 30, 2009 and 2008 were $2 million. The accumulated depreciation of assets under capitalleases was $1 million at both September 30, 2009 and 2008. The amortization related to those assets undercapital lease is included in depreciation expense.
The aggregate principal amounts of long-term debt and capital lease obligations due in each of the fiveyears from fiscal 2010 through 2014 and thereafter are as follows:
Fiscal Years Ended (Dollars in millions)
2010 . . . . . . . . . . . . . . . . . . . . . . . . . . . . . . . . . . . . . . . . . . . . . . . . . . . $ 52011 . . . . . . . . . . . . . . . . . . . . . . . . . . . . . . . . . . . . . . . . . . . . . . . . . . . 252012 . . . . . . . . . . . . . . . . . . . . . . . . . . . . . . . . . . . . . . . . . . . . . . . . . . . 542013 . . . . . . . . . . . . . . . . . . . . . . . . . . . . . . . . . . . . . . . . . . . . . . . . . . . 1852014 . . . . . . . . . . . . . . . . . . . . . . . . . . . . . . . . . . . . . . . . . . . . . . . . . . . 2Thereafter . . . . . . . . . . . . . . . . . . . . . . . . . . . . . . . . . . . . . . . . . . . . . . . 357
Total . . . . . . . . . . . . . . . . . . . . . . . . . . . . . . . . . . . . . . . . . . . . . . . . . $628
At September 30, 2009, the Company had provided standby letters of credit that were outstanding andnot drawn totaling $41 million, which expire through fiscal 2011.
72

Short-term Notes Payable to Banks—The Company had unsecured short-term notes payable to banksof $29 million and $91 million as of September 30, 2009 and 2008, respectively. The weighted-averageinterest rate on short-term notes payable is 5.9% and 7.4% for fiscal 2009 and 2008, respectively.
Note K. Fair Value Measurements
On October 1, 2008 Cabot adopted the authoritative guidance issued by the FASB on fair valuemeasurements. As permitted by the guidance, Cabot elected to defer implementation of the provisions of theguidance for nonfinancial assets and nonfinancial liabilities until October 1, 2009, except for nonfinancialitems that are recognized or disclosed at fair value in the financial statements on a recurring basis. Theguidance defines fair value, establishes a framework for measuring fair value in generally acceptedaccounting principles, and expands disclosures about fair value measurements. The disclosures focus on theinputs used to measure fair value. The guidance establishes the following hierarchy for categorizing theseinputs:
Level 1—Quoted market prices in active markets for identical assets or liabilities
Level 2—Significant other observable inputs (e.g., quoted prices for similar items in active markets, quotedprices for identical or similar items in markets that are not active, inputs other than quoted pricesthat are observable such as interest rate and yield curves, and market-corroborated inputs)
Level 3—Significant unobservable inputs
The following table presents information about the Company’s financial assets and liabilities measuredat fair value on a recurring basis as of September 30, 2009. The derivatives presented in the table below arepresented by derivative type, net of the legal right to offset derivative settlements by each counterparty:
Level 1 Inputs Level 2 Inputs Total
(Dollars in Millions)
Assets at fair value:Equity securities(1) . . . . . . . . . . . . . . . . . . . . . . . . . . . . . . . . . . . . . . . . . . $ 2 $— $ 2Guaranteed investment contract(2) . . . . . . . . . . . . . . . . . . . . . . . . . . . . . . — 14 14Derivatives relating to:Interest rates(3) . . . . . . . . . . . . . . . . . . . . . . . . . . . . . . . . . . . . . . . . . . . — 4 4
Total assets at fair value . . . . . . . . . . . . . . . . . . . . . . . . . . . . . . . . . . . . . . . $ 2 $18 $20
Liabilities at fair value:Derivatives relating to:Foreign currency(3) . . . . . . . . . . . . . . . . . . . . . . . . . . . . . . . . . . . . . . . $— $65 $65
Total liabilities at fair value . . . . . . . . . . . . . . . . . . . . . . . . . . . . . . . . . . . . $— $65 $65
(1) The Company’s investments in equity securities are included in “Short-term marketable securities” and“Long-term marketable securities and cost investments” in the consolidated balance sheets.
(2) The Company’s guaranteed investment contract is included in “Other assets” in the consolidatedbalance sheets.
(3) The Company’s derivatives are included in “Other assets” and “Other liabilities” in the consolidatedbalance sheets.
73
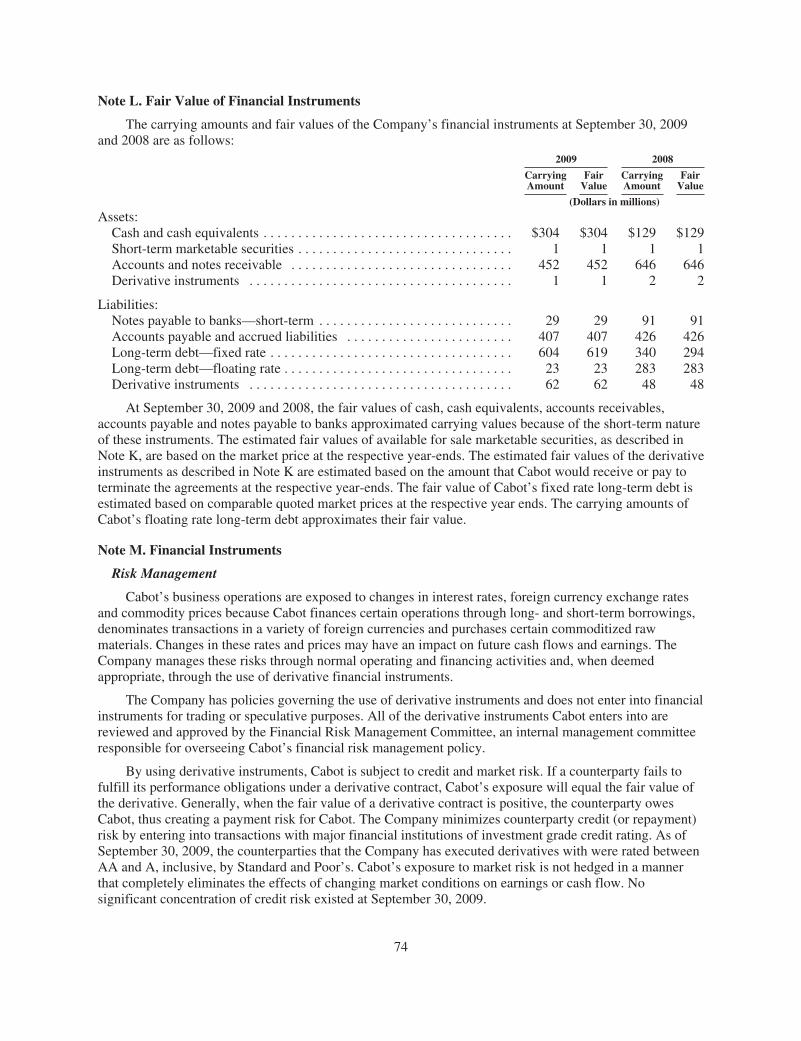
Note L. Fair Value of Financial Instruments
The carrying amounts and fair values of the Company’s financial instruments at September 30, 2009and 2008 are as follows:
2009 2008
CarryingAmount
FairValue
CarryingAmount
FairValue
(Dollars in millions)
Assets:Cash and cash equivalents . . . . . . . . . . . . . . . . . . . . . . . . . . . . . . . . . . . . $304 $304 $129 $129Short-term marketable securities . . . . . . . . . . . . . . . . . . . . . . . . . . . . . . . 1 1 1 1Accounts and notes receivable . . . . . . . . . . . . . . . . . . . . . . . . . . . . . . . . 452 452 646 646Derivative instruments . . . . . . . . . . . . . . . . . . . . . . . . . . . . . . . . . . . . . . 1 1 2 2
Liabilities:Notes payable to banks—short-term . . . . . . . . . . . . . . . . . . . . . . . . . . . . 29 29 91 91Accounts payable and accrued liabilities . . . . . . . . . . . . . . . . . . . . . . . . 407 407 426 426Long-term debt—fixed rate . . . . . . . . . . . . . . . . . . . . . . . . . . . . . . . . . . . 604 619 340 294Long-term debt—floating rate . . . . . . . . . . . . . . . . . . . . . . . . . . . . . . . . . 23 23 283 283Derivative instruments . . . . . . . . . . . . . . . . . . . . . . . . . . . . . . . . . . . . . . 62 62 48 48
At September 30, 2009 and 2008, the fair values of cash, cash equivalents, accounts receivables,accounts payable and notes payable to banks approximated carrying values because of the short-term natureof these instruments. The estimated fair values of available for sale marketable securities, as described inNote K, are based on the market price at the respective year-ends. The estimated fair values of the derivativeinstruments as described in Note K are estimated based on the amount that Cabot would receive or pay toterminate the agreements at the respective year-ends. The fair value of Cabot’s fixed rate long-term debt isestimated based on comparable quoted market prices at the respective year ends. The carrying amounts ofCabot’s floating rate long-term debt approximates their fair value.
Note M. Financial Instruments
Risk Management
Cabot’s business operations are exposed to changes in interest rates, foreign currency exchange ratesand commodity prices because Cabot finances certain operations through long- and short-term borrowings,denominates transactions in a variety of foreign currencies and purchases certain commoditized rawmaterials. Changes in these rates and prices may have an impact on future cash flows and earnings. TheCompany manages these risks through normal operating and financing activities and, when deemedappropriate, through the use of derivative financial instruments.
The Company has policies governing the use of derivative instruments and does not enter into financialinstruments for trading or speculative purposes. All of the derivative instruments Cabot enters into arereviewed and approved by the Financial Risk Management Committee, an internal management committeeresponsible for overseeing Cabot’s financial risk management policy.
By using derivative instruments, Cabot is subject to credit and market risk. If a counterparty fails tofulfill its performance obligations under a derivative contract, Cabot’s exposure will equal the fair value ofthe derivative. Generally, when the fair value of a derivative contract is positive, the counterparty owesCabot, thus creating a payment risk for Cabot. The Company minimizes counterparty credit (or repayment)risk by entering into transactions with major financial institutions of investment grade credit rating. As ofSeptember 30, 2009, the counterparties that the Company has executed derivatives with were rated betweenAA and A, inclusive, by Standard and Poor’s. Cabot’s exposure to market risk is not hedged in a mannerthat completely eliminates the effects of changing market conditions on earnings or cash flow. Nosignificant concentration of credit risk existed at September 30, 2009.
74

Interest Rate Risk Management
Cabot’s objective is to maintain a certain range of fixed-to-floating interest rate mix on the Company’sdebt portfolio. Cabot enters into interest rate swaps as a hedge of the underlying debt instruments toeffectively change the characteristics of the interest rate without changing the debt instrument. Thefollowing table provides details of the derivatives held as of September 30, 2009 used to manage interestrate risk.
Description Borrowing Notional AmountHedge
Designation
Interest Rate Swaps—Fixed to Variable Eurobond(20% of $175
million)
USD 35 million Fair Value
Interest Rate Swaps—Fixed to Variable Medium Term Notes USD 8 million Fair Value
Interest Rate Swaps—Fixed to Variable Medium Term Notes USD 15 million Fair Value
Foreign Currency Risk Management
Cabot’s international operations are subject to certain risks, including currency exchange ratefluctuations and government actions. Cabot endeavors to match the currency in which debt is issued to thecurrency of the Company’s major, stable cash receipts. In some situations Cabot has issued debtdenominated in U.S. dollars and then entered into cross currency swaps that exchange the dollar principaland interest payments into a currency where the Company expects long-term, stable cash receipts.
Additionally, the Company has foreign currency exposure arising from its net investments in foreignoperations. Cabot enters into cross-currency swaps to mitigate the impact of currency rate changes on theCompany’s net investments.
The Company also has foreign currency exposure arising from the denomination of current assets andcurrent liabilities in foreign currencies other than the functional currency of a given subsidiary as well as therisk that currency fluctuations could affect the dollar value of future cash flows generated in foreigncurrencies. Accordingly, Cabot uses short-term forward contracts to minimize the exposure to foreigncurrency risk. These forward contracts typically have a duration of 30 days.
75

In certain situations where the Company has forecasted purchases under a long-term commitmentdenominated in a foreign currency, Cabot may enter into appropriate financial instruments in accordancewith the Company’s risk management policy to hedge future cash flow exposures. The following tableprovides details of the derivatives held as of September 30, 2009 used to manage foreign currency risk.
Description Borrowing Notional Amount Hedge Designation
Cross Currency Swap N/A USD 20 millionswapped to JPY 2.5
billion
Net investment hedge
Cross Currency Swap Eurobond(20% of $175
million)
USD 35 millionswapped to EUR 31
million
No designation
Cross Currency Swap Eurobond(80% of $175
million)
USD 140 millionswapped to EUR 124
million
No designation
Forward Foreign CurrencyContracts
N/A (a) No designation
(a) Cabot’s forward foreign exchange contracts are denominated primarily in the Japanese yen, Britishpound sterling, Canadian dollar, Australian dollar and Euros. The duration of these forwards isgenerally 30 days. The total net notional dollar value of these forward contracts at September 30, 2009was $61 million.
Commodity Risk Management
Certain of Cabot’s carbon black plants in Europe are subject to mandatory greenhouse gas emissiontrading schemes. Cabot’s objective is to ensure compliance with the European Union (“EU”) EmissionTrading Scheme, which is based upon a Cap-and-Trade system that establishes a maximum allowableemission credit for each ton of CO2 emitted. European Union Allowances (“EUAs”) originate from theindividual EU state’s country allocation process and are issued by that country’s government. A companythat has an excess of EUAs based on the CO2 emissions limits may sell EUAs in the Emission TradingScheme and if they have a shortfall, a company can buy EUAs or Certified Emission Reduction (“CER”)units to comply.
In order to limit the variability in cost to Cabot’s European operations, the Company committed tocurrent prices by entering into agreements which run from fiscal 2010 to 2013 to purchase CERs and to sellEUAs. The following table provides details of the derivatives held as of September 30, 2009 used tomanage commodity risk.
Net NotionalAmount
Net Buyer/Net Seller
HedgeDesignation
EUAs EUR 2 million Seller No designationCERs EUR 2 million Buyer No designation
The Company also has exposure to the prices of commodities in its procurement of certain rawmaterials. In order to manage the price volatility associated with forecasted inventory purchases, Cabot mayenter into swap trades to buy such commodities. At September 30, 2009, the Company did not have anysuch open contracts outstanding.
76
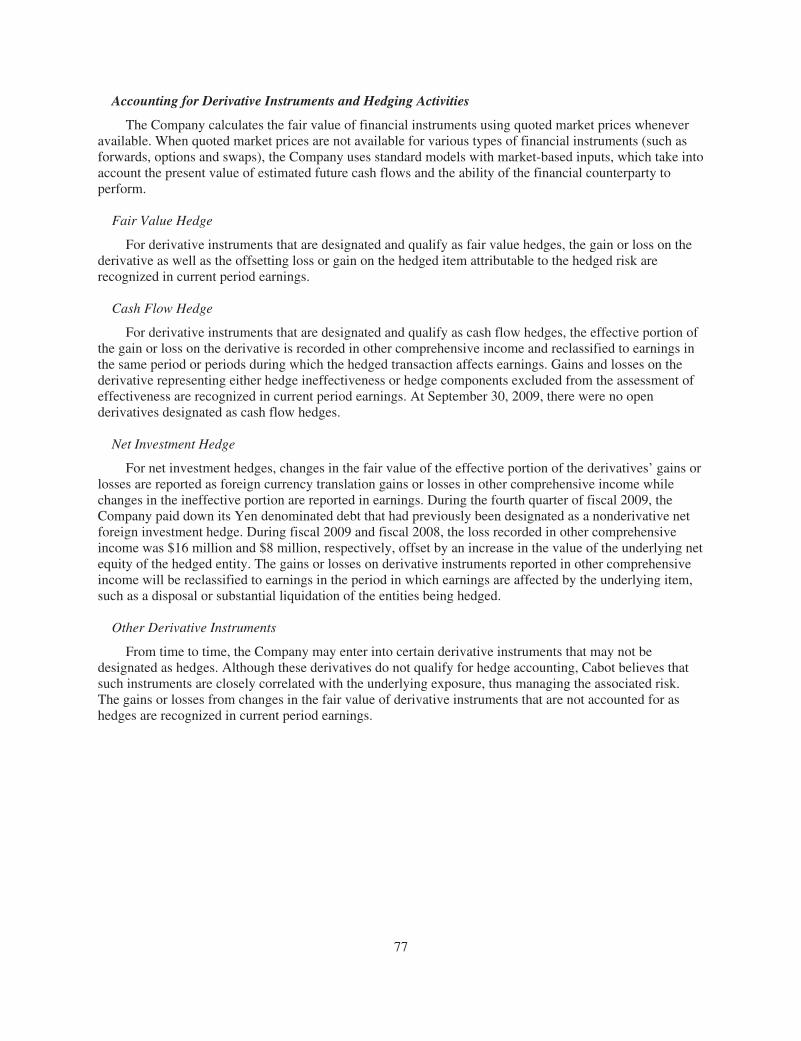
Accounting for Derivative Instruments and Hedging Activities
The Company calculates the fair value of financial instruments using quoted market prices wheneveravailable. When quoted market prices are not available for various types of financial instruments (such asforwards, options and swaps), the Company uses standard models with market-based inputs, which take intoaccount the present value of estimated future cash flows and the ability of the financial counterparty toperform.
Fair Value Hedge
For derivative instruments that are designated and qualify as fair value hedges, the gain or loss on thederivative as well as the offsetting loss or gain on the hedged item attributable to the hedged risk arerecognized in current period earnings.
Cash Flow Hedge
For derivative instruments that are designated and qualify as cash flow hedges, the effective portion ofthe gain or loss on the derivative is recorded in other comprehensive income and reclassified to earnings inthe same period or periods during which the hedged transaction affects earnings. Gains and losses on thederivative representing either hedge ineffectiveness or hedge components excluded from the assessment ofeffectiveness are recognized in current period earnings. At September 30, 2009, there were no openderivatives designated as cash flow hedges.
Net Investment Hedge
For net investment hedges, changes in the fair value of the effective portion of the derivatives’ gains orlosses are reported as foreign currency translation gains or losses in other comprehensive income whilechanges in the ineffective portion are reported in earnings. During the fourth quarter of fiscal 2009, theCompany paid down its Yen denominated debt that had previously been designated as a nonderivative netforeign investment hedge. During fiscal 2009 and fiscal 2008, the loss recorded in other comprehensiveincome was $16 million and $8 million, respectively, offset by an increase in the value of the underlying netequity of the hedged entity. The gains or losses on derivative instruments reported in other comprehensiveincome will be reclassified to earnings in the period in which earnings are affected by the underlying item,such as a disposal or substantial liquidation of the entities being hedged.
Other Derivative Instruments
From time to time, the Company may enter into certain derivative instruments that may not bedesignated as hedges. Although these derivatives do not qualify for hedge accounting, Cabot believes thatsuch instruments are closely correlated with the underlying exposure, thus managing the associated risk.The gains or losses from changes in the fair value of derivative instruments that are not accounted for ashedges are recognized in current period earnings.
77

The following table provides the fair value and consolidated balance sheet presentations of derivativeinstruments by each derivative type, without regard to the legal right to offset derivative settlement by eachcounterparty:Fair Value of Derivative Instruments Balance Sheet Location September 30, 2009
(Dollars in millions)
Asset DerivativesDerivatives designated as hedgesInterest Rate(1) . . . . . . . . . . . . . . . . . . . . Noncurrent Other Assets $ 3
Total derivatives designated as hedges $ 3Derivatives not designated as hedgesForeign currency . . . . . . . . . . . . . . . . . . Other Assets $—Commodity contracts(2) . . . . . . . . . . . . . Other Assets & Noncurrent Other Assets 3
Total derivatives not designated ashedges . . . . . . . . . . . . . . . . . . . . . . . . . . 3
Total Asset Derivatives . . . . . . . . . . . . . . . . . $ 6
Liability DerivativesDerivatives designated as hedgesInterest Rate . . . . . . . . . . . . . . . . . . . . . Other Liabilities $—Foreign currency . . . . . . . . . . . . . . . . . . Accrued Liabilities 7
Total derivatives designated as hedges . . . $ 7Derivatives not designated as hedgesForeign currency(1) . . . . . . . . . . . . . . . . Accrued Liabilities and Other Liabilities $58Commodity contracts(2) . . . . . . . . . . . . . Other Assets & Noncurrent Other Assets 2
Total derivatives not designated ashedges . . . . . . . . . . . . . . . . . . . . . . . . . . $60
Total Liability Derivatives . . . . . . . . . . . . . . $67
(1) Interest rate contracts of $2 million presented on a gross basis in this table have the legal right to offsetagainst certain foreign currency derivatives with a common counterparty and, therefore, are presentedon a net basis in “Other liabilities” in the consolidated balance sheet.
(2) Commodity contracts in an asset and liability position presented on a gross basis in this table have thelegal right of offset and, therefore, are presented on a net basis in current “Other assets” and noncurrent“Other assets” in the consolidated balance sheet.
See Note K “Fair Value Measurements” for classification of derivatives by input level as required byFASB authoritative guidance.
The net after-tax amounts to be reclassified from accumulated other comprehensive income to earningswithin the next 12 months are expected to be immaterial.
Note N. Employee Benefit Plans
Cabot provides both defined benefit and defined contribution plans for its employees. The definedbenefit plans consist of the Cabot Cash Balance Plan (“CBP”), a Supplemental Cash Balance Plan(“SCBP”) and several foreign pension plans. The defined contribution plans consist of the Cabot RetirementSavings Plan (“RSP”), a Supplemental Retirement Savings Plan (“SRSP”) and several foreign plans. Cabotalso provides postretirement benefit plans, which include medical coverage and life insurance.
78

Defined Contribution Plans
Cabot recognized expenses related to U.S. and foreign defined contribution plans in the amount of $9million in fiscal 2009 and $10 million for each of fiscal 2008 and 2007.
Retirement Savings Plan
The RSP is a U.S. defined contribution plan, which encourages long-term systematic savings andprovides funds for retirement or possible earlier needs. The RSP has two components, a 401(k) plan and anEmployee Stock Ownership Plan (“ESOP”).
401(k)
The 401(k) component of the plan allows an eligible participant to contribute a percentage of his or hereligible compensation on a before-tax or after-tax basis. For employees not subject to a collectivebargaining agreement, Cabot makes a matching contribution of 75% of a participant’s contribution up to7.5% of the participant’s eligible compensation, making the maximum matching contribution an amountequal to 5.625% of a participant’s eligible compensation. This matching contribution is in the form of Cabotcommon stock and is made on a quarterly basis.
Employee Stock Ownership Plan
Other than certain employees subject to collective bargaining agreements, all eligible employees ofCabot and its participating subsidiaries in the U.S. participate in the ESOP component of the plan. Underthe ESOP, which is 100% Company funded, 108,696.645 shares of Cabot common stock are allocated toparticipants’ accounts at the end of each quarter. These shares are allocated based on a pre-determinedformula. Cabot has established a minimum and maximum contribution percentage of total eligible pay of4% and 8%, respectively. The actual contribution percentage in any given quarter varies depending onCabot’s stock price on the last day of the relevant quarter, the total eligible compensation and the amount ofthe dividends allocated to participants. If the calculated contribution allocation falls below 4%, theCompany makes an additional contribution in the form of Cabot common stock to bring the totalcontribution to 4% for the participant. If the calculated contribution allocation exceeds 8% of eligiblecompensation, the excess shares are used to fund the Company match on the 401(k) contributions. If thereare still shares remaining after the Company match has been allocated, the remaining shares are allocated toall participants in the ESOP as additional contribution shares.
Supplemental Retirement Savings Plan
Cabot’s SRSP provides benefits to highly compensated employees in circumstances in which themaximum limits established under the Employee Retirement Income Security Act of 1974 (“ERISA”) andthe Internal Revenue Code prevent them from receiving Company matching and ESOP contributionsprovided under the qualified RSP. The SRSP is non-qualified and unfunded. See Note O for furtherinformation on the SRSP.
Defined Benefit Plans
Defined benefit plans provide pre-determined benefits to employees to be distributed for future useupon retirement. Measurement of defined benefit pension expense is based on assumptions used to value thedefined benefit pension liability (including assets) at the beginning of the year. The CBP and certain foreignpension plans generally use the straight-line method of amortization over five years for the unrecognized netgains and losses. Cabot used a September 30 measurement date for all U.S. and foreign plan obligations andassets in both fiscal 2009 and 2008. In prior years, Cabot used a June 30 measurement date for all U.S. andforeign plan obligations and assets. This change in measurement date was in response to a change inaccounting standards. The adoption of the change in measurement date on September 30, 2008 resulted in adecrease in retained earnings of $4 million and is reflected in the Consolidated Statements of Changes inStockholders’ Equity. Cabot is making all required contributions to the plans.
79

Cash Balance Plan
The CBP is a hybrid defined benefit pension plan, in which participants in the CBP accrue benefits inthe form of account balances, with a guaranteed rate of return and defined notional contributions. Thenotional contributions take the form of pay-based credits, which are computed as a percentage of eligiblepay and credited quarterly to participant accounts. Interest is credited quarterly based on the averageone-year Treasury bill rate for the month of November in the preceding calendar year. As of September 30,2009, 77 employees have “grandfathered” benefits under a traditional defined benefit formula, which, undercertain circumstances, may entitle them to benefits in addition to those accrued under the CBP formuladescribed above. Cabot contributes to the plan based on the fair value of plan assets and associated returnsand Cabot’s obligations and their timing.
Supplemental Cash Balance Plan
Cabot’s SCBP provides benefits to highly compensated employees in circumstances in which themaximum limits established under ERISA and the Internal Revenue Code prevent them from receivingsome of the benefits provided under the qualified CBP. This plan is non-qualified and unfunded. Theobligations in connection with the SCBP plan were $5 million and $6 million as of September 30, 2009 and2008, respectively, and have been recorded in other liabilities. Both the CBP and the SCBP qualify asdefined benefit plans.
Cabot provides benefits under defined benefit formulas to employees in certain non-U.S. locationsthrough several foreign defined benefit plans.
Postretirement Benefit Plans
Cabot also has postretirement benefit plans that provide certain health care and life insurance benefitsfor retired employees. Typical of such plans, the Cabot postretirement benefit plans are unfunded. Cabotfunds the plans as claims or insurance premiums come due. In order to limit its financial exposure, Cabotestablished a per retiree cap in the U.S. in 1992 on the amount it would contribute to retiree medical costs.
On September 30, 2009, Cabot announced changes effective January 1, 2010 to its postretirementmedical and life insurance plans. The plan changes significantly reduce the number of current employeeseligible to receive Company provided retiree life insurance and Company contributions towards retireemedical premiums in the future.
The Medicare Prescription Drug Improvement and Modernization Act of 2003 was passed by theUnited States Congress in March 2003. Cabot has determined that its U.S. postretirement health care planprovides a drug benefit that is actuarially equivalent to the Medicare Part D benefit. Under the plan’s costsharing arrangement with retirees, the subsidy that Cabot receives from Medicare is generally used to offseta portion of the costs of providing retiree medical coverage.
Measurement of postretirement benefit expense is based on actuarial assumptions used to value thepostretirement benefit liability at the beginning of the year. Assumed health care cost trend rates have asignificant effect on the amounts reported for the health care plans. The fiscal 2009 weighted-averageassumed health care cost trend rate is 8% for U.S. plans and 9% for foreign plans. The ultimate weighted-average health care cost trend rate has been designated as 5% for U.S. plans and 7% for foreign plans and isanticipated to be achieved during 2015 and 2016, respectively. A one-percentage point change in the 2009assumed health care cost trend rate would have the following effects:
1-Percentage-Point
Increase Decrease
U.S. Foreign U.S. Foreign
(Dollars in millions)
Effect on postretirement benefit obligation . . . . . . . . . . . . . . . . . . . . . . . . . . . . . $— $3 $— $(2)
80

The following provides a reconciliation of benefit obligations, plan assets, the funded status andweighted-average assumptions of the defined benefit pension and postretirement benefit plans.
Years Ended September 30
2009 2008 2009 2008
Pension Benefits Postretirement Benefits
U.S. Foreign U.S. Foreign U.S. Foreign U.S. Foreign
(Dollars in millions)
Change in Benefit Obligations:Benefit obligation at beginning of year . . . . $113 $207 $126 $250 $ 73 $ 14 $ 88 $ 15Service cost . . . . . . . . . . . . . . . . . . . . . . . . . . 4 5 4 6 2 — 2 —Interest cost . . . . . . . . . . . . . . . . . . . . . . . . . . 8 12 7 12 5 1 5 1Plan participants’ contribution . . . . . . . . . . . — 1 — 1 — — — —Foreign currency exchange rate changes . . . — — — (10) — (1) — (1)(Gain)/loss from changes in actuarialassumptions . . . . . . . . . . . . . . . . . . . . . . . . 26 21 (12) (36) 11 2 (17) —
Benefits paid(1) . . . . . . . . . . . . . . . . . . . . . . . (14) (15) (15) (21) (5) — (7) (1)Plan amendments . . . . . . . . . . . . . . . . . . . . . — — — — (17) — — —Curtailment (gain) loss . . . . . . . . . . . . . . . . . — (3) — — — (1) — —Other . . . . . . . . . . . . . . . . . . . . . . . . . . . . . . . — — 3 5 — — 2 —
Benefit obligations at end of year . . . . . . . . . $137 $228 $113 $207 $ 69 $ 15 $ 73 $ 14
Change in Plan Assets:Fair value of plan assets at beginningof year . . . . . . . . . . . . . . . . . . . . . . . . . . . . $109 $186 $144 $219 $ — $ — $ — $ —
Actual return on plan assets . . . . . . . . . . . . . 1 12 (20) (18) — — — —Employer contribution . . . . . . . . . . . . . . . . . 8 11 1 16 5 1 8 —Plan participants’ contribution . . . . . . . . . . . — 1 — 1 — — — —Foreign currency exchange rate changes . . . — (2) — (11) — — — —Benefits paid . . . . . . . . . . . . . . . . . . . . . . . . . (14) (15) (16) (21) (5) (1) (8) —
Fair value of plan assets at end of year . . . . . $104 $193 $109 $186 $ — $ — $ — $ —
Funded status . . . . . . . . . . . . . . . . . . . . . . . . $ (33) $ (35) $ (4) $ (21) $(69) $(15) $(73) $(14)
Recognized asset (liability) . . . . . . . . . . . . . . $ (33) $ (35) $ (4) $ (21) $(69) $(15) $(73) $(14)
(1) Included in this amount is $4 million and $2 million that the Company paid directly to participants inits defined benefit plans in fiscal 2009 and fiscal 2008, respectively.
Years Ended September 30
2009 2008 2009 2008
Pension Benefits Postretirement Benefits
U.S. Foreign U.S. Foreign U.S. Foreign U.S. Foreign
(Dollars in millions)
Net Amounts Recognized in theConsolidated Balance Sheets
Noncurrent assets . . . . . . . . . . . . . . . . . . . . . . $ — $ 9 $ 2 $ 9 $ — $ — $ — $ —Current liabilities . . . . . . . . . . . . . . . . . . . . . . — (1) (1) (1) (6) (1) (7) (1)Noncurrent liabilities . . . . . . . . . . . . . . . . . . . (33) (43) (5) (29) (63) (14) (66) (13)Accumulated other comprehensive(income) . . . . . . . . . . . . . . . . . . . . . . . . . . . 28 43 (7) 25 (18) 3 (14) 2
Net amount recognized in consolidatedbalance sheet . . . . . . . . . . . . . . . . . . . . . . . $ (5) 8 $(11) $ 4 $(87) $(12) $(87) $(12)
81
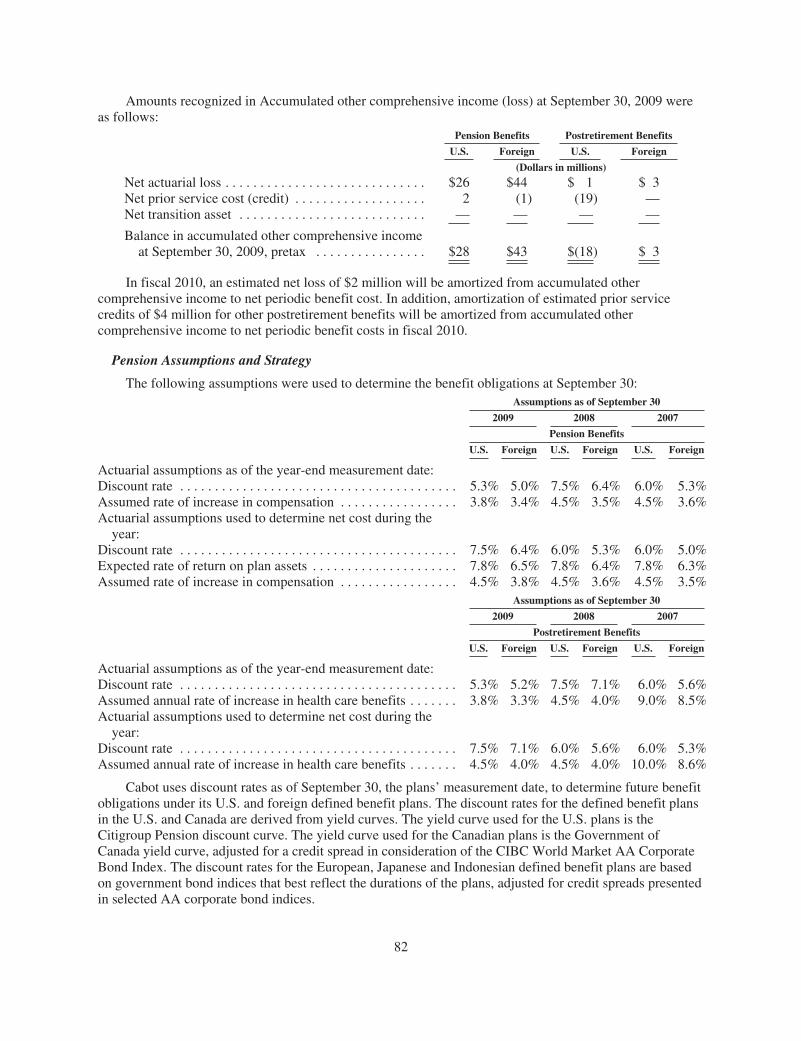
Amounts recognized in Accumulated other comprehensive income (loss) at September 30, 2009 wereas follows:
Pension Benefits Postretirement Benefits
U.S. Foreign U.S. Foreign
(Dollars in millions)
Net actuarial loss . . . . . . . . . . . . . . . . . . . . . . . . . . . . . $26 $44 $ 1 $ 3Net prior service cost (credit) . . . . . . . . . . . . . . . . . . . 2 (1) (19) —Net transition asset . . . . . . . . . . . . . . . . . . . . . . . . . . . — — — —
Balance in accumulated other comprehensive incomeat September 30, 2009, pretax . . . . . . . . . . . . . . . . $28 $43 $(18) $ 3
In fiscal 2010, an estimated net loss of $2 million will be amortized from accumulated othercomprehensive income to net periodic benefit cost. In addition, amortization of estimated prior servicecredits of $4 million for other postretirement benefits will be amortized from accumulated othercomprehensive income to net periodic benefit costs in fiscal 2010.
Pension Assumptions and Strategy
The following assumptions were used to determine the benefit obligations at September 30:Assumptions as of September 30
2009 2008 2007
Pension Benefits
U.S. Foreign U.S. Foreign U.S. Foreign
Actuarial assumptions as of the year-end measurement date:Discount rate . . . . . . . . . . . . . . . . . . . . . . . . . . . . . . . . . . . . . . . . 5.3% 5.0% 7.5% 6.4% 6.0% 5.3%Assumed rate of increase in compensation . . . . . . . . . . . . . . . . . 3.8% 3.4% 4.5% 3.5% 4.5% 3.6%Actuarial assumptions used to determine net cost during theyear:
Discount rate . . . . . . . . . . . . . . . . . . . . . . . . . . . . . . . . . . . . . . . . 7.5% 6.4% 6.0% 5.3% 6.0% 5.0%Expected rate of return on plan assets . . . . . . . . . . . . . . . . . . . . . 7.8% 6.5% 7.8% 6.4% 7.8% 6.3%Assumed rate of increase in compensation . . . . . . . . . . . . . . . . . 4.5% 3.8% 4.5% 3.6% 4.5% 3.5%
Assumptions as of September 30
2009 2008 2007
Postretirement Benefits
U.S. Foreign U.S. Foreign U.S. Foreign
Actuarial assumptions as of the year-end measurement date:Discount rate . . . . . . . . . . . . . . . . . . . . . . . . . . . . . . . . . . . . . . . . 5.3% 5.2% 7.5% 7.1% 6.0% 5.6%Assumed annual rate of increase in health care benefits . . . . . . . 3.8% 3.3% 4.5% 4.0% 9.0% 8.5%Actuarial assumptions used to determine net cost during theyear:
Discount rate . . . . . . . . . . . . . . . . . . . . . . . . . . . . . . . . . . . . . . . . 7.5% 7.1% 6.0% 5.6% 6.0% 5.3%Assumed annual rate of increase in health care benefits . . . . . . . 4.5% 4.0% 4.5% 4.0% 10.0% 8.6%
Cabot uses discount rates as of September 30, the plans’ measurement date, to determine future benefitobligations under its U.S. and foreign defined benefit plans. The discount rates for the defined benefit plansin the U.S. and Canada are derived from yield curves. The yield curve used for the U.S. plans is theCitigroup Pension discount curve. The yield curve used for the Canadian plans is the Government ofCanada yield curve, adjusted for a credit spread in consideration of the CIBC World Market AA CorporateBond Index. The discount rates for the European, Japanese and Indonesian defined benefit plans are basedon government bond indices that best reflect the durations of the plans, adjusted for credit spreads presentedin selected AA corporate bond indices.
82

The rates utilized are selected because they represent long-term, high quality, fixed incomebenchmarks that approximate the long-term nature of Cabot’s pension obligations and related payouts.
Cabot’s investment strategy for each of its defined benefit plans in the U.S. and abroad is generallybased on a set of investment objectives and policies that cover time horizons and risk tolerance levelsconsistent with plan liabilities. Periodic studies are performed to determine the asset mix that will meetpension obligations at a reasonable cost to the Company. The assets of the defined benefit plans arecomprised principally of investments in equity and high quality fixed income securities, which are broadlydiversified across the capitalization and style spectrum and are managed using both active and passivestrategies. The weighted average target asset allocation for the U.S. plan is 65% in equity and 35% in fixedincome. As of September 30, 2009, the weighted average target asset allocation for foreign plans was 45%in equity, 51% in fixed income and 4% in cash and other securities.
The Company’s defined benefit pension plans weighted-average asset allocations at September 30,2009 and 2008, by asset category are as follows:
Pension Assets
September 30
2009 2008
U.S. Foreign U.S. Foreign
Asset Category:Equity securities . . . . . . . . . . . . . . . . . . . . . . . . . . . . . . . . . . . . . . 67% 48% 64% 43%Debt securities . . . . . . . . . . . . . . . . . . . . . . . . . . . . . . . . . . . . . . . 33% 47% 36% 52%Cash and other securities . . . . . . . . . . . . . . . . . . . . . . . . . . . . . . . — 5% — 5%
Total . . . . . . . . . . . . . . . . . . . . . . . . . . . . . . . . . . . . . . . . . . . . . 100% 100% 100% 100%
To develop the expected long-term rate of return on plan assets assumption, the Company used acapital asset pricing model. The model considers the current level of expected returns on risk-freeinvestments comprised of government bonds, the historical level of the risk premium associated with theother asset classes in which the portfolio is invested, and the expectations for future returns for each assetclass. The expected return for each asset class was then weighted based on the target asset allocation todevelop the expected long-term rate of return for each plan.
Curtailments and settlements of employee benefit plans
The Company incurred five curtailments and three settlements of certain of its employee benefit plansduring fiscal 2009 which were primarily a result of the 2009 Global Restructuring Plan. During fiscal 2009,the Company recognized a net gain associated with these curtailments and settlements of approximately $2million.
83

Net periodic defined benefit pension and other postretirement benefit costs include the followingcomponents:
Years Ended September 30
2009 2008 2007 2009 2008 2007
Pension Benefits Postretirement Benefits
U.S. Foreign U.S. Foreign U.S. Foreign U.S. Foreign U.S. Foreign U.S. Foreign
(Dollars in millions)
Service cost . . . . . . . . . . . . . . . . . . $ 4 $ 5 $ 4 6 $ 5 $ 6 $ 2 — $ 2 — $ 2 —Interest cost . . . . . . . . . . . . . . . . . . 8 12 7 12 8 12 5 1 5 1 5 1Expected return on plan assets . . . . (9) (12) (9) (13) (10) (12) — — — — — —Amortization of prior servicecost . . . . . . . . . . . . . . . . . . . . . . . — — — — — — (1) — (1) — (1) —
Net losses (gains) . . . . . . . . . . . . . . (1) 1 — 2 — 4 — — — — — —Settlements or terminationbenefits . . . . . . . . . . . . . . . . . . . . — (1) — — — — (1) — — — — —
Net periodic benefit cost(benefit) . . . . . . . . . . . . . . . . . . . $ 2 $ 5 $ 2 $ 7 $ 3 $ 10 $ 5 $ 1 $ 6 $ 1 $ 6 $ 1
The accumulated benefit obligation was $131 million for the U.S. defined benefit plans and $213million for the foreign plans as of September 30, 2009 and $108 million for the U.S. defined benefit plansand $188 million for the foreign plans at September 30, 2008.
Estimated Future Benefit Payments
The Company expects that the following benefit payments will be made to plan participants in theyears from 2010 to 2019:
Pension BenefitsPostretirement
Benefits
U.S. Foreign U.S. Foreign
(Dollars in millions)
Years Ended:2010 . . . . . . . . . . . . . . . . . . . . . . . . . . . . . . . . . . . . . . $13 $15 $ 6 $12011 . . . . . . . . . . . . . . . . . . . . . . . . . . . . . . . . . . . . . . 10 17 6 12012 . . . . . . . . . . . . . . . . . . . . . . . . . . . . . . . . . . . . . . 9 15 6 12013 . . . . . . . . . . . . . . . . . . . . . . . . . . . . . . . . . . . . . . 9 16 6 12014 . . . . . . . . . . . . . . . . . . . . . . . . . . . . . . . . . . . . . . 10 15 6 12015-2019 . . . . . . . . . . . . . . . . . . . . . . . . . . . . . . . . . 56 81 28 4
Note O. Stock-Based Compensation
The Company has established equity compensation plans that provide stock-based compensation toeligible employees. The 2009 Long-Term Incentive Plan (the “2009 Plan”), which was approved by Cabot’sstockholders on March 12, 2009, authorizes the issuance of 6.4 million shares of common stock and is theCompany’s only equity incentive plan under which awards may currently be made to employees. Priorplans include the 2006 Long-Term Incentive Plan (the “2006 Plan”), the 1999 Equity Incentive Plan, andthe 1996 Equity Incentive Plan. Awards made under each of these prior plans remained outstanding atSeptember 30, 2009.
The terms of awards made under Cabot’s equity compensation plans are generally determined by theCompensation Committee of Cabot’s Board of Directors. Prior to 2009, the principal awards made underthese equity plans consisted of grants of restricted stock and stock options. The shares of restricted stockissued under these plans were generally purchased by the employee at a price equal to 30% of the marketprice of Cabot’s common stock on the date of grant, with vesting dates three years after the date of grant.
84
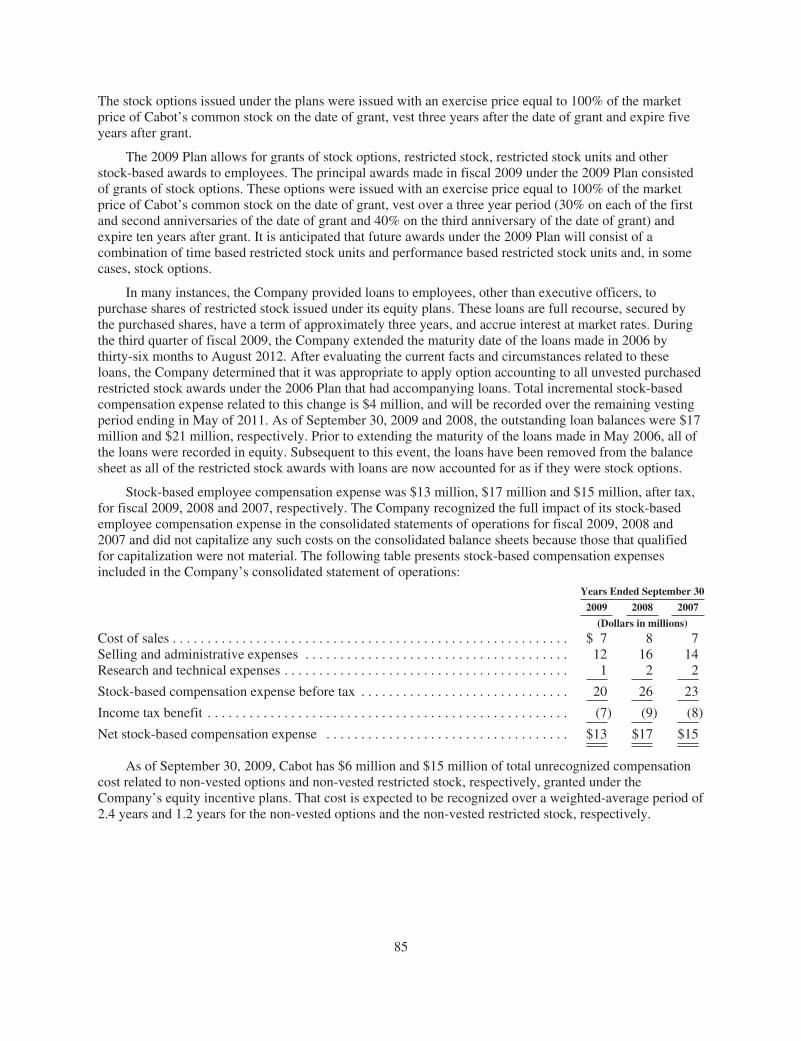
The stock options issued under the plans were issued with an exercise price equal to 100% of the marketprice of Cabot’s common stock on the date of grant, vest three years after the date of grant and expire fiveyears after grant.
The 2009 Plan allows for grants of stock options, restricted stock, restricted stock units and otherstock-based awards to employees. The principal awards made in fiscal 2009 under the 2009 Plan consistedof grants of stock options. These options were issued with an exercise price equal to 100% of the marketprice of Cabot’s common stock on the date of grant, vest over a three year period (30% on each of the firstand second anniversaries of the date of grant and 40% on the third anniversary of the date of grant) andexpire ten years after grant. It is anticipated that future awards under the 2009 Plan will consist of acombination of time based restricted stock units and performance based restricted stock units and, in somecases, stock options.
In many instances, the Company provided loans to employees, other than executive officers, topurchase shares of restricted stock issued under its equity plans. These loans are full recourse, secured bythe purchased shares, have a term of approximately three years, and accrue interest at market rates. Duringthe third quarter of fiscal 2009, the Company extended the maturity date of the loans made in 2006 bythirty-six months to August 2012. After evaluating the current facts and circumstances related to theseloans, the Company determined that it was appropriate to apply option accounting to all unvested purchasedrestricted stock awards under the 2006 Plan that had accompanying loans. Total incremental stock-basedcompensation expense related to this change is $4 million, and will be recorded over the remaining vestingperiod ending in May of 2011. As of September 30, 2009 and 2008, the outstanding loan balances were $17million and $21 million, respectively. Prior to extending the maturity of the loans made in May 2006, all ofthe loans were recorded in equity. Subsequent to this event, the loans have been removed from the balancesheet as all of the restricted stock awards with loans are now accounted for as if they were stock options.
Stock-based employee compensation expense was $13 million, $17 million and $15 million, after tax,for fiscal 2009, 2008 and 2007, respectively. The Company recognized the full impact of its stock-basedemployee compensation expense in the consolidated statements of operations for fiscal 2009, 2008 and2007 and did not capitalize any such costs on the consolidated balance sheets because those that qualifiedfor capitalization were not material. The following table presents stock-based compensation expensesincluded in the Company’s consolidated statement of operations:
Years Ended September 30
2009 2008 2007
(Dollars in millions)
Cost of sales . . . . . . . . . . . . . . . . . . . . . . . . . . . . . . . . . . . . . . . . . . . . . . . . . . . . . . . . . $ 7 8 7Selling and administrative expenses . . . . . . . . . . . . . . . . . . . . . . . . . . . . . . . . . . . . . . 12 16 14Research and technical expenses . . . . . . . . . . . . . . . . . . . . . . . . . . . . . . . . . . . . . . . . . 1 2 2
Stock-based compensation expense before tax . . . . . . . . . . . . . . . . . . . . . . . . . . . . . . 20 26 23
Income tax benefit . . . . . . . . . . . . . . . . . . . . . . . . . . . . . . . . . . . . . . . . . . . . . . . . . . . . (7) (9) (8)
Net stock-based compensation expense . . . . . . . . . . . . . . . . . . . . . . . . . . . . . . . . . . . $13 $17 $15
As of September 30, 2009, Cabot has $6 million and $15 million of total unrecognized compensationcost related to non-vested options and non-vested restricted stock, respectively, granted under theCompany’s equity incentive plans. That cost is expected to be recognized over a weighted-average period of2.4 years and 1.2 years for the non-vested options and the non-vested restricted stock, respectively.
85

Equity Incentive Plan Activity
The following table summarizes the total stock option and the restricted stock activity in the equityincentive plans for fiscal 2009:
September 30, 2009
Stock Options Restricted Stock
TotalOptions
WeightedAverageExercisePrice
WeightedAverageGrant
Date FairValue
RestrictedShares
WeightedAverage
Grant DateFair Value
(Shares in thousands)
Outstanding at September 30, 2008 . . . . . . . . . . . . . . . . . 533 $32.71 $ 8.81 2,501 $22.97Granted . . . . . . . . . . . . . . . . . . . . . . . . . . . . . . . . . . . . . . . 1,379 17.11 3.98 3 9.56Exercised/Vested . . . . . . . . . . . . . . . . . . . . . . . . . . . . . . . — — — (714) 20.86Cancelled/Forfeited . . . . . . . . . . . . . . . . . . . . . . . . . . . . . (128) 33.25 10.51 (238) 21.17
Outstanding at September 30, 2009 . . . . . . . . . . . . . . . . . 1,784 20.61 4.96 1,552 24.20
Exercisable at September 30, 2009 . . . . . . . . . . . . . . . . . 186 30.84
Stock Options
The following table summarizes information related to the outstanding and vested options onSeptember 30, 2009:
OptionsOutstanding
VestedOptions
Aggregate Intrinsic Value (dollars in millions) . . . . . . . . . . . . . . . $4 N/AWeighted Average Remaining Contractual Term (in years) . . . . . 4 1
The aggregate intrinsic value in the table above represents the total pre-tax intrinsic value, based on theCompany’s closing common stock price of $23.11 on September 30, 2009, which would have been received bythe option holders had all option holders exercised their options and immediately sold their shares on that date.
As of September 30, 2009, the Company expects approximately 1,514,000 options to vest with aweighted average remaining contractual life of 8.9 years and a weighted average exercise price of $19.42.
There were no options exercised in fiscal 2009. The intrinsic value of options exercised during fiscal2008 and 2007 were less than $1 million and $5 million, respectively.
The Company settles employee stock option exercises with newly issued common shares. The total fairvalue of the options vested during fiscal 2009, 2008 and 2007 were $2 million, $4 million and $5 million,respectively. The Company uses the Black-Scholes option-pricing model to estimate the fair value of theoptions at the grant date. The estimated weighted average grant date fair values of options granted duringfiscal 2009, 2008 and 2007 were $3.98, $7.30 and $11.87 per option, respectively. The fair values on thegrant date (including the application of option accounting to the restricted stock awards as noted previously)were calculated using the following weighted-average assumptions:
Years Ended September 30
2009 2008 2007
Expected stock price volatility . . . . . . . . . . . . . . . . . . . . . . . . . 39% 30% 26%Risk free interest rate . . . . . . . . . . . . . . . . . . . . . . . . . . . . . . . . 0.4% 3.1% 4.8%Expected life of options (years) . . . . . . . . . . . . . . . . . . . . . . . . 6 4 4Expected annual dividends per share . . . . . . . . . . . . . . . . . . . . $0.72 $0.72 $0.72Loan Interest Rate . . . . . . . . . . . . . . . . . . . . . . . . . . . . . . . . . . N/A 4.8% 6.8%
The expected stock price volatility assumption was determined using the historical volatility of theCompany’s common stock over the expected life of the option.
86

Restricted Stock
The value of restricted stock awards is an intrinsic value derived by calculating the difference betweenthe share price and the purchase price at the date of the grant. The estimated weighted average grant datefair values of restricted stock awards granted during fiscal 2009, 2008 and 2007 were $9.56, $21.34 and$29.62, respectively.
Supplemental Retirement Savings Plan
Cabot’s SRSP provides benefits to highly compensated employees in circumstances in which themaximum limits established under ERISA and the Internal Revenue Code prevent them from receiving allof the Company matching and ESOP contributions that would otherwise be provided under the qualifiedRSP. The SRSP is non-qualified and unfunded. Contributions under the SRSP are treated as if invested inCabot common stock. The majority of the distributions made under the SRSP are required to be paid fromshares of Cabot common stock held in treasury. The remaining distributions, which relate to certaingrandfathered accounts, will be paid in cash based on the market price of Cabot common stock at the timeof distribution. The aggregate value of the accounts that will be paid out in stock, which is equivalent toapproximately 171,000 shares of Cabot common stock as of September 30, 2009, is reflected at historic costin stockholders’ equity, and the aggregate value of the accounts that will be paid in cash, which isapproximately $1 million as of September 30, 2009, is reflected in other long-term liabilities andmarked-to-market quarterly.
Note P. Restructurings
Cabot’s restructuring activities were recorded in the consolidated statements of operations as follows.Years Ended September 30
2009 2008 2007
(Dollars in millions)
Cost of sales . . . . . . . . . . . . . . . . . . . . . . . . . . . . . . . . . . . . . . . . 84 4 12Selling and administrative expense . . . . . . . . . . . . . . . . . . . . . . . 5 2 —Research and development expense . . . . . . . . . . . . . . . . . . . . . . 2 — —
Total . . . . . . . . . . . . . . . . . . . . . . . . . . . . . . . . . . . . . . . . . . . . . . $91 $ 6 $12
Details of the restructuring activity and the reserves for fiscal 2009 and 2008 were as follows.
Severanceand
EmployeeBenefits
EnvironmentalRemediation
Sale ofAltonaLand
AssetImpairments
andAcceleratedDepreciation Total
(Dollars in millions)
Reserve at September 30, 2007 . . . . . . . . . . . . . . . . . . . $ 4 $— $ — $ — $ 4Charges (benefits) . . . . . . . . . . . . . . . . . . . . . . . . . . . 9 1 (18) 14 6Costs charged against assets . . . . . . . . . . . . . . . . . . . — — — (14) (14)Proceeds from sale . . . . . . . . . . . . . . . . . . . . . . . . . . . — — 18 — 18Cash paid . . . . . . . . . . . . . . . . . . . . . . . . . . . . . . . . . . (11) — — — (11)
Reserve at September 30, 2008 . . . . . . . . . . . . . . . . . . . $ 2 $ 1 $ — $ — $ 3Charges (benefits) . . . . . . . . . . . . . . . . . . . . . . . . . . . 36 8 — 47 91Costs charged against assets . . . . . . . . . . . . . . . . . . . — — — (47) (47)Cash paid . . . . . . . . . . . . . . . . . . . . . . . . . . . . . . . . . . (22) (8) — — (30)Foreign currency translation adjustment . . . . . . . . . . 4 — — — 4
Reserve at September 30, 2009 . . . . . . . . . . . . . . . . . . . $ 20 $ 1 $ — $ — $ 21
87
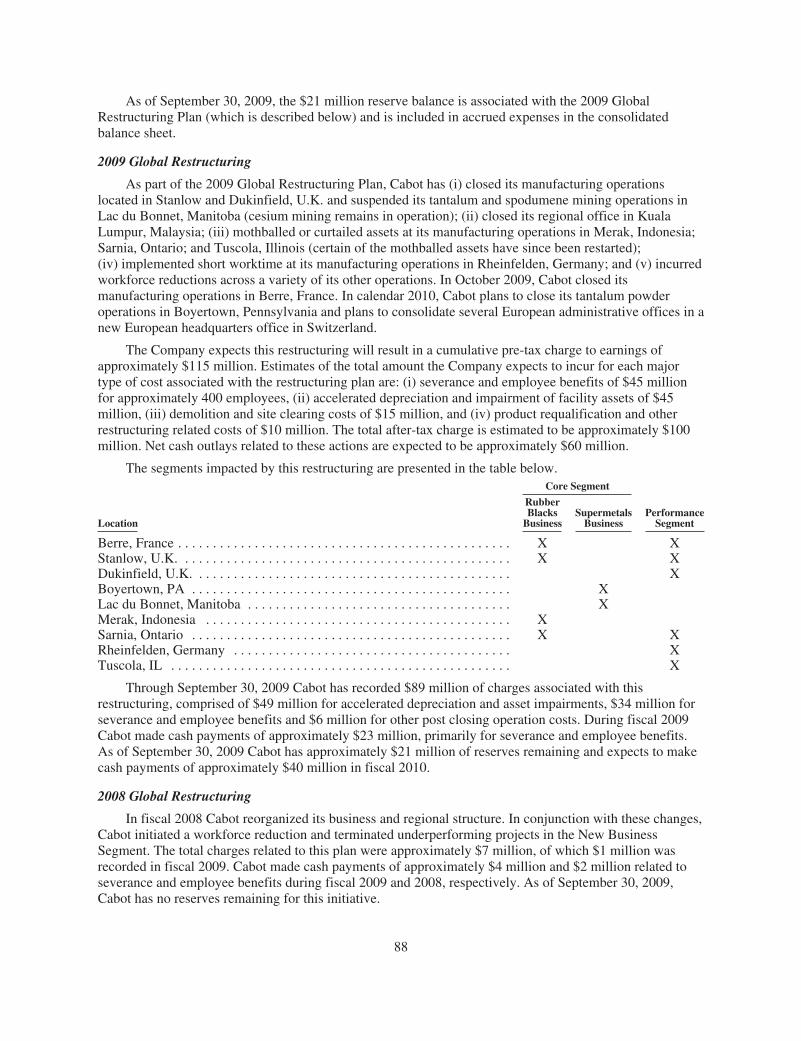
As of September 30, 2009, the $21 million reserve balance is associated with the 2009 GlobalRestructuring Plan (which is described below) and is included in accrued expenses in the consolidatedbalance sheet.
2009 Global Restructuring
As part of the 2009 Global Restructuring Plan, Cabot has (i) closed its manufacturing operationslocated in Stanlow and Dukinfield, U.K. and suspended its tantalum and spodumene mining operations inLac du Bonnet, Manitoba (cesium mining remains in operation); (ii) closed its regional office in KualaLumpur, Malaysia; (iii) mothballed or curtailed assets at its manufacturing operations in Merak, Indonesia;Sarnia, Ontario; and Tuscola, Illinois (certain of the mothballed assets have since been restarted);(iv) implemented short worktime at its manufacturing operations in Rheinfelden, Germany; and (v) incurredworkforce reductions across a variety of its other operations. In October 2009, Cabot closed itsmanufacturing operations in Berre, France. In calendar 2010, Cabot plans to close its tantalum powderoperations in Boyertown, Pennsylvania and plans to consolidate several European administrative offices in anew European headquarters office in Switzerland.
The Company expects this restructuring will result in a cumulative pre-tax charge to earnings ofapproximately $115 million. Estimates of the total amount the Company expects to incur for each majortype of cost associated with the restructuring plan are: (i) severance and employee benefits of $45 millionfor approximately 400 employees, (ii) accelerated depreciation and impairment of facility assets of $45million, (iii) demolition and site clearing costs of $15 million, and (iv) product requalification and otherrestructuring related costs of $10 million. The total after-tax charge is estimated to be approximately $100million. Net cash outlays related to these actions are expected to be approximately $60 million.
The segments impacted by this restructuring are presented in the table below.Core Segment
Location
RubberBlacksBusiness
SupermetalsBusiness
PerformanceSegment
Berre, France . . . . . . . . . . . . . . . . . . . . . . . . . . . . . . . . . . . . . . . . . . . . . . . . X XStanlow, U.K. . . . . . . . . . . . . . . . . . . . . . . . . . . . . . . . . . . . . . . . . . . . . . . . X XDukinfield, U.K. . . . . . . . . . . . . . . . . . . . . . . . . . . . . . . . . . . . . . . . . . . . . . XBoyertown, PA . . . . . . . . . . . . . . . . . . . . . . . . . . . . . . . . . . . . . . . . . . . . . . XLac du Bonnet, Manitoba . . . . . . . . . . . . . . . . . . . . . . . . . . . . . . . . . . . . . . XMerak, Indonesia . . . . . . . . . . . . . . . . . . . . . . . . . . . . . . . . . . . . . . . . . . . . XSarnia, Ontario . . . . . . . . . . . . . . . . . . . . . . . . . . . . . . . . . . . . . . . . . . . . . . X XRheinfelden, Germany . . . . . . . . . . . . . . . . . . . . . . . . . . . . . . . . . . . . . . . . XTuscola, IL . . . . . . . . . . . . . . . . . . . . . . . . . . . . . . . . . . . . . . . . . . . . . . . . . X
Through September 30, 2009 Cabot has recorded $89 million of charges associated with thisrestructuring, comprised of $49 million for accelerated depreciation and asset impairments, $34 million forseverance and employee benefits and $6 million for other post closing operation costs. During fiscal 2009Cabot made cash payments of approximately $23 million, primarily for severance and employee benefits.As of September 30, 2009 Cabot has approximately $21 million of reserves remaining and expects to makecash payments of approximately $40 million in fiscal 2010.
2008 Global Restructuring
In fiscal 2008 Cabot reorganized its business and regional structure. In conjunction with these changes,Cabot initiated a workforce reduction and terminated underperforming projects in the New BusinessSegment. The total charges related to this plan were approximately $7 million, of which $1 million wasrecorded in fiscal 2009. Cabot made cash payments of approximately $4 million and $2 million related toseverance and employee benefits during fiscal 2009 and 2008, respectively. As of September 30, 2009,Cabot has no reserves remaining for this initiative.
88

Closure of Waverly, West Virginia Carbon Black Facility
Cabot ceased manufacturing at its carbon black manufacturing facility in Waverly, West Virginia inMarch 2008. Through September 30, 2009, Cabot has recorded approximately $26 million of chargesassociated with this restructuring, of which approximately $2 million was recorded during fiscal 2009. Thefiscal 2009 charges were primarily related to site remediation costs. Cabot made cash payments of $3million and $6 million related to site remediation and severance and employee benefits in fiscal 2009 and2008, respectively. As of September 30, 2009, Cabot has no reserves remaining for this initiative.
Other Restructuring
Other restructuring activities included a $1 million benefit related to the previous closure of theCompany’s facility in Zierbena, Spain.
Note Q. Stockholders’ Equity
In May 2007, the Board of Directors authorized Cabot to repurchase up to five million shares ofCabot’s common stock in the open market or in privately negotiated transactions. On September 14, 2007,the Board increased this share repurchase authorization to 10 million shares. This authority does not have aset expiration date. During fiscal 2009, 3,474 shares were repurchased under the May 2007 authorization.During fiscal 2008, 1,178,034 shares were repurchased under the May 2007 authorization and a priorauthorization. As of September 30, 2009, approximately 4.3 million shares remain available for repurchaseunder the current authorization.
In November 1988, Cabot sold 75,336 shares of its Series B ESOP Convertible Preferred Stock to theESOP for cash at a price of $1,000 per share. Each share of the Series B ESOP Convertible Preferred Stockwas convertible into 146.4 shares of Cabot’s common stock. For purposes of calculating diluted earningsper share, the outstanding shares of Series B ESOP Convertible Preferred Stock were assumed to beconverted to common stock based on the 146.4 conversion rate.
On July 20, 2007, there were 32,095 shares of Series B ESOP Convertible Preferred Stock outstanding,which were converted into approximately 4.7 million shares of the Company’s common stock. Thisconversion did not change the Company’s diluted earnings per share (“EPS”) as all preferred shares hadbeen considered converted for purposes of the diluted EPS calculation. However, the increase in the numberof outstanding shares of common stock decreased the Company’s basic EPS for the year endedSeptember 30, 2007 by $0.03 per share.
Cabot is the guarantor of the outstanding debt held by the ESOP as described in Note J. Cabotcontributed $4 million during each of fiscal 2009, 2008 and 2007 to the ESOP to service the debt.Dividends on ESOP shares used for debt service were $3 million during each of fiscal 2009, 2008 and 2007.In addition, interest incurred on the ESOP debt was $2 million during fiscal 2009 and $3 million duringeach of fiscal 2008 and 2007.
During fiscal 2009, 2008, and 2007, Cabot paid cash dividends of $0.72 per share of common stock.During fiscal 2007, Cabot paid cash dividends of $58.13 per share of Series B ESOP Convertible PreferredStock. All of Cabot’s outstanding preferred stock was converted to common stock during the fourth quarterof fiscal 2007. Accordingly, no dividends were paid on preferred stock during fiscal 2009 or fiscal 2008.
89

Accumulated Other Comprehensive Income
The balance of related after-tax components comprising accumulated other comprehensive income aresummarized below:
September 30
2009 2008
(Dollars in millions)
Foreign currency translation adjustments . . . . . . . . . . . . . . . . . . . . . $101 $79Unrealized holding gain on investments and derivativeinstruments . . . . . . . . . . . . . . . . . . . . . . . . . . . . . . . . . . . . . . . . . . 1 2
Change in funded status of retirement plans . . . . . . . . . . . . . . . . . . (42) (6)
Accumulated other comprehensive income . . . . . . . . . . . . . . . . . . . $ 60 $75
Note R. Earnings Per Share
Basic and diluted earnings per share (“EPS”) were calculated as follows:Years Ended September 30
2009 2008 2007
(In millions, exceptper share amounts)
Basic EPS:(Loss) income available to common shares (numerator) . . . . . . . . . . . . . . . . . . . . $ (77) $ 86 $ 128
Weighted-average common shares outstanding . . . . . . . . . . . . . . . . . . . . . . . . . . . 65 65 65Less: contingently issuable shares(1) . . . . . . . . . . . . . . . . . . . . . . . . . . . . . . . . . . . . (2) (2) (3)
Adjusted weighted-average shares (denominator) . . . . . . . . . . . . . . . . . . . . . . . . . 63 63 62
Basic EPS . . . . . . . . . . . . . . . . . . . . . . . . . . . . . . . . . . . . . . . . . . . . . . . . . . . . . . . . $(1.22) $1.37 $2.03
(Loss) income per share from discontinued businesses . . . . . . . . . . . . . . . . . . . . . . . (0.01) — 0.03
Net (loss) income per share—basic . . . . . . . . . . . . . . . . . . . . . . . . . . . . . . . . . . . . . . $(1.23) $1.37 $2.06
Diluted EPS:(Loss) income available to common shares . . . . . . . . . . . . . . . . . . . . . . . . . . . . . . $ (77) $ 86 $ 128Dividends on preferred stock(2) . . . . . . . . . . . . . . . . . . . . . . . . . . . . . . . . . . . . . . . . — — 1
(Loss) income available to common shares plus assumed conversions(numerator) . . . . . . . . . . . . . . . . . . . . . . . . . . . . . . . . . . . . . . . . . . . . . . . . . . . . . $ (77) $ 86 $ 129
Weighted-average common shares outstanding . . . . . . . . . . . . . . . . . . . . . . . . . . . 63 63 62Effect of dilutive securities:Assumed conversion of preferred stock . . . . . . . . . . . . . . . . . . . . . . . . . . . . . . . — — 4Common shares issuable(3)(4) . . . . . . . . . . . . . . . . . . . . . . . . . . . . . . . . . . . . . . . . — 1 2
Adjusted weighted-average shares (denominator) . . . . . . . . . . . . . . . . . . . . . . . . . 63 64 68
Diluted EPS . . . . . . . . . . . . . . . . . . . . . . . . . . . . . . . . . . . . . . . . . . . . . . . . . . . . . . . $(1.22) $1.34 $1.87
(Loss) income per share from discontinued businesses . . . . . . . . . . . . . . . . . . . . . (0.01) — 0.03
Net (loss) income per share—diluted . . . . . . . . . . . . . . . . . . . . . . . . . . . . . . . . . . . $(1.23) $1.34 $1.90
(1) Represents outstanding unvested restricted stock and vested stock with outstanding loans from Cabotissued under Cabot’s Equity Incentive Plans.
(2) All of Cabot’s outstanding preferred stock was converted to common stock during the fourth quarter offiscal 2007. Accordingly, no dividends were paid on preferred stock during fiscal 2009 or fiscal 2008.Dividends totaling $1 million were paid on preferred stock during fiscal 2007.
90

(3) Represents incremental shares from the (i) assumed exercise of stock options; (ii) assumed issuance ofshares pursuant to the Company’s SERP obligation to employees; and (iii) outstanding unvestedrestricted stock and vested stock with outstanding loans from Cabot issued under Cabot’s EquityIncentive Plans.
(4) For fiscal 2009, 3,662,000 options to purchase shares of common stock, unvested restricted stock andvested stock with outstanding loans from Cabot were excluded from the calculation of diluted earningsper share as those shares would have been antidilutive due to the Company’s net loss position. Forfiscal 2008 and fiscal 2007, options to purchase 408,000 and 34,000 shares of common stock,respectively, were not included in the calculation of diluted earnings per share because those options’exercise prices were greater than the average market price of Cabot common stock for that period.
Note S. Income Taxes
Income (loss) before income taxes was as follows:Years Ended September 30
2009 2008 2007
(Dollars in millions)
Income (loss) from continuing operations:Domestic . . . . . . . . . . . . . . . . . . . . . . . . . . . . . . . . . . . $ (78) $ (63) $ (30)Foreign . . . . . . . . . . . . . . . . . . . . . . . . . . . . . . . . . . . . (24) 175 198
$(102) $112 $168
Taxes (tax benefits) on income consisted of the following:Years Ended September 30
2009 2008 2007
(Dollars in millions)
U.S. federal and state:Current . . . . . . . . . . . . . . . . . . . . . . . . . . . . . . . . . . . . $ (2) $ — $ 3Deferred . . . . . . . . . . . . . . . . . . . . . . . . . . . . . . . . . . . (34) (35) (33)
Total . . . . . . . . . . . . . . . . . . . . . . . . . . . . . . . . . . . . (36) (35) (30)
Foreign:Current . . . . . . . . . . . . . . . . . . . . . . . . . . . . . . . . . . . . 30 44 62Deferred . . . . . . . . . . . . . . . . . . . . . . . . . . . . . . . . . . . (16) 5 6
Total . . . . . . . . . . . . . . . . . . . . . . . . . . . . . . . . . . . . 14 49 68
Total U.S. and foreign . . . . . . . . . . . . . . . . . . . . $(22) $ 14 $ 38
91

The provision for income taxes differed from the provision for income taxes as calculated using theU.S. statutory rate as follows:
Years Ended September 30
2009 2008 2007
(Dollars in millions)
Continuing Operations:Computed tax expense at the federal statutory rate . . . . . . . . . . . . . . . . . . . . $(36) $ 39 $ 59Foreign income:Impact of taxation at different rates, repatriation and other . . . . . . . . . . . . (4) (23) (22)Impact of credits for reinvested earnings . . . . . . . . . . . . . . . . . . . . . . . . . . — (3) —Impact of foreign losses for which a current tax benefit is notavailable . . . . . . . . . . . . . . . . . . . . . . . . . . . . . . . . . . . . . . . . . . . . . . . . . 30 12 6
State taxes, net of federal effect . . . . . . . . . . . . . . . . . . . . . . . . . . . . . . . . . . . — — —Extraterritorial income exclusion/qualified production activity income . . . . — — (1)U.S. and state benefits from research and experimentation activities . . . . . . (4) (1) (4)Tax audit settlements . . . . . . . . . . . . . . . . . . . . . . . . . . . . . . . . . . . . . . . . . . . (9) (8) (3)Reversal of valuation allowance . . . . . . . . . . . . . . . . . . . . . . . . . . . . . . . . . . . 1 (4) —Other, net . . . . . . . . . . . . . . . . . . . . . . . . . . . . . . . . . . . . . . . . . . . . . . . . . . . . — 2 3
Total Continuing Operations . . . . . . . . . . . . . . . . . . . . . . . . . . . . . . . . . . . $(22) $ 14 $ 38
Significant components of deferred income taxes were as follows:September 30
2009 2008
(Dollars in millions)
Deferred tax assets:Depreciation and amortization . . . . . . . . . . . . . . . . . . . . . . . . . . . . . . . . . . . . . . . . . . . . . $ 45 $ 26Pension and other benefits . . . . . . . . . . . . . . . . . . . . . . . . . . . . . . . . . . . . . . . . . . . . . . . . . 77 85Environmental liabilities . . . . . . . . . . . . . . . . . . . . . . . . . . . . . . . . . . . . . . . . . . . . . . . . . . 2 4Inventory . . . . . . . . . . . . . . . . . . . . . . . . . . . . . . . . . . . . . . . . . . . . . . . . . . . . . . . . . . . . . . 15 13Deferred expenses . . . . . . . . . . . . . . . . . . . . . . . . . . . . . . . . . . . . . . . . . . . . . . . . . . . . . . . 24 24Net operating loss and other tax carry-forwards . . . . . . . . . . . . . . . . . . . . . . . . . . . . . . . . 245 168Other . . . . . . . . . . . . . . . . . . . . . . . . . . . . . . . . . . . . . . . . . . . . . . . . . . . . . . . . . . . . . . . . . 32 27
Subtotal . . . . . . . . . . . . . . . . . . . . . . . . . . . . . . . . . . . . . . . . . . . . . . . . . . . . . . . . . . . . . 440 347Valuation allowances . . . . . . . . . . . . . . . . . . . . . . . . . . . . . . . . . . . . . . . . . . . . . . . . . . . . . (120) (87)
Total deferred tax assets . . . . . . . . . . . . . . . . . . . . . . . . . . . . . . . . . . . . . . . . . . . . . . . . $ 320 $260
September 30
2009 2008
(Dollars in millions)
Deferred tax liabilities:Depreciation and amortization . . . . . . . . . . . . . . . . . . . . . . . . . . . . . . . . . . . . . . . . . . . . . $ 33 $ 37Pension and other benefits . . . . . . . . . . . . . . . . . . . . . . . . . . . . . . . . . . . . . . . . . . . . . . . . . 6 18Unremitted earnings of non-U.S. subsidiaries . . . . . . . . . . . . . . . . . . . . . . . . . . . . . . . . . . 21 16Inventory . . . . . . . . . . . . . . . . . . . . . . . . . . . . . . . . . . . . . . . . . . . . . . . . . . . . . . . . . . . . . . 2 3Other . . . . . . . . . . . . . . . . . . . . . . . . . . . . . . . . . . . . . . . . . . . . . . . . . . . . . . . . . . . . . . . . . 7 8
Total deferred tax liabilities . . . . . . . . . . . . . . . . . . . . . . . . . . . . . . . . . . . . . . . . . . . . . . $ 69 $ 82
In fiscal 2009, Cabot recorded $13 million of net tax benefits in net income from continuing operationsrelated to tax settlements, the reenactment of the U.S. research and experimentation credit, and reinvestmenttax credits.
92

In fiscal 2008, Cabot recorded $11 million of net tax benefits in net income from continuing operationsrelated to tax settlements and reinvestment tax credits.
In fiscal 2007, Cabot recorded $3 million of tax benefits in net income from continuing operationsrelated to tax settlements in various jurisdictions. In addition, Cabot recorded $3 million in tax benefits indiscontinued operations related to legal and tax settlements.
Cabot has filed its tax returns in accordance with the tax laws in each jurisdiction and maintains taxreserves for differences between tax obligations as reflected in its tax filings and potential final taxobligations for exposures that can be reasonably estimated. As of September 30, 2009, the Company hasrecorded $54 million for these exposures. In the event that actual results are significantly different fromthese estimates, Cabot’s provision for income taxes could be significantly impacted.
Approximately $718 million of net operating loss carryforwards (“NOLs”) and $74 million of other taxcredit carryforwards remain at September 30, 2009. The benefits of these carryforwards are dependent upontaxable income during the carryforward period in the jurisdictions where they arose. Accordingly, avaluation allowance has been provided where management has determined that it is more likely than notthat the carryforwards will not be utilized. The following table provides detail surrounding the expirationdates of these carryforwards.
NOLs Credits
(Dollars in millions)
Expiration periods2010 to 2016 . . . . . . . . . . . . . . . . . . . . . . . . . . . . . . . . . . . . . . . . . . . . . . . . . . . . . . . . . . . $163 $ —2017 and thereafter . . . . . . . . . . . . . . . . . . . . . . . . . . . . . . . . . . . . . . . . . . . . . . . . . . . . . . 207 69Indefinite carryforward . . . . . . . . . . . . . . . . . . . . . . . . . . . . . . . . . . . . . . . . . . . . . . . . . . . 348 5
Total . . . . . . . . . . . . . . . . . . . . . . . . . . . . . . . . . . . . . . . . . . . . . . . . . . . . . . . . . . . . . . . $718 $ 74
Provisions have not been made for U.S. income taxes or non-U.S. withholding taxes on approximately$725 million of undistributed earnings of non-U.S. subsidiaries, as these earnings are consideredindefinitely reinvested. These earnings could become subject to U.S. income taxes and non-U.S.withholding taxes if they were remitted as dividends, were loaned to Cabot Corporation or a U.S.subsidiary, or if Cabot should sell its stock in the subsidiaries.
As of September 30, 2009, Cabot has net deferred tax assets of $251 million, $209 million of which arein the U.S. The Company believes that the U.S. net deferred tax assets are more likely than not recoverablethrough expected future taxable operating income in the U.S. However, recovery is dependent on achievingthe forecast of future taxable operating income over an extended period of time. As of September 30, 2009,the Company would need to generate approximately $597 million in cumulative future U.S. taxableoperating income at various times over approximately 20 years to realize all of its net U.S. deferred taxassets. The Company also believes that it is more likely than not that Cabot will recover the $42 millionnon-U.S. net deferred tax asset which will require approximately $120 million of future taxable operatingincome to be generated by various non-U.S. subsidiaries. The Company reviews its forecast in relation toactual results and expected trends on a quarterly basis. Failure to achieve operating income targets maychange the Company’s assessment regarding the recoverability of Cabot’s net deferred tax assets and suchchange could result in a valuation allowance being recorded against some or all of the Company’s netdeferred tax assets. Any increase in a valuation allowance would result in additional income tax expense,lower stockholders’ equity and could have a significant impact on Cabot’s earnings in future periods.
The valuation allowance at September 30, 2009 and 2008 represents management’s best estimate of thenon-realizable portion of the net deferred tax assets. The valuation allowance increased in certain taxjurisdictions by $33 million in 2009 due to the uncertainty of the ultimate realization of certain future taxbenefits and net operating losses reflected as deferred tax assets.
93

The preparation of consolidated financial statements in conformity with generally accepted accountingprinciples requires the Company to make estimates and assumptions that affect the reported amount oftax-related assets and liabilities and income tax provisions. Cabot assesses the recoverability of its deferredtax assets on an ongoing basis. In making this assessment, Cabot is required to consider all availablepositive and negative evidence to determine whether, based on such evidence, it is more likely than not thatsome portion or all of its net deferred assets will be realized in future periods. This assessment requiressignificant judgment. In addition, the Company has made significant estimates involving current anddeferred income taxes. Cabot does not recognize current and future tax benefits until it is deemed probablethat certain tax positions will be sustained.
Cabot has filed its tax returns in accordance with the tax laws in each jurisdiction and maintains taxreserves for differences between tax obligations as reflected in its tax filings and potential final taxobligations for exposures that can be reasonably estimated. Prior to fiscal 2007, the Company followed aprevious accounting standard in calculating its accrual for unrecognized tax benefits. As of October 1, 2007,it adopted the newly promulgated standard, reflecting the impact in the consolidated statement of changes instockholders’ equity.
As of September 30, 2009, the total amount of unrecognized tax benefits was $54 million. In addition,accruals of $5 million and $13 million have been recorded for penalties and interest, respectively, as ofSeptember 30, 2009. If the unrecognized tax benefits were recognized at a given point in time, there wouldbe an approximately $70 million favorable impact on the Company’s tax provision.
A reconciliation of the beginning and ending amount of unrecognized tax benefits for the twelvemonths ended September 30, 2009 is as follows:
(Dollars in millions)
Balance at September 30, 2008 . . . . . . . . . . . . . . . . . . . . . . . . . . . . . . . . . . . . . . . . . . . . . . . $ 80Additions based on tax positions related to the current year . . . . . . . . . . . . . . . . . . . . . . 7Additions for tax positions of prior years . . . . . . . . . . . . . . . . . . . . . . . . . . . . . . . . . . . . . 4Reductions for tax positions of prior years . . . . . . . . . . . . . . . . . . . . . . . . . . . . . . . . . . . . (10)
Balance at September 30, 2009 . . . . . . . . . . . . . . . . . . . . . . . . . . . . . . . . . . . . . . . . . . . . . . . $ 81
The U.S. Internal Revenue Service (“IRS”) is currently auditing the tax years 2005 and 2006 andcertain Cabot subsidiaries are under audit in jurisdictions outside of the U.S. In addition, certain statutes oflimitations are scheduled to expire in the near future. It is reasonably possible that a further change in theunrecognized tax benefits may occur within the next twelve months related to the settlement of one or moreof these audits or the lapse of applicable statutes of limitations; however, an estimated range of the impacton the unrecognized tax benefits cannot be quantified at this time.
Cabot files U.S. federal and state, and non-U.S. income tax returns in jurisdictions with varyingstatutes of limitations. The 2005 through 2008 tax years generally remain subject to examination by the IRSand the 2003 through 2008 tax years remain subject to examination by most state tax authorities. Insignificant non-U.S. jurisdictions, the 2001 through 2008 tax years generally remain subject to examinationby their respective tax authorities. Cabot’s significant non-U.S. jurisdictions include Argentina, Brazil,Canada, China, Germany, Japan, the Netherlands, and the United Kingdom.
94

Note T. Commitments and Contingencies
Operating Lease Commitments
Cabot leases certain transportation vehicles, warehouse facilities, office space, machinery andequipment under cancelable and non-cancelable operating leases, most of which expire within ten years andmay be renewed by Cabot. Escalation clauses, lease payments dependent on existing rates/indexes and otherlease concessions are included in the minimum lease payments and such lease payments are recognized on astraight-line basis over the minimum lease term. Rent expense under such arrangements for fiscal 2009,2008 and 2007 totaled $28 million, $27 million and $25 million, respectively. Future minimum rentalcommitments under non-cancelable leases are as follows:
(Dollars in millions)
2010 . . . . . . . . . . . . . . . . . . . . . . . . . . . . . . . . . . . . . . . . . . . . . . . . . . . $ 182011 . . . . . . . . . . . . . . . . . . . . . . . . . . . . . . . . . . . . . . . . . . . . . . . . . . . 142012 . . . . . . . . . . . . . . . . . . . . . . . . . . . . . . . . . . . . . . . . . . . . . . . . . . . 122013 . . . . . . . . . . . . . . . . . . . . . . . . . . . . . . . . . . . . . . . . . . . . . . . . . . . 102014 . . . . . . . . . . . . . . . . . . . . . . . . . . . . . . . . . . . . . . . . . . . . . . . . . . . 92015 and thereafter . . . . . . . . . . . . . . . . . . . . . . . . . . . . . . . . . . . . . . . . 39
Total future minimum rental commitments . . . . . . . . . . . . . . . . . . . $102
Other Long-Term Commitments
Cabot has entered into long-term purchase agreements primarily for the purchase of raw materials andnatural gas. Under certain of these commitments the quantity of material being purchased is fixed, but theprice paid changes as market prices change. Raw materials purchased under these agreements by segmentfor fiscal 2009, 2008 and 2007 are as follows:
Years Ended September 30
2009 2008 2007
(Dollars in millions)
Core SegmentRubber Blacks Business . . . . . . . . . . . . . . . . . . . . . . . . . . . . . $136 $222 $178Supermetals Business . . . . . . . . . . . . . . . . . . . . . . . . . . . . . . . 16 51 46
Performance Segment . . . . . . . . . . . . . . . . . . . . . . . . . . . . . . . . . 82 105 30Specialty Fluids Segment . . . . . . . . . . . . . . . . . . . . . . . . . . . . . . 4 3 —
Total . . . . . . . . . . . . . . . . . . . . . . . . . . . . . . . . . . . . . . . . . . . . $238 $381 $254
The purchase commitments for the Rubber Blacks and Supermetals Businesses, Performance Segmentand Specialty Fluids Segment covered by these agreements are with various suppliers and purchases areexpected to take place as follows:
Payments Due by Fiscal Year
2010 2011 2012 2013 2014 Thereafter Total
(Dollars in millions)
Core SegmentRubber Blacks Business . . . . . . . . . . . . . . . . . . . $188 $163 $143 $137 $114 $1,102 $1,847Supermetals Business . . . . . . . . . . . . . . . . . . . . . 24 16 17 11 — — 68
Performance Segment . . . . . . . . . . . . . . . . . . . . . . . 34 20 19 19 20 123 235Specialty Fluids Segment . . . . . . . . . . . . . . . . . . . . 5 1 — — — — 6Other . . . . . . . . . . . . . . . . . . . . . . . . . . . . . . . . . . . . — 1 — — — — 1
Total . . . . . . . . . . . . . . . . . . . . . . . . . . . . . . . . $251 $201 $179 $167 $134 $1,225 $2,157
95

The dollar value of these commitments have been estimated using current market prices. As notedabove, these will fluctuate based on time of purchase.
Guarantee Agreements
Cabot has provided certain indemnities pursuant to which it may be required to make payments to anindemnified party in connection with certain transactions and agreements. In connection with certainacquisitions and divestitures, Cabot has provided routine indemnities with respect to such matters asenvironmental, tax, insurance, product and employee liabilities. In connection with various otheragreements, including service and supply agreements, Cabot may provide routine indemnities for certaincontingencies and routine warranties. Cabot is unable to estimate the maximum potential liability for thesetypes of indemnities as a maximum obligation is not explicitly stated in most cases and the amounts, if any,are dependent upon the outcome of future contingent events, the nature and likelihood of which cannot bereasonably estimated. The duration of the indemnities vary, and in many cases are indefinite. Cabot has notrecorded any liability for these indemnities in the consolidated financial statements, except as otherwisedisclosed.
Self-Insurance and Retention for Certain Contingencies
The Company is partially self-insured for certain third party liability globally, as well as workers’compensation and employee medical benefits in the United States. The third party and workers’compensation liabilities are managed through a wholly-owned insurance captive and the related liabilitiesare included in the consolidated financial statements. The employee medical obligations are managed by athird party provider and the related liabilities are included in the consolidated financial statements. To limitCabot’s potential liabilities for these risks, however, the Company purchases insurance from third partiesthat provides individual and aggregate stop loss protection. The aggregate self-insured liability in fiscal2009 for combined U.S. workers’ compensation and third party liabilities is $5 million, and the retention formedical costs in the United States is at most $200,000 per person per annum.
Contingencies
Cabot is a defendant, or potentially responsible party, in various lawsuits and environmentalproceedings wherein substantial amounts are claimed or at issue.
Environmental Matters
As of September 30, 2009 and 2008, Cabot had $6 million and $9 million, respectively, reserved forenvironmental matters primarily related to divested businesses. In fiscal 2009 and 2008, there was $2million and $3 million, respectively, in accrued expenses and $4 million and $6 million, respectively, inother liabilities on the consolidated balance sheets for environmental matters. These amounts representCabot’s best estimates of its share of costs likely to be incurred at those sites where costs are reasonablyestimable based on its analysis of the extent of clean up required, alternative clean up methods available,abilities of other responsible parties to contribute and its interpretation of laws and regulations applicable toeach site. Cabot reviews the adequacy of this reserve as circumstances change at individual sites. Chargesfor environmental expense were less than $1 million and $2 million in fiscal 2009 and 2008, respectively.Cash payments were $3 million and $4 million during fiscal 2009 and 2008, respectively, related to theseenvironmental matters.
At September 30, 2009, the operation and maintenance component of the $6 million reserve forenvironmental matters was $3 million on a discounted basis. Cabot expects to make payments of $2 millionin fiscal 2010, less than $1 million in each of fiscal 2011 through fiscal 2014, and a total of $2 millionthereafter. A weighted average risk free rate of 3% is used for the environmental liability at September 30,
96

2009. The book value of the liabilities will be accreted up to the undiscounted liability value throughinterest expense over the expected cash flow period. The accreted interest expense was less than $1 millionfor each of fiscal 2009, 2008 and 2007.
In June 2009, Cabot received an information request from the United States Environmental ProtectionAgency (“EPA”) regarding Cabot’s carbon black manufacturing facility in Pampa, Texas. The informationrequest relates to the Pampa facility’s compliance with certain regulatory and permitting requirements underthe Clean Air Act, including the New Source Review (“NSR”) construction permitting requirements. EPA hasindicated that this information request is part of an EPA national initiative focused on the U.S. carbon blackmanufacturing sector. Cabot responded to EPA’s information request in August 2009 and is awaiting aresponse from EPA. As a result of this initiative, based upon how EPA has handled similar NSR initiativeswith other industrial sectors, it is possible that EPA could attempt to compel Cabot to employ additionaltechnology control devices or approaches with respect to emissions and/or seek a civil penalty from Cabot.
Respirator Liabilities
Cabot has exposure in connection with a safety respiratory products business that a subsidiary acquiredfrom American Optical Corporation (“AO”) in an April 1990 asset purchase transaction. The subsidiarymanufactured respirators under the AO brand and disposed of that business in July 1995. In connection withits acquisition of the business, the subsidiary agreed, in certain circumstances, to assume a portion of AO’sliabilities, including costs of legal fees together with amounts paid in settlements and judgments, allocableto AO respiratory products used prior to the 1990 purchase by the Cabot subsidiary. In exchange for thesubsidiary’s assumption of certain of AO’s respirator liabilities, AO agreed to provide to the subsidiary thebenefits of: (i) AO’s insurance coverage for the period prior to the 1990 acquisition and (ii) a formerowner’s indemnity of AO holding it harmless from any liability allocable to AO respiratory products usedprior to May 1982.
Generally, these respirator liabilities involve claims for personal injury, including asbestosis, silicosisand coal worker’s pneumoconiosis, allegedly resulting from the use of respirators that are claimed to havebeen negligently designed or labeled. Neither Cabot, nor its past or present subsidiaries, at any timemanufactured asbestos or asbestos-containing products. Moreover, not every person with exposure toasbestos giving rise to an asbestos claim used a form of respiratory protection. At no time did thisrespiratory product line represent a significant portion of the respirator market. In addition, other parties,including AO, AO’s insurers, and another former owner and its insurers (collectively, the “Payor Group”),are responsible for significant portions of the costs of these liabilities, leaving Cabot’s subsidiary with aportion of the liability in only some of the pending cases.
The subsidiary transferred the business to Aearo Corporation (“Aearo”) in July 1995. Cabot agreed tohave the subsidiary retain certain liabilities allocable to respirators used prior to the 1995 transaction so long asAearo paid, and continues to pay, Cabot an annual fee of $400,000. Aearo can discontinue payment of the feeat any time, in which case it will assume the responsibility for and indemnify Cabot against the liabilitiesallocable to respirators manufactured and used prior to the 1995 transaction. Cabot anticipates that it willcontinue to receive payment of the $400,000 fee from Aearo and thereby retain these liabilities for theforeseeable future. Cabot has no liability in connection with any products manufactured by Aearo after 1995.
As of September 30, 2009, there were approximately 52,000 claimants in pending cases assertingclaims against AO in connection with respiratory products. Cabot has contributed to the Payor Group’sdefense and settlement costs with respect to a percentage of pending claims depending on several factors,including the period of alleged product use. In order to quantify Cabot’s estimated share of liability forpending and future respirator liability claims, Cabot engaged, through counsel, the assistance of Hamilton,Rabinovitz & Alschuler, Inc. (“HR&A”), a leading consulting firm in the field of tort liability valuation.The methodology developed by HR&A addresses the complexities surrounding Cabot’s potential liability
97

by making assumptions about future claimants with respect to periods of asbestos exposure and respiratoruse. Using those and other assumptions, HR&A estimated the number of future claims that would be filedand the related costs that would be incurred in resolving those claims. On this basis, HR&A then estimatedthe net present value of the share of these liabilities that reflected Cabot’s period of direct manufacture andCabot’s actual contractual obligations assuming that all other members of the Payor Group meet theirobligations. Based on the HR&A estimates, Cabot has a reserve for these matters of $13 million on a netpresent value basis ($23 million on an undiscounted basis) at September 30, 2009.
Cabot’s current estimate of the cost of its share of existing and future respirator liability claims is basedon facts and circumstances existing at this time. Developments that could affect its estimate include, but arenot limited to, (i) significant changes in the number of future claims, (ii) changes in the rate of dismissalswithout payment of pending silica and non-malignant asbestos claims, (iii) significant changes in theaverage cost of resolving claims, (iv) significant changes in the legal costs of defending these claims,(v) changes in the nature of claims received, (vi) changes in the law and procedure applicable to theseclaims, (vii) the financial viability of members of the Payor Group, (viii) a change in the availability ofAO’s insurance coverage, (ix) changes in the allocation of costs among the Payor Group and(x) a determination that the Company’s interpretation of the contractual obligations on which it hasestimated its share of liability is inaccurate. Cabot cannot determine the impact of these potentialdevelopments on its current estimate of its share of liability for existing and future claims. Accordingly, theactual amount of these liabilities for existing and future claims could be different than the reserved amount.
The $13 million liability for respirator claims is recognized on a discounted basis using a discount rateof 6% which represents management’s best estimate of the risk free rate to the cash flow payments of theliability that are projected through 2053. The total expected aggregate undiscounted amount of futurepayments is $23 million. Cabot estimates payments of approximately $1 million, $2 million, $1 million, $1million, and $1 million in fiscal 2010, 2011, 2012, 2013 and 2014, respectively, and a total of $17 million infiscal 2015 through 2053. The book value of the liabilities will be accreted up to the undiscounted liabilityvalue through interest expense over the expected cash flow period, which was approximately $1 million infiscal 2009. Cash payments were $2 million, $2 million and $1 million during fiscal 2009, 2008 and 2007,respectively, related to this liability. If the timing of Cabot’s actual payments made for respirator claimsdiffers significantly from the Company’s estimated payment schedule, and the Company could no longerreasonably predict the timing of such payments, Cabot then could be required to record the reserve amounton an undiscounted basis on its consolidated balance sheets, causing an immediate impact to itsconsolidated statements of operations.
Carbon Black Antitrust Litigation
The Company was one of several carbon black manufacturer defendants in federal and state classactions initially filed in 2003 alleging that the defendants violated federal and state antitrust laws inconnection with the sale of carbon black. As of September 30, 2009, the only pending state action was inFlorida, with all of the other federal and state class actions having been previously settled and giving rise tocharges to the consolidated statements of operations of less than $1 million, $1 million and $11 million infiscal 2009, 2008 and 2007, respectively. The parties in the Florida action entered into a settlementagreement, which received final court approval in October 2009, thus resolving the final remaining case.Cabot denies any wrongdoing of any kind in these cases and strongly believes it has good defenses to theclaims, but agreed to the settlements to avoid further expense, inconvenience, risk and the distraction ofburdensome and protracted litigation.
Beryllium Claims
Cabot is a party to several pending actions in connection with its discontinued beryllium operations. Cabotentered the beryllium industry through an acquisition in 1978. The Company ceased manufacturing beryllium
98

products in Reading, Pennsylvania at one of the acquired facilities in 1979, and the balance of its formerberyllium business was sold to NGKMetals, Inc. in 1986. The actions involve claims for personal injury andmedical monitoring relating to alleged contact with beryllium in various ways and are pending in the state andfederal courts in Pennsylvania, and in the state court in California. All of the personal injury and medicalmonitoring actions filed in the Pennsylvania courts have either been settled or resolved in Cabot’s favor at thetrial court level, although the plaintiffs in some cases have filed appeals. The actions pending in the Californiastate court all involve claims for medical monitoring. Cabot believes it has valid defenses to all of these berylliumactions and will assert them vigorously in the various venues in which claims have been asserted. In addition,there is a contractual indemnification obligation running from NGK to Cabot in connection with many of thesematters. While the outcome of litigation is uncertain, the Company does not believe that the ultimate dispositionof these matters will have a material adverse effect on the Company’s financial position.
AVX Contract Dispute
On March 8, 2004, AVX Corporation (“AVX”) filed an action against the Company in the UnitedStates District Court for the District of Massachusetts. The complaint alleged that Cabot violated the federalantitrust laws in connection with the parties’ January 1, 2001 tantalum supply agreement (the “SupplyAgreement”) by purportedly tying AVX’s purchases of Cabot’s “flake” tantalum powder to its purchases ofCabot’s “nodular” tantalum powder. In February 2009, the court granted Cabot’s motion for summaryjudgment in this matter and dismissed this case against Cabot, which AVX appealed. In addition, onSeptember 6, 2005, AVX filed an action in the Superior Court of Massachusetts for Suffolk County, whichwas moved to the Business Litigation Section of the Superior Court of Massachusetts in November 2005,alleging that Cabot improperly administered the “most favored customer” provisions of the parties’ SupplyAgreement for the years 2003 through 2005. Cabot filed counterclaims against AVX asserting that AVXactually underpaid for tantalum products during that period. AVX’s damage claim had been limited by thecourt to approximately $30 million, not including pre-judgment interest. In October 2009, Cabot and AVXentered into an agreement settling both of these matters, resulting in an incremental charge to theCompany’s statement of operations of $7 million for the fourth quarter of fiscal 2009. Cabot denies anywrongdoing of any kind in these cases and strongly believes it has good defenses to the claims, but agreedto the settlement to avoid further expense, inconvenience, risk and the distraction of burdensome andprotracted litigation.
Other
The Company has various other lawsuits, claims and contingent liabilities arising in the ordinarycourse of its business and in respect of the Company’s divested businesses. In the opinion of the Company,although final disposition of some or all of these other suits and claims may impact the Company’s financialstatements in a particular period, they should not, in the aggregate, have a material adverse effect on theCompany’s financial position.
Note U. Concentration of Credit Risk
Credit risk represents the loss that would be recognized if counterparties failed to completely performas contracted. Financial instruments that subject Cabot to credit risk consist principally of cash and cashequivalents, investments, trade receivables and derivatives. Cabot maintains cash and cash equivalents,investments and derivatives with major banks and financial institutions and the Company has notexperienced any material credit losses related to these instruments held at these financial institutions.Furthermore, concentrations of credit risk exist for groups of customers when they have similar economiccharacteristics that would cause their ability to meet contractual obligations to be similarly affected bychanges in economic or other conditions.
99

During fiscal 2009, 2008 and 2007, The Goodyear Tire and Rubber Company accounted forapproximately 10%, 12% and 12%, respectively, of Cabot’s annual consolidated net sales. No othercustomer individually represented 10% or more of net sales for any period presented.
Tire manufacturers in the Rubber Blacks Business comprise a significant portion of Cabot’s tradereceivable balance. The accounts receivable balance for these significant customers are as follows:
September 30
2009 2008
(Dollars in millions)
Tire manufacturers . . . . . . . . . . . . . . . . . . . . . . . . . . . . . . . . . . . . . . . . . . $215 $320
Cabot has not experienced significant losses in the past from these customers. Cabot monitors itsexposure to customers to minimize potential credit losses.
Note V. Financial Information by Segment & Geographic Area
Segment Information
Cabot is organized into four business segments: the Core Segment, which is further disaggregated forfinancial reporting purposes into the Rubber Blacks and Supermetals Businesses, the Performance Segment,the New Business Segment and the Specialty Fluids Segment. During the first quarter of fiscal 2009,management changed the allocation method of its corporate costs to its segments. Under this new method,costs that are not controlled by the segments and which primarily benefit corporate interests are notallocated to the segments and are included under the caption “Unallocated and Other” in the table below.The presentation of prior period results conforms to the new allocation method.
While the Chief Operating Decision Maker uses a number of performance measures to manage theperformance of the segments and allocate resources to them, income (loss) from operations before taxes(“Segment PBT”) is the measure that is most consistently used and is, therefore, the measure presented inthe table below. Segment PBT includes equity in net income of affiliated companies, royalties paid byequity affiliates, minority interest and allocated corporate costs. Prior to fiscal 2008, revenues from externalcustomers for certain product lines within the Rubber Blacks Business included 100% of sales from oneequity affiliate. Segment PBT excludes interest expense, foreign currency transaction gains and losses,interest income, dividend income, as well as certain items that have not been allocated to a segment as theyare significant and unusual or infrequent. Cash, short-term investments, cost investments, income taxesreceivable, deferred taxes and headquarters’ assets are included in unallocated and other. Expenditures foradditions to long-lived assets include total equity and other investments (including available-for-salesecurities), property, plant and equipment, intangible assets and assets held for rent.
Core Segment
Rubber Blacks products are used in tires and industrial products. Rubber blacks have traditionally beenused in the tire industry as a rubber reinforcing agent and are also used as a performance additive. Inindustrial products such as hoses, belts, extruded profiles and molded goods, rubber blacks are used toimprove the physical performance of the product. In addition to the carbon black made using conventionalcarbon black manufacturing methods, the Company has developed elastomer composite products (referredto as Cabot Elastomer Composites or “CEC”) that are compounds of natural rubber and carbon black madeby a patented liquid phase process. The Company’s CEC products are currently targeted primarily for tireapplications because it is believed that these compounds improve wear resistance, reduce fatigue and reducerolling resistance compared to natural rubber/carbon black compounds made by conventional methods.
The Supermetals Business produces tantalum, niobium (columbium) and their alloys. Tantalum, whichaccounts for substantially all of this Business’s sales, is produced in various forms. Electronics is the largest
100

application for tantalum powder, which is used to make capacitors for computers, networking devices,wireless phones, electronics for automobiles and other devices. Tantalum, niobium and their alloys are alsoproduced in wrought form for applications such as the production of superalloys and chemical processequipment and for various other industrial and aerospace applications, including fiber optic filters, sodiumvapor lamps, turbine blades and aerospace propulsion systems. In addition, the Supermetals Business sellsthe starting metals (high-purity grade tantalum powders, plates and ingots) used to manufacture finishedtantalum sputtering targets used in thin film applications, including semiconductors, inkjet heads, magneticsand flat panel displays.
Performance Segment
The Performance Segment is comprised of two product lines: specialty grades of carbon black andthermoplastic concentrates (referred to together as “performance products”); and fumed silica, fumedalumina and dispersions thereof (referred to together as “fumed metal oxides”). The net sales from each ofthese businesses for fiscal 2009, 2008 and 2007 are as follows:
Years Ended September 30
2009 2008 2007
(Dollars in millions)
Performance Products Business . . . . . . . . . . . . . . . . . . . . . . . . . $411 $646 $541Fumed Metal Oxides Business . . . . . . . . . . . . . . . . . . . . . . . . . . 210 287 270
Total Performance Segment . . . . . . . . . . . . . . . . . . . . . . . . . . $621 $933 $811
In each product line, the business designs, manufactures and sells materials that deliver performance ina broad range of customer applications. Products are used in a wide variety of applications across theautomotive, construction and infrastructure, and electronics and consumer products sectors.
Cabot’s specialty grades of carbon black are used to impart color, provide rheology control, enhanceconductivity and static charge control, provide UV protection, enhance mechanical properties, and providechemical flexibility through surface treatment. These products are used in a wide variety of applications,such as inks, coatings, cables, pipes, toners and electronics. In addition, Cabot manufactures and sourcesthermoplastic concentrates and compounds that are marketed to the plastics industry.
Fumed silica is an ultra-fine, high-purity particle used as a reinforcing, thickening, abrasive,thixotropic, suspending or anti-caking agent in a wide variety of products produced for the automotive,construction, microelectronics, and consumer products industries. These products include adhesives,sealants, cosmetics, inks, toners, silicone rubber, coatings, polishing slurries and pharmaceuticals. Fumedalumina, also an ultra-fine, high-purity particle, is used as an abrasive, absorbent or barrier agent in a varietyof products, such as inkjet media, lighting, coatings, cosmetics and polishing slurries.
New Business Segment
The New Business Segment is comprised of the Inkjet Colorants and the Aerogel Businesses and thebusiness development activities of Cabot Superior MicroPowders (“CSMP”). The net sales from each ofthese businesses for fiscal 2009, 2008 and 2007 are as follows:
Years Ended September 30
2009 2008 2007
(Dollars in millions)
Inkjet Colorants Business . . . . . . . . . . . . . . . . . . . . . . . . . . . . . . $46 $43 $46Aerogel Business . . . . . . . . . . . . . . . . . . . . . . . . . . . . . . . . . . . . 15 10 3CSMP . . . . . . . . . . . . . . . . . . . . . . . . . . . . . . . . . . . . . . . . . . . . . 6 4 2
Total New Business Segment . . . . . . . . . . . . . . . . . . . . . . . . . $67 $57 $51
101

The Inkjet Colorants Business produces and sells aqueous inkjet colorants primarily to the inkjetprinting market. The Company’s inkjet colorants are high-quality pigment-based black and other colorantdispersions manufactured by surface treating specialty grades of carbon black and other pigments. Thedispersions are used in aqueous inkjet inks to impart color (optical density or chroma) with improveddurability (waterfastness, lightfastness and rub resistance) while maintaining high printhead reliability.Cabot’s inkjet colorants are produced for various inkjet printing applications including small office andhome office, corporate office, and commercial and industrial printing, as well as for other niche applicationsthat require a high level of dispersibility and colloidal stability.
Cabot’s aerogel is a nano-structured, high surface area, hydrophobic, silica-based particle that is usedin a variety of thermal insulation and specialty chemical applications. In the construction industry, theproduct is used in skylight, window, wall and roof systems for insulating eco-daylighting applications. Inthe oil and gas industry, aerogel is used to insulate subsea pipelines. In the specialty chemicals industry, theproduct is used to provide matte finishing, insulating and thickening properties for use in a variety ofapplications. The Company continues to focus on application and market development activities for use ofaerogel in these and other new applications.
CSMP is a research and development enterprise with multiple technology platforms and corecompetencies in advanced particle manufacturing across a wide range of materials and the related materialschemistries. Its principal areas of commercial focus are in developing advanced materials for anti-counterfeiting security applications, fuel cell applications, solar energy applications, environmental andindustrial catalyst applications, and for other performance material applications. The Company expects theCSMP platforms to support the development of new technologies that complement existing markets andprovide opportunities for new business growth.
Specialty Fluids Segment
The Specialty Fluids Segment produces and markets cesium formate as a drilling and completion fluidfor use primarily in high pressure and high temperature oil and gas well construction. Cesium formateproducts are solids-free, high-density fluids that have a low viscosity, enabling safe and efficient wellconstruction and workover operations. The fluid is resistant to high temperatures, minimizes damage toproducing reservoirs and is readily biodegradable in accordance with testing guidelines set by theOrganization for Economic Cooperation and Development. In a majority of applications, cesium formate isblended with other formates or products.
102

Financial information by segment is as follows:Core Segment
RubberBlacks
Business(2)SupermetalsBusiness
PerformanceSegment
NewBusinessSegment
SpecialtyFluidsSegment
SegmentTotal
Unallocatedand
Other (1),(3)Consolidated
Total
(Dollars in millions)Years Ended September 302009Revenues from externalcustomers(3) . . . . . . . . . . . . . . . . 1,286 140 621 67 59 2,173 70 2,243
Depreciation and amortization . . . 99 5 46 11 2 163 6 169Equity in net income of affiliatedcompanies . . . . . . . . . . . . . . . . . 5 — — — — 5 — 5
Income (loss) from continuingoperations before taxes(4) . . . . . 34 (1) 40 (10) 21 84 (186) (102)
Assets(5) . . . . . . . . . . . . . . . . . . . . . 1,206 202 486 88 78 2,060 616 2,676Investment in equity-basedaffiliates . . . . . . . . . . . . . . . . . . . 56 — 4 — — 60 — 60
Total expenditures for additions tolong-lived assets(6) . . . . . . . . . . . 75 4 32 1 1 113 1 114
2008Revenues from externalcustomers(3) . . . . . . . . . . . . . . . . 1,868 195 933 57 68 3,121 70 3,191
Depreciation andamortization(7) . . . . . . . . . . . . . . 93 6 45 12 4 160 3 163
Equity in net income of affiliatedcompanies . . . . . . . . . . . . . . . . . 7 — 1 — — 8 — 8
Income (loss) from continuingoperations before taxes(4),(7) . . . . 108 (1) 119 (35) 24 215 (103) 112
Assets(5),(7) . . . . . . . . . . . . . . . . . . . 1,427 249 590 104 76 2,446 412 2,858Investment in equity-basedaffiliates . . . . . . . . . . . . . . . . . . . 49 — 4 — — 53 — 53
Total expenditures for additions tolong-lived assets(6),(7) . . . . . . . . . 135 11 37 8 5 196 8 204
2007Revenues from externalcustomers(3) . . . . . . . . . . . . . . . . 1,416 233 811 51 58 2,569 47 2,616
Depreciation andamortization(7) . . . . . . . . . . . . . . 82 5 43 10 4 144 5 149
Equity in net income of affiliatedcompanies . . . . . . . . . . . . . . . . . 11 — 1 — — 12 — 12
Income (loss) from continuingoperations before taxes(4),(7) . . . . 103 26 148 (34) 24 267 (99) 168
Assets(5),(7) . . . . . . . . . . . . . . . . . . . 1,219 268 563 101 86 2,237 399 2,636Investment in equity-basedaffiliates . . . . . . . . . . . . . . . . . . . 61 — 4 — — 65 — 65
Total expenditures for additions tolong-lived assets(6),(7) . . . . . . . . . 78 13 36 10 3 140 104 244
(1) Unallocated and Other includes certain items and eliminations that are not allocated to the operatingsegments. Management does not consider these items necessary for an understanding of the operatingresults of these segments and such amounts are excluded in the segment reporting to the ChiefOperating Decision Maker.
(2) During the third quarter of fiscal 2008, the Company purchased additional shares of one of its RubberBlacks equity affiliates which resulted in the consolidation of its operating results in the Company’sconsolidated financial statements beginning April 1, 2008. Prior to the consolidation, segment salesincluded 100% of the sales of this equity affiliate at market-based prices. Unallocated and other reflectsan elimination for sales of this equity affiliate, prior to the consolidation of its results beginningApril 1, 2008, offset by royalties paid by other equity affiliates and other operating revenues andexternal shipping and handling fees.
103

(3) Royalty income received by the Aerogel business, which had been included in Unallocated and Otherin prior periods, has been reclassified to Segment sales for all periods presented above.
Years Ended September 30
2009 2008 2007
(Dollars in millions)
Equity affiliate sales . . . . . . . . . . . . . . . . . . . . . . . . . . . . . . . . . . . . . . . . . $— $(30) $(40)Royalties paid by equity affiliates and other operating revenues . . . . . . . 8 16 12Shipping and handling fees . . . . . . . . . . . . . . . . . . . . . . . . . . . . . . . . . . . . 62 84 75
Total . . . . . . . . . . . . . . . . . . . . . . . . . . . . . . . . . . . . . . . . . . . . . . . . . . . . $70 $ 70 $ 47
(4) Income (loss) from continuing operations before taxes for Unallocated and Other includes:
Years Ended September 30
2009 2008 2007
(Dollars in millions)
Interest expense . . . . . . . . . . . . . . . . . . . . . . . . . . . . . . . . . . . . . . . . . . . . $ (30) $ (38) $(34)Certain items(a) . . . . . . . . . . . . . . . . . . . . . . . . . . . . . . . . . . . . . . . . . . . . . (103) (13) (34)Equity in net income of affiliated companies(b) . . . . . . . . . . . . . . . . . . . . (5) (8) (12)Unallocated corporate costs . . . . . . . . . . . . . . . . . . . . . . . . . . . . . . . . . . . (28) (28) (36)Other income and foreign currency transaction gains (losses)(c) . . . . . . . (20) (16) 17
Total . . . . . . . . . . . . . . . . . . . . . . . . . . . . . . . . . . . . . . . . . . . . . . . . . . . $(186) $(103) $(99)
(a) Certain items for fiscal 2009 include charges of $91 million related to restructuring activities, $89million of which related to the 2009 Global Restructuring Plan, $7 million related toenvironmental reserves and legal settlements, $4 million for executive transition costs, and $1million for the write-down of impaired investments. Certain items for fiscal 2008 include chargesof $16 million for the closure of a carbon black manufacturing facility in Waverly, West Virginia,$6 million for the Company’s 2008 Global Restructuring Plan, $4 million for executive transitioncosts, $3 million for environmental reserves and legal settlements, $2 million related to otherrestructuring activities, and $2 million for debt issuance costs, offset by a gain of $18 million forthe sale of the land in Altona, Australia and a $2 million reduction in the reserve for respiratorclaims. Certain items for fiscal 2007 include charges of $18 million for legal and environmentalreserves and settlements, $12 million for restructuring activities, and $4 million related to theacquisition of in-process research and development technology.
(b) Equity in net income of affiliated companies is included in segment PBT and is removed inUnallocated and Other to reconcile back to income (loss) from operations before taxes.
(c) Other income and foreign currency transaction gains (losses), net, consists of interest andinvestment income that is not included in segment PBT, and foreign currency losses net of otherforeign currency risk management activity.
(5) Unallocated and Other assets includes cash, marketable securities, cost investments, income taxesreceivable, deferred taxes and headquarters’ assets.
(6) Expenditures for additions to long-lived assets include total equity and other investments (includingavailable-for-sale securities), property, plant and equipment, intangible assets and assets held for rent.
(7) These lines include reclassifications between segments so that prior period presentation conforms tocurrent period presentation.
Geographic Information
Sales are attributed to the United States and to all foreign countries based on the location from whichthe sale originated. Revenues from external customers and long-lived assets attributable to an individualcountry, other than the United States, Japan and China, did not meet the threshold for disclosure.
104

Revenues from external customers and long-lived asset information by geographic area aresummarized as follows:
United States Japan ChinaOther ForeignCountries
ConsolidatedTotal
(Dollars in millions)
Years Ended September 30,2009Revenues from external customers . . . . . . . . . . . . . . . $377 $295 $281 $1,290 $2,243Long-lived assets(1) . . . . . . . . . . . . . . . . . . . . . . . . . . . $343 $ 72 $201 $ 540 $1,1562008Revenues from external customers . . . . . . . . . . . . . . . $849 $368 $330 $1,644 $3,191Long-lived assets(1) . . . . . . . . . . . . . . . . . . . . . . . . . . . $382 $ 68 $194 $ 573 $1,2172007Revenues from external customers . . . . . . . . . . . . . . . $717 $345 $267 $1,287 $2,616Long-lived assets(1) . . . . . . . . . . . . . . . . . . . . . . . . . . . $387 $ 67 $145 $ 566 $1,165
(1) Long-lived assets include total equity and other investments, (including available-for-sale marketablesecurities), net property, plant and equipment, net intangible assets and assets held for rent.
Note W. Unaudited Quarterly Financial Information
Unaudited financial results by quarter for fiscal 2009 and 2008 are summarized below.
Quarter Ended
December March June September Year
(Dollars in millions, except per share amounts)
Fiscal 2009Net sales . . . . . . . . . . . . . . . . . . . . . . . . . . . . . . . . . . . . . . . . $ 652 $ 470 $ 511 $ 610 $2,243Gross profit . . . . . . . . . . . . . . . . . . . . . . . . . . . . . . . . . . . . . . 92 (5) 68 72 227Income (loss) from continuing operations . . . . . . . . . . . . . . 4 (58) (12) (11) (77)Income (loss) from discontinued operations . . . . . . . . . . . . — — — — —
Net income . . . . . . . . . . . . . . . . . . . . . . . . . . . . . . . . . . . . . . 4(1) (58)(2) (12)(3) (11)(4) (77)Income (loss) from continuing operations per commonshare . . . . . . . . . . . . . . . . . . . . . . . . . . . . . . . . . . . . . . . . . $0.07 $(0.92) $(0.19) $(0.18) $ (1.22)
Income (loss) from discontinued operations per commonshare . . . . . . . . . . . . . . . . . . . . . . . . . . . . . . . . . . . . . . . . . — — (0.01) — (0.01)
Income per common share (diluted) . . . . . . . . . . . . . . . . . . . $0.07 $(0.92) $(0.20) $(0.18) $ (1.23)
Fiscal 2008Net sales . . . . . . . . . . . . . . . . . . . . . . . . . . . . . . . . . . . . . . . . $ 711 $ 786 $ 840 $ 854 $3,191Gross profit . . . . . . . . . . . . . . . . . . . . . . . . . . . . . . . . . . . . . . 117 118 137 112 484
Net income . . . . . . . . . . . . . . . . . . . . . . . . . . . . . . . . . . . . . . $ 36(5) $ 11(6) $ 27(7) $ 12(8) $ 86
Income available to common shares . . . . . . . . . . . . . . . . . . . $ 36 $ 11 $ 27 $ 12 $ 86
Income per common share (diluted) . . . . . . . . . . . . . . . . . . . $0.56 $ 0.17 $ 0.43 $ 0.18 $ 1.34
(1) Includes charges of $1 million for the closure of the Company’s Waverly, West Virginia carbon blackfacility, $2 million related to the 2008 Global restructuring plan, offset by a gain of $1 million relatedto a previous closure of the Company’s facility in Zierbena, Spain.
(2) Includes charges of $1 million for the impairment of the Company’s investments, $45 million for the2009 Global restructuring plan, $1 million related to the closure of the Company’s Waverly West
105

Virginia carbon black facility, offset by a gain of $1 million from the sale of assets previously writtendown.
(3) Includes charges of $19 million for the Company’s 2009 global restructuring plan.(4) Includes charges of $4 million for executive transition costs, $25 million for the Company’s 2009
global restructuring, and $7 million for environmental reserves and legal settlements.(5) Includes a gain of $18 million from the sale of the land in Altona, Australia, offset by charges of $6
million for the closure of the Company’s Waverly, West Virginia carbon black facility, $1 millionrelated to a former carbon black facility and $1 million for environmental and legal reserves.
(6) Includes charges of $7 million for the closure of the Company’s Waverly, West Virginia carbon blackfacility, $1 million related to a former carbon black facility and $4 million for executive transitioncosts.
(7) Includes charges of $5 million for the Company’s 2008 global restructuring, $1 million for the closureof the Company’s Waverly, West Virginia carbon black facility and $2 million for environmentalreserves and legal settlements.
(8) Includes $2 million of debt issuance costs, $1 million for the Company’s 2008 global restructuring, $2million for the closure of the Company’s Waverly, West Virginia carbon black facility and a gain of $2million related to the reserve for respirator claims.
106

REPORT OF INDEPENDENT REGISTERED PUBLIC ACCOUNTING FIRM
To the Board of Directors and Stockholders of Cabot CorporationBoston, Massachusetts
We have audited the accompanying consolidated balance sheets of Cabot Corporation and subsidiaries(the “Company”) as of September 30, 2009 and 2008, and the related consolidated statements of operations,changes in stockholders’ equity, and cash flows for each of the three years in the period endedSeptember 30, 2009. These consolidated financial statements are the responsibility of the Company’smanagement. Our responsibility is to express an opinion on these financial statements based on our audits.
We conducted our audits in accordance with the standards of the Public Company AccountingOversight Board (United States). Those standards require that we plan and perform the audit to obtainreasonable assurance about whether the financial statements are free of material misstatement. An auditincludes examining, on a test basis, evidence supporting the amounts and disclosures in the financialstatements. An audit also includes assessing the accounting principles used and significant estimates madeby management, as well as evaluating the overall financial statement presentation. We believe that ouraudits provide a reasonable basis for our opinion.
In our opinion, such consolidated financial statements present fairly, in all material respects, thefinancial position of Cabot Corporation and subsidiaries as of September 30, 2009 and 2008, and the resultsof their operations and their cash flows for each of the three years in the period ended September 30, 2009,in conformity with accounting principles generally accepted in the United States of America.
As discussed in Note S to the consolidated financial statements, the Company changed its method ofaccounting for uncertain tax positions as of October 1, 2007.
We have also audited, in accordance with the standards of the Public Company Accounting OversightBoard (United States), the Company’s internal control over financial reporting as of September 30, 2009,based on the criteria established in Internal Control—Integrated Framework issued by the Committee ofSponsoring Organizations of the Treadway Commission and our report dated November 30, 2009 expressedan unqualified opinion on the Company’s internal control over financial reporting.
/s/ Deloitte & Touche LLP
Boston, MANovember 30, 2009
107

Item 9. Changes in and Disagreements with Accountants on Accounting and Financial Disclosure
None.
Item 9A. Controls and Procedures
Disclosure Controls and Procedures
Cabot carried out an evaluation, under the supervision and with the participation of its management,including the Company’s President and Chief Executive Officer and its Executive Vice President and ChiefFinancial Officer, of the effectiveness of the Company’s disclosure controls and procedures pursuant toRule 13a-15 under the Securities Exchange Act of 1934, as amended (the “Exchange Act”), as ofSeptember 30, 2009. Based on that evaluation, Cabot’s President and Chief Executive Officer and itsExecutive Vice President and Chief Financial Officer concluded that the Company’s disclosure controls andprocedures are effective with respect to the recording, processing, summarizing and reporting, within thetime periods specified in the Securities and Exchange Commission’s rules and forms, of informationrequired to be disclosed by the Company in the reports that it files or submits under the Exchange Act andsuch information is accumulated and communicated to management to allow timely decisions regardingrequired disclosure.
Management’s Annual Report on Internal Control Over Financial Reporting
Cabot’s management is responsible for establishing and maintaining adequate internal control overfinancial reporting for Cabot. Internal control over financial reporting is defined in Rules 13a-15(f) and15d-15(f) under the Exchange Act as a process designed by, or under the supervision of, a company’sprincipal executive and principal financial officers, and effected by the company’s board of directors,management and other personnel, to provide reasonable assurance regarding the reliability of financialreporting and the preparation of financial statements for external purposes in accordance with generallyaccepted accounting principles and includes those policies and procedures that:
• Pertain to the maintenance of records that in reasonable detail accurately and fairly reflect thetransactions and dispositions of the assets of the company;
• Provide reasonable assurance that transactions are recorded as necessary to permit preparation offinancial statements in accordance with generally accepted accounting principles, and that receiptsand expenditures of the company are being made only in accordance with authorizations ofmanagement and directors of the company; and
• Provide reasonable assurance regarding prevention or timely detection of unauthorizedacquisition, use or disposition of the company’s assets that could have a material effect on thefinancial statements.
Because of its inherent limitations, internal control over financial reporting may not prevent or detectmisstatements. Also, projections of any evaluation of the effectiveness to future periods are subject to therisk that controls may become inadequate because of changes in conditions, or that the degree ofcompliance with policies or procedures may deteriorate.
Cabot’s management assessed the effectiveness of Cabot’s internal control over financial reporting asof September 30, 2009 based on the framework established in Internal Control—Integrated Frameworkissued by the Committee of Sponsoring Organizations of the Treadway Commission (COSO). Based on thisassessment, Cabot’s management concluded that Cabot’s internal control over financial reporting waseffective as of September 30, 2009.
Cabot’s internal control over financial reporting as of September 30, 2009 has been audited byDeloitte & Touche LLP, an independent registered public accounting firm, as stated in their report below.
108

Changes in Internal Control Over Financial Reporting
There were no changes in the Company’s internal control over financial reporting that occurred duringthe Company’s fiscal quarter ending September 30, 2009 that have materially affected, or are reasonablylikely to materially affect, the Company’s internal control over financial reporting.
109

REPORT OF INDEPENDENT REGISTERED PUBLIC ACCOUNTING FIRM
To the Board of Directors and Stockholders of Cabot CorporationBoston, Massachusetts
We have audited the internal control over financial reporting of Cabot Corporation and subsidiaries(the “Company”) as of September 30, 2009, based on criteria established in Internal Control—IntegratedFramework issued by the Committee of Sponsoring Organizations of the Treadway Commission. TheCompany’s management is responsible for maintaining effective internal control over financial reportingand for its assessment of the effectiveness of internal control over financial reporting, included in theaccompanying Management’s Annual Report on Internal Control over Financial Reporting. Ourresponsibility is to express an opinion on the Company’s internal control over financial reporting based onour audit.
We conducted our audit in accordance with the standards of the Public Company Accounting OversightBoard (United States). Those standards require that we plan and perform the audit to obtain reasonableassurance about whether effective internal control over financial reporting was maintained in all materialrespects. Our audit included obtaining an understanding of internal control over financial reporting, assessingthe risk that a material weakness exists, testing and evaluating the design and operating effectiveness ofinternal control based on the assessed risk, and performing such other procedures as we considered necessaryin the circumstances. We believe that our audit provides a reasonable basis for our opinion.
A company’s internal control over financial reporting is a process designed by, or under thesupervision of, the company’s principal executive and principal financial officers, or persons performingsimilar functions, and effected by the company’s board of directors, management, and other personnel toprovide reasonable assurance regarding the reliability of financial reporting and the preparation of financialstatements for external purposes in accordance with generally accepted accounting principles. A company’sinternal control over financial reporting includes those policies and procedures that (1) pertain to themaintenance of records that, in reasonable detail, accurately and fairly reflect the transactions anddispositions of the assets of the company; (2) provide reasonable assurance that transactions are recorded asnecessary to permit preparation of financial statements in accordance with generally accepted accountingprinciples, and that receipts and expenditures of the company are being made only in accordance withauthorizations of management and directors of the company; and (3) provide reasonable assuranceregarding prevention or timely detection of unauthorized acquisition, use, or disposition of the company’sassets that could have a material effect on the financial statements.
Because of the inherent limitations of internal control over financial reporting, including the possibilityof collusion or improper management override of controls, material misstatements due to error or fraud maynot be prevented or detected on a timely basis. Also, projections of any evaluation of the effectiveness ofthe internal control over financial reporting to future periods are subject to the risk that the controls maybecome inadequate because of changes in conditions, or that the degree of compliance with the policies orprocedures may deteriorate.
In our opinion, the Company maintained, in all material respects, effective internal control overfinancial reporting as of September 30, 2009, based on the criteria established in Internal Control—Integrated Framework issued by the Committee of Sponsoring Organizations of the Treadway Commission.
We have also audited, in accordance with the standards of the Public Company Accounting OversightBoard (United States), the consolidated financial statements as of and for the year ended September 30,2009 of the Company and our report dated November 30, 2009 expressed an unqualified opinion on thosefinancial statements and included an explanatory paragraph relating to the Company’s change in its methodof accounting for uncertain tax positions.
/s/ Deloitte & Touche LLP
Boston, MassachusettsNovember 30, 2009
110

Item 9B. Other Information
None.
111

PART III
Item 10. Directors, Executive Officers and Corporate Governance
Certain information regarding our executive officers is included at the end of Part I of this annualreport under the heading “Executive Officers of the Registrant.”
Cabot has adopted Global Ethics and Compliance Standards, a code of ethics that applies to all of theCompany’s employees and directors, including the Chief Executive Officer, the Chief Financial Officer, theController and other senior financial officers. The Global Ethics and Compliance Standards are posted onour website, www.cabot-corp.com (under the “Governance” caption under “About Cabot”). We intend tosatisfy the disclosure requirement regarding any amendment to, or waiver of, a provision of the GlobalEthics and Compliance Standards applicable to the Chief Executive Officer, the Chief Financial Officer, theController or other senior financial officers by posting such information on our website.
The other information required by this item will be included in our Proxy Statement for the 2010Annual Meeting of Stockholders (“Proxy Statement”) and is herein incorporated by reference.
Item 11. Executive Compensation
The information required by this item will be included in our Proxy Statement and is incorporatedherein by reference.
Item 12. Security Ownership of Certain Beneficial Owners and Management and Related StockholderMatters
The following table provides information as of September 30, 2009 regarding the number of shares ofcommon stock that may be issued under Cabot’s equity compensation plans. All of our equity compensationplans have been approved by our stockholders.
Plan category
Number ofsecurities to be
issued upon exerciseof outstanding
options, warrantsand rights
(a)
Weighted-averageexercise price of
outstanding options,warrants and rights
(b)
Number of securitiesremaining available for future
issuance under equitycompensation plans
(excluding securities reflectedin column (a))
(c)(2)
Equity compensation plans approved bysecurity holders(1) . . . . . . . . . . . . . . . . . . 1,784,200 $20.61 5,363,942
Equity compensation plans not approvedby security holders . . . . . . . . . . . . . . . . . N/A N/A N/A
(1) Included in this category are the following equity plans that have been approved by Cabot’sstockholders: 2009 Long-Term Incentive Plan, 2006 Long-Term Incentive Plan, 1999 Equity IncentivePlan, 1996 Equity Incentive Plan and the Non-Employee Directors’ Stock Compensation Plan.
(2) The number in this column of the table represents the securities remaining available for future issuanceunder the 2009 Long-Term Incentive Plan and Non-Employee Directors’ Stock Compensation Plan. Nonew awards may be made under the 1996 Equity Incentive Plan, the 1999 Equity Incentive Plan or the 2006Long-Term Incentive Plan although there remain outstanding awards previously granted under these plans.
The other information required by this item will be included in our Proxy Statement and isincorporated herein by reference.
Item 13. Certain Relationships and Related Transactions, and Director Independence
The information required by this item will be included in our Proxy Statement and is incorporatedherein by reference.
Item 14. Principal Accounting Fees and Services
The information required by this item will be included in our Proxy Statement and is incorporatedherein by reference.
112

PART IV
Item 15. Exhibits, Financial Statement Schedules
(a) Financial Statements. See “Index to Financial Statements” under Item 8 on page 53 of thisForm 10-K.
(b) Exhibits. (Certain exhibits not included in copies of the Form 10-K sent to stockholders.)
The exhibit numbers in the following list correspond to the numbers assigned to such exhibits in theExhibit Table of Item 601 of Regulation S-K. Cabot will furnish to any stockholder, upon written request,any exhibit listed below, upon payment by such stockholder of the Company’s reasonable expenses infurnishing such exhibit.ExhibitNumber Description
3(a)(i) Restated Certificate of Incorporation of Cabot Corporation effective January 9, 2009(incorporated herein by reference to Exhibit 3.1 of Cabot’s Quarterly Report on Form 10-Qfor the quarterly period ended December 31, 2008, file reference 1-5667, filed with the SECon February 9, 2009).
3(b)† The By-laws of Cabot Corporation as amended September 11, 2009.
4(a)(i) Indenture, dated as of December 1, 1987, between Cabot Corporation and The First NationalBank of Boston, Trustee (the “Indenture”) (incorporated herein by reference to Exhibit 4 ofAmendment No. 1 to Cabot’s Registration Statement on Form S-3, Registration No. 33-18883, filed with the SEC on December 10, 1987).
4(a)(ii) First Supplemental Indenture dated as of June 17, 1992, to the Indenture (incorporated hereinby reference to Exhibit 4.3 of Cabot’s Registration Statement on Form S-3, RegistrationStatement No. 33-48686, filed with the SEC on June 18, 1992).
4(a)(iii) Second Supplemental Indenture, dated as of January 31, 1997, between Cabot Corporationand State Street Bank and Trust Company, Trustee (incorporated herein by reference toExhibit 4 of Cabot’s Quarterly Report on Form 10-Q for the quarterly period endedDecember 31, 1996, file reference 1-5667, filed with the SEC on February 14, 1997).
4(a)(iv) Third Supplemental Indenture, dated as of November 20, 1998, between Cabot Corporationand State Street Bank and Trust Company, Trustee (incorporated herein by reference toExhibit 4.1 of Cabot’s Current Report on Form 8-K, dated November 20, 1998, file reference1-5667, filed with the SEC on November 20, 1998).
4(a)(v) Indenture, dated as of September 21, 2009, between Cabot Corporation and U.S. BankNational Association, as Trustee (incorporated herein by reference to Exhibit 4.1 of Cabot’sRegistration Statement on Form S-3 ASR, Registration Number 333-162021, filed with theSEC on September 21, 2009).
4(a)(vi) First Supplemental Indenture, dated as of September 24, 2009, between Cabot Corporationand U.S. Bank National Association, as Trustee (incorporated herein by reference to Exhibit4.1 of Cabot’s Current Report on Form 8-K dated September 24, 2009, file reference 1-5667,filed with the SEC on September 24, 2009).
10(a)(i) Credit Agreement dated August 3, 2005 among Cabot Corporation, Bank of America, N.A.,as Administrative Agent, Swing Line Lender, and L/C Issuer, Citibank, N.A., as SyndicationAgent, and the other lenders party thereto (incorporated herein by reference to Exhibit 10.1 ofCabot’s Quarterly Report on Form 10-Q for the quarterly period ended June 30, 2005, filereference 1-5667, filed with the SEC on August 9, 2005).
10(a)(ii)† Second Amendment to Credit Agreement dated as of September 18, 2009 among CabotCorporation, the lenders party thereto, and Bank of America, N.A., as Administrative Agent.
113
ExhibitNumber Description
10(b)(i)* 1996 Equity Incentive Plan (incorporated herein by reference to Exhibit 28 of Cabot’sRegistration Statement on Form S-8, Registration No. 333-03683, filed with the SEC onMay 14, 1996).
10(b)(ii)* 1999 Equity Incentive Plan (incorporated herein by reference to Exhibit 10.1 of Cabot’sQuarterly Report on Form 10-Q for the quarterly period ended March 31, 1999, filereference 1-5667, filed with the SEC on May 17, 1999).
10(b)(iii)* Amendments to Cabot Corporation’s 1996 and 1999 Equity Incentive Plans, dated May 12,2000 (incorporated herein by reference to Exhibit 10 of Cabot’s Quarterly Report onForm 10-Q for the quarterly period ended March 31, 2000, file reference 1-5667, filed withthe SEC on May 15, 2000).
10(b)(iv)* Amendment to 1999 Equity Incentive Plan dated March 7, 2002 (incorporated herein byreference to Exhibit 10.1 of Cabot’s Quarterly Report on Form 10-Q for the quarterlyperiod ended March 30, 2002, file reference 1-5667, filed with the SEC on May 15, 2002).
10(b)(v)* 2006 Long-Term Incentive Plan (incorporated herein by reference to Appendix B ofCabot’s Proxy Statement on Schedule 14A relating to the 2006 Annual Meeting ofStockholders, file reference 1-5667, filed with the SEC on January 30, 2006).
10(b)(vi)* 2009 Long-Term Incentive Plan (incorporated herein by reference to Appendix B ofCabot’s Proxy Statement on Schedule 14A relating to the 2009 Annual Meeting ofStockholders, file reference 1-5667, filed with the SEC on January 28, 2009).
10(b)(vii)* Non-Employee Directors’ Stock Compensation Plan (incorporated herein by reference toAppendix B of Cabot’s Proxy Statement on Schedule 14A relating to the 2006 AnnualMeeting of Stockholders, file reference 1-5667, filed with the SEC on January 30, 2006).
10(b)(viii)* Cabot Corporation Short-Term Incentive Compensation Plan (incorporated herein byreference to Appendix C of Cabot’s Proxy Statement on Schedule 14A relating to the 2007Annual Meeting of Stockholders, file reference 1-5667, filed with the SEC on January 29,2007).
10(b)(ix)* Amendment to Cabot Corporation Short-Term Incentive Compensation Plan datedDecember 31, 2008 (incorporated by reference to Exhibit 10.4 of Cabot’s Quarterly Reporton Form 10-Q for the quarterly period ended December 31, 2008, file reference 1-5667,filed with the SEC on February 9, 2009).
10(c) Note Purchase Agreement between John Hancock Mutual Life Insurance Company, StateStreet Bank and Trust Company, as trustee for the Cabot Corporation Employee StockOwnership Plan, and Cabot Corporation, dated as of November 15, 1988 (incorporated byreference to Exhibit 10(c) of Cabot’s Annual Report on Form 10-K for the year endedSeptember 30, 1988, file reference 1-5667, filed with the SEC on December 29, 1988).
10(d)(i)* Supplemental Cash Balance Plan (incorporated herein by reference to Exhibit 10(e)(i) ofCabot’s Annual Report on Form 10-K for the year ended September 30, 1994, filereference 1-5667, filed with the SEC on December 22, 1994).
10(d)(ii)* Supplemental Cash Balance Plan, as amended and restated effective January 1, 2002(incorporated herein by reference to Exhibit 10(d)(ii) of Cabot’s Annual Report onForm 10-K for the year ended September 30, 2003, file reference 1-5667, filed with theSEC on December 23, 2003).
114

ExhibitNumber Description
10(d)(iii)* Cabot Corporation Amended and Restated Supplemental Cash Balance Plan datedDecember 31, 2008 (incorporated herein by reference to Exhibit 10.1 of Cabot’s QuarterlyReport on Form 10-Q for the quarterly period ended December 31, 2008, filereference 1-5667, filed with the SEC on February 9, 2009).
10(d)(iv)* Supplemental Employee Stock Ownership Plan (incorporated herein by reference toExhibit 10(e)(ii) of Cabot’s Annual Report on Form 10-K for the year ended September 30,1994, file reference 1-5667, filed with the SEC on December 22, 1994).
10(d)(v)* Supplemental Retirement Incentive Savings Plan (incorporated herein by reference toExhibit 10(e)(iii) of Cabot’s Annual Report on Form 10-K for the year endedSeptember 30, 1994, file reference 1-5667, filed with the SEC on December 22, 1994).
10(d)(vi)* Supplemental Retirement Savings Plan, as amended and restated effective December 31,2000 (incorporated herein by reference to Exhibit 10(d)(v) of Cabot’s Annual Report onForm 10-K for the year ended September 30, 2003, file reference 1-5667, filed with theSEC on December 23, 2003).
10(d)(vii)* Cabot Corporation Amended and Restated Supplemental Retirement Savings Plan datedDecember 31, 2008 (incorporated by reference to Exhibit 10.2 of Cabot’s Quarterly Reporton Form 10-Q for the quarterly period ended December 31, 2008, file reference 1-5667,filed with the SEC on February 9, 2009).
10(d)(viii)* Cabot Corporation Deferred Compensation Plan dated January 1, 1995 (incorporated hereinby reference to Exhibit 10(e)(v) of Cabot’s Annual Report on Form 10-K for the year endedSeptember 30, 1995, file reference 1-5667, filed with the SEC on December 29, 1995).
10(d)(ix)* Amendment 1997-I to Cabot Corporation Deferred Compensation Plan dated June 30, 1997(incorporated herein by reference to Exhibit 10(d)(vi) of Cabot’s Annual Report onForm 10-K for the year ended September 30, 1997, file reference 1-5667, filed with theSEC on December 24, 1997).
10(d)(x)* Cabot Corporation Amended and Restated Deferred Compensation Plan dated July 13,2007 (incorporated herein by reference to Exhibit 10(d)(viii) of Cabot’s Annual Report onForm 10-K for the year ended September 30, 2007, file reference 1-5667, filed with theSEC on November 29, 2007).
10(d)(xi)* Amendment No. 1 to Cabot Corporation Amended and Restated Deferred CompensationPlan dated November 9, 2007 (incorporated herein by reference to Exhibit 10.2 of Cabot’sQuarterly Report on Form 10-Q for the quarterly period ended December 31, 2007, filereference 1-5667, filed with the SEC on February 11, 2008).
10(d)(xii)* Non-Employee Directors’ Stock Deferral Plan dated July 14, 2006 (incorporated herein byreference to Exhibit 10.1 of Cabot’s Quarterly Report on Form 10-Q for the quarterlyperiod ended June 30, 2006, file reference 1-5667, filed with the SEC on August 9, 2006).
10(d)(xiii)* Amendment No. 1 to Cabot Corporation Non-Employee Directors’ Stock Deferral Plandated November 9, 2007 (incorporated herein by reference to Exhibit 10.2 of Cabot’sQuarterly Report on Form 10-Q for the quarterly period ended December 31, 2007, filereference 1-5667, filed with the SEC on February 11, 2008).
10(d)(xiv)* Amendment No. 2 to Cabot Corporation Amended and Restated Deferred CompensationPlan dated December 31, 2008 (incorporated herein by reference to Exhibit 10.5 of Cabot’sQuarterly Report on Form 10-Q for the quarterly period ended December 31, 2008, filereference 1-5667, filed with the SEC on February 9, 2009).
115

ExhibitNumber Description
10(e) Group Annuity Contract No. GA-6121 between The Prudential Insurance Company ofAmerica and State Street Bank and Trust Company, dated June 28, 1991 (incorporatedherein by reference to Exhibit 10(h) of Cabot’s Annual Report on Form 10-K for the yearended September 30, 1991, file reference 1-5667, filed with the SEC on December 27,1991).
10(f)*† Summary of Compensation for Non-Employee Directors.
10(g) Asset Transfer Agreement, dated as of June 13, 1995, among Cabot Safety Corporation,Cabot Canada Ltd., Cabot Safety Limited, Cabot Corporation, Cabot Safety HoldingsCorporation and Cabot Safety Acquisition Corporation (incorporated herein by reference toExhibit 2(a) of Cabot Corporation’s Current Report on Form 8-K dated July 11, 1995, filereference 1-5667, filed with the SEC July 26, 1995).
10(h)(i)* Cabot Corporation Senior Management Severance Protection Plan, effective January 9, 1998(incorporated herein by reference to Exhibit 10(a) of Cabot’s Quarterly Report onForm 10-Q for the quarterly period ended December 31, 1997, file reference 1-5667, filedwith the SEC February 17, 1998).
10(h)(ii)* Amendment to Cabot Corporation Senior Management Severance Protection Plan, effectiveJanuary 12, 2007 (incorporated herein by reference to Exhibit 10.1 of Cabot’s QuarterlyReport on Form 10-Q for the quarterly period ended December 31, 2006, filereference 1-5667, filed with the SEC on February 9, 2007).
10(h)(iii)* Amendment to Senior Management Severance Protection Plan dated December 31, 2008(incorporated herein by reference to Exhibit 10.3 of Cabot’s Quarterly Report on Form 10-Qfor the quarterly period ended December 31, 2008, file reference 1-5667, filed with the SECon February 9, 2009).
10(i) Fiscal Agency Agreement dated as of September 24, 2003 among Cabot Finance B.V.,Cabot Corporation, and U.S. Bank Trust National Association (incorporated herein byreference to Exhibit 10(l) of Cabot’s Annual Report on Form 10-K for the year endedSeptember 30, 2003, file reference 1-5667, filed with the SEC on December 23, 2003).
10(j)* Offer Letter between Cabot Corporation and Patrick M. Prevost dated November 30, 2007(incorporated herein by reference to Exhibit 10.1 of Cabot’s Quarterly Report on Form 10-Qfor the quarterly period ended December 31, 2007, file reference 1-5667, filed with the SECon February 11, 2008).
10(k)*† Terms of Employment for David Miller effective September 14, 2009.
10(l)* Form of Award Certificate under Cabot Corporation Long-Term Incentive Plan(incorporated herein by reference to Exhibit 10.1 of Cabot’s Quarterly Report on Form 10-Qfor the quarterly period ended March 31, 2008, file reference 1-5667, filed with the SEC onMay 12, 2008).
10(m)*† Severance Agreement between Cabot Corporation and William J. Brady dated October 6,2009.
12† Statement Re: Computation of Ratio of Earnings (Loss) to Fixed Charges.
21† Subsidiaries of Cabot Corporation.
23(i)† Consent of Deloitte & Touche LLP.
116

ExhibitNumber Description
31(i)† Certification of Principal Executive Officer required by Rule 13a-14(a) or Rule 15d-14(a) of theExchange Act.
31(ii)† Certification of Principal Financial Officer required by Rule 13a-14(a) or Rule 15d-14(a) of theExchange Act.
32† Certifications of the Principal Executive Officer and Principal Financial Officer pursuant to 18U.S.C. Section 1350.
* Management contract or compensatory plan or arrangement.† Filed herewith.
(c) Schedules. The Schedules have been omitted because they are not required or are not applicable, orthe required information is shown in the financial statements or notes thereto.
117

SIGNATURES
Pursuant to the requirements of Section 13 or 15(d) of the Securities Exchange Act of 1934, theRegistrant has duly caused this Report to be signed on its behalf by the undersigned, thereunto dulyauthorized.
CABOT CORPORATION
BY: /S/ PATRICK M. PREVOST
Patrick M. Prevost
President and Chief Executive Officer
Date: November 30, 2009
Pursuant to the requirements of the Securities Exchange Act of 1934, this report has been signed belowby the following persons on behalf of the Registrant and in the capacities and on the dates indicated.
Signatures Title Date
/S/ PATRICK M. PREVOSTPatrick M. Prevost
Director, President andChief Executive Officer
November 30, 2009
/S/ EDUARDO E. CORDEIRO
Eduardo E. Cordeiro
Executive Vice President andChief Financial Officer
(principal financial officer)
November 30, 2009
/S/ JAMES P. KELLY
James P. Kelly
Vice President and Controller(principal accounting officer)
November 30, 2009
/S/ JOHN F. O’BRIEN
John F. O’Brien
Director, Non-ExecutiveChairman of the Board
November 30, 2009
/S/ JOHN S. CLARKESON
John S. Clarkeson
Director November 30, 2009
/S/ JUAN ENRIQUEZ-CABOT
Juan Enriquez-Cabot
Director November 30, 2009
/S/ ARTHUR L. GOLDSTEIN
Arthur L. Goldstein
Director November 30, 2009
/S/ GAUTAM S. KAJI
Gautam S. Kaji
Director November 30, 2009
/S/ RODERICK C.G. MACLEODRoderick C.G MacLeod
Director November 30, 2009
/S/ HENRY F. MCCANCE
Henry F. McCance
Director November 30, 2009
/S/ JOHN K. MCGILLICUDDY
John K. McGillicuddy
Director November 30, 2009
118

Signatures Title Date
/S/ RONALDO H. SCHMITZ
Ronaldo H. Schmitz
Director November 30, 2009
/S/ LYDIA W. THOMAS
Lydia W. Thomas
Director November 30, 2009
/S/ MARK S. WRIGHTON
Mark S. Wrighton
Director November 30, 2009
/S/ SHENGMAN ZHANGShengman Zhang
Director November 30, 2009
119

EXHIBIT INDEXExhibitNumber Description
3(a)(i) Restated Certificate of Incorporation of Cabot Corporation effective January 9, 2009(incorporated herein by reference to Exhibit 3.1 of Cabot’s Quarterly Report on Form 10-Qfor the quarterly period ended December 31, 2008, file reference 1-5667, filed with the SECon February 9, 2009).
3(b) † The By-laws of Cabot Corporation as amended September 11, 2009.
4(a)(i) Indenture, dated as of December 1, 1987, between Cabot Corporation and The First NationalBank of Boston, Trustee (the “Indenture”) (incorporated herein by reference to Exhibit 4 ofAmendment No. 1 to Cabot’s Registration Statement on Form S-3, RegistrationNo. 33-18883, filed with the SEC on December 10, 1987).
4(a)(ii) First Supplemental Indenture dated as of June 17, 1992, to the Indenture (incorporated hereinby reference to Exhibit 4.3 of Cabot’s Registration Statement on Form S-3, RegistrationStatement No. 33-48686, filed with the SEC on June 18, 1992).
4(a)(iii) Second Supplemental Indenture, dated as of January 31, 1997, between Cabot Corporationand State Street Bank and Trust Company, Trustee (incorporated herein by reference toExhibit 4 of Cabot’s Quarterly Report on Form 10-Q for the quarterly period endedDecember 31, 1996, file reference 1-5667, filed with the SEC on February 14, 1997).
4(a)(iv) Third Supplemental Indenture, dated as of November 20, 1998, between Cabot Corporationand State Street Bank and Trust Company, Trustee (incorporated herein by reference toExhibit 4.1 of Cabot’s Current Report on Form 8-K, dated November 20, 1998, file reference1-5667, filed with the SEC on November 20, 1998).
4(a)(v) Indenture, dated as of September 21, 2009, between Cabot Corporation and U.S. BankNational Association, as Trustee (incorporated herein by reference to Exhibit 4.1 of Cabot’sRegistration Statement on Form S-3 ASR, Registration Number 333-162021, filed with theSEC on September 21, 2009).
4(a)(vi) First Supplemental Indenture, dated as of September 24, 2009, between Cabot Corporationand U.S. Bank National Association, as Trustee (incorporated herein by reference to Exhibit4.1 of Cabot’s Current Report on Form 8-K dated September 24, 2009, file reference 1-5667,filed with the SEC on September 24, 2009).
10(a)(i) Credit Agreement dated August 3, 2005 among Cabot Corporation, Bank of America, N.A.,as Administrative Agent, Swing Line Lender, and L/C Issuer, Citibank, N.A., as SyndicationAgent, and the other lenders party thereto (incorporated herein by reference to Exhibit 10.1of Cabot’s Quarterly Report on Form 10-Q for the quarterly period ended June 30, 2005, filereference 1-5667, filed with the SEC on August 9, 2005).
10(a)(ii)† Second Amendment to Credit Agreement dated as of September 18, 2009 among CabotCorporation, the lenders party thereto, and Bank of America, N.A., as Administrative Agent.
10(b)(i)* 1996 Equity Incentive Plan (incorporated herein by reference to Exhibit 28 of Cabot’sRegistration Statement on Form S-8, Registration No. 333-03683, filed with the SEC onMay 14, 1996).
10(b)(ii)* 1999 Equity Incentive Plan (incorporated herein by reference to Exhibit 10.1 of Cabot’sQuarterly Report on Form 10-Q for the quarterly period ended March 31, 1999, filereference 1-5667, filed with the SEC on May 17, 1999).
10(b)(iii)* Amendments to Cabot Corporation’s 1996 and 1999 Equity Incentive Plans, dated May 12,2000 (incorporated herein by reference to Exhibit 10 of Cabot’s Quarterly Report onForm 10-Q for the quarterly period ended March 31, 2000, file reference 1-5667, filed withthe SEC on May 15, 2000).
120

ExhibitNumber Description
10(b)(iv)* Amendment to 1999 Equity Incentive Plan dated March 7, 2002 (incorporated herein byreference to Exhibit 10.1 of Cabot’s Quarterly Report on Form 10-Q for the quarterlyperiod ended March 30, 2002, file reference 1-5667, filed with the SEC on May 15, 2002).
10(b)(v)* 2006 Long-Term Incentive Plan (incorporated herein by reference to Appendix B ofCabot’s Proxy Statement on Schedule 14A relating to the 2006 Annual Meeting ofStockholders, file reference 1-5667, filed with the SEC on January 30, 2006).
10(b)(vi)* 2009 Long-Term Incentive Plan (incorporated herein by reference to Appendix B ofCabot’s Proxy Statement on Schedule 14A relating to the 2009 Annual Meeting ofStockholders, file reference 1-5667, filed with the SEC on January 28, 2009).
10(b)(vii)* Non-Employee Directors’ Stock Compensation Plan (incorporated herein by reference toAppendix B of Cabot’s Proxy Statement on Schedule 14A relating to the 2006 AnnualMeeting of Stockholders, file reference 1-5667, filed with the SEC on January 30, 2006).
10(b)(viii)* Cabot Corporation Short-Term Incentive Compensation Plan (incorporated herein byreference to Appendix C of Cabot’s Proxy Statement on Schedule 14A relating to the 2007Annual Meeting of Stockholders, file reference 1-5667, filed with the SEC on January 29,2007).
10(b)(ix)* Amendment to Cabot Corporation Short-Term Incentive Compensation Plan datedDecember 31, 2008 (incorporated by reference to Exhibit 10.4 of Cabot’s Quarterly Reporton Form 10-Q for the quarterly period ended December 31, 2008, file reference 1-5667,filed with the SEC on February 9, 2009).
10(c) Note Purchase Agreement between John Hancock Mutual Life Insurance Company, StateStreet Bank and Trust Company, as trustee for the Cabot Corporation Employee StockOwnership Plan, and Cabot Corporation, dated as of November 15, 1988 (incorporated byreference to Exhibit 10(c) of Cabot’s Annual Report on Form 10-K for the year endedSeptember 30, 1988, file reference 1-5667, filed with the SEC on December 29, 1988).
10(d)(i)* Supplemental Cash Balance Plan (incorporated herein by reference to Exhibit 10(e)(i) ofCabot’s Annual Report on Form 10-K for the year ended September 30, 1994, file reference1-5667, filed with the SEC on December 22, 1994).
10(d)(ii)* Supplemental Cash Balance Plan, as amended and restated effective January 1, 2002(incorporated herein by reference to Exhibit 10(d)(ii) of Cabot’s Annual Report onForm 10-K for the year ended September 30, 2003, file reference 1-5667, filed with theSEC on December 23, 2003).
10(d)(iii)* Cabot Corporation Amended and Restated Supplemental Cash Balance Plan datedDecember 31, 2008 (incorporated herein by reference to Exhibit 10.1 of Cabot’s QuarterlyReport on Form 10-Q for the quarterly period ended December 31, 2008, file reference1-5667, filed with the SEC on February 9, 2009).
10(d)(iv)* Supplemental Employee Stock Ownership Plan (incorporated herein by reference toExhibit 10(e)(ii) of Cabot’s Annual Report on Form 10-K for the year ended September 30,1994, file reference 1-5667, filed with the SEC on December 22, 1994).
10(d)(v)* Supplemental Retirement Incentive Savings Plan (incorporated herein by reference toExhibit 10(e)(iii) of Cabot’s Annual Report on Form 10-K for the year endedSeptember 30, 1994, file reference 1-5667, filed with the SEC on December 22, 1994).
121

ExhibitNumber Description
10(d)(vi)* Supplemental Retirement Savings Plan, as amended and restated effective December 31,2000 (incorporated herein by reference to Exhibit 10(d)(v) of Cabot’s Annual Report onForm 10-K for the year ended September 30, 2003, file reference 1-5667, filed with theSEC on December 23, 2003).
10(d)(vii)* Cabot Corporation Amended and Restated Supplemental Retirement Savings Plan datedDecember 31, 2008 (incorporated by reference to Exhibit 10.2 of Cabot’s Quarterly Reporton Form 10-Q for the quarterly period ended December 31, 2008, file reference 1-5667,filed with the SEC on February 9, 2009).
10(d)(viii)* Cabot Corporation Deferred Compensation Plan dated January 1, 1995 (incorporated hereinby reference to Exhibit 10(e)(v) of Cabot’s Annual Report on Form 10-K for the year endedSeptember 30, 1995, file reference 1-5667, filed with the SEC on December 29, 1995).
10(d)(ix)* Amendment 1997-I to Cabot Corporation Deferred Compensation Plan dated June 30, 1997(incorporated herein by reference to Exhibit 10(d)(vi) of Cabot’s Annual Report on Form10-K for the year ended September 30, 1997, file reference 1-5667, filed with the SEC onDecember 24, 1997).
10(d)(x)* Cabot Corporation Amended and Restated Deferred Compensation Plan dated July 13,2007 (incorporated herein by reference to Exhibit 10(d)(viii) of Cabot’s Annual Report onForm 10-K for the year ended September 30, 2007, file reference 1-5667, filed with theSEC on November 29, 2007).
10(d)(xi)* Amendment No. 1 to Cabot Corporation Amended and Restated Deferred CompensationPlan dated November 9, 2007 (incorporated herein by reference to Exhibit 10.2 of Cabot’sQuarterly Report on Form 10-Q for the quarterly period ended December 31, 2007, filereference 1-5667, filed with the SEC on February 11, 2008).
10(d)(xii)* Non-Employee Directors’ Stock Deferral Plan dated July 14, 2006 (incorporated herein byreference to Exhibit 10.1 of Cabot’s Quarterly Report on Form 10-Q for the quarterlyperiod ended June 30, 2006, file reference 1-5667, filed with the SEC on August 9, 2006).
10(d)(xiii)* Amendment No. 1 to Cabot Corporation Non-Employee Directors’ Stock Deferral Plandated November 9, 2007 (incorporated herein by reference to Exhibit 10.2 of Cabot’sQuarterly Report on Form 10-Q for the quarterly period ended December 31, 2007, filereference 1-5667, filed with the SEC on February 11, 2008).
10(d)(xiv)* Amendment No. 2 to Cabot Corporation Amended and Restated Deferred CompensationPlan dated December 31, 2008 (incorporated herein by reference to Exhibit 10.5 of Cabot’sQuarterly Report on Form 10-Q for the quarterly period ended December 31, 2008, filereference 1-5667, filed with the SEC on February 9, 2009).
10(e) Group Annuity Contract No. GA-6121 between The Prudential Insurance Company ofAmerica and State Street Bank and Trust Company, dated June 28, 1991 (incorporatedherein by reference to Exhibit 10(h) of Cabot’s Annual Report on Form 10-K for the yearended September 30, 1991, file reference 1-5667, filed with the SEC on December 27,1991).
10(f)*† Summary of Compensation for Non-Employee Directors.
10(g) Asset Transfer Agreement, dated as of June 13, 1995, among Cabot Safety Corporation,Cabot Canada Ltd., Cabot Safety Limited, Cabot Corporation, Cabot Safety HoldingsCorporation and Cabot Safety Acquisition Corporation (incorporated herein by reference toExhibit 2(a) of Cabot Corporation’s Current Report on Form 8-K dated July 11, 1995, filereference 1-5667, filed with the SEC July 26, 1995).
122

ExhibitNumber Description
10(h)(i)* Cabot Corporation Senior Management Severance Protection Plan, effective January 9, 1998(incorporated herein by reference to Exhibit 10(a) of Cabot’s Quarterly Report onForm 10-Q for the quarterly period ended December 31, 1997, file reference 1-5667, filedwith the SEC February 17, 1998).
10(h)(ii)* Amendment to Cabot Corporation Senior Management Severance Protection Plan, effectiveJanuary 12, 2007 (incorporated herein by reference to Exhibit 10.1 of Cabot’s QuarterlyReport on Form 10-Q for the quarterly period ended December 31, 2006, file reference1-5667, filed with the SEC on February 9, 2007).
10(h)(iii)* Amendment to Senior Management Severance Protection Plan dated December 31, 2008(incorporated herein by reference to Exhibit 10.3 of Cabot’s Quarterly Report on Form 10-Qfor the quarterly period ended December 31, 2008, file reference 1-5667, filed with the SECon February 9, 2009).
10(i) Fiscal Agency Agreement dated as of September 24, 2003 among Cabot Finance B.V.,Cabot Corporation, and U.S. Bank Trust National Association (incorporated herein byreference to Exhibit 10(l) of Cabot’s Annual Report on Form 10-K for the year endedSeptember 30, 2003, file reference 1-5667, filed with the SEC on December 23, 2003).
10(j)* Offer Letter between Cabot Corporation and Patrick M. Prevost dated November 30, 2007(incorporated herein by reference to Exhibit 10.1 of Cabot’s Quarterly Report on Form 10-Qfor the quarterly period ended December 31, 2007, file reference 1-5667, filed with the SECon February 11, 2008).
10(k)* † Terms of Employment for David Miller effective September 14, 2009.
10(l)* Form of Award Certificate under Cabot Corporation Long-Term Incentive Plan(incorporated herein by reference to Exhibit 10.1 of Cabot’s Quarterly Report on Form 10-Qfor the quarterly period ended March 31, 2008, file reference 1-5667, filed with the SEC onMay 12, 2008).
10(m)*† Severance Agreement between Cabot Corporation and William J. Brady dated October 6,2009.
12† Statement Re: Computation of Ratio of Earnings (Loss) to Fixed Charges.
21† Subsidiaries of Cabot Corporation.
23(i)† Consent of Deloitte & Touche LLP.
31(i)† Certification of Principal Executive Officer required by Rule 13a-14(a) or Rule 15d-14(a) ofthe Exchange Act.
31(ii)† Certification of Principal Financial Officer required by Rule 13a-14(a) or Rule 15d-14(a) ofthe Exchange Act.
32† Certifications of the Principal Executive Officer and Principal Financial Officer pursuant to18 U.S.C. Section 1350.
* Management contract or compensatory plan or arrangement.† Filed herewith.
123

[THIS PAGE INTENTIONALLY LEFT BLANK]
EXHIBIT 31(i)
Principal Executive Officer Certification
I, Patrick M. Prevost, certify that:
1. I have reviewed this annual report on Form 10-K of Cabot Corporation;
2. Based on my knowledge, this report does not contain any untrue statement of a material fact or omitto state a material fact necessary to make the statements made, in light of the circumstances under whichsuch statements were made, not misleading with respect to the period covered by this report;
3. Based on my knowledge, the financial statements, and other financial information included in thisreport, fairly present in all material respects the financial condition, results of operations and cash flows ofthe registrant as of, and for, the periods presented in this report;
4. The registrant’s other certifying officer(s) and I are responsible for establishing and maintainingdisclosure controls and procedures (as defined in Exchange Act Rules 13a-15(e) and 15d-15(e)) and internalcontrol over financial reporting (as defined in Exchange Act Rules 13a-15(f) and 15d-15(f)) for theregistrant and have:
a) designed such disclosure controls and procedures, or caused such disclosure controls andprocedures to be designed under our supervision, to ensure that material information relating to theregistrant, including its consolidated subsidiaries, is made known to us by others within those entities,particularly during the period in which this report is being prepared;
b) designed such internal control over financial reporting, or caused such internal control overfinancial reporting to be designed under our supervision, to provide reasonable assurance regarding thereliability of financial reporting and the preparation of financial statements for external purposes inaccordance with generally accepted accounting principles;
c) evaluated the effectiveness of the registrant’s disclosure controls and procedures and presentedin this report our conclusions about the effectiveness of the disclosure controls and procedures, as ofthe end of the period covered by this report based on such evaluation; and
d) disclosed in this report any change in the registrant’s internal control over financial reportingthat occurred during the registrant’s most recent fiscal quarter (the registrant’s fourth fiscal quarter inthe case of an annual report) that has materially affected, or is reasonably likely to materially affect, theregistrant’s internal control over financial reporting; and
5. The registrant’s other certifying officer(s) and I have disclosed, based on our most recent evaluationof internal control over financial reporting, to the registrant’s auditors and the audit committee of theregistrant’s board of directors (or persons performing the equivalent functions):
a) all significant deficiencies and material weaknesses in the design or operation of internalcontrol over financial reporting which are reasonably likely to adversely affect the registrant’s abilityto record, process, summarize and report financial information; and
b) any fraud, whether or not material, that involves management or other employees who have asignificant role in the registrant’s internal control over financial reporting.
Date: November 30, 2009 /S/ PATRICK M. PREVOST
Patrick M. PrevostPresident and
Chief Executive Officer

EXHIBIT 31(ii)
Principal Financial Officer Certification
I, Eduardo E. Cordeiro, certify that:
1. I have reviewed this annual report on Form 10-K of Cabot Corporation;
2. Based on my knowledge, this report does not contain any untrue statement of a material fact or omitto state a material fact necessary to make the statements made, in light of the circumstances under whichsuch statements were made, not misleading with respect to the period covered by this report;
3. Based on my knowledge, the financial statements, and other financial information included in thisreport, fairly present in all material respects the financial condition, results of operations and cash flows ofthe registrant as of, and for, the periods presented in this report;
4. The registrant’s other certifying officer(s) and I are responsible for establishing and maintainingdisclosure controls and procedures (as defined in Exchange Act Rules 13a-15(e) and 15d-15(e)) and internalcontrol over financial reporting (as defined in Exchange Act Rules 13a-15(f) and 15d-15(f)) for theregistrant and have:
a) designed such disclosure controls and procedures, or caused such disclosure controls andprocedures to be designed under our supervision, to ensure that material information relating to theregistrant, including its consolidated subsidiaries, is made known to us by others within those entities,particularly during the period in which this report is being prepared;
b) designed such internal control over financial reporting, or caused such internal control overfinancial reporting to be designed under our supervision, to provide reasonable assurance regarding thereliability of financial reporting and the preparation of financial statements for external purposes inaccordance with generally accepted accounting principles;
c) evaluated the effectiveness of the registrant’s disclosure controls and procedures and presentedin this report our conclusions about the effectiveness of the disclosure controls and procedures, as ofthe end of the period covered by this report based on such evaluation; and
d) disclosed in this report any change in the registrant’s internal control over financial reportingthat occurred during the registrant’s most recent fiscal quarter (the registrant’s fourth fiscal quarter inthe case of an annual report) that has materially affected, or is reasonably likely to materially affect, theregistrant’s internal control over financial reporting; and
5. The registrant’s other certifying officer(s) and I have disclosed, based on our most recent evaluationof internal control over financial reporting, to the registrant’s auditors and the audit committee of theregistrant’s board of directors (or persons performing the equivalent functions):
a) all significant deficiencies and material weaknesses in the design or operation of internalcontrol over financial reporting which are reasonably likely to adversely affect the registrant’s abilityto record, process, summarize and report financial information; and
b) any fraud, whether or not material, that involves management or other employees who have asignificant role in the registrant’s internal control over financial reporting.
Date: November 30, 2009 /S/ EDUARDO E. CORDEIRO
Eduardo E. CordeiroExecutive Vice President and
Chief Financial Officer

EXHIBIT 32
Certifications Pursuant to 18 U.S.C. Section 1350,as Adopted Pursuant to Section 906 of the
Sarbanes-Oxley Act of 2002
In connection with the filing of the Annual Report on Form 10-K for the year ended September 30,2009 (the “Report”) by Cabot Corporation (the “Company”), each of the undersigned hereby certifiespursuant to 18 U.S.C. Section 1350, as adopted pursuant to Section 906 of the Sarbanes-Oxley Act of 2002,that, to his knowledge:
1. The Report fully complies with the requirements of section 13 (a) or 15 (d) of the SecuritiesExchange Act of 1934, as amended; and
2. The information contained in the Report fairly presents, in all material respects, the financialcondition and results of operations of the Company.
November 30, 2009 /S/ PATRICK M. PREVOST
Patrick M. PrevostPresident and
Chief Executive Officer
November 30, 2009 /S/ EDUARDO E. CORDEIRO
Eduardo E. CordeiroExecutive Vice President and
Chief Financial Officer

[THIS PAGE INTENTIONALLY LEFT BLANK]

Cabot Values
Integrity. We demand adherence to the highest ethical standards.
We demand personal integrity, compliance with all laws and
regulations, unwavering efforts toward the highest quality in
all areas, and indisputable respect for safety, health and the
environment.
Respect. We must be open, honest, straightforward and trustwor-
thy. We listen and learn from each other, our customers and the
outside world, and share our learnings generously.
Innovation. We work urgently and intensely to create new ways to
bring more value to our customers and to open new markets for
our products. We continuously improve by understanding success-
es and failures—our own and others.
Competitiveness. To be the best, we strive for excellence in every-
thing we do. We listen to our customers, owners and markets, and
we compete aggressively to exceed their expectations using team-
work, leadership and self-confidence. We seize opportunities with
urgency, persistence and courage.
www.cabot-corp.com
002CS1A034