sap performance benchmarking · sap provides this document as guidance only to illustrate estimated...
TRANSCRIPT
6/25/2012
SAP Performance Benchmarking
Company: ABC Company
Human Capital Management Benchmarking Results
© 2012 SAP AG. All rights reserved. 2Confidential
Statement of Confidentiality and Exceptions
The information and analysis contained herein are the confidential and proprietary materials of SAP AG. No part of this publication may be reproducedor transmitted in any form or for any purpose without the express written permission of SAP AG. The information contained herein may be changedwithout prior notice.
The furnishing of this document shall not be construed as an offer or as constituting a binding agreement on the part of SAP AG and/or its affiliatedcompanies (“SAP”) to enter into any relationship. SAP provides this document as guidance only to illustrate estimated comparisons between the subjectCompany and other companies with respect to certain key performance indicators and drivers.
These materials may be based upon information provided by the subject Company, information provided by other companies and assumptions that aresubject to change. These materials present illustrations of potential performance and cost savings, and do not guaranty future results, performance orcost savings. The materials are provided solely for internal review and use by the subject Company. SAP makes no representation or warranties of anykind with respect to these materials, and SAP shall not be liable for errors or omissions with respect to these materials.
© 2012 SAP AG. All rights reserved. 3Confidential
Agenda
Study Background
Metrics Comparison and Best Practice Adoption
Case Studies

Study Background
© 2012 SAP AG. All rights reserved. 5Confidential
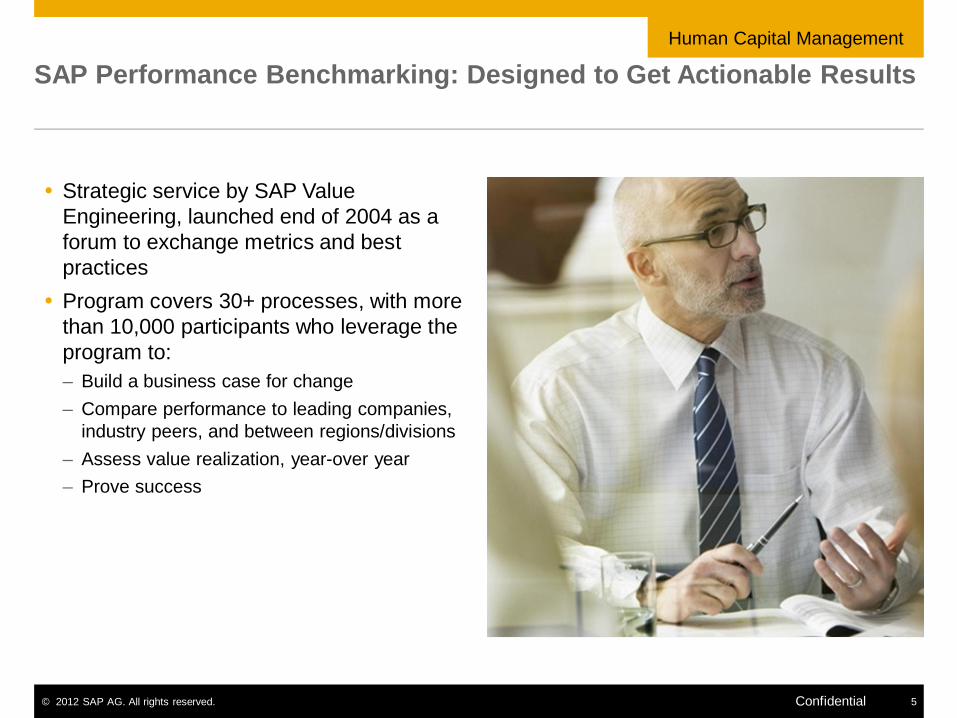
SAP Performance Benchmarking: Designed to Get Actionable Results
Strategic service by SAP Value Engineering, launched end of 2004 as a forum to exchange metrics and best practicesProgram covers 30+ processes, with more than 10,000 participants who leverage the program to:– Build a business case for change– Compare performance to leading companies,
industry peers, and between regions/divisions– Assess value realization, year-over year– Prove success
Human Capital Management

© 2012 SAP AG. All rights reserved. 6Confidential
Profile Data – Company and Peer Set
Peer Group Size* Average number of organizations represented in each metric 444
Peer Group Coverage* Percent of metrics for which benchmarks can be calculated 100%
Company Information
Industry Consumer Products
Sub-Industry Consumer Durables and Home Appliances (CD&HA)
Annual Revenue 1000000000
Regions/ Divisions Included North America
Comparative Scope – Selected Peer Group
Industry Industry X
Sub Industry All
Revenue All
Region All
Participant Name ABC
Title Manager
Currency U.S.Dollar
Entire Company or Division Regional Entity Maine Customized Filter
Question/KPI N/A
Question/KPI N/A
Question/KPI N/A
*We do not publish sample sizes as part of the survey validation process so you may receive a value of “0” for Peer Group Size and Peer Group Coverage. Once validation is completed against the overall database, please request a custom peer group for a more accurate comparison.
Human Capital Management

© 2012 SAP AG. All rights reserved. 7Confidential
Overall Database Profile
By Region By Industry Sector
767*Number of Companies in HCM Overall Database:
Note: Several miscellaneous industries have been grouped under “Other”
By Employees
* Data is leveraged from other surveys as well where KPIs overlap
Human Capital Management

Metrics Comparisonand Best Practice Adoption
© 2012 SAP AG. All rights reserved. 9Confidential
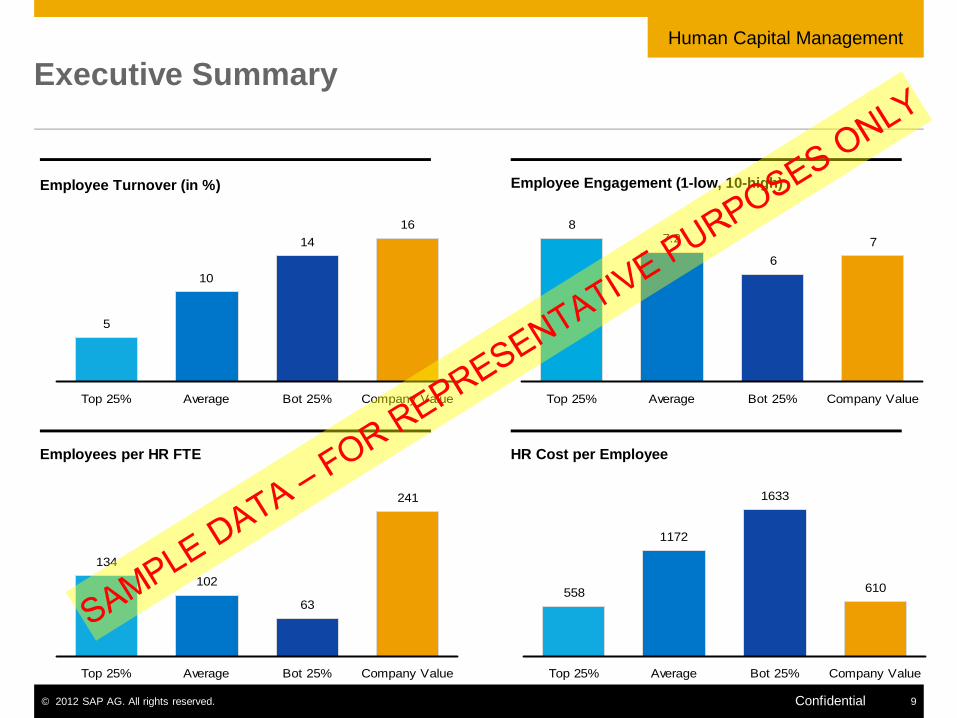
Executive Summary
5
10
1416
Top 25% Average Bot 25% Company Value
87.2
67
Top 25% Average Bot 25% Company Value
134102
63
241
Top 25% Average Bot 25% Company Value
558
1172
1633
610
Top 25% Average Bot 25% Company Value
Employee Turnover (in %) Employee Engagement (1-low, 10-high)
Employees per HR FTE HR Cost per Employee
Human Capital Management

© 2012 SAP AG. All rights reserved. 10Confidential
Key Metrics
Metric Company ValuePeer Group
Average Top 25%
Employee Engagement (1-low, 10-high) 7.0 7.2 8.0
Employee Turnover (in %) 16.0 10.0 5.0
Employee Referral Rate (% of external hires) 10.0 16.9 25.0
Employees Trained (in %) 69 71 100
Paycheck Errors (in %) 0.9 0.5 0.0
Manager's Time on Employee Admin. (in %) 10.0 13.1 5.0
Employees per HR FTE 241 102 134
HR Cost per Employee 610 1172 558
HR Staff on Transactional Activities (in %) 50.0 36.8 25.0
Time to Hire (in days) 30 41 25
Cost per Hire 5570 3146 840
Performance Results –Metrics
First QuartileBetween Average and First QuartileBelow Average OutlierRanking:
Human Capital Management
© 2012 SAP AG. All rights reserved. 11Confidential
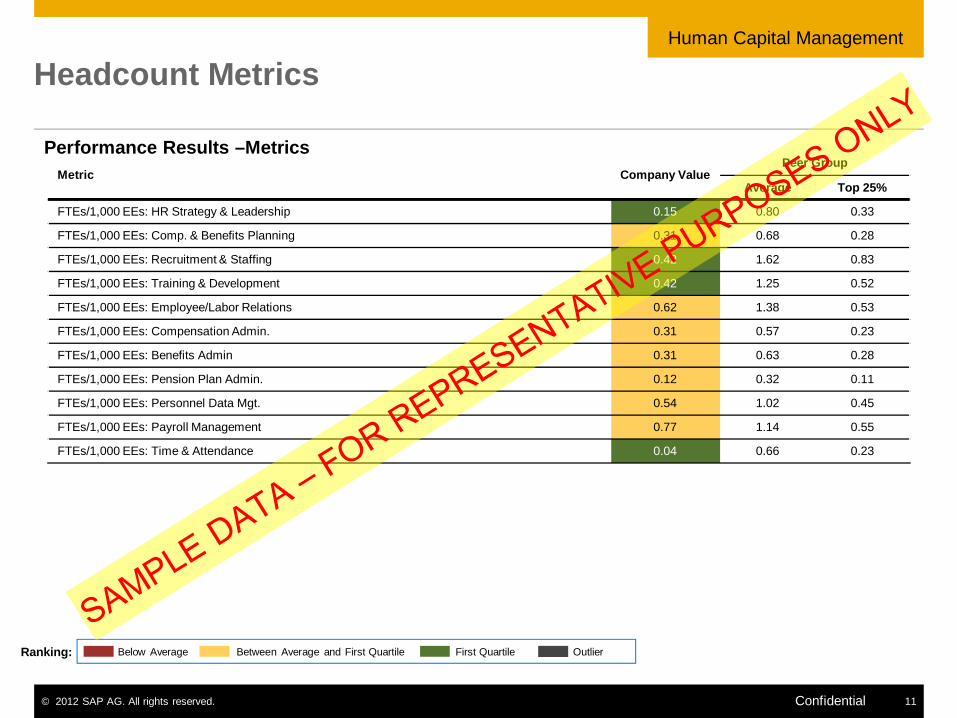
Headcount Metrics
Metric Company ValuePeer Group
Average Top 25%
FTEs/1,000 EEs: HR Strategy & Leadership 0.15 0.80 0.33
FTEs/1,000 EEs: Comp. & Benefits Planning 0.31 0.68 0.28
FTEs/1,000 EEs: Recruitment & Staffing 0.42 1.62 0.83
FTEs/1,000 EEs: Training & Development 0.42 1.25 0.52
FTEs/1,000 EEs: Employee/Labor Relations 0.62 1.38 0.53
FTEs/1,000 EEs: Compensation Admin. 0.31 0.57 0.23
FTEs/1,000 EEs: Benefits Admin 0.31 0.63 0.28
FTEs/1,000 EEs: Pension Plan Admin. 0.12 0.32 0.11
FTEs/1,000 EEs: Personnel Data Mgt. 0.54 1.02 0.45
FTEs/1,000 EEs: Payroll Management 0.77 1.14 0.55
FTEs/1,000 EEs: Time & Attendance 0.04 0.66 0.23
Performance Results –Metrics
First QuartileBetween Average and First QuartileBelow Average OutlierRanking:
Human Capital Management

© 2012 SAP AG. All rights reserved. 12Confidential
Headcount Metrics
134102
63
241
Top 25% Average Bot 25% Company Value
3.36
5.76
7.7
1.92
Top 25% Average Bot 25% Company Value
2.31
4.24
5.72
2.08
Top 25% Average Bot 25% Company Value
Employees per HR FTE HR FTEs per 1000 Employees: Expertise/ Strategic Functions
HR FTEs per 1000 Employees: Transactional Functions
Human Capital Management
© 2012 SAP AG. All rights reserved. 13Confidential
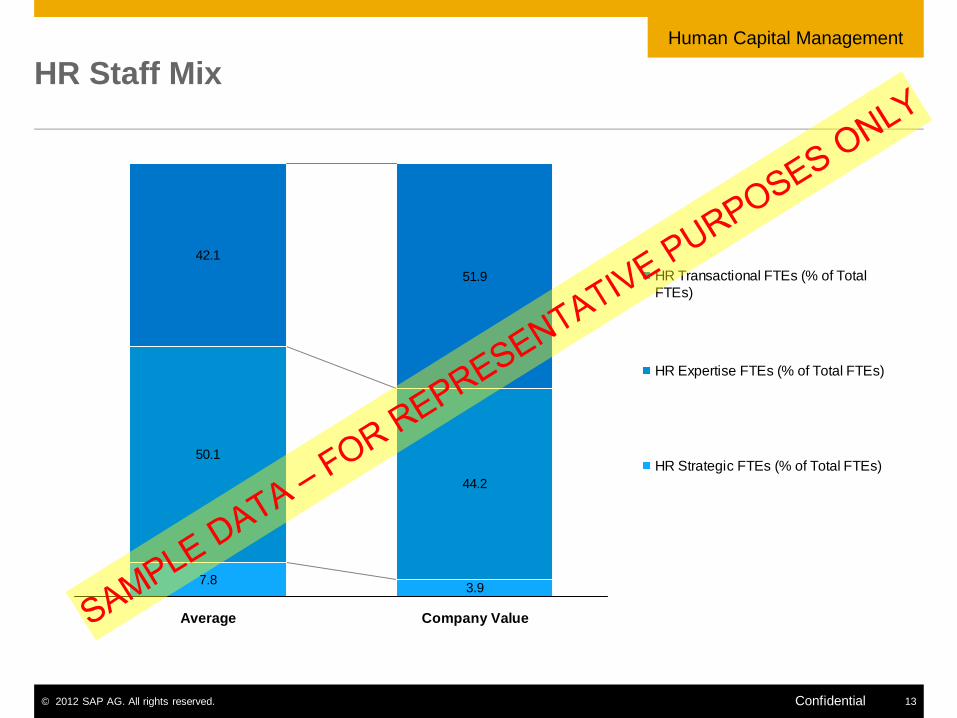
3.9
44.2
51.9
7.8
50.1
42.1
Average Company Value
HR Transactional FTEs (% of TotalFTEs)
HR Expertise FTEs (% of Total FTEs)
HR Strategic FTEs (% of Total FTEs)
HR Staff MixHuman Capital Management

© 2012 SAP AG. All rights reserved. 14Confidential
Cost Metrics
Metric Company ValuePeer Group
Average Top 25%
HR Costs/ EE: HR Strategy & Leadership 16 55 16
HR Costs/ EE: Comp. & Benefits Planning 30 44 14
HR Costs/ EE: Recruitment & Staffing 42 137 48
HR Costs/ EE: Training & Development 55 114 33
HR Costs/ EE: Employee/Labor Relations 55 101 32
HR Costs/ EE: Compensation Admin. 28 47 15
HR Costs/ EE: Benefits Admin. 28 57 18
HR Costs/ EE: Pension Plan Admin. 25 34 10
HR Costs/ EE: Personnel Data Mgt. 48 81 26
HR Costs/ EE: Payroll Management 98 94 34
HR Costs/ EE: Time & Attendance 3 44 16
Performance Results –Metrics
First QuartileBetween Average and First QuartileBelow Average OutlierRanking:
Human Capital Management

© 2012 SAP AG. All rights reserved. 15Confidential
Cost Metrics
558
1172
1633
610
Top 25% Average Bot 25% Company Value
250
539
744
198
Top 25% Average Bot 25% Company Value
166
356
477
230
Top 25% Average Bot 25% Company Value
HR Cost per Employee HR Cost per Employee: Expertise/ Strategic Functions
HR Cost per Employee: Transactional Functions
Human Capital Management

© 2012 SAP AG. All rights reserved. 16Confidential
61.3
38.7
0.00.0
63.5
20.6
6.1
9.8
Average Company Value
HR Other Costs (% of Total HR Cost)
HR Technology Costs (% of Total HRCost)
HR External Expenditures (% of TotalHR Cost)
HR Headcount Costs (% of Total HRCost)
HR Cost MixHuman Capital Management

© 2012 SAP AG. All rights reserved. 17Confidential
Enabling Technology
1
1.3
1 1
Top 25% Average Bot 25% Company Value
2
5.8
8
3
Top 25% Average Bot 25% Company Value
6
38
50
15
Top 25% Average Bot 25% Company Value
Number of ERP Instances Applications In Addition To ERP (In House & Outsourced)
Spreadsheet Applications For Tracking And Reporting
Human Capital Management

© 2012 SAP AG. All rights reserved. 18Confidential
Self Service Usage
49.0%
2.3%
44.7%
4.0%
No Self Service
Employee Self ServiceOnly
Manager Self Service Only
Both (ESS & MSS)
Customer ResponseNo Self Service
Self Service Usage
Human Capital Management

© 2012 SAP AG. All rights reserved. 19Confidential
Transaction Enablers
70
40
10.8 10
Top 25% Average Bot 25% Company Value
90
56.8
22
40
Top 25% Average Bot 25% Company Value
Transactions Via Self Service (in %) Transactions Via EIC (in %)
Human Capital Management

© 2012 SAP AG. All rights reserved. 20Confidential
Transaction Metrics
13.7
8.6
1.5 1.9
Top 25% Average Bot 25% Company Value
2976.2
1907.4
306.8
925.9
Top 25% Average Bot 25% Company Value
12
123
211
120
Top 25% Average Bot 25% Company Value
HR Transactions per Employee Transactions Per HR FTE
HR Cost Per Transaction
Human Capital Management

© 2012 SAP AG. All rights reserved. 21Confidential
Best Practices
1.5
2.0 2.0
1.3
2.0
1.3
3.53.7
2.7
2.0
1.5
3.8
4.3
4.85.0
3.33.0 3.0
5.0
4.3
5.0
4.0
0
1
2
3
4
5
6
HR StrategyAnd
Leadership
CompensationAnd Benefits
Planning
Recruiting AndStaffing
Training AndDevelopment
Employee AndLabor
Relations
CompensationAdministration
BenefitsAdministration
Pension PlanAdministration
PersonnelData
Management
PayrollManagement
Time AndAttendance
TOP 25% Average Company Coverage Company Importance
Company Best Practice Importance Compared to Coverage Contrasted Against Peer Responses
1 = No Coverage5 = Full Coverage
Human Capital Management

© 2012 SAP AG. All rights reserved. 22Confidential
HR Strategy And Leadership
0
1
2
3
4
5
6
1 2 3 4
TOP 25% AverageCompany Coverage Company Importance
Best Practice Ranking1HR system supports a balanced scorecard framework which is integrated into department and individual performance appraisal documents
2HR system has automated reporting and analysis capabilities to identify which processes need to improve operational efficiencies, data accuracy and timeliness, and costs
3 HR system allows to analyze workforce data, as well as design, implementation and monitoring of strategies to optimize the workforce
4HR system enables accurate planning, monitoring of actual performance to plan and simulation of planning scenarios with analysis of financial impact of headcount changes
Best Practice Listing
1 = No Coverage5 = Full Coverage
Human Capital Management
Best Practices for HR Strategy and Leadership: Impact on Employee Engagement and Employee TurnoverBest Practice Adoption/ Employee Engagement (1 = Low, 10 = High)HR system allows for a Balanced Scorecard framework which is integrated into department and individual performance appraisal documents and which supports benchmarking and continuous improvement
7.56.9+9%
Low High
Best Practice Adoption/ Employee Turnover (in %)HR system enables HR professionals to develop cost effective resource strategies, by supporting accurate planning process, allowing monitoring of actual performance relative to plan and allowing simulation of multiple planning scenarios with analysis of the financial impact of headcount changes
10.4%15.9%-34%
Low High

© 2012 SAP AG. All rights reserved. 23Confidential
Compensation And Benefits Planning
0
1
2
3
4
5
6
1 2 3 4 5 6 7
TOP 25% AverageCompany Coverage Company Importance
Best Practice Ranking1Compensation system supports a variety of job-pricing activities, incl. performing salary surveys, importing job/ salary data from survey providers, and defining market-based standards
2Compensation planning system has automated analysis and reporting capabilities to model the impact of compensation plan changes on the overall business model
3Compensation planning system supports standardized job evaluation criteria to enable rapid classification of new positions for compensation purposes
4Compensation planning system integrates information from sales-processing, financial systems, CRM etc. to identify and reward performance that is important to the business
5 Benefits planning system leverages general plan information across plan; No re-keying of plan information necessity
6 Benefits planning system integrates with HR/ payroll system
7Benefits planning system has automated analysis and reporting capabilities to model the impact of plan changes on the overall business, and to benchmark overall healthcare cost
Best Practice Listing
1 = No Coverage5 = Full Coverage
Human Capital Management
Best Practices for Compensation and Benefits Planning: Impact on Process Efficiencies
Best Practice Adoption/ Compensation and Benefits Planning Cost Per Employee ($)
Compensation planning system supports standardized job evaluation criteria to enable rapid classification of new positions for compensation purposes
45.975.1-39%
Low High

© 2012 SAP AG. All rights reserved. 24Confidential
Recruiting And Staffing
0
1
2
3
4
5
6
1 2 3 4
TOP 25% AverageCompany Coverage Company Importance
Best Practice Ranking1 External and internal applicants are able to place themselves in a talent pipeline according to their own interests or goals
2Hiring managers have comprehensive recruiting self-service, incl. the ability to submit job requirement profiles; use of approval workflows; view of candidate short lists and data
3Recruiting system automates candidate administration, with interview, rejection, offer letters generated automatically based on templates and online interview assessments
4 Recruiting system has automated analysis and reporting capabilities to analyze the talent pool and to measure source effectiveness
Best Practice Listing
1 = No Coverage5 = Full Coverage
Human Capital Management
Best Practices for Recruitment and Staffing: Impact on Time to Hire and Process Efficiency Best Practice Adoption (Retail Companies)/ Time to Hire (Days)External and internal applicants are able to place themselves in a talent pipeline according to their own interests or goals 26.133.3
-21%Low High
Best Practice Adoption (Oil & Gas Companies)/ Time to Hire (Days)
External and internal applicants are able to place themselves in a talent pipeline according to their own interests or goals 33.841.0
-18%Low High
Best Practice Adoption (High Tech Companies)/ Recruitment and Staffing HR FTEs per 1,000 EmployeesHiring managers have comprehensive recruiting self-service, including the ability to create and submit job requirement profiles for approval; use approval workflows for requirements profiles; view candidate short lists and profile and application data; and respond to questionnaires about candidates
2.83.5-19%
Low High

© 2012 SAP AG. All rights reserved. 25Confidential
Training And Development
0
1
2
3
4
5
6
1 2 3 4
TOP 25% AverageCompany Coverage Company Importance
Best Practice Ranking1Simple content authoring processes are in place; Learning system allows separate views for subject matter experts and instructional designers
2Learning system has automated reports available to assess training effectiveness by correlating corporate KPIs with training results (e.g. technical training with machine down time)
3Regular evaluation of employee development needs performed as part of performance appraisal; system pushes course offerings to employees based on performance gaps
4Learning system allows for streamlined processing of follow up activities, such as participation confirmation, competency/ proficiency results, digital validation
Best Practice Listing
1 = No Coverage5 = Full Coverage
Human Capital Management
Best Practices for Training and Development: Impact on Employee Engagement
Best Practice Adoption/ Employee Engagement (1 = Low, 10 = High)Learning system has automated reports available to assess training effectiveness by correlating corporate KPIs with training results (e.g., sales increases with successful sales training completion, technical training with machine down time/ workers comp)
7.67.0+9%
Low High
Best Practice Adoption/ Employee Engagement (1 = Low, 10 = High)Regular evaluation of employee development and training needs performed as part of performance appraisal process; system automatically pushes course offerings to employees based on their job requirements or performance gaps; automatic update of employee
7.36.8+8%
Low High

© 2012 SAP AG. All rights reserved. 26Confidential
Employee And Labor Relations
0
1
2
3
4
5
6
1 2 3 4
TOP 25% AverageCompany Coverage Company Importance
Best Practice Ranking1HR system supports organization structure, enables HR professionals to simulate proposed organizational changes, and allows mass changes across positions or organizations
2The 'Employee Interaction Center' system provides for monitoring of key performance metrics such as cycle times, errors by process and monitoring of self-service usage
3 HR system allows monitoring and tracking of grievances and arbitrations
4Line managers have online access to bargaining updates and policies/ procedures, and receive a prompt if significant changes arise which may impact their day to day business
Best Practice Listing
1 = No Coverage5 = Full Coverage
Human Capital Management
Best Practices for Employee and Labor Relations: Impact on Cost Per Employee and Process Efficiencies
Best Practice Adoption/ Employee and Labor Relations Cost Per Employee ($)
The Employee Service Center system provides for monitoring of key performance metrics such as average process execution cycle times, percentage of specialists in execution time, errors by process and monitoring of self-service usage
69.4103.4-33%
Low High
Best Practice Adoption/ Employee and Labor Relations HR FTEs per 1,000 Employees
HR system allows to monitor and track grievances and arbitrations1.51.9
-20%
Low High

© 2012 SAP AG. All rights reserved. 27Confidential
Compensation Administration
0
1
2
3
4
5
6
1 2 3
TOP 25% AverageCompany Coverage Company Importance
Best Practice Ranking1 Direct link between job description preparation and job evaluations are available online
2 Standardized job descriptions and job evaluations are available online
3
Compensation system provides comprehensive manager self service for displaying and editing employee compensation-related data, activating planned/ approved compensation adjustments, and transmitting the information to payroll
Best Practice Listing
1 = No Coverage5 = Full Coverage
Human Capital Management
Best Practices for Compensation Administration: Impact on Process Efficiencies
Best Practice Adoption/ Compensation Administration HR FTEs per 1,000 Employees
Standardized job descriptions and job evaluations are available online 0.60.8-22%
Low High

© 2012 SAP AG. All rights reserved. 28Confidential
Benefits Administration
0
1
2
3
4
5
6
1 2 3 4
TOP 25% AverageCompany Coverage Company Importance
Best Practice Ranking1Benefits system enables employees to enroll online, to modify details of the benefits plan and to update information regarding dependents and beneficiaries, including tests for eligibility
2 Single point-of-contact established for all benefits related questions
3 Benefits system enables employees to check current enrollment in benefits plans, and print confirmation statements and forms online
4 Benefits system allows employees to model different benefits elections and their effect on net pay
Best Practice Listing
1 = No Coverage5 = Full Coverage
Human Capital Management
Best Practices for Benefits Administration: Impact on Process Efficiencies
Best Practice Adoption/ Benefits Administration HR FTEs per 1,000 Employees
Single point-of-contact established for all benefits related questions 0.800.84-5%
Low High

© 2012 SAP AG. All rights reserved. 29Confidential
Pension Plan Administration
0
1
2
3
4
5
6
1 2 3
TOP 25% AverageCompany Coverage Company Importance
Best Practice Ranking1 Data exchange with third-party administrators fully automated, with access to key data via shared databases
2 Single point-of-contact established for all pension and savings plan related questions
3 All plan participants, including retirees and former employees, have online access to the plan
Best Practice Listing
1 = No Coverage5 = Full Coverage
Human Capital Management
Best Practices for Pension or Superannuation Plan Administration: Impact on Process EfficienciesBest Practice Adoption/ Pension Plan Administration HR FTEs per 1,000 Employees
All plan participants, including retirees and former employees, have online access to the plan 0.40.6-21%
Low High
Best Practice Adoption/ Pension Plan Administration HR FTEs per 1,000 Employees
Single point-of-contact established for all pension and savings plan related questions 0.40.5-24%
Low High

© 2012 SAP AG. All rights reserved. 30Confidential
Personnel Data Management
0
1
2
3
4
5
6
1 2 3 4 5 6
TOP 25% AverageCompany Coverage Company Importance
Best Practice Ranking1One integrated data repository used for all employee information (demographic, dependent, beneficiary, payroll) which is shared between Human Resources and Payroll
2HR system is integrated with ERP and other key non HR system to allow for end to end processes (e.g., asset management system, financial systems, CRM system)
3 Online employee self-services are provided in a consistent and easily navigated manner
4 Data validated for accuracy and completeness at the time of data entry
5Majority of HR services, such as creation of requisitions, new hire entry, change of salary request, request for separation can be initiated by managers online in a simple format
6Self-services for managers are organized, with key performance metrics pushed out, alerts for issues notification, work triggers, reminders and notification of unexpected events
Best Practice Listing
1 = No Coverage5 = Full Coverage
Human Capital Management
Best Practices for Personnel Data Management: Impact on Cost Per Employee and Process EfficienciesBest Practice Adoption/ Cost Per Employee ($)Majority of HR services, such as creation of requisitions, new hire entry, change of salary request, request for separation can be initiated by managers online and entered in a simple format 1,0551,490
-29%Low High
Best Practice Adoption/ HR FTEs Per 1,000 Employees
Self-services for managers are organized, with key performance metrics pushed out, alerts for issues notification, work triggers, reminders and notification of unexpected events 12.813.9
-7%Low High

© 2012 SAP AG. All rights reserved. 31Confidential
Payroll Management
0
1
2
3
4
5
6
1 2 3 4
TOP 25% AverageCompany Coverage Company Importance
Best Practice Ranking1 Online access to direct deposit advices and pay-slip
2Payroll system supports legal regulations for a large number of countries, ensuring compliance with regulatory requirements for reporting purposes
3 Payroll system supports multiple currencies, multiple languages, collective agreements, and reporting
4 Single point-of-contact established for all payroll related questions
Best Practice Listing
1 = No Coverage5 = Full Coverage
Human Capital Management
Best Practices for Payroll Management: Impact on Process EfficienciesBest Practice Adoption/ Payroll Administration HR FTEs Per 1,000 Employees
Payroll system supports multiple currencies, multiple languages, collective agreements, and reporting 1.01.4
-24%
Low High
Best Practice Adoption/ Payroll Administration HR FTEs Per 1,000 Employees
Single point-of-contact established for all payroll related questions 1.11.3-9%
Low High

© 2012 SAP AG. All rights reserved. 32Confidential
Time And Attendance
0
1
2
3
4
5
6
1 2 3 4
TOP 25% AverageCompany Coverage Company Importance
Best Practice Ranking1 Web enabled time administrator tool is in place
2 Time worked routed automatically to project accounting/ resource planning systems
3Time and attendance system has automated analysis and reporting capabilities to analyze KPIs such as lost time, productivity, cost of absence, overtime or illness
4 Online and offline time entry is available
Best Practice Listing
1 = No Coverage5 = Full Coverage
Human Capital Management
Best Practices for Time and Attendance: Impact on Cost Per Employee and Process EfficienciesBest Practice Adoption/ Time and Attendance Cost Per Employee ($)
Web enabled time administrator tool in place 38.773.1-47%
Low High
Best Practice Adoption/ Time and Attendance HR FTEs Per 1,000 Employees
Time worked routed automatically to project accounting/ resource planning systems 0.51.1-50%
Low High
© 2012 SAP AG. All rights reserved. 33Confidential
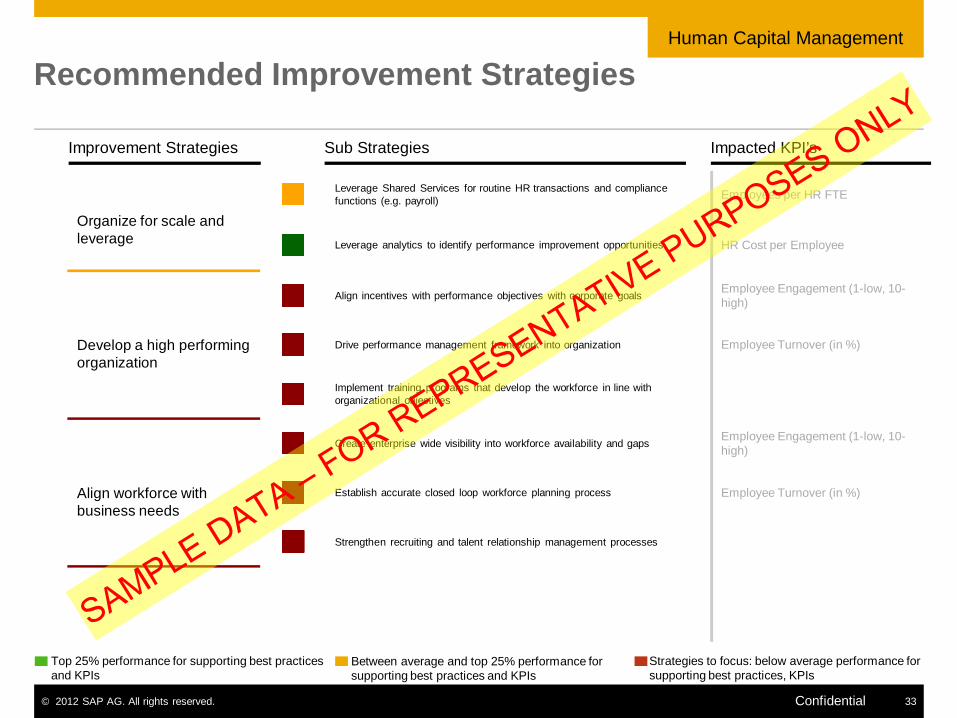
Recommended Improvement Strategies
Strategies to focus: below average performance for supporting best practices, KPIs
Between average and top 25% performance for supporting best practices and KPIs
Top 25% performance for supporting best practices and KPIs
Organize for scale and leverage
Leverage Shared Services for routine HR transactions and compliance functions (e.g. payroll) Employees per HR FTE
Leverage analytics to identify performance improvement opportunities HR Cost per Employee
Develop a high performing organization
Align incentives with performance objectives with corporate goals Employee Engagement (1-low, 10-high)
Drive performance management framework into organization Employee Turnover (in %)
Implement training programs that develop the workforce in line with organizational objectives
Align workforce with business needs
Create enterprise wide visibility into workforce availability and gaps Employee Engagement (1-low, 10-high)
Establish accurate closed loop workforce planning process Employee Turnover (in %)
Strengthen recruiting and talent relationship management processes
Improvement Strategies Sub Strategies Impacted KPI’s
Human Capital Management

© 2012 SAP AG. All rights reserved. 34Confidential
Recommended Improvement Strategies
Strategies to focus: below average performance for supporting best practices, KPIs
Between average and top 25% performance for supporting best practices and KPIs
Top 25% performance for supporting best practices and KPIs
Streamline, automate and integrate HR processes
Standardize processes across all BU's/ globally Employees per HR FTE
Reduce manual entries with simplification and automation HR Cost per Employee
Integrate processes within HCM as well as outside
Reduce HR transactional work by driving self service to maximum adoption
Improvement Strategies Sub Strategies Impacted KPI’s
Human Capital Management

© 2012 SAP AG. All rights reserved. 35Confidential
Benchmarking Results and Value Potential
KPI Benchmark Performance Potential Benefit (in millions)
Employee Engagement (1-low, 10-high)Driving Business Value
Employee Turnover (in %)
Employees per HR FTETop25%
HR Cost per Employee Better than Average
Benefit of Closing Gap to Top 25% Benefit of Closing Gap to Average
6.0 7.2 8.0
7.0
14.0 10.0 5.0
16.0
63 102 134
241
1633 1172 558
610
Performance of Primary KPIs and Potential Benefits (in millions of selected currency)
35.364.4
1
Human Capital Management

© 2012 SAP AG. All rights reserved. 36Confidential
Human Capital Management Adoption Maturity Model
No Adoption Low Adoption Intermediate Adoption High Adoption Full Adoption
All parts have a formal, partially standardized performance management framework Employee development and training linked to KPIs but not fully standardized at the organizational level
Formal performance management framework is not available for the organizationEmployee development and training is not linked to KPIs
Some parts of the organization have a formal performance framework but it is not standardized for the organizationEmployee development and training are partly linked to some KPIs
Most parts have a formal performance management framework but it is not standardized for the organizationEmployee development and training are linked to some KPIs
Develop a High Performing Organization
There is a formal, standardized and integrated approach towards performance management across the organizationEmployee development and training are linked to KPIs and standardized at the organizational level
No visibility into workforce availability and gapsRecruiting systems lack visibility into talent pool/ pipeline; self service is not available to applicants or hiring managers
Some BUs have visibility into workforce availability and gapsRecruiting systems have limited visibility into talent pool/ pipeline; self service is not available to applicants or hiring managers
Align Workforce with Business Needs
Visibility into workforce availability and gaps is available at the enterprise levelRecruiting systems have visibility into talent pool/ pipeline; self service is available to applicants and hiring managers
All BUs have visibility into workforce availability and gaps but information does not flow to the enterprise level Recruiting systems have visibility into talent pool/ pipeline; self service is available to hiring managers
Most BUs have visibility into workforce availability and gapsRecruiting systems have limited visibility into talent pool/ pipeline; self service is available to hiring managers for some transactions
Most HR processes are standardized and automated across the enterprise
HR processes are not standardized across the enterprise; key processes are manual (e.g., reporting)
Some HR processes are standardized acrossthe enterprise; key processes
are manual (e.g., reporting)
All HR processes are standardized across the enterprise but are not integrated with outside functions
All HR processes are standardized across the enterprise and integrated with outside functions as well
Streamline, Automate & Integrate HR Processes
Shared services are not being leveragedKPIs are not tracked for performance improvement
Shared services are being leveraged by few BUs for few HR transactionsFew KPIs are tracked at BU level for performance improvement
Shared services are being leveraged by most BUs for most HR transactionsMost KPIs are tracked at BU level for performance improvement
Shared services are being leveraged by most BUs for all routine HR transactions; HR centers of excellence in place for all applicable expert processesAll KPIs are tracked for enterprise level performance improvement
Shared services are being leveraged by most BUs for all routine HR transactions; HR centers of excellence in place for some expert processesAll KPIs are tracked at BU level for performance improvement
Organize for Scale & Leverage
Adoption of best practices varies at each stage of maturity
Human Capital Management

Case Studies

© 2012 SAP AG. All rights reserved. 38Confidential
Customers Run Better HR with SAP

© 2012 SAP AG. All rights reserved. 39Confidential

© 2012 SAP AG. All rights reserved. 40Confidential

© 2012 SAP AG. All rights reserved. 41Confidential
