satellite meteorology & spectrum use - earth observations · satellite meteorology &...
TRANSCRIPT

© 2015 The Aerospace Corporation
Satellite Meteorology & Spectrum Use
David G. Lubar
GOES-R Program Office / Spectrum Management
The Aerospace Corporation
Vaeros Operations
November 10, 2015

2
A Tale of Two Hurricanes
Galveston, TX Sept. 1900 New York City & Atlantic Coast October 2012 “Sandy”
3500 homes & buildings destroyed
More than 8000 killed.
Winds > 130 MPH, Storm Surge 15 FT.
http://celebrating200years.noaa.gov/magazine/galv_hurricane/Galveston19001.html KeystoneUSA-ZUMA/Rex Features
USD $50 billion in damage
72 US Deaths, 147 total deaths
Winds > 80 MPH, Storm Surge 9 FT.

3
TELEGRAM
Washington, D.C.
Sept 9, 1900
To: Manager, Western
Union
Houston, Texas
Do you hear anything
about Galveston?
Willis L. Moore, Chief
U.S. Weather Bureau
GOES-13 Image Sandy
October 2012
Source: National Archives, General Correspondence
Source: NOAA
Weather Service Information On Each Hurricane

4
Strides in Meteorology Due to Satellites
& Importance of Spectrum
• Significant improvements in weather forecasting have occurred since the first satellite was launched in 1960
– For example, average 3 day hurricane track error in 1980’s was 300 miles, now it’s down to less than 150 miles* of track error
• Today optical, microwave and infrared payloads provide large volumes of data originating from space
• Satellites flown by a small number of administrations comprise the global operational satellite system
• Access to radio frequency spectrum
makes these satellite systems
possible
• Demand for spectrum to support
commercial broadband is at an
all time high
• The MetSat community and users
must understand this new demand
and react accordingly if impacts to
meteorology appear likely before
spectrum is shared or repurposed
• Jason Samenow, “Prescient on wearable weather forecasts
but not their accuracy”, Washington Post, October 21, 2015
5
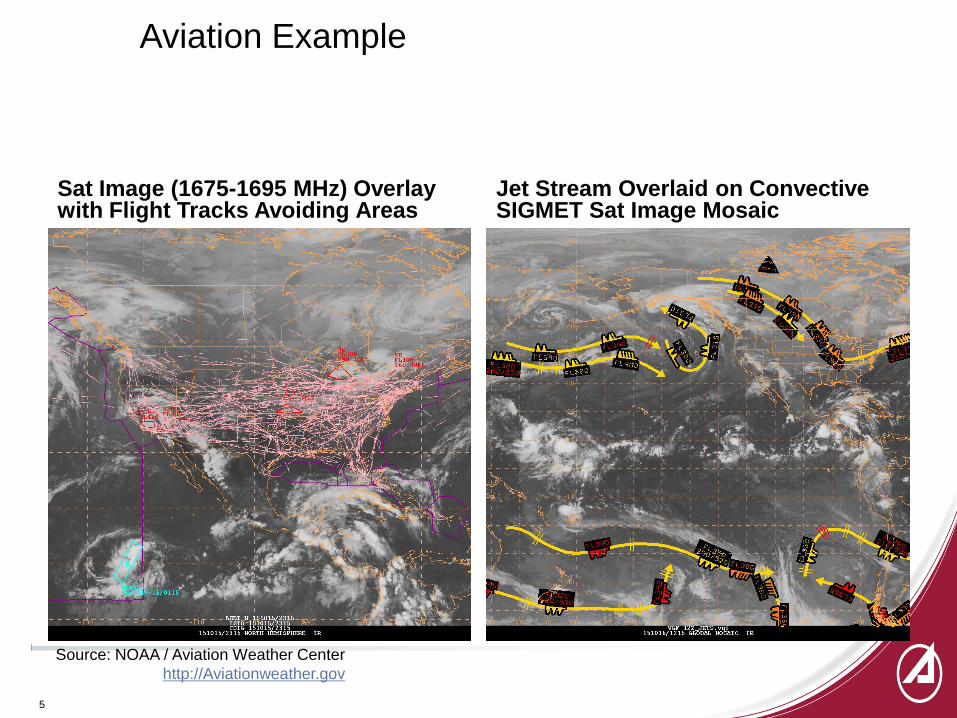
Aviation Example
Sat Image (1675-1695 MHz) Overlay with Flight Tracks Avoiding Areas
Jet Stream Overlaid on Convective SIGMET Sat Image Mosaic
Source: NOAA / Aviation Weather Center
http://Aviationweather.gov

6
Aviation Products Derived From Images
Significant Meteorological Event Warnings to Airmen
Chart Posted on Government Website Developed From Image
Source: NOAA / Aviation Weather Center
http://Aviationweather.gov

7

8
Key Uses of Spectrum for MetSats
1. Microwave Remote Sensing
2. Active Remote Sensing
3. Radio Occultation
4. Transmission of Raw Data to Command and Data Acquisition Stations & Uplink of Level 1b data to Spacecraft
5. Direct Broadcast of Satellite Data from the Spacecraft for government and non-government use
6. Dissemination or Relay of Hydrometeorological Data (DCS)
7. Emergency Managers Weather Information Network
8. Search & Rescue
9. Commercial Relay of Meteorological Data and Products
10. Command, Control and Telemetry of Observatory
NOAA and METOP Microwave Remote Sensing
Illustration Source: NASA via UCAR COMET Program
Eastern U.S. Infrared Image from GOES
Source: NOAA http://www.goes.noaa.gov

9
A GOES Direct Broadcast Example
• US domestic spectrum regulators, searching for more spectrum to
support commercial broadband wireless, are studying all or part of
1675-1695 MHz, for spectrum sharing, which is the spectrum used
for GOES and GOES-R direct broadcast downlinks, as well as DCS
and EMWIN
• The potential for interference from proposed terrestrial transmitters
and ground stations receiving the direct broadcast from
geostationary satellites is an important consideration for regulatory
officials
• End users, who benefit from meteorological or hydrological
products, that are received in this spectrum, may not know that a
Federal spectrum sharing action could have impacts upon their
ability to obtain products which rely on that spectrum.

10
Domestic Spectrum Sharing & Studies

11
Increasing Needs for MetSat Bandwidth
• As meteorological satellite systems evolve, each new series
generally produces more data and develops new products
– Some products have strict data latency requirements (e.g.,
space weather, geostationary lightning mapper products, severe
weather warning)
– Some products must be assured of delivery under all conditions,
especially those which damage the terrestrial infrastructure (e.g.,
sending satellite data to the tropical cyclone/hurricane prediction
centers)
– Some new systems simply generate more data than can be
redistributed via commercial satellite transponders or typical
dissemination mechanisms
• As commercial wireless broadband systems spectrum needs
increase, so do new generation of meteorological satellites,
although the satellite needs occur over a much longer time duration.

12
Regulatory Processes For Spectrum
• International decisions regarding spectrum usage are determined at the
World Radiocommunication Conference (WRC) held every 3 to 4 years by
the International Telecommunications Union (ITU) in Geneva.
– WRC-15 is underway this month, with many member administrations
and non-government sector members participating in a 25-day long
conference to revise the treaty-based ITU Radio Regulations, which
includes spectrum for geostationary and non-geostationary satellite
orbits.
– Regional organizations, comprising multiple country blocks, submit
inputs to the WRC, along with submissions from individual country
delegations
• Domestically, each countries radio spectrum regulator can make changes
within their borders beyond that which is decided at the ITU
Source: Portion of United States Table of Frequency Allocations Wall Chart, DOC NTIA

13
Candidate Bands Above 6 GHz for Commercial Use
Prior to Selection at ITU WRC
• 10 – 10.45 GHz
• 23.15 – 23.6 GHz
• 24.25 – 27.5 GHz
• 31.8 – 33.4 GHz
• 37.0 – 40.5 GHz
• 39.0 – 47.0 GHz
• 45.5 – 48.9 GHz
• 47.2 – 50.2 GHz
• 50.4 – 52.6 GHz
• 59.3-76 GHz
• 81-86 GHz
Note: This is not a comprehensive
list and not the final list that will be
selected for study. These are some
of the band candidates submitted by
regional organizations for final action
In 2019

14
Spectrum Band Actions to Watch
• Proposed new bands for commercial wireless broadband for action in 2015 and 2019 still being submitted
– WMO expresses concern about protection of passive EESS systems in 50.2-50.4 GHz and 52.6-55.78 GHz
– WMO is concerned with protection of passive EESS systems in 10.6-10.7 GHz; 18.6-18.6 GHz; 23.6-24 GHz; 31.3-31.8 GHz; 36-37 GHz; 50.2-50.4 GHz; 52.6-59.3 GHz; 86-92 GHz
• Radio Local Area Networks proposed for 5350-5470 MHz where altimeters, scatterometers and Synthetic Aperture Radars operate
• MetSat downlink frequencies for data and telemetry, including direct broadcast; including 1675-1695 MHz; 7750-7900 MHz; 8025-8400 MHz and 25.5-27 GHz
• Spectrum for small satellites operation in 230-470 MHz which overlap with Data Collection Systems and other meteorological systems
• Proposals to accommodate High Altitude Platform Stations (HAPS) which could create out of band interference in 23.6-24 GHz and 31.3-31.8 GHz
• Commercial communication frequencies in 3.7-4.2 GHz currently used by Fixed Satellite Systems
• This is not a comprehensive list of all the bands under consideration which could impact meteorology
Note: This example may not reflect the position of any particular administration.

15
Summary
• Spectrum access is critical to satellite meteorology
– microwave measurements from active & passive sensors,
– direct broadcast dissemination
– radiometers, altimeters, scatterometers, or Synthetic Aperture Radars
– Communication from or to spacecraft vehicles
– Command, control and telemetry from or to spacecraft vehicles
• There are no alternatives to the “measurement of naturally-occurring
radiations, usually of very low power levels, which contain essential
information on the physical process under investigation*”
– “Relevant frequency bands are determined by fixed physical properties
[of the atmosphere] that cannot be changed or ignored, nor can they be
duplicated in other frequency bands*”
• Successfully receiving the satellite measurements from space and
disseminating them by direct broadcast or commercial re-broadcast is an
essential method of getting this data to end users
*WMO position filing with ITU on WRC-15
29 September 2015

16
Domestic and International Aviation Weather Product Examples
Using Direct Broadcast Spectrum in USA

17
Aviation Use Case
Example
Satellite image mosaic created by
the (US) National Weather
Service’s Aviation Weather Center
(AWC) to aid in creation of
Convective SIGMETs.
GOES satellite data is currently
received by direct broadcast, and
next generation GOES-R data will
be used to support the creation of
the mosaic, also from direct
broadcast (1675-1695 MHz)
AWC meteorologists create
forecast and warning products in
support of commercial and general
aviation using this image mosaic
Source: NOAA / Aviation Weather Center
http://Aviationweather.gov

18
Forecaster Warnings
Issued from Mosaic
Data
Significant Meteorological Events (SIGMETs) issued by Aviation Weather Center (an ICAO Meteorological Watch Center) for use by domestic and international aviation
Each of the colored areas represents a weather event and will have a text-based SIGMET issued that is received by commercial and general aviation pilots
These areas were created by forecasters utilizing the satellite imagery mosaics as an input source
Non-instrument rated pilots might use this map to plan and avoid these areas as they plan their flight
Source: NOAA / Aviation Weather Center
http://Aviationweather.gov

19
Flight Tracks Overlay
Pink overlay shows actual flight
routes for the time this image was
applicable for forecast purposes.
Note that severe areas highlighted
in Red are weather and Convective
SIGMET areas issued on that date,
especially in western U.S. and over
the Great Lakes region of U.S.
Flights are actually routed around
those areas of warning.
Source: NOAA / Aviation Weather Center
http://Aviationweather.gov
20
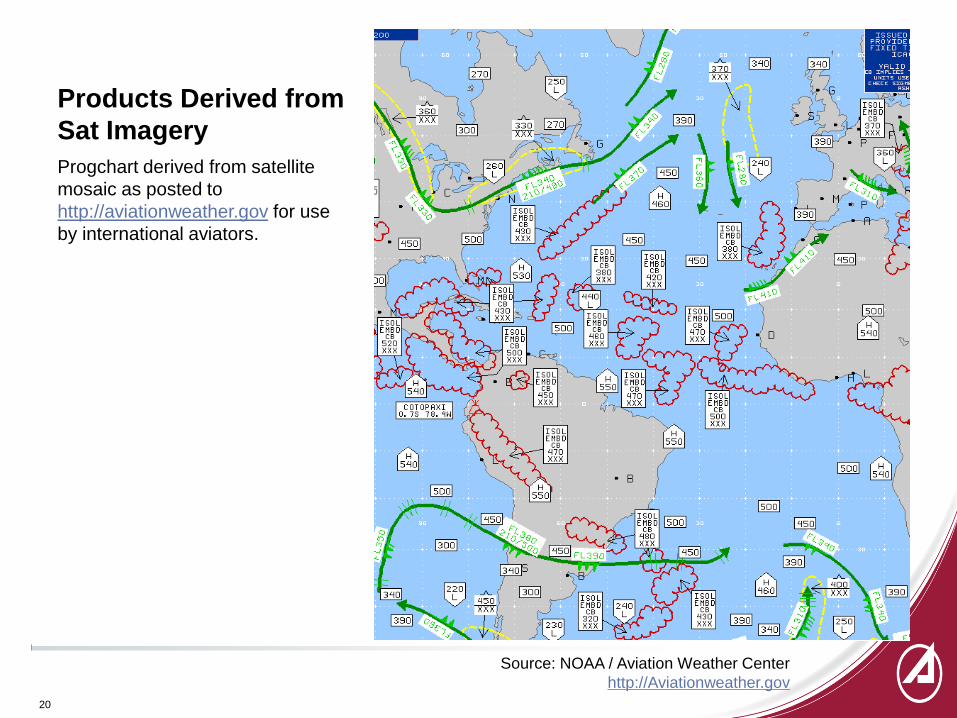
Products Derived from
Sat Imagery
Progchart derived from satellite
mosaic as posted to
http://aviationweather.gov for use
by international aviators.
Source: NOAA / Aviation Weather Center
http://Aviationweather.gov

21
Convective Image
Overlay for Aviation
This image product is overlaid with
the forecast for the preceding 6
hours.
Blue lines indicate convective areas
Orange are land boundaries.
Imagery is from GOES satellites as
received by direct broadcast at 1.6
GHz, with extreme high latitude
regions using polar-orbiting satellite
data
Source: NOAA / Aviation Weather Center
http://Aviationweather.gov

22
Jet Stream
The yellow images overlaid on this
satellite mosaic show the jet stream
annotated with appropriate
meteorological markings.
All of these previously shown
products would be impacted by
radio frequency interference to the
GOES / GOES-R direct broadcast
at the Aviation Weather Center.
It should be noted that some
commercial aviation companies and
private sector meteorology
companies do receive the GOES /
GOES-R direct broadcast (at 1.6
GHz) and create enhanced or
value-added aviation products.
Source: NOAA / Aviation Weather Center
http://Aviationweather.gov