sca property group2013/08/28 · sca property group fy13 results presentation murray bridge, south...
TRANSCRIPT

28 August 2013
SCA Property Group FY13 Results Presentation
Murray Bridge, South Australia
For
per
sona
l use
onl
y

2
Agenda
Overview of FY13 Results
Highlights
Portfolio Overview
Operational Performance
Financial Performance
Strategy and Outlook
FY13 Results Presentation
For
per
sona
l use
onl
y

3
FY13 Results Good progress to date - results in line with PDS forecast
• Financial results for the period from listing to 30-Jun-13 in line with PDS forecast:
− Distributable earnings of $38.6m, $0.4m higher than PDS forecast
− Distribution per unit declared of 5.6c in line with PDS forecast
• Statutory net loss of $4.4m after non-recurring formation transaction costs and other cash and non-cash adjustments(1)
• Gearing of 28.9%
• NTA per unit of $1.57
FY13 Results Presentation
1 Refer to slide 21 for reconciliation to statutory net loss after tax
For
per
sona
l use
onl
y

4
Group Highlights Delivering on the objectives set out in the PDS
Solid progress on speciality leasing with portfolio occupancy increasing from 95% to 96.6%
Integration of 11 newly-completed development centres into portfolio
− Includes completion of new sub-regional centre in Lilydale, Victoria on 31 July 2013
− 2 further centres due for completion in FY14 and FY15
Rationalisation of the unitholding register with completion of unmarketable parcel sale facility reducing the number of unitholders to ~130,000 (from in excess of 400,000 at listing)
− Registry cost savings expected in FY14+
Debt facilities established and interest rate swap agreements entered into below PDS forecast
Appointment of senior management team
FY13 Results Presentation
For
per
sona
l use
onl
y

5
Portfolio Acquisition Off-market acquisition of 7 mature neighbourhood centres
• Compliments existing portfolio and accretive to earnings and property income growth from FY14+
• Total purchase price of $135.8m, including $2m of development land – settled on 25 June 2013
− Average occupancy of 98%
− Introduction of Coles and Target anchor tenants
• Funded by:
− $90m institutional placement
− Drawing on existing debt facilities
• Demonstrates the benefit of internally-managed platform:
− Asset management by existing team
− Reduction in Management Expense Ratio (“MER”) of 6bps to 0.71% (annualised)
FY13 Results Presentation
For
per
sona
l use
onl
y

6
Market Conditions Convenience retail outperforming
• Non-discretionary retail categories in Australia remain resilient
• Food retailing sales have grown 4.5% per annum over the last 5 years
• Food retailing has consistently outperformed discretionary categories such as clothing and department stores
FY13 Results Presentation
Source: Australian Bureau of Statistics. Non discretionary sales include food, cafes, restaurants and takeaway food services; discretionary sales include apparel, household goods, department store sales and other retailing (based on ABS categorisation; seasonably adjusted). Rebased to 100 as at January 2010
AUSTRALIAN RETAIL SALES
Supermarkets 3.2%
Liquor 0.9%
Food 3.6%
Pharmaceutical 0.9%
Cafes / takeaway 1.4%
Electronics 0.2%
Clothing 1.5%
Footwear (6.4%)
Department stores (4.5%)
Total retail 1.1%
12 MONTH SALES GROWTH (%)
90
95
100
105
110
115
Jan-10 Jun-10 Dec-10 Jun-11 Dec-11 Jun-12 Dec-12 Jun-13
Non-Discretionary Discretionary
For
per
sona
l use
onl
y

7
Portfolio Overview Convenience centres weighted to non-discretionary retail
• Strong weighting to non-discretionary retail and long term leases to quality anchor tenants
• Provides defensive and stable income stream to support regular distributions to investors
• Modern retail assets with average age of portfolio of 3.1 years (weighted by value)
FY13 Results Presentation
As at 30 June 2013 Anchor
(% fully leased GLA)
Anchor (% fully leased gross income)
WALE (by GLA)
Freestanding 99% 98% 17.2 years
Neighbourhood 74% 64% 14.7 years
Sub-regional 65% 42% 14.2 years Total 76% 62% 15.0 years
For
per
sona
l use
onl
y

8
Portfolio Overview A young portfolio experiencing strong sales growth
• Strong supermarket MAT growth of 8.1% for centres open for > 24 months:
− Circa 3 years for a new centre to stabilise to industry average (2 - 4% growth per annum)
− Average sales growth likely to moderate to more normalised levels at that time
• 49% of portfolio located in new growth corridors:
− Population growth underpins retail sales growth
− Supermarket sales growth underpins foot traffic and specialty retail sales
FY13 Results Presentation
Anchor trading(1) Supermarket sales growth
12 – 24 months - June 2012 to June 2013 15.9%(2)
> 24 months – comparable 12 month sales growth 8.1%
1 For Australian properties only; excludes the portfolio acquisition in June 2013 2 June 2012 versus June 2013 3 Company announcements 4 Management estimate
HIGH PROPORTION OF CENTRES IN GROWTH CORRIDORS(4)
Established markets
51%
Growth corridors
49%
Woolworths – comparable 12 month sales growth(3) 2.7%
Coles – comparable 12 month sales growth(3) 4.3%
For
per
sona
l use
onl
y

9
Portfolio Overview Geographically diversified portfolio
FY13 Results Presentation
As at 30 June 2013 Number of centres
Number of specialties
GLA (sqm)
Occupancy (% GLA)
Value (A$m)
Weighted average cap
rate (%)
Freestanding 20 6 72,444 99.8% 224.0 7.88
Neighbourhood 47 469 235,624 96.1% 820.7 8.14
Sub-regional 5 235 109,825 95.8% 340.0 7.95
Total 72 710 417,894 96.6% 1,384.7 8.05
GEOGRAPHIC DIVERSIFICATION (BY VALUE)
NSW 23%
Vic 24%
Qld 17%
SA 12%
WA 11%
NZ 13%
For
per
sona
l use
onl
y

10
Operational Performance Specialty leasing remains key focus
• Solid specialty leasing progress to date
• Higher rental guarantee receipts in FY13 due mainly to two factors:
− Reimbursement of rent-free periods provided by Woolworths to existing tenants at listing (not in PDS forecast)
− Delay in store openings from leasing terms agreed
• Initiatives in place to normalise time taken to open store:
− Bringing specialty leasing and tenancy coordination in-house (no additional cost)
FY13 Results Presentation
A$m
11 Dec 12 to
30 Jun 13 PDS
Reimbursement of rent-free periods provided by Woolworths on existing tenants at listing 1.1 Not
Forecast ▲ 1.1
Rental guarantee receipts for vacant space 7.1 5.5 ▲ 1.6
Total rental reimbursement receipts 8.2 5.5 ▲ 2.7
For
per
sona
l use
onl
y

11
Operational Performance On track to achieve forecast stabilised occupancy levels
• 13,240sqm leased in the last 7 months:
− ~11,500sqm to reach stabilised occupancy levels in 18+ months
• Good leasing progress despite challenging retail leasing environment
• Rents on average in line with PDS forecast
• 54% of leasing to national specialities, predominantly in the food and services sector
• 10 new centres opened with 97.1% average occupancy
• Continuing to benefit from rental guarantee asset:
− Allowing greater flexibility to secure the right tenant for the right location
− Ensuring sustainable tenant mix for the medium-term
FY13 Results Presentation
As at 30 June 2013 Completed Portfolio
Development Properties Total
Leasing deals done (sqm) 5,269 7,971 13,240
Number of leasing deals 67 71 138
Average rent per sqm $567 $631 $606
National 54%
Local 46%
LEASE DEAL COMPOSITION
On track to achieve forecast stabilised occupancy levels at the end of the rental guarantee period
For
per
sona
l use
onl
y

Financial Performance F
or p
erso
nal u
se o
nly

13
FY13 Financial Performance Distributable earnings
FY13 Results Presentation
1 Cash receipts from rental guarantee ($1.6m higher than PDS) and reimbursement of rent-free on existing tenants ($1.1m, not forecast in PDS) 2 Directly recoverable specialty costs incurred and recovered from specialty tenants; not forecast in PDS 3 Directly attributable property management costs of $0.9m have been re-allocated to property operating expenses in line with industry practice 4 Refer to slide 21 for reconciliation to statutory net loss after tax
• Distributable earnings of $38.6m, $0.4m higher than PDS forecast
• Rental income down $3.9m compared to PDS predominantly due to delay in property settlements and lower than forecast rent from specialty tenants
• Offset by:
− Higher rental reimbursements(1) - $2.7m
− Higher Site Access Fee payments - $0.4m
• Higher property operating expenses due to directly recoverable specialty costs of $0.8m and provision for doubtful debts of $0.3m (not in PDS forecast)
• Net interest savings from lower cost of debt of $0.8m and property settlement delays of $0.7m compared to PDS forecast
A$m
11 Dec 12 to
30 Jun 13 PDS Change
Rental income 59.3 63.2 ▼ 3.9
Directly recoverable specialty costs 1.0(2) - ▲ 1.0
Gross property income 60.3 63.2 ▼ 2.9
Rental reimbursements(1) 8.2 5.5 ▲ 2.7
Site Access Fee receipts 6.8 6.4 ▲ 0.4
Rental income / receipts 75.3 75.1 ▲ 0.2
Property operating expenses (17.5)(2) (16.4)(3) ▼ 1.1
Net property income/ receipts 57.8 58.7 ▼ 0.9
Corporate costs (5.9) (5.7)(3) ▼ 0.2
Operating EBITDA 51.9 53.0 ▼ 1.1
Net interest expense (11.3) (12.8) ▲ 1.5
Tax expense (1.3) (1.3) -
Net operating profit 39.3 38.9 ▲ 0.4
Structural vacancy allowance (0.7) (0.7) -
Distributable earnings(4) 38.6 38.2 ▲ 0.4
Distributable earnings per unit (cents) 6.6c 6.5c ▲ 0.1c For
per
sona
l use
onl
y

14
FY13 Financial Performance Secure and stable distributions
• Payout ratio in line with PDS forecast on a like-for-like basis:
− Units issued in Jun-13 equity raise ranked pari-passu for distribution
• Distribution policy of 85 - 95% of distributable earnings, takes into account:
− Structural vacancy allowance during the period of the rental guarantee
− Ongoing capex requirements
• Minimal capex expenditure during first reporting period given age of portfolio
• MER expected to reduce further with registry cost savings from FY14+
FY13 Results Presentation
A$m
11 Dec 12 to
30 Jun 13 PDS
Distribution – excluding Jun-13 placement 32.8 32.8
Distribution – including Jun-13 placement 36.0 -
Distribution per unit (cents) 5.6 5.6
Payout ratio – excluding Jun-13 placement 86% 86%
Payout ratio – including Jun-13 placement 93% -
Tax deferred ratio 47% 46%
MER 0.71% 0.77%(1)
1 Adjusted for re-allocation of directly attributable property management costs in line with industry practice; excludes impact of portfolio acquisition in June 2013
For
per
sona
l use
onl
y

15
FY13 Financial Performance Prudent capital management
• Gearing of 28.9% within policy of 25% - 40%
• FY13 weighted average cost of debt (including establishment fees) of 5.5%(2)
• $50m increase in debt facility in Jul-13 to $600m
• $90m institutional placement in Jun-13:
− 57.0m new units issued
− 642.4m total stapled units
FY13 Results Presentation
30 Jun 13
Net debt drawn (net of cash) $437m
Facility limit (as at June 2013) $550m
Gearing(1) 28.9%
Net debt to equity ratio 43.3%
Net tangible assets ($/ per unit) $1.57
% debt fixed or hedged 78%
Average debt maturity 3.6 years
Average fixed/ hedged debt maturity 3.4 years
Interest cover ratio 4.3x
1 Net debt to total tangible assets less cash 2 Including undrawn line fees and based on average debt drawn
For
per
sona
l use
onl
y

Strategy and outlook F
or p
erso
nal u
se o
nly
17
Strategy Defensive, resilient cashflows to support secure distributions
FY13 Results Presentation
Focus on convenience- based retail centres
Weighted to non-discretionary retail
segment
Long leases to quality anchor tenants
Appropriate capital structure
Growth opportunities
For
per
sona
l use
onl
y

18
NOI Growth Opportunities
FY13 Results Presentation
Optimise the portfolio
Completion of development
properties
Acquisitions
+
+
• Increase net operating income through active portfolio management:
− Internalise the leasing function
− Develop unique leasing strategies for each centre
− Leverage economies of scale to optimise asset management
• Integration of a further 2 new centres currently under-construction:
− Subject to Development Management Agreements with Woolworths Limited
− Fixed price construction
− Site Access Fee received on invested capital equal to independent cap rate
• Selective acquisitions:
− Fragmented ownership in convenience-based retail market
− Private individuals and retailers still the dominant developers of convenience-based centres and will be for the medium-term
− Strong pipeline of new convenience-based centres linked to population growth
− Internally managed – leverage existing cost structure and further reduce MER
For
per
sona
l use
onl
y

19
Outlook
Key priorities
• Driving NOI growth through leasing of speciality vacancies in existing portfolio remains key focus
• Integration of the remaining 2 assets in FY14 subject to Development Management Agreements following completion of Lilydale, Victoria on 31 July 2013
• Generating value from active portfolio and asset management
• Continuing to evaluate acquisition opportunities
FY14 guidance
• FY14 Distributable Earnings guidance remains unchanged at 12.2 cents per unit
• FY14 Distribution guidance remains unchanged at 10.8 cents per unit
FY13 Results Presentation
For
per
sona
l use
onl
y

Appendices F
or p
erso
nal u
se o
nly

21
Statutory Earnings Reconciliation
FY13 Results Presentation
1 Cash receipts from rental guarantee and reimbursement of rent-free 2 Property management costs of $0.9m have been re-allocated to property operating expenses in line with industry practice 3 Includes movement in rental guarantee and property revaluation increase net of straight-lining adjustments and property acquisition and transaction costs associated with the portfolio acquisition in June 2013
PDS Actual to 30 June 2013 PDS
A$m
Statutory Income
Statement
Statutory Income
Statement
Straight-lining of rental income
Unwind of discount on rental
guarantee
Fair value adj
Transaction costs
Rental reimburse-
ments(1)
Distributable earnings
Distributable earnings
Revenue Rental income 67.0 64.5 (4.2) 8.2 68.5 68.7 Other property income 6.5 7.0 (0.2) 6.8 6.4
73.5 71.5 75.3 75.1 Expenses Property expenses (16.4)(2) (17.5) (17.5) (16.4)(2) Corporate costs (5.7)(2) (5.9) (5.9) (5.7)(2)
(22.1) (23.4) (23.4) (22.1) Net loss on change in fair value of investment properties(3) - (3.6)(3) 3.6 - -
Net gain on change in fair value of financial assets (rental guarantee) - 0.9 (0.9) - -
Responsible Entity fees - - - -
Transaction costs – establishment costs (37.3) (37.2) 37.2 - -
Earnings before interest and tax (EBIT) 14.1 8.2 51.9 53.0 Interest income - 0.2 0.2 -
Finance costs (12.8) (11.5) (11.5) (12.8)
Net profit/ (loss) before tax for the period 1.3 (3.1) 40.6 40.2 Tax (1.3) (1.3) (1.3) (1.3)
Net loss after tax for the period - (4.4) (4.2) (0.2) 2.7 37.2 8.2 39.3 38.9 Structural vacancy allowance (0.7) (0.7)
Distributable earnings 38.6 38.2
Property expenses: Per PDS (16.4)
Less directly recoverable specialty costs (0.8)
Less doubtful debt provision (0.3) (17.5)
Net interest costs: Per PDS (12.8) Interest rate savings 0.8 Delay in property settlements 0.7 (11.3) F
or p
erso
nal u
se o
nly

22
Summary Balance Sheet
FY13 Results Presentation
A$m
Australia NZ TOTAL
Investment properties (including rental guarantee)(1) 1330.2 174.2(2) 1,504.4
Derivative financial instruments - asset 2.3
Derivative financial instruments - liability (2.0)
Other assets 9.1
Net debt (net of $2.3m establishment fees) (434.9)
Other liabilities (33.9)
Accrued distribution (36.0)
Net tangible assets 1,009.0
Number of stapled units 642.4
NTA per unit ($) $1.57
1 Includes $1,062m of completed assets acquired at listing, $176m newly completed properties acquired during period, $119m of properties under construction (including $13.5m gross up accrual for properties under construction on a percentage-completion basis), independent valuation increment of $1.2m, portfolio acquisition in June 2013 of $135.8m and foreign exchange movement of $9m 2 Based on AUD: NZD 0.85 exchange rate
For
per
sona
l use
onl
y

23
Property Values
FY13 Results Presentation
• Addition of newly-completed development properties and $135.8m portfolio acquisition in June
• 44% of portfolio independently valued with $1.2m net positive revaluation since IPO
1 Completed properties at allotment, includes property purchase price adjustments announced 12 December 2012 and excludes St James, New Zealand 2 Accrual for properties under construction based on % completion with corresponding liability for same amount 3 Amounts for New Zealand properties translated at transaction date
1,062
176
106 14 1
136 9 1,504
1,000
1,100
1,200
1,300
1,400
1,500
1,600
Allotment11 Dec 12
Newlycompletedproperties
Propertiesunder
construction
Gross upfor
worksin progress
Propertyvaluations
AcquisitionJun 13
FX 30 Jun 13
$m
(1)
(2)
For
per
sona
l use
onl
y

24
Summary NTA Movement
FY13 Results Presentation
$ per unit
NTA as at 11 December 2012 1.58
Existing Portfolio:
FX and other 0.01
June 2013 Portfolio Acquisition and Equity Raise:
- Transaction costs/ issue of new units (0.01)
- Fair value adjustments - Property acquisition costs (0.01)
NTA – 30 June 2013 1.57
For
per
sona
l use
onl
y
25
Management Expense Ratio
FY13 Results Presentation
FY13 Corporate costs
$m
FY13 MER(1)
%
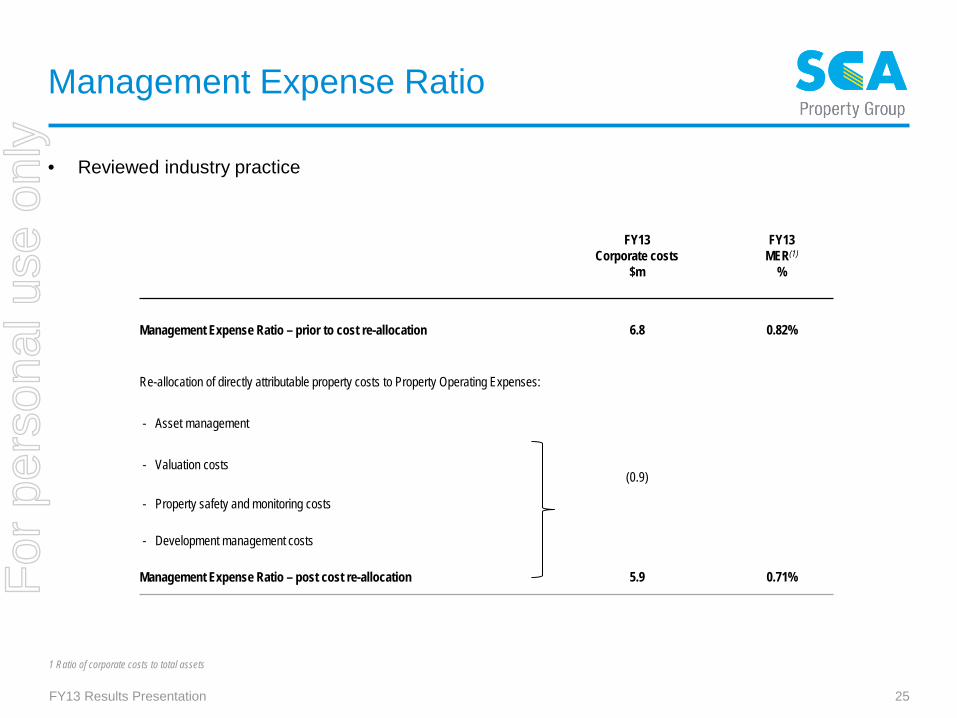
Management Expense Ratio – prior to cost re-allocation 6.8 0.82%
Re-allocation of directly attributable property costs to Property Operating Expenses:
- Asset management
- Valuation costs (0.9)
- Property safety and monitoring costs
- Development management costs
Management Expense Ratio – post cost re-allocation 5.9 0.71%
• Reviewed industry practice
1 Ratio of corporate costs to total assets
For
per
sona
l use
onl
y

26
Debt Facilities
FY13 Results Presentation
(1) Net debt to total tangible assets less cash (2) Ratio of EBIT (after adjusting for amortisation and non-cash items) to net interest expense under the Debt Facility (3) Other key asset ratios all met (priority debt ratio, ratio of secured financial debt and ratio of total tangible assets)
A$m
Facility Limit
(A$m) Drawn Debt
(A$m) Maturity All-in debt cost (%)
Unsecured bank facility – 3 year 200.0 194.0 Dec-15
Unsecured bank facility – 5 year – AUD – NZD
350.0
258.6 155.5 103.1
Dec-17
Total (as at 30 June 2013) 550.0 452.6 5.3%
Total (post-balance date) 600.0
Covenant Actual 30 June 2013
Gearing(1) < 50% 28.9% ICR(2) > 2.0x 4.3x
DEBT FACILITIES
FINANCIAL COVENANTS(3)
For
per
sona
l use
onl
y
27
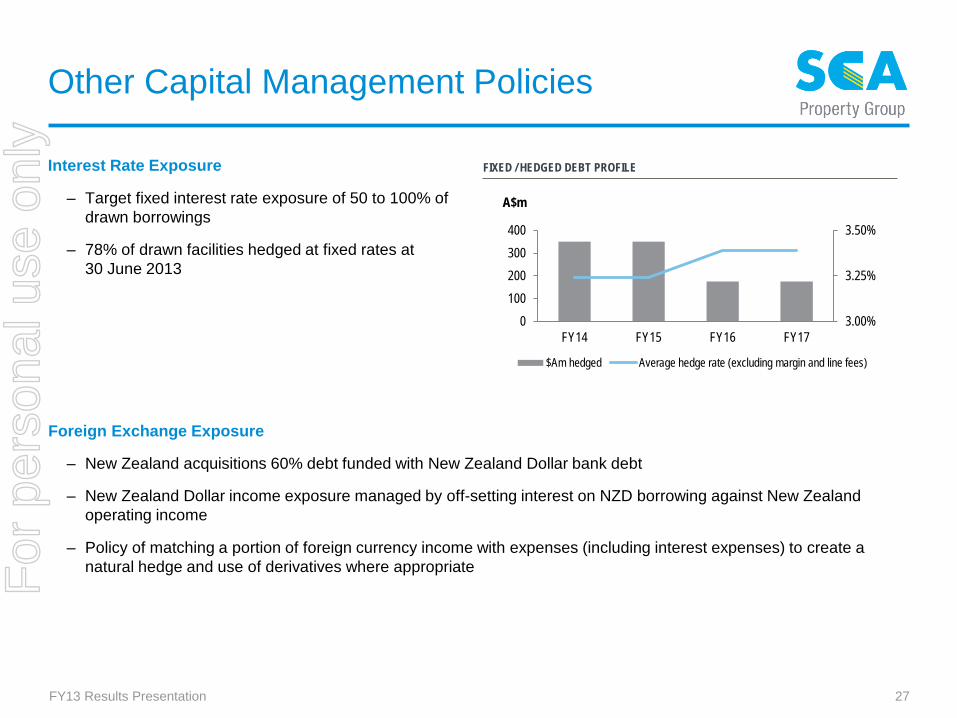
Other Capital Management Policies
Interest Rate Exposure
– Target fixed interest rate exposure of 50 to 100% of drawn borrowings
– 78% of drawn facilities hedged at fixed rates at 30 June 2013
Foreign Exchange Exposure
– New Zealand acquisitions 60% debt funded with New Zealand Dollar bank debt
– New Zealand Dollar income exposure managed by off-setting interest on NZD borrowing against New Zealand operating income
– Policy of matching a portion of foreign currency income with expenses (including interest expenses) to create a natural hedge and use of derivatives where appropriate
FY13 Results Presentation
3.00%
3.25%
3.50%
0100200300400
FY14 FY15 FY16 FY17
A$m
$Am hedged Average hedge rate (excluding margin and line fees)
FIXED / HEDGED DEBT PROFILE
For
per
sona
l use
onl
y

28
Portfolio Occupancy
FY13 Results Presentation
95% 1.4% 96.4%
Portfolio OccupancyDec-12
Increase in portfolio occupancy Portfolio OccupancyJun-13 - like for like portfolio
Completed Portfolio - Like for like occupancy
96.4% 97.1% 97.9%
96.6%
Completedportfolio
occupancy
Newly-completed
assets
Jun-13acquisition
portfolio
Portfoliooccupancy
Portfolio Occupancy
For
per
sona
l use
onl
y
29
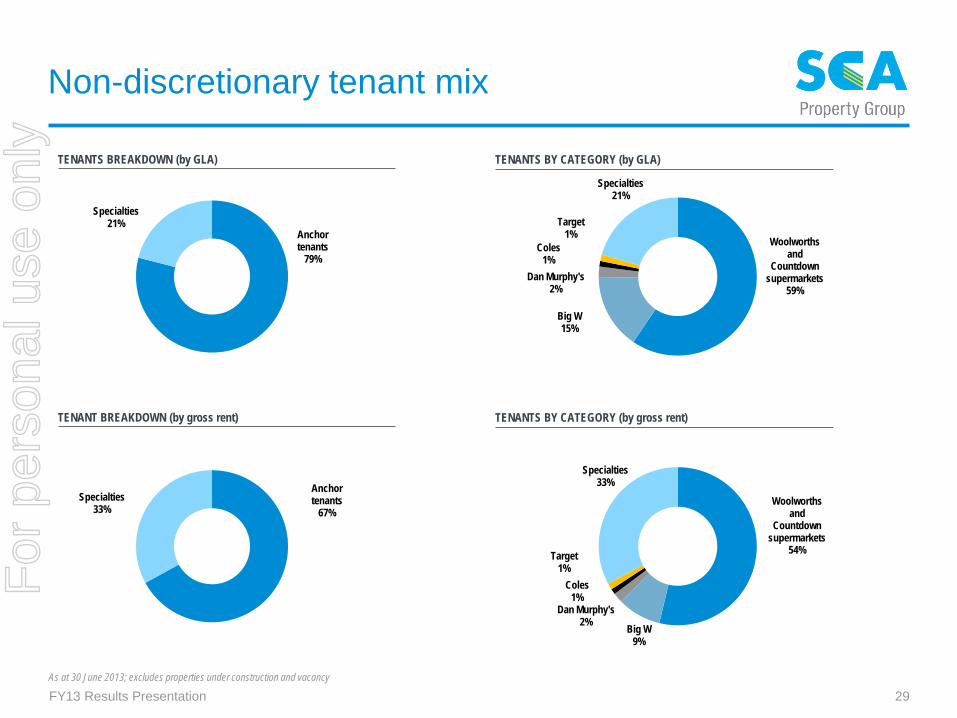
Non-discretionary tenant mix
FY13 Results Presentation
TENANTS BREAKDOWN (by GLA) TENANTS BY CATEGORY (by GLA)
Anchor tenants
79%
Specialties 21%
Woolworths and
Countdown supermarkets
59%
Big W 15%
Dan Murphy's 2%
Coles 1%
Target 1%
Specialties 21%
TENANT BREAKDOWN (by gross rent) TENANTS BY CATEGORY (by gross rent)
Anchor tenants
67% Specialties
33% Woolworths
and Countdown
supermarkets54%
Big W 9%
Dan Murphy's 2%
Coles 1%
Target 1%
Specialties 33%
As at 30 June 2013; excludes properties under construction and vacancy
For
per
sona
l use
onl
y
30
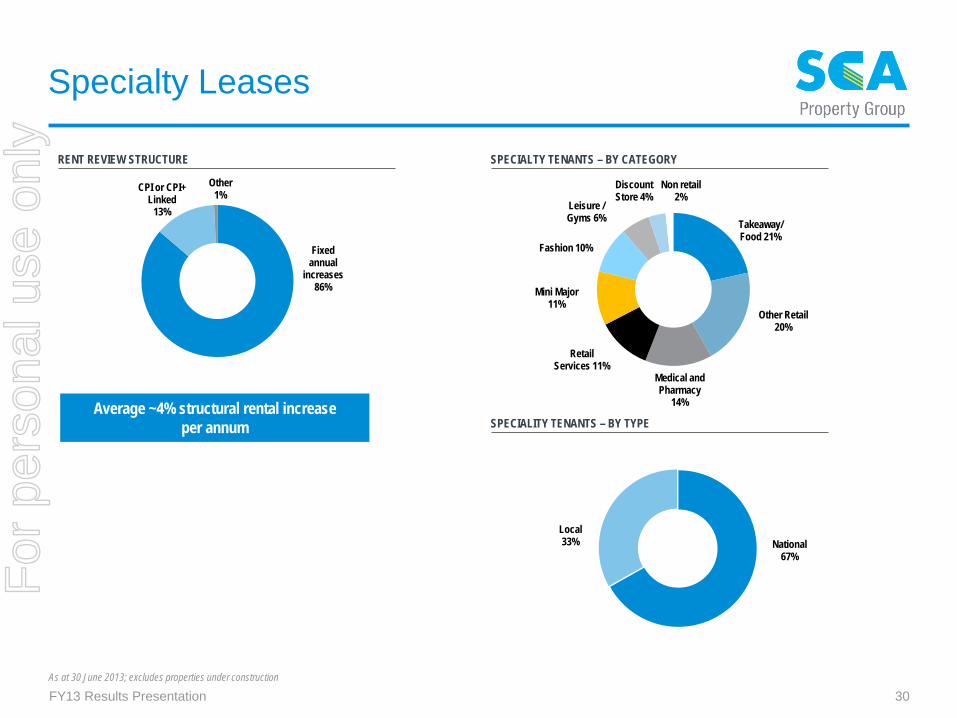
National 67%
Local 33%
Specialty Leases
FY13 Results Presentation
Fixed annual
increases 86%
CPI or CPI+ Linked
13%
Other 1%
RENT REVIEW STRUCTURE
Average ~4% structural rental increase per annum
SPECIALTY TENANTS – BY CATEGORY
SPECIALITY TENANTS – BY TYPE
Takeaway/ Food 21%
Other Retail 20%
Medical and Pharmacy
14%
Retail Services 11%
Mini Major 11%
Fashion 10%
Leisure / Gyms 6%
Discount Store 4%
Non retail 2%
As at 30 June 2013; excludes properties under construction
For
per
sona
l use
onl
y

31
1.4% 8.2%
5.2%
16.3% 18.5% 19.1% 14.5%
3.0% 4.8% 9.0%
2014 2015 2016 2017 2018 2019 2020 2021 2022 beyond2023
0.5% 2.7% 1.8% 5.7% 6.2% 6.4% 4.9%
1.1% 2.5%
68.2%
2014 2015 2016 2017 2018 2019 2020 2021 2022 beyond2023
Portfolio WALE and Lease Expiry
FY13 Results Presentation
OVERALL LEASE EXPIRY (% of gross rent) SPECIALTY LEASE EXPIRY (% of gross rent)
Financial year Financial year
As at 30 June 2013 WALE (years)
Portfolio WALE 15.0 years Anchor WALE 18.2 years
For
per
sona
l use
onl
y

32
Properties Under Construction
FY13 Results Presentation
• 10 new centres opened with 97.1% average occupancy
Centre type Completion date
Anchor GLA
(sqm)
Specialty GLA
(sqm)
Total GLA
(sqm)
Total GLA
commited
Amount to date ($m)(1)
Total purchase
price ($m)(1)
Cap rate
Completed Centres – FY13
Fairfield Heights, NSW Freestanding Dec-12 3,460 342 3,802 100% 16.0 16.0 7.50%
Newtown, NZ Neighbourhood Dec-12 4,480 398 4,878 99% 17.4 17.4 7.25%
Brookwater Village, Qld Neighbourhood Feb-13 4,149 2,612 6,761 100% 25.2 25.2 8.50%
Stoddard Road, NZ Freestanding Feb-13 4,200 - 4,200 100% 16.3 16.3 7.50%
Tawa, NZ Freestanding Mar-13 4,200 - 4,200 100% 12.5 12.5 7.50%
Walkerville, SA Neighbourhood Apr-13 4,200 1,132 5,332 100% 19.5 19.5 7.75%
Bridge Street, NZ Freestanding May-13 4,293 - 4,293 100% 12.4 12.4 7.63%
Highett, Vic Neighbourhood May-13 4,376 1,393 5,769 97% 24.0 24.0 7.75%
Cabarita, NSW Neighbourhood May-13 2,627 795 3,422 97% 14.9 14.9 9.00%
Margaret River, WA Neighbourhood Jun-13 3,824 1,893 5,717 81% 20.7 20.7 8.25%
Total 178.9 178.9
To be completed – FY14 and FY15
Lilydale Marketplace, Vic (opened 31 July 2013) Sub-regional Jul-13 12,791 9, 227 22,018 95% 62.3 80.5 7.75%
Katoomba Marketplace, NSW Freestanding Mar-14 9,387 - 9,387 100% 22.0 38.5 7.50%
Greystanes, NSW Neighbourhood Oct-14 3,000 2,537 5,537 100%(2) 21.9 38.2 8.00%
Total 106.2 157.2
1 Amounts for New Zealand properties translated at year end balance sheet rate 2 Centre is currently fully-leased, new lease deals to be executed for redevelopment scheme $51m yet to pay
For
per
sona
l use
onl
y

33
Portfolio List
FY13 Results Presentation
Property State Property Type Completion Date
Total GLA (sqm)
Occupancy(% by GLA)
Number of Specialties
WALE (Years by GLA)
Valuation Cap Rate
Valuation Jun-13(A$m)
Completed PortfolioAustraliaPakenham VIC Sub-Regional Dec-11 16,862 100% 38 11.3 7.50% 68.0Central Highlands QLD Sub-Regional Mar-12 18,699 100% 26 15.5 7.75% 58.5Mt Gambier SA Sub-Regional Aug-12 27,557 95% 33 18.9 7.94% 67.5Murray Bridge SA Sub-Regional Nov-11 18,624 97% 54 11.2 8.25% 58.0Kwinana Marketplace WA Sub-Regional Dec-12 28,084 91% 84 12.4 8.25% 88.0Berala NSW Neighbourhood Centre Aug-12 4,340 100% 5 17.8 8.00% 18.5Cabarita NSW Neighbourhood Centre May-13 3,422 97% 11 16.0 9.00% 14.9Cardiff NSW Neighbourhood Centre May-10 5,851 96% 13 17.4 8.25% 16.2Goonellabah NSW Neighbourhood Centre Aug-12 5,040 95% 8 15.3 8.50% 16.0Lane Cove NSW Neighbourhood Centre Nov-09 6,721 100% 16 15.6 7.25% 38.3Leura NSW Neighbourhood Centre Apr-11 2,547 100% 6 16.8 8.25% 12.5Lismore NSW Neighbourhood Centre Dec-85 6,923 89% 20 13.4 8.75% 23.6Macksvil le NSW Neighbourhood Centre Mar-10 3,623 98% 5 19.1 8.50% 9.2Merimbula NSW Neighbourhood Centre Oct-10 4,960 100% 10 16.4 8.75% 13.5Mittagong Vil lage NSW Neighbourhood Centre Dec-07 2,235 97% 5 14.2 8.00% 7.8Moama Marketplace NSW Neighbourhood Centre Aug-07 4,519 97% 5 18.2 8.50% 11.0Morisset NSW Neighbourhood Centre Nov-10 4,141 94% 9 12.0 8.75% 14.0North Orange NSW Neighbourhood Centre Dec-11 4,975 97% 14 17.6 8.00% 24.5Swansea NSW Neighbourhood Centre Oct-09 3,750 98% 4 20.2 8.50% 10.7Ulladulla NSW Neighbourhood Centre May-12 5,297 97% 10 18.3 8.50% 14.8West Dubbo NSW Neighbourhood Centre Dec-10 4,205 92% 12 14.9 8.75% 12.0Albury VIC Neighbourhood Centre Dec-11 4,949 99% 12 16.5 8.25% 17.7Ballarat VIC Neighbourhood Centre Jan-00 8,964 100% 4 7.1 7.50% 20.0Bright VIC Neighbourhood Centre Apr-10 3,257 94% 4 19.1 7.50% 9.0Cowes VIC Neighbourhood Centre Nov-11 5,039 88% 12 17.0 8.25% 16.8Drouin VIC Neighbourhood Centre Nov-08 3,798 99% 4 13.9 8.00% 12.3Epping North VIC Neighbourhood Centre Sep-11 5,378 95% 16 15.7 7.75% 20.5Highett VIC Neighbourhood Centre May-13 5,769 97% 13 17.6 7.75% 23.7Langwarrin VIC Neighbourhood Centre Oct-04 5,087 98% 14 8.9 7.75% 17.2Ocean Grove VIC Neighbourhood Centre Dec-04 6,910 96% 19 9.0 7.50% 29.9Warrnambool VIC Neighbourhood Centre Sep-11 4,318 97% 5 13.3 8.25% 11.1Warrmbool Target VIC Neighbourhood Centre Jan-90 6,984 100% 11 9.2 8.00% 19.5Wyndham Vale VIC Neighbourhood Centre Dec-09 6,914 97% 8 14.9 8.00% 18.2
For
per
sona
l use
onl
y

34
Portfolio List
FY13 Results Presentation
Property State Property Type Completion Date
Total GLA (sqm)
Occupancy(% by GLA)
Number of Specialties
WALE (Years by GLA)
Valuation Cap Rate
Valuation Jun-13(A$m)
Ayr QLD Neighbourhood Centre Jan-00 5,513 96% 9 10.9 8.00% 18.7Brookwater Vil lage QLD Neighbourhood Centre Feb-13 6,761 100% 9 15.1 8.50% 25.2Carrara QLD Neighbourhood Centre Sep-11 3,719 100% 6 13.6 8.25% 14.7Chancellor Park Marketplace QLD Neighbourhood Centre Oct-01 5,223 100% 18 16.0 8.50% 25.6Collingwood Park QLD Neighbourhood Centre Nov-09 4,568 95% 9 17.0 9.00% 11.5Coorparoo QLD Neighbourhood Centre May-12 4,870 97% 10 17.3 7.75% 21.2Gladstone QLD Neighbourhood Centre Apr-12 4,799 100% 9 15.1 8.00% 24.0Mackay QLD Neighbourhood Centre Jun-12 4,125 100% 10 16.6 8.00% 20.0Mission Beach QLD Neighbourhood Centre Jun-08 4,099 89% 10 11.9 9.50% 9.2Woodford QLD Neighbourhood Centre Apr-10 3,671 90% 9 11.8 9.50% 8.6Blakes Crossing SA Neighbourhood Centre Jul-11 5,078 91% 14 11.8 8.50% 19.9Walkervil le SA Neighbourhood Centre Apr-13 5,332 100% 12 17.7 7.75% 19.5Busselton WA Neighbourhood Centre Sep-12 5,230 99% 6 18.7 8.50% 18.2Margaret River WA Neighbourhood Centre Jun-13 5,717 81% 18 14.5 8.25% 20.7Treendale WA Neighbourhood Centre Feb-12 7,389 86% 17 9.6 8.25% 24.0Burwood DM NSW Freestanding Nov-09 1,400 100% 0 14.4 7.25% 7.3Culburra Beach NSW Freestanding Apr-11 1,698 97% 1 20.4 8.75% 5.3Fairfield Heights NSW Freestanding Dec-12 3,802 100% 2 18.8 7.50% 16.2Griffith North NSW Freestanding Apr-11 2,560 100% 0 14.3 7.50% 7.8Inverell BIG W NSW Freestanding Jun-10 7,689 98% 2 14.3 10.00% 15.5Katoomba DM NSW Freestanding Dec-11 1,420 100% 0 14.3 7.50% 5.8Mullumbimby NSW Freestanding Jun-11 2,373 100% 0 14.8 7.50% 9.0DM Warrnambool VIC Freestanding Dec-10 1,440 100% 0 15.1 6.75% 5.7Emerald Park (VIC) VIC Freestanding Oct-11 2,915 100% 0 21.4 6.75% 11.3Maffra VIC Freestanding Dec-10 2,323 100% 0 21.3 7.00% 9.3Mildura VIC Freestanding May-12 9,160 100% 1 19.2 8.00% 23.0
For
per
sona
l use
onl
y

35
Portfolio List
FY13 Results Presentation
Property State Property Type Completion Date
Total GLA (sqm)
Occupancy(% by GLA)
Number of Specialties
WALE (Years by GLA)
Valuation Cap Rate
Valuation Jun-13(A$m)
New ZealandKelvin Grove NZ Neighbourhood Centre Jun-12 3,611 95% 5 17.7 8.00% 9.1Newtown NZ Neighbourhood Centre Dec-12 4,878 99% 6 18.3 7.25% 17.5Takanini NZ Neighbourhood Centre Dec-10 7,298 100% 11 12.9 8.00% 25.6Warkworth NZ Neighbourhood Centre Sep-12 3,831 89% 6 17.4 8.00% 14.1Bridge Street NZ Freestanding May-13 4,293 100% 0 14.8 7.63% 12.5Dunedin South NZ Freestanding Jun-12 4,071 100% 0 14.4 8.25% 12.7Hornby NZ Freestanding Nov-10 4,317 100% 0 14.4 8.25% 12.7Kerikeri NZ Freestanding Dec-11 3,887 100% 0 19.4 8.13% 12.2Nelson South NZ Freestanding Jun-08 2,659 100% 0 19.4 8.00% 8.1Rangiora East NZ Freestanding Jan-12 3,786 100% 0 19.4 8.13% 10.3Rolleston NZ Freestanding Nov-11 4,251 100% 0 19.5 8.25% 11.0Stoddard Road NZ Freestanding Feb-13 4,200 100% 0 13.6 7.50% 16.4Tawa NZ Freestanding Mar-13 4,200 100% 0 19.6 7.50% 12.0
Development Portfolio/ OtherLilydale VIC Sub-Regional Jul-13 22,018 95% 53 7.75% 80.5Katoomba Marketplace NSW Freestanding Mar-14 9,387 n/a 0 7.50% 38.5Greystanes NSW Neighbourhood Centre Oct-14 5,537 n/a 31 8.00% 38.2St James NZ Neighbourhood Centre Jun-06 4,505 99.0% 6 7.88% 10.2
For
per
sona
l use
onl
y

Disclaimer
This presentation has been prepared by Shopping Centres Australasia Property Group RE Limited (ABN 47 158 809 851) (SCPRE) as responsible entity of Shopping Centres Australasia Property Management Trust (ARSN 160 612 626) and responsible entity of Shopping Centres Australasia Property Retail Trust (ARSN 160 612 788) (together, SCA Property Group or the Group).
Information contained in this presentation is current as at 28 August 2013. This presentation is provided for information purposes only and has been prepared without taking account of any particular reader's financial situation, objectives or needs. Nothing contained in this presentation constitutes investment, legal, tax or other advice. Accordingly, readers should, before acting on any information in this presentation, consider its appropriateness, having regard to their objectives, financial situation and needs, and seek the assistance of their financial or other licensed professional adviser before making any investment decision.
This presentation does not constitute an offer, invitation, solicitation or recommendation with respect to the subscription for, purchase or sale of any security, nor does it form the basis of any contract or commitment.
Except as required by law, no representation or warranty, express or implied, is made as to the fairness, accuracy or completeness of the information, opinions and conclusions, or as to the reasonableness of any assumption, contained in this presentation.
The forward looking statements included in this presentation involve subjective judgment and analysis and are subject to significant uncertainties, risks and contingencies, many of which are outside the control of, and are unknown to, the Group. In particular, they speak only as of the date of these materials, they assume the success of the Group’s business strategies, and they are subject to significant regulatory, business, competitive and economic uncertainties and risks. Actual future events may vary materially from forward looking statements and the assumptions on which those statements are based. Given these uncertainties, readers are cautioned not to place undue reliance on such forward looking statements.
By reading this presentation and to the extent permitted by law, the reader releases each entity in the Group and its affiliates, and any of their respective directors, officers, employees, representatives or advisers from any liability (including, without limitation, in respect of direct, indirect or consequential loss or damage or loss or damage arising by negligence) arising in relation to any reader relying on anything contained in or omitted from this presentation.
The Group, or persons associated with it, may have an interest in the securities mentioned in this presentation, and may earn fees as a result of transactions described in this presentation or transactions in securities in SCP.
All values are expressed in Australian dollars unless otherwise indicated.
SCA Property Group Level 8, 50 Pitt Street Sydney NSW 2000 Tel: (02) 8243 4900 Fax: (02) 8243 4999 www.scaproperty.com.au
For
per
sona
l use
onl
y