scheduling efficiency: finding the right measure
TRANSCRIPT
Copyright 2018 Axsium Group Ltd. All rights reserved | www.axsiumgroup.com
SCHEDULING EFFICIENCY: FINDING THE RIGHT MEASURE
Copyright 2018 Axsium Group Ltd. All rights reserved | www.axsiumgroup.com Page | 2
The key to delivering an effective benefit case for a workforce management (WFM) solution is to provide an efficient staffing schedule that better aligns business resources against the demand required to serve customers and complete work. This paper examines what “schedule efficiency” means and the best way to measure it.
Delivering the Right Staffing Schedule
Schedule optimization, payroll efficiency and line of best fit are all terms software vendors use to prove that their solution will help a business deliver better service while at the same time optimizing labour hours. But have you ever wondered how schedule optimization is really calculated? Do you know how it’s measured against the outcomes you’re trying to achieve – such as cost, service levels or sales? Is there one “killer metric” that can be used across all retail verticals? The answers may surprise you.
Why Does it Matter Anyway?
So why is it important? It’s easy to just give the stock answer “to track performance” but consider this: some of the methods used, despite making sense mathematically, can actually give conflicting results. A more favourable result using one method can produce a less favourable one when an alternative method from the very same set of data is used.
Also, if the end user doesn’t understand the methodology then how can they buy into and successfully execute on it? When employees don’t feel like they’re connected to the activity behind the scenes, where the work is actually happening, then they’re not going to change what they’re doing and will often find a way to make the math work for them instead of what’s good for the business.
In this white paper, we’ll outline several approaches worth considering when trying to determine the right schedule for your organization.
Forward-Looking Efficiency Measures and Models
Most often, schedule efficiency is first measured on planned schedules. Managers are tasked with hitting a certain level prior to finalizing and publishing the schedules to employees. This measure will always be the most efficient as it is based on a plan - technically it’s the best guess for future deployment of employees.
However, setting a target efficiency that is unreasonable to achieve can drive adverse results. The measures set out below will help provide better visibility when developing schedules using future determinations.
Copyright 2018 Axsium Group Ltd. All rights reserved | www.axsiumgroup.com Page | 3
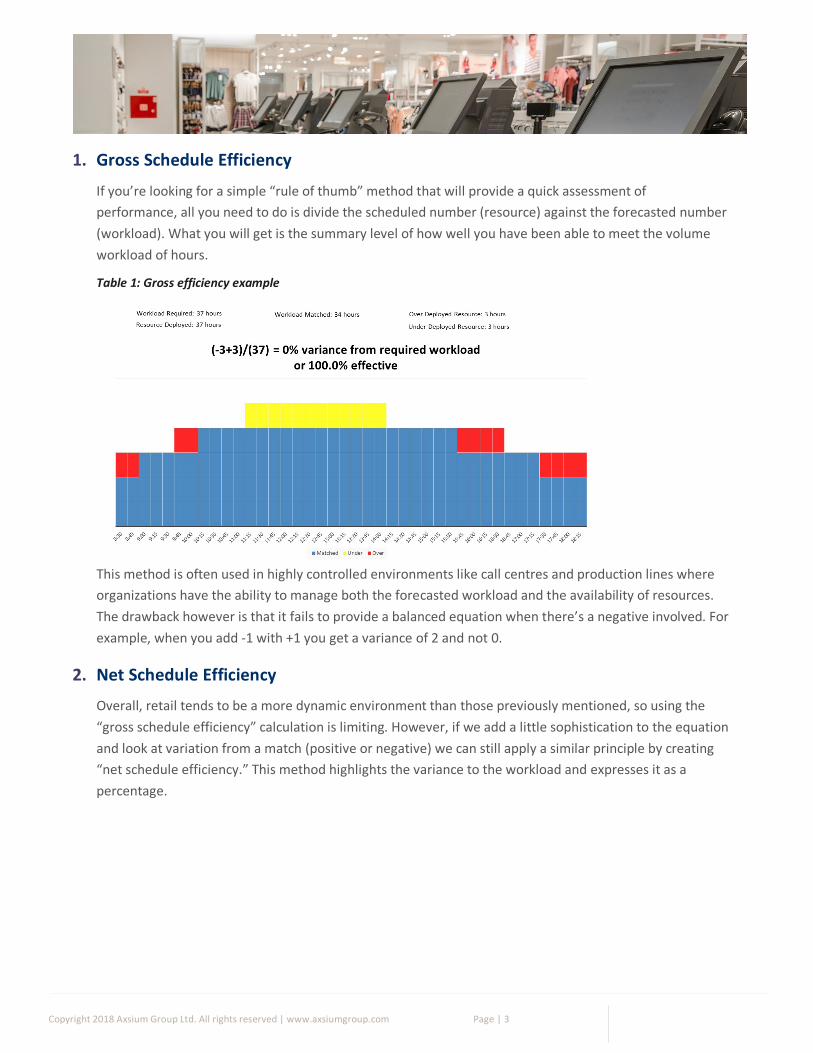
1. Gross Schedule Efficiency
If you’re looking for a simple “rule of thumb” method that will provide a quick assessment of performance, all you need to do is divide the scheduled number (resource) against the forecasted number (workload). What you will get is the summary level of how well you have been able to meet the volume workload of hours.
Table 1: Gross efficiency example
This method is often used in highly controlled environments like call centres and production lines where organizations have the ability to manage both the forecasted workload and the availability of resources. The drawback however is that it fails to provide a balanced equation when there’s a negative involved. For example, when you add -1 with +1 you get a variance of 2 and not 0.
2. Net Schedule Efficiency
Overall, retail tends to be a more dynamic environment than those previously mentioned, so using the “gross schedule efficiency” calculation is limiting. However, if we add a little sophistication to the equation and look at variation from a match (positive or negative) we can still apply a similar principle by creating “net schedule efficiency.” This method highlights the variance to the workload and expresses it as a percentage.
Copyright 2018 Axsium Group Ltd. All rights reserved | www.axsiumgroup.com Page | 4
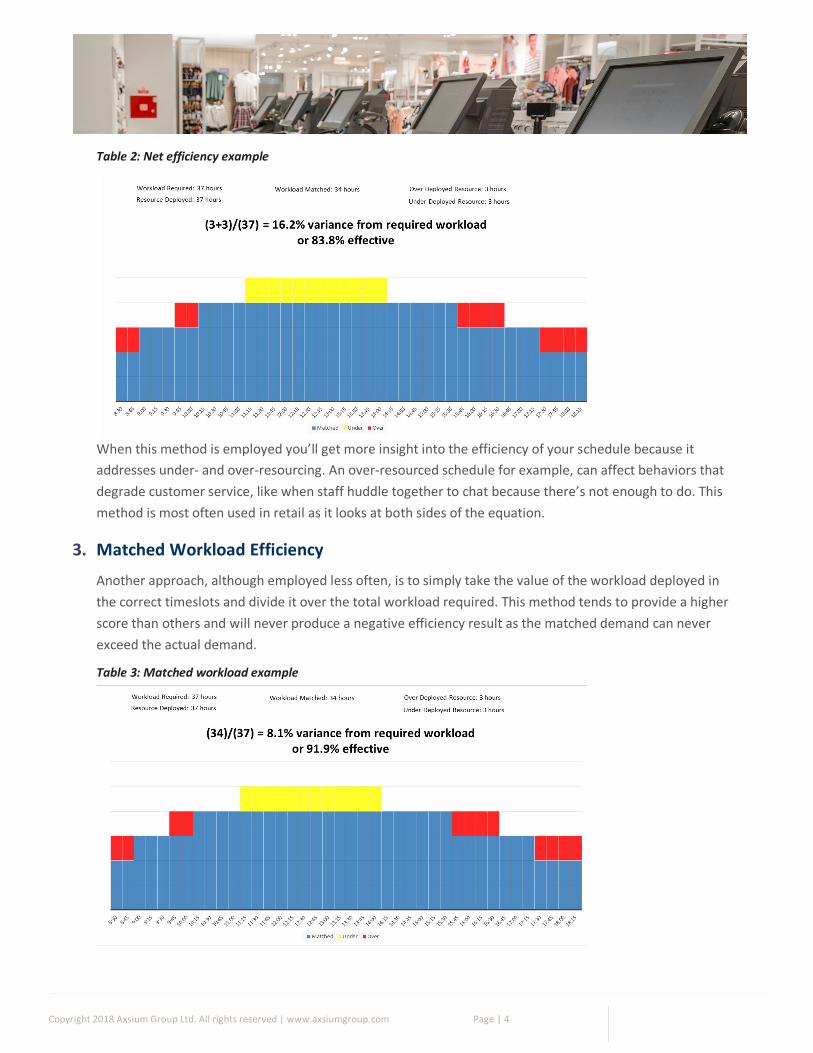
Table 2: Net efficiency example
When this method is employed you’ll get more insight into the efficiency of your schedule because it addresses under- and over-resourcing. An over-resourced schedule for example, can affect behaviors that degrade customer service, like when staff huddle together to chat because there’s not enough to do. This method is most often used in retail as it looks at both sides of the equation.
3. Matched Workload Efficiency
Another approach, although employed less often, is to simply take the value of the workload deployed in the correct timeslots and divide it over the total workload required. This method tends to provide a higher score than others and will never produce a negative efficiency result as the matched demand can never exceed the actual demand.
Table 3: Matched workload example
Copyright 2018 Axsium Group Ltd. All rights reserved | www.axsiumgroup.com Page | 5
4. Weighted Workload Efficiency
Focusing on a particular measure can have a significant impact on behaviour, which has been demonstrated time and time again in business environments where commission is used to drive sales performance. Driving the wrong behaviour can have a negative impact on customer relations while at the same time forcing employees to seek creative ways to achieve required performance levels.
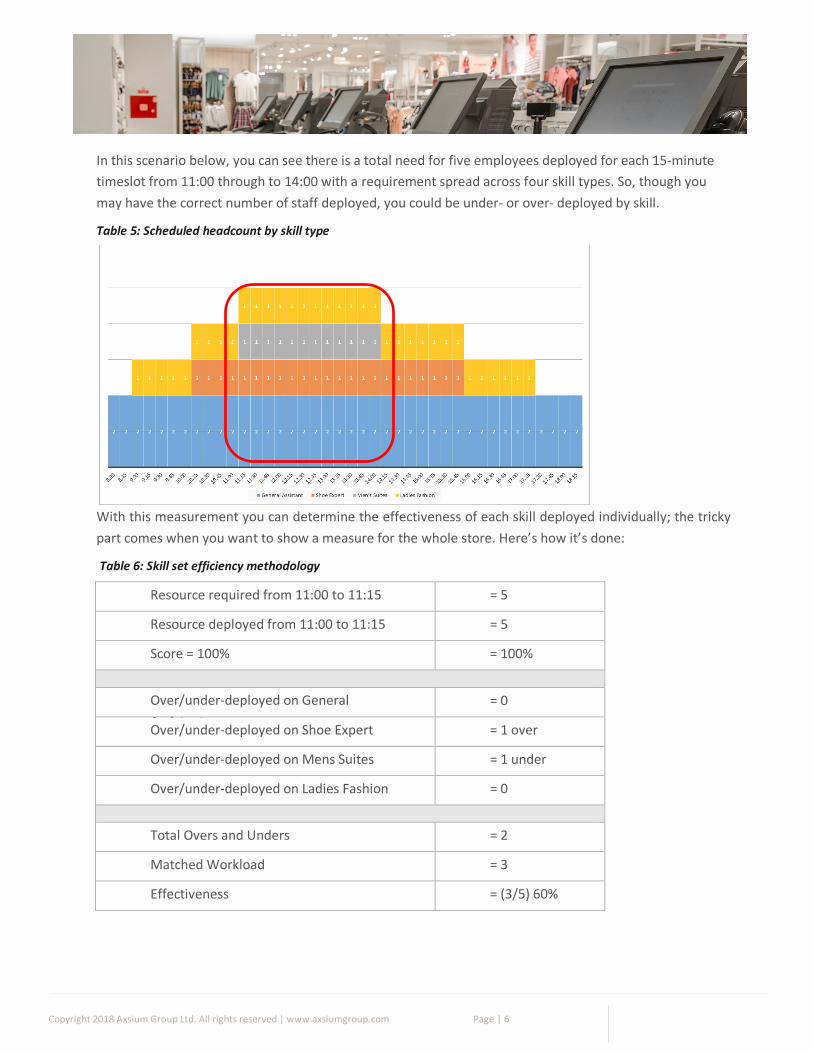
Table 4: Weighted workload efficiency example
By weighting over-deployment higher than under-deployment (or the other way around), the behavior towards delivering service versus payroll overspend can be balanced out. To ensure service levels are achieved simply weight the under-deployment measure.
Qualitative Approaches
So far each method we have reviewed has been quantitative based on the accuracy of matching resource requirements against the number of employees. But what if you wanted to take a more qualitative approach? What about outcomes that affect the customer?
1. Ability or Grade Efficiency
All of the approaches we’ve looked at have limitations when it comes to gaining insight into employee capability and competency. To ensure that the best qualified staff are scheduled in the right place at the right time you need to measure what we call “ability or grade efficiency.”
Talk to any store manager and they’ll tell you that there are clearly gradients in abilities and competencies within their team. In certain cases (high-end fashion, big ticket sales and personal finance, for example) these factors become material to the effectiveness of the scheduling process; every staff member might have been trained to sell but some employees are just better at it than others which directly impacts conversion and profitability.
Copyright 2018 Axsium Group Ltd. All rights reserved | www.axsiumgroup.com Page | 6
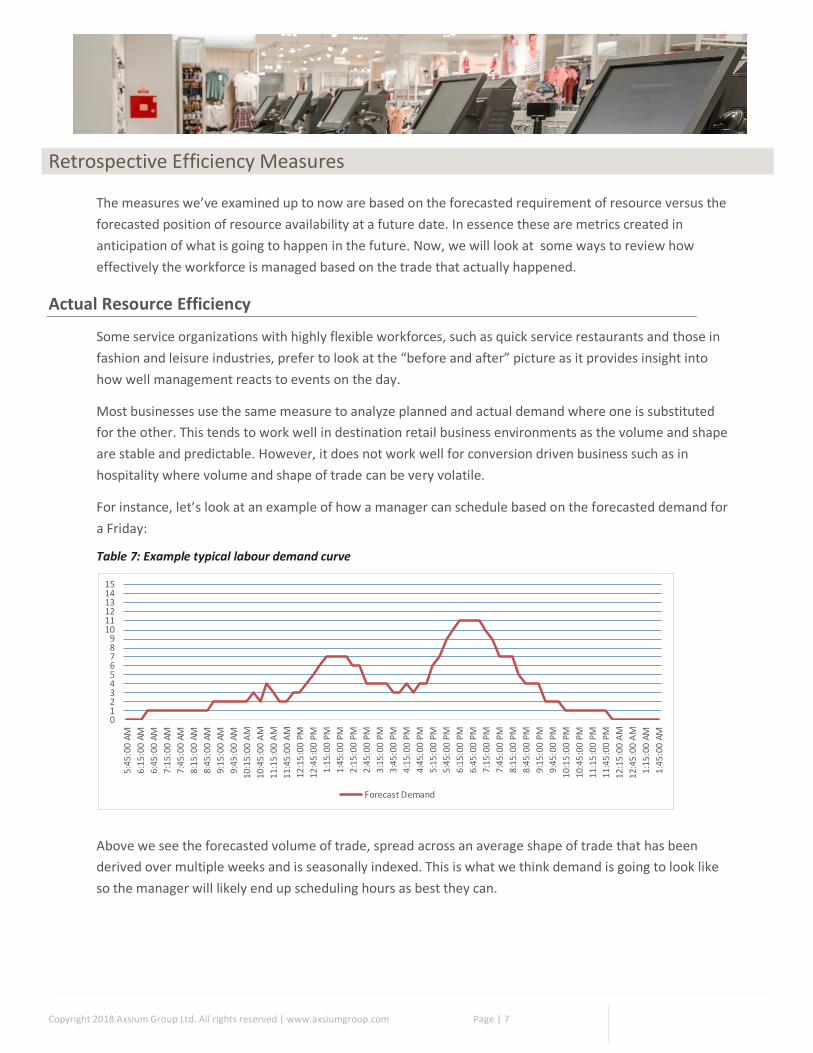
In this scenario below, you can see there is a total need for five employees deployed for each 15-minute timeslot from 11:00 through to 14:00 with a requirement spread across four skill types. So, though you may have the correct number of staff deployed, you could be under- or over- deployed by skill.
Table 5: Scheduled headcount by skill type
With this measurement you can determine the effectiveness of each skill deployed individually; the tricky part comes when you want to show a measure for the whole store. Here’s how it’s done:
Table 6: Skill set efficiency methodology
Resource required from 11:00 to 11:15 = 5
Resource deployed from 11:00 to 11:15 = 5
Score = 100% = 100%
Over/under-deployed on General Assistant
= 0
Over/under-deployed on Shoe Expert = 1 over
Over/under-deployed on Mens Suites = 1 under
Over/under-deployed on Ladies Fashion = 0
Total Overs and Unders = 2
Matched Workload = 3
Effectiveness = (3/5) 60%
Copyright 2018 Axsium Group Ltd. All rights reserved | www.axsiumgroup.com Page | 7
Retrospective Efficiency Measures
The measures we’ve examined up to now are based on the forecasted requirement of resource versus the forecasted position of resource availability at a future date. In essence these are metrics created in anticipation of what is going to happen in the future. Now, we will look at some ways to review how effectively the workforce is managed based on the trade that actually happened.
Actual Resource Efficiency
Some service organizations with highly flexible workforces, such as quick service restaurants and those in fashion and leisure industries, prefer to look at the “before and after” picture as it provides insight into how well management reacts to events on the day.
Most businesses use the same measure to analyze planned and actual demand where one is substituted for the other. This tends to work well in destination retail business environments as the volume and shape are stable and predictable. However, it does not work well for conversion driven business such as in hospitality where volume and shape of trade can be very volatile.
For instance, let’s look at an example of how a manager can schedule based on the forecasted demand for a Friday:
Table 7: Example typical labour demand curve
Above we see the forecasted volume of trade, spread across an average shape of trade that has been derived over multiple weeks and is seasonally indexed. This is what we think demand is going to look like so the manager will likely end up scheduling hours as best they can.
0123456789
101112131415
5:45
:00
AM6:
15:0
0 AM
6:45
:00
AM7:
15:0
0 AM
7:45
:00
AM8:
15:0
0 AM
8:45
:00
AM9:
15:0
0 AM
9:45
:00
AM10
:15:
00 A
M10
:45:
00 A
M11
:15:
00 A
M11
:45:
00 A
M12
:15:
00 P
M12
:45:
00 P
M1:
15:0
0 PM
1:45
:00
PM2:
15:0
0 PM
2:45
:00
PM3:
15:0
0 PM
3:45
:00
PM4:
15:0
0 PM
4:45
:00
PM5:
15:0
0 PM
5:45
:00
PM6:
15:0
0 PM
6:45
:00
PM7:
15:0
0 PM
7:45
:00
PM8:
15:0
0 PM
8:45
:00
PM9:
15:0
0 PM
9:45
:00
PM10
:15:
00 P
M10
:45:
00 P
M11
:15:
00 P
M11
:45:
00 P
M12
:15:
00 A
M12
:45:
00 A
M1:
15:0
0 AM
1:45
:00
AM
Forecast Demand
Copyright 2018 Axsium Group Ltd. All rights reserved | www.axsiumgroup.com Page | 8
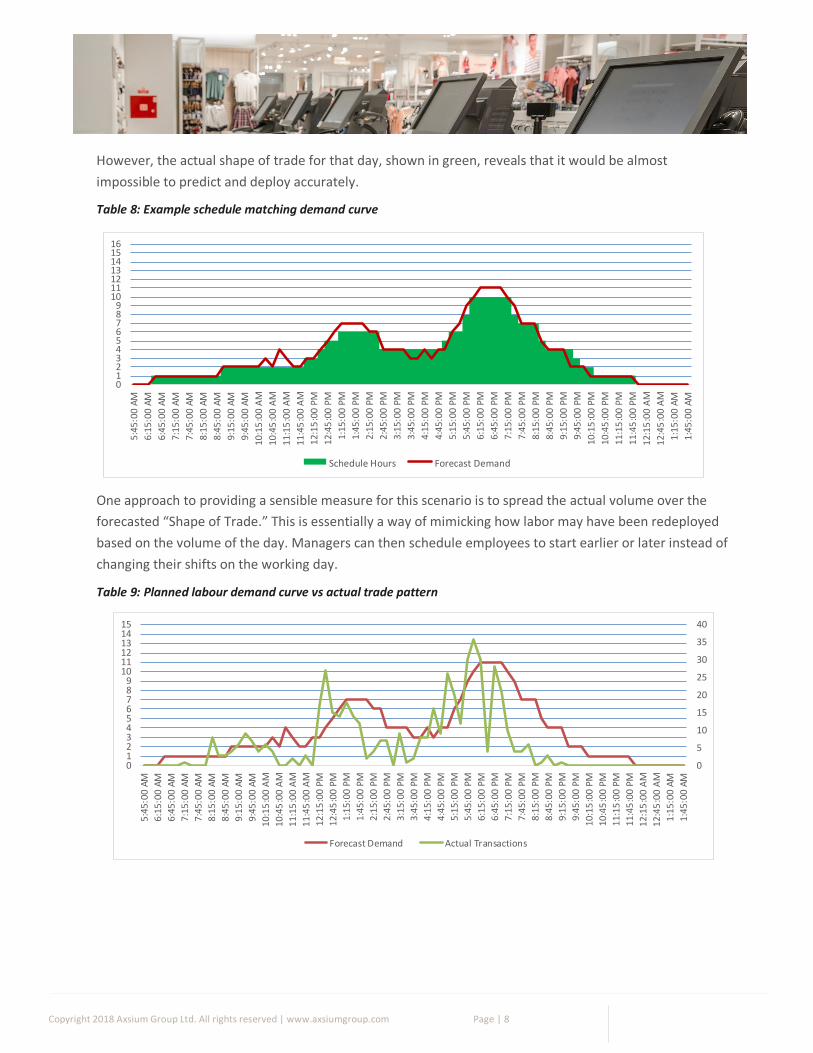
However, the actual shape of trade for that day, shown in green, reveals that it would be almost impossible to predict and deploy accurately.
Table 8: Example schedule matching demand curve
One approach to providing a sensible measure for this scenario is to spread the actual volume over the forecasted “Shape of Trade.” This is essentially a way of mimicking how labor may have been redeployed based on the volume of the day. Managers can then schedule employees to start earlier or later instead of changing their shifts on the working day.
Table 9: Planned labour demand curve vs actual trade pattern
0
5
10
15
20
25
30
35
40
0123456789
101112131415
5:45
:00
AM6:
15:0
0 AM
6:45
:00
AM7:
15:0
0 AM
7:45
:00
AM8:
15:0
0 AM
8:45
:00
AM9:
15:0
0 AM
9:45
:00
AM10
:15:
00 A
M10
:45:
00 A
M11
:15:
00 A
M11
:45:
00 A
M12
:15:
00 P
M12
:45:
00 P
M1:
15:0
0 PM
1:45
:00
PM2:
15:0
0 PM
2:45
:00
PM3:
15:0
0 PM
3:45
:00
PM4:
15:0
0 PM
4:45
:00
PM5:
15:0
0 PM
5:45
:00
PM6:
15:0
0 PM
6:45
:00
PM7:
15:0
0 PM
7:45
:00
PM8:
15:0
0 PM
8:45
:00
PM9:
15:0
0 PM
9:45
:00
PM10
:15:
00 P
M10
:45:
00 P
M11
:15:
00 P
M11
:45:
00 P
M12
:15:
00 A
M12
:45:
00 A
M1:
15:0
0 AM
1:45
:00
AM
Forecast Demand Actual Transactions
0123456789
10111213141516
5:45
:00
AM6:
15:0
0 AM
6:45
:00
AM7:
15:0
0 AM
7:45
:00
AM8:
15:0
0 AM
8:45
:00
AM9:
15:0
0 AM
9:45
:00
AM10
:15:
00 A
M10
:45:
00 A
M11
:15:
00 A
M11
:45:
00 A
M12
:15:
00 P
M12
:45:
00 P
M1:
15:0
0 PM
1:45
:00
PM2:
15:0
0 PM
2:45
:00
PM3:
15:0
0 PM
3:45
:00
PM4:
15:0
0 PM
4:45
:00
PM5:
15:0
0 PM
5:45
:00
PM6:
15:0
0 PM
6:45
:00
PM7:
15:0
0 PM
7:45
:00
PM8:
15:0
0 PM
8:45
:00
PM9:
15:0
0 PM
9:45
:00
PM10
:15:
00 P
M10
:45:
00 P
M11
:15:
00 P
M11
:45:
00 P
M12
:15:
00 A
M12
:45:
00 A
M1:
15:0
0 AM
1:45
:00
AM
Scheduel Hours Forecast DemandSchedule Hours Forecast Demand
Copyright 2018 Axsium Group Ltd. All rights reserved | www.axsiumgroup.com Page | 9
2. Sales per Hour Deployed
Let’s say you’re looking for a more commercial perspective and want to link sales directly to labor so that hours are effectively “bought” via sales performance. In this case you might consider using the “Sales per Hour Deployed” metric, directly linking productivity measurement to site revenue.
As far as retrospective measures go, this one provides the ultimate level playing field since you can answer questions like, “How many customers should I have served?”, “Did they receive the correct level of service?” and “Did we achieve our sales target?”
For example:
Sales achieved (excluding refunds) = $20,000
Hours scheduled (inclusive of all grades) = 100
Sales per hour deployed = $200
Based on these results you can then generate a secondary measure. For example, if your store had under-deployed, the total of these hours can be multiplied by the sales per hour deployed to produce a potential missed opportunity value:
Under-deployed Hours = 50
Sales per hour deployed = $200
50 x 200 = $10,000 in missed opportunity
Note that a degree of caution is required here, as too literal an interpretation could prove the case for some stores to close due to underperformance. Consider a low trading store – it will need some form of minimum complement that this metric will not drive if left undiluted – management would prefer a skeleton staff albeit with low trade volumes. The lesson here: It’s important to always take into account the behaviors that you could inadvertently drive.
What’s the Right Measure for Your Business
Choosing the right method for your business depends on what you are seeking to deliver. If you want a straight forward productivity perspective then one of the qualitative methods could work well. If on the other hand you want to understand value for money, then net efficiency is a better method to employ.
Copyright 2018 Axsium Group Ltd. All rights reserved | www.axsiumgroup.com Page | 10
Still, retail organizations need to consider multiple schedule efficiency metrics to drive the right behaviors in each area of the store. For example, while it might be desirable to keep the replenishment and recovery administrative areas of the store as lean as possible, is this also true for the service areas of the store? Or, if the collection desk or service counters offer upsell and cross-sell opportunities, should they also be managed in the same way at the same times of the day?
Therefore, when determining the right metric(s) to implement into your business practices ask yourself what does efficiency actually mean to your organization. Is it:
• Speed of service?
• Cost control?
• What outcomes you want for customers?
• What outcomes you want from employees?
Above all, the employees and managers in the stores being analyzed should have a clear understaning of the measures. But’s it’s not just about grasping the maths, rather it’s about knowing the purpose of the score and why it is important to the business. This will help ensure schedules are not being manually manipulated to achieve the desired score.
About the Authors
Neil Maltby has been an industry practitioner for 17 years having worked in field and central retail roles before Consulting of the past 4 years. David Roberts has spent 20 years in the workforce management industry both as a software vendor and industry consultant.
About Axsium Group
Axsium Group helps organizations around the world improve their performance by maximizing the productivity of their people. We do this by providing innovative and insightful consulting services focused in three areas. First, we help our clients establish a realistic strategy and roadmap to reach their people-related goals. Second, we focus on streamlining and defining new processes to improve the way people work, their productivity and their impact on their organization. And third, we implement and support technology that helps all levels of the organization achieve their objectives.
For more information: Axsium Group
888-AXSIUM1
[email protected] www.axsiumgroup.com