sd1 strategic argument
TRANSCRIPT

SD1 Strategic Argument
Updated Scheme Design
SD1 Strategic Argument
SD1 Strategic Argument
Response to Airports Commission Updated Scheme Design 1
Table of Contents
Foreword ............................................................................................................................................. 5
Executive Summary ............................................................................................................................. 7
Overview .............................................................................................................................................. 9
1. Structure of the Strategic Argument ............................................................................................ 21
2. Strategic Fit ................................................................................................................................ 23
3. Economy Impacts ..................................................................................................................... 120
4. Local Economy Impacts ............................................................................................................ 123
5. Surface Access Provision ......................................................................................................... 129
6. Appendix A – Edinburgh Case Study ........................................................................................ 141
SD1 Strategic Argument
2 Response to Airports Commission Updated Scheme Design
Table of Figures
Figure 1: Heathrow International – International Transfer Passengers ........................................... 25
Figure 2: Heathrow V Gulf Hubs And Istanbul ................................................................................ 26
Figure 3: Current Passenger Volumes And Planned Capactiy ........................................................ 27
Figure 4: Long Term Yield Trends .................................................................................................. 29
Figure 5: Level Of Airport And Airline Competition In London 2014 V 2004 .................................... 31
Figure 6: Leading Aviation Cities .................................................................................................... 33
Figure 7: 2012 % Transfer At Airport City V 2012 World City Status ............................................... 34
Figure 8: Change In Number Of Cities Served From London Airports2014 V 2004 ........................ 35
Figure 9: Emerging Markets – Change In Number Of Cities Served From London 2014 V 2004 ... 36
Figure 10: European International Connectivity From Uk Regional Airports 2014 V 2004 ................ 37
Figure 11: Non-European Connectivity From Uk Regional Airports 2014 V 2004 ............................. 38
Figure 12: London Airport System Unconstrained Passenger Forecast ............................................ 42
Figure 13: Share Of Uk Exports ....................................................................................................... 43
Figure 14: London Airport System 2050 Unconstrained O&D Traffic Forecast ................................. 44
Figure 15: 787 Family Operating Economics .................................................................................... 45
Figure 16: London Airports Catchment Analysis ............................................................................... 48
Figure 17: European Airline Narrow Body Fleet Growth ................................................................... 49
Figure 18: Global Airline Wide Body Fleet Growth ............................................................................ 50
Figure 19: Turnaround Times For Short Haul Narrow Body Aircraft ................................................. 55
Figure 20: Gatwick V Heathrow Published Block Times On Overlapping Routes ............................. 55
Figure 21: Utilisation Of Narrow Body Aircraft: Gatwick V Heathrow ................................................ 57
Figure 22: Gatwick Master Plan Layout ............................................................................................ 58
Figure 23: Capital Investment Indicative Phasing Plan ..................................................................... 66
Figure 24: Core Airport Charge Per Passnger For Typical Lcc Operation ........................................ 69
Figure 25: Typical Lcc Revenue Per Passenger Compared To Airport Charges .............................. 70
Figure 26: 2013 Traffic Breakdown By Airline Business Model ......................................................... 72
Figure 27: 2050 London Airport System Demand ............................................................................. 73
Figure 28: 2050 Potential Airport Capacity For Different Airline Business Models ............................ 74
Figure 29: London Airport System 2+2 Passenger Forecast ............................................................ 77
Figure 30: London 2050 Traffic Forecasts By Runway Scenario ...................................................... 78
Figure 31: 2+2 V 3+1 V Do Minimum Passenger Airport Forecasts In 2050 ..................................... 79
Figure 32: 2+2 V 3+1 V Do Minimum Passenger Type Forecasts For London In 2050 .................... 80
Figure 33: London System Passengers By Runway Scenario .......................................................... 81
Figure 34: Annual Difference In Forecast Airport Charges ............................................................... 81
Figure 35: Number Of Destinations Served From London In 2050 By Scenario ............................... 83
Figure 36: Delivery Of Capacity Needed In Line With The Estimated Capacity Requirement ........... 86
Figure 37: Flexibility To Cope With Uncertainty ................................................................................ 86
Figure 38: Performance Across A Balanced Assessment Of Other Elements Of Need .................... 87
Figure 39: Gatwick Service Quality At Record Levels ....................................................................... 92
Figure 40: Airport Service Quality (Asq) For Gatwick 2009 And 2014 ............................................... 93
Figure 41: Gatwick Security Queue Performance ............................................................................. 94
SD1 Strategic Argument
Response to Airports Commission Updated Scheme Design 3
Figure 42: Passenger Rating Performance ....................................................................................... 94
Figure 43: Detailed Analysis Of Journey Times ................................................................................ 95
Figure 44: Proposed Gatwick Gateway ............................................................................................. 98
Figure 45: New Class 700 Thameslink Train .................................................................................... 99
Figure 46: Gatwick Connect Development Timeline ....................................................................... 102
Figure 47: 2013 Average Economy Class Fares: Heathrow V European Hubs ............................... 105
Figure 48: 2013 Average Business Class Fares: Heathrow V European Hubs ............................... 106
Figure 49: Comparison Of Average Fares And Yields: Full Service V Lcc ...................................... 107
Figure 50: 2050 Number Of Weekly Flights From London .............................................................. 108
Figure 51: Rail Journey Times To London Development Areas ...................................................... 117
Figure 52: London Airport System Passenger Forecast By Scheme ............................................... 121
Figure 53: Economic Benefits Compared ........................................................................................ 121
Figure 54: Coast To Capital Lep Including Gatwick Diamond ......................................................... 124
Figure 55: Gatwick’s Rail Network .................................................................................................. 133
Figure 56: Total Capacity On Brighton Mainline Through Gatwick Overtime ................................... 136
Figure 57: A Wide Catchment And Easy Connections For Trips To Gatwick Save Time ................. 139
Figure 58: European International Connectivity From Edinburgh 2014 V 2004 ............................... 141
Figure 59: 2004 Air Service Network: Edinburgh – European International Destinations ................ 142
Figure 60: 2014 Air Service Network: Edinburgh – European International Destinations ................ 142
Figure 61: Non-European Connectivity From Edinburgh 2014 V 2004 ............................................ 143
Figure 62: Edinburgh – Scheduled Service To Hub Airports ........................................................... 144
Figure 63: Edinburgh-London Air Passenger Growth V London-Scotland Rail Passenger Growth . 145
SD1 Strategic Argument
4 Response to Airports Commission Updated Scheme Design
Table of Appendices
AC Module 1 Strategic Fit
Appendix A1 London Traffic Report Appendix A2 How Technology will drive transformation of the aviation industry
AC Module 2 Economy Impacts
Appendix A3 Economic Impact Assessment
AC Module 3 Local Economy Impacts
Appendix A4 Local Economy Impacts
AC Module 4 Surface Access
Appendix A6 Surface Access

SD1 Strategic Argument – Foreword
Response to Airports Commission Updated Scheme Design 5
Foreword
Our plans are exciting and innovative and will deliver a smooth, enjoyable and seamless travel
experience for all types of passenger based on an ultra-efficient infrastructure and service solution
which will generate more traffic at lower airfares and more connections than any other option.
In deciding how best to provide the additional capacity the UK needs there is a clear choice.
On the one hand are the strategic growth opportunities offered by a modern and competitive airports
system in which an expanded Gatwick increases competition that drives versatility, innovation and
affordability; in which greater capacity is created that is right for the new generation of airlines whose
varying operating models are increasingly efficiency-based; and in which passengers and airlines
benefit from more choice, lower fares and lower operating costs.
On the other hand is the reinforcement of the status quo through the expansion of Heathrow: serving
traditional demand patterns and operating modes that we know are in relative decline; placing more
pressure on communities that can’t take increased noise or pollution, and on roads that are already
over congested; diminishing competition in a market that successive governments have being trying
hard to make more competitive for the last decade or more.
Expanding Heathrow would mean waiting longer for delivery; losing a cumulative 170m additional
passengers between now and 2050 and risking the economic benefits on an operating model that will
inevitably lag behind industry evolution.
Gatwick’s runway and airport expansion proposal goes much further than solving a local capacity
issue. Its design and operating proposition have been conceived in direct response to current and
future market conditions. It offers an imaginative, good value and quick to implement, solution aimed
at capturing the greatest share of a number of growth segments in the aviation market for the benefit
of the London airport system and the UK economy.
Expanding Gatwick maximises airline and passenger choice and is the best option for capturing the
benefit of the trends that are dramatically reshaping the global aviation industry. It offers affordable
choice to existing and new entrants to the market. It increases connectivity for outbound passengers,
supports regional connectivity and delivers greater inbound visitor numbers with direct economic
benefits. It enhances real competition in the UK airport sector which will inevitably reduce prices for
passengers, drive innovation and service quality, and strengthen the effectiveness and
responsiveness of the airport system as a whole. Ultimately, it will enable the London airport system
to compete more effectively in the global aviation market and maintain the UK’s position as the
leading European aviation hub.
Expanding Gatwick will improve the resilience of the system and, in combination with Heathrow and
the other London airports, reduce overall journey times by allowing passengers to choose the most
convenient airport to them for more routes and offering much quicker journey times through the airport
itself. The traffic and the surface access requirements will be spread, avoiding exacerbating the
congestion around Heathrow.
SD1 Strategic Argument – Foreword
6 Response to Airports Commission Updated Scheme Design
Through its expansion in the next ten years, Gatwick can have a transformational effect on the
competitiveness of the UK’s airport system, a catalytic effect on the nation’s economy and an
Olympics scale effect on London and the South East. All this, whilst minimising the negative impacts
on communities in terms of disruption, social costs, air quality and noise.
Overall, our analysis shows that our Master Plan will deliver significant time savings for passengers
of, on average, around 38 minutes for each one-way journey they make in a 2+2 (Gatwick second
runway solution) versus a 3+1 (Heathrow runway 3 solution). For a return trip this equates with a time
of some 76 minutes and would drive a significant economic benefit for passengers. Much of this
saving relates to the time travelling to the airport.
SD1 Strategic Argument – Executive Summary
Response to Airports Commission Updated Scheme Design 7
Executive Summary
Expansion at Gatwick provides the best solution for maintaining the UK’s position in the global market
place, with London remaining the best connected global city. The key reasons for this, which we
develop further in this paper, are:
Expansion at Gatwick will deliver more capacity, more passengers and more frequencies to more
destinations, earlier than expanding Heathrow. It is, therefore, the quickest and best way to
maintain the UK’s position as Europe’s most important aviation hub.
The Gatwick option will deliver a higher level of connectivity for short haul destinations and a
similar volume of long haul destinations.
Gatwick R2 can be delivered at far lower cost than Heathrow, with a higher degree of certainty
and much less planning, construction, financial and political risks.
Gatwick will cater for the full range of existing and likely airline models and provide superior
operational efficiency for airlines than Heathrow. Its lower airport charges will benefit all types of
short and long haul traffic. Between 2025 and 2050, airlines would pay £40bn (in 2014 prices) less
in aeronautical charges than they would under the Heathrow options.
Gatwick’s compact and intuitive layout will offer faster and better quality journeys through the
airport, particularly for a growing number of transfer passengers who will enjoy much quicker
connection times than at Heathrow.
Expansion at Gatwick will increase route competition, especially between the London airports, and
this will lead to much lower air fares whereas expansion at Heathrow will increase its market
power and lessen competition. Competition benefits will be felt across the majority of short haul
and long haul routes. This is good for all types of travellers, whether business or leisure, and
makes the UK a more attractive place to do business.
Gatwick will have excellent surface access, providing convenient, high quality and uncongested
links for a wide catchment area across London, the South East and Midlands. It spreads the
surface access load and is more sustainable and will mean shorter journey times for more
passengers.
The noise impact of individual aircraft flights to and from London’s airports will reduce somewhat
over time in all scenarios, whether Heathrow or Gatwick is selected. However, a key impact of the
Airports Commission’s decision will be to recommend where an additional quarter of a million
flights a year will be directed. This could either be over Central London impacting 240,000 people
today based on the 57 leq noise contour or 725,000 based on the 55 Lden contour or largely over
rural Sussex impacting 14,000 people at 57 Leq.
The fundamental issue with regard to aircraft noise is to identify the difference between a three-
runway and a two-runway Heathrow as, given the overflying of London, it is clear that many more
people will be affected. Gatwick has supplied the relevant information for its expansion, but
Heathrow has so far failed to do so;
SD1 Strategic Argument – Executive Summary
8 Response to Airports Commission Updated Scheme Design
The social and health impacts of a Gatwick expansion will be far less. Approximately 750 fewer
houses will need to be compulsorily acquired and these are all within a safeguarded area;
Gatwick’s air quality is, and will remain, well within European standards, which are likely to
toughen, unlike that at Heathrow.
An expanded Gatwick will create more employment opportunities in deprived areas to the South
and East of London, rebalancing the London economy away from an overheating West, in line
with the London Plan.
Gatwick with increased capacity will offer excellent access to London and international
destinations from the regions for all categories of traffic.
An expanded Gatwick provides a much more balanced and resilient London airport system while
still enabling Heathrow to continue to serve its traditional markets and legacy airlines.
Expansion at Gatwick will not require public subsidy for surface access improvements and will
generate a more positive contribution to Government than expansion at Heathrow. The Gatwick
expansion will be entirely funded by the private sector.
A decision in favour of a new runway at Gatwick is more deliverable than either of the Heathrow
options as local community and political opposition is far less and the risks and costs for both
users and the State are much lower.
SD1 Strategic Argument – Overview
Response to Airports Commission Updated Scheme Design 9
Overview
Introduction
The Airports Commission’s terms of reference state that the Commission “will examine the scale and
timing of any requirement for additional capacity to maintain the UK’s position as Europe’s most
important aviation hub, and it will identify and evaluate how any need for additional capacity should be
met in the short, medium and long term.”
These objectives align with the Government’s 2013 Aviation Policy Framework objectives “to ensure
that the UK’s air links continue to make it one of the best connected countries in the world. This
includes increasing our links to emerging markets so that the UK can compete successfully for
economic growth opportunities”.
Our analysis of London airport capacity is consistent with the Commission’s “… by 2030 demand
across the London airport system would be reaching the absolute limit of what could feasibly be
accommodated”. We agree that a runway’s worth of capacity is needed by 2030 at the latest, and
earlier if reliability and resilience for the London systems is to be assured. The Commission points out
that by 2030 “... reliability would no longer be maintained”. A lack of capacity and increasing risk of
system failure would be damaging to the UK economy and diminish London’s status as the leading
global city.
For London and the UK, the location of runway capacity is not just a question of which individual
airport to expand. The answer needs to determine the best and most sustainable overall solution,
balancing economic and social benefits with social and environmental negative effects. This requires
a system approach to substantially enhancing economic growth and socio-economic benefits,
maximising connectivity, promoting effective competition, operational efficiency, value for money,
deliverability, and resilience. Having the flexibility to adapt to future market development scenarios,
whilst also minimising the environmental and socio-environmental impacts of aviation growth, is also
an important consideration.
The Commission’s appraisal framework will examine each of these factors through a wide range of
specific objectives and future market scenarios. In developing Gatwick’s scheme, we have sought to
take a rigorous and market driven approach to optimise each of these aspects in an efficient, coherent
and sustainable solution that is best for the UK, and best for the London airport system.
Expansion of airport capacity must be sustainable. Whilst recognising that there may be trade-offs,
these must be proportionate and socially and politically acceptable, to ensure the deliverability of
expansion proposals. Gatwick is best placed to deliver the requirement for sustainable airport
capacity expansion.
SD1 Strategic Argument – Overview
10 Response to Airports Commission Updated Scheme Design
Gatwick expansion (2+2) versus Heathrow expansion (3+1)
We have analysed the benefits to the London system of a second runway at Gatwick (2+2 or Gatwick
expansion) and a third runway at Heathrow (3+1 or Heathrow expansion).
We believe the 2+2 scheme provides the basis for a future proofed solution with efficient, cost
effective and deliverable capacity serving all current airline types. 2+2 can also adapt to evolving
airline business models as well as generate the most competitive market outcomes. It is the solution
that is capable of delivery soonest, by 2025, providing more traffic, more destinations, more
frequencies and with the highest socio-economic benefit to the UK, at the lowest cost to airlines and
passengers.
This compares to 3+1 which can realistically cater only for the legacy hub and spoke model at
significantly higher costs for airlines and passengers at an airport which already suffers from high
operational inefficiency and high charges. 3+1 has greater negative environmental and social impacts
from concentrating operations in one area. 3+1 also has demonstrably lower levels of operational
efficiency, with lower system resilience and higher concentration risk for London and the UK.
Gatwick expansion delivers the best platform for airline and airport competition, leading to lower air
fares which drive higher traffic growth and more airline and route choice for passengers. Our analysis
clearly indicates that effective airline competition, at competing airports, will best drive air fares
significantly lower, in contrast to adding expensive capacity at an already high cost airport.
2+2 delivers a better experience for passengers in terms of easier airport access, lower fares, more
choice of route / airline and a superior experience both to, from and through the airport.
The above attributes of 2+2 provide the best basis on which to “maintain the UK’s position as
Europe’s most important aviation hub”. It is the best option in terms of connectivity, competitiveness,
sustainability and deliverability.
Short Haul Market Context
The majority of UK trade is with Europe, and this is reflected in passenger share, with UK and Europe
contributing 68% of total London traffic. Short haul European traffic will continue as the major traffic
segment and long haul, particularly to growth markets, will become an increasingly important
component.
Continued growth of low cost short haul capacity is supported by supply side analysis of aircraft
orders with the vast majority of growth (versus replacement) aircraft going to the main UK and
European low cost carriers (LCCs).
London short haul capacity is rapidly becoming saturated with Heathrow effectively full year round
and Gatwick nearing full capacity during the peak summer months, despite successful measures to
increase Gatwick’s capacity in recent years. This means that airlines cannot get the slots necessary
to operate new year round schedules. Whilst there is some residual capacity at the other London
airports, Heathrow’s recent suggestion that the South East has significant point to point capacity for
many years ahead is not correct and Stansted is far less convenient to the overwhelming core of
passenger demand than either Gatwick or Heathrow.
SD1 Strategic Argument – Overview
Response to Airports Commission Updated Scheme Design 11
Market deregulation and the emergence of low cost carriers have radically changed market structure
with low cost carriers having around 45% share of all UK short haul traffic, with further substantial
market share gains inevitable. The economics of the LCC model are based on maximising aircraft
utilisation, simplified processes and the removal of the complexities of operating a co-ordinated
network of services through transfer hubs. This model has proved to be the superior model
throughout the world where aviation services have been liberalised.
These low cost carriers have provided the competitive catalyst for convergence of low cost and full
service short haul models to the benefit of passengers with lower fares and more choice driving
higher traffic volumes. This competitive tension has also driven airlines to lower costs and improve
service levels, facilitated by technology including online check-in, mobile boarding passes etc.
Aviation is similar to other industries with competition as the driving force to innovate and improve.
Long Haul Market Context
Heathrow currently has a relatively low share of transfer passengers (23%) compared to other hubs,
driven by the strength of local demand and London’s status as the World’s leading aviation market.
For long haul, the introduction of cost efficient hub-buster B787 and A350 aircraft will further change
the dynamics for London with less reliance on transfer traffic. Nevertheless, transfer will remain an
important contributor to the economic viability of some routes and will also become a significant factor
at Gatwick with a second runway.
There have been transformational changes in the long haul market as well, with the emergence of the
much lower cost and more efficient 24 hour-a-day Middle East mega hubs, supported by well-
resourced national flag carriers and better located as transfer points for the rapidly growing Asian
markets. Traditional European hubs have focussed on core long haul markets with Heathrow carriers
concentrating particularly on North America. We forecast the strength of London’s connections to
traditional long haul markets will continue.
The forecast increase in demand to London from populous Asian growth markets, including China and
India, will lead to an increase in direct services which do not rely on London as a source of transfer
passengers. These passengers will be fed from the airline networks at the other end of the route.
London will not need a larger hub airport to serve these markets.
Our long haul forecasts are again supported by supply side analysis of aircraft orders with the vast
majority of growth (versus replacement) aircraft going to well-resourced non-European carriers. This
evidence supports our forecasts that foreign carriers will provide a very significant proportion of new
long haul growth market passengers to London. Two-thirds of all Airbus and Boeing outstanding wide
body orders are for hub-buster aircraft. This will enable carriers to focus on the more lucrative point to
point passengers without extensive support from transfer traffic. The Gulf mega hubs and Istanbul will
continue to capture market share from Europe for many of the largest and fastest growing transfer
markets. Consequently, demand for transfer traffic at London is forecast to rise by just 4 million
passengers per annum (mppa) by 2050. A London airport expansion strategy that is based on transfer
traffic would be deeply flawed.
SD1 Strategic Argument – Overview
12 Response to Airports Commission Updated Scheme Design
Strategic Features of Gatwick’s 2+2 Solution
Passenger Forecasts
ICF SH&E forecasts that the unconstrained passenger demand for the London Airport System will
reach 243 million passengers per year by 2050. By 2030, unconstrained traffic is forecast to reach
197mppa, significantly in excess of existing airport capacity. Therefore, new capacity is needed and
needed earlier than the Commission’s objective, stated in its Interim Report, of 2030.
Gatwick can deliver a second runway by 2025 which will provide for 260,000 additional movements
and 95m annual passengers by 2050. This is slightly higher than previous forecasts reflecting an
updated view of market conditions and continued improvements in operational efficiency.
Between 2025 and 2050, 2+2 will result in an average additional 6.5m passengers per year versus
3+1 with the gap rising to 10m by 2050. Over 25 years, this gives a cumulative total of circa 170m
additional passengers for London with the associated economic benefits. These additional
passengers are delivered with much lower airport charges for airlines. The 2+2 aggregate airport
charges would be (on average) circa £1.6bn per year lower than the equivalent 3+1 figure. Over the
25 years between 2025 and 2050, this is a cumulative total of circa £40bn (2013/14 constant prices).
Demand will continue to be dispersed across the UK and the different areas of the South East. Airport
capacity should reflect the dispersed nature of demand, and should not be concentrated in one
location.
The London airport system with 2+2 will deliver more passengers than 3+1. The 2+2 option delivers
more capacity and the right type of capacity. It also delivers this earlier, with greater certainty and at
lower cost for airlines. The competitive environment created by 2+2 will lead to more airline
competition on existing and new routes driving lower air fares and more choice for passengers.
As new runway capacity at Gatwick would be suitable for all types of airlines, the Gatwick solution is
more future proof, and sufficiently robust and flexible to support the full range of plausible outcomes.
Delivery
The UK cannot afford to choose a scheme where there is a significant risk to delivery. The Gatwick
scheme addresses this as it is a relatively straightforward construction project. The phased approach
to delivering the Master Plan will align investment with passenger demand, and ensure scheme costs
are kept low.
The 2+2 solution can be delivered earlier than 3+1. We have a high degree of confidence that we
could open the new runway by 2025 provided the political and planning processes can be completed
by 2020.
Realistically, a third runway at Heathrow is unlikely to open before 2030 at the earliest. This is due to
the complexity of adding infrastructure to an already constrained and dispersed airport site, including
major construction over the M25 and other major roads such as the A4 and A3044.
Between 2025 and 2030 – when existing runways at all London airports will essentially be full – only
the Gatwick option will be able to provide the UK with much needed additional capacity. As a result,
the economic benefits of new runway capacity will be delivered much earlier.
SD1 Strategic Argument – Overview
Response to Airports Commission Updated Scheme Design 13
The Gatwick Runway 2 Project is straightforward by comparison to the Heathrow options since it:
Necessitates only minor land acquisition outside the existing safeguarded areas with the majority
of land in agricultural or light industrial use;
Relies upon tried and trusted technical designs and engineering solutions;
Makes limited physical changes to the local natural and built environment;
Has no major interface challenges with road, rail or utility networks;
Can be built largely in landside areas, independent of current airside operations.
This results in a relatively lower cost expansion of UK runway capacity, a programme with inherently
lower risk and cost estimates with a higher degree of confidence than the complex infrastructure
required for Heathrow R3.
Costs
The delivery cost (at 2014 prices) of the Gatwick scheme is £7.8bn compared to £17bn for Heathrow,
meaning lower costs for airlines and passengers and lower costs to the taxpayer (Heathrow’s 2013
submission indicated a requirement for approximately £4-6 billion of Government subsidies with
attendant risks). The Gatwick programme is modular and flexible in design, allowing the phasing of
delivery to match closely evolving demand, and design specification to meet the evolving demands of
airline models.
Charges
A consequence of lower construction costs and phasing at Gatwick is that airport charges will be
significantly lower under Gatwick expansion as compared with Heathrow. Our business plan
assumptions result in charges increasing by up to £3-6 per passenger in the long term from around £9
today to £12-15. Even with a new runway, Gatwick charges would still be significantly lower than the
£22 per passenger currently charged by Heathrow with two runways. Heathrow’s required increase in
airport charges is estimated to result in charges per passenger rising to circa £35. This would result in
prices being more than double those of the most expensive major European airports, leading to lost
traffic. This would be further exacerbated by Heathrow’s new proposals for a congestion charge.
Financing Strategy
The initial part of the programme, which includes the opening of the new runway by 2025, requires a
£2.1bn investment (out of a total of £7.8bn). This ensures the key aviation demand is met at the
earliest opportunity, whilst reducing the financing pressures and moderating charges paid by airport
users.
Subsequent expansion phases of the programme then follow in line with aviation demand. This
economically rational approach ensures the interests of users, bond holders and equity investors are
all aligned.
Gatwick’s analysis indicates that the £7.8bn capital cost of a second runway would be financed
through ca. debt and ca. equity, comprised of retained and reinvested surplus cash
flows and new equity injections. The debt markets and shareholders can provide this without any
additional Government support, subject to the establishment of a sound regulatory solution.
SD1 Strategic Argument – Overview
14 Response to Airports Commission Updated Scheme Design
Capacity
A new runway at Gatwick will provide a capacity in 2050 equivalent to around 95mppa. Peak hour
capacity will increase from 55 to 98 ATMs with two runways. This translates to an additional 260,000
ATMs per year. We view this as conservative based on our track record of optimising our current
runway and airfield systems.
Our efficient airfield design is a simple but flexible arrangement of taxiways and taxi lanes serving the
runways and aprons. The innovative design concentrates usage of the aprons close to the runways
resulting in short taxi times and uncongested flows.
The new Terminal will be a state of the art facility built in phases up to 50mppa. Each terminal will
accommodate a mix of airline and passenger markets (short haul, long haul, domestic, low cost and
full service). All terminals will be connected to a landside shuttle, providing rapid access and a
maximum 2½ minute journey time to the Gatwick Gateway for rail, coach, car rental and bus
services. The proximity of our three terminals to each other, with the excellent landside and airside
connections, results in a high level of operational efficiency.
This proposal will deliver more capacity than Heathrow’s 3+1 proposal, with greater certainty that it
will be implemented. An additional 260,000 runway movements can be provided at Gatwick by 2025,
versus our estimate of a maximum of 190,000 movements for 3+1 from 2030, which we believe (for a
variety of environmental, airfield complexity and airspace reasons) - is a realistic assessment of
incremental ATMs at Heathrow.
Connectivity
Gatwick expansion delivers more passengers, more frequencies to more destinations and facilitates
effective airline and airport competition which in turn acts as a catalyst for lower air fares and drives
more demand than 3+1. This is good for all categories of passenger: leisure, visiting friends and
relatives and business and benefits the UK.
The key to connectivity is a solution which accommodates the greatest origin and destination traffic as
this has real value to the economy. Transfer traffic can only be justified as a means to the end of
improving connectivity for origin and destination traffic and has negligible intrinsic value to the UK.
Gatwick expansion is a better solution than Heathrow expansion because it provides the right type of
capacity for the growth airlines which value high operational efficiency and low airport charges.
Growth will be driven by short and medium haul LCC, and long haul inbound point to point growth
airlines, whether full service carries such as Emirates or low cost airlines like Norwegian or AirAsia X.
Gatwick expansion performs better than Heathrow expansion under all plausible future aviation
market development scenarios. The Commission’s Interim Report suggested that “Scenarios A and B
point towards hub capacity”. Our analysis indicates that Scenario C is the most likely outcome. This is
based on detailed analysis of market trends and supply side factors, with low cost carriers operating
larger aircraft, and very large aircraft being replaced by smaller, more efficient aircraft which is
consistent with our forecasts.
The 2+2 solution is clearly better suited than 3+1 to Scenarios B, C and D. Even for Scenario A, the
Gatwick infrastructure solution could support a significant airline hub operation either with an alliance
carrier or through the Gatwick Connect product. In this scenario the two airports would together offer
a lower cost and more competitive option for the transfer passenger market than a high cost
Heathrow solution.
The strength of the 2+2 solution for London is based on the facts that:
SD1 Strategic Argument – Overview
Response to Airports Commission Updated Scheme Design 15
Gatwick already demonstrably meets the operational and cost requirements of all airline business
models;
Incremental runway capacity under 2+2 will be affordable to all types of airline, and will not risk
choking off price sensitive demand, particularly short haul passengers;
Airline concentration risks will be reduced under 2+2, it is less vulnerable to exit, downsizing or
change of strategy of individual airlines or alliances;
A dispersed system approach is inherently more robust than a concentrated approach – this is
true for airports as it is for most industries;
By supporting all airline types, 2+2 lowers barriers for new entrants rather than reinforcing the
status quo. This will help the UK aviation industry to respond quickly to structural changes and
allow it to continue to lead in aviation market innovation, thereby preserving the UK’s position as
Europe’s most important aviation hub;
2+2 is likely to free up some capacity at Heathrow allowing it to perform better and more
competitiively as a hub, particularly to long haul markets requiring transfer passenger feed;
2+2 promotes balanced economic growth and socio-economic benefits from employment, local
investment and improved surface access provision across different regions, rather than
concentrating economic growth in one area and risking overheating;
2+2 spreads the environmental and social negative impacts of enhanced runway capacity across
different regions, enabling these areas to better protect their own natural environment and quality
of life of local communities through effective mitigation strategies.
Under 2+2, many more passengers will fly from their local London airport (versus the concentrated
3+1 option) as many more routes will be available from both Gatwick and Heathrow. Average journey
times to the airport will therefore be significantly lower, 61 minutes at Gatwick compared with 70
minutes at Heathrow.
Gatwick has already delivered more new destinations (in total, and to emerging markets specifically)
than Heathrow in the last ten years. 2+2 will deliver the same number of long haul and domestic
destinations as 3+1 while serving more international short haul destinations. 2+2 provides more flights
and passengers overall and will deliver more choice and much lower air fares across the London
airport system.
London is the best connected city in the world. London itself is the hub, not individual airports. The
role of Heathrow should not be overstated. Heathrow serves 173 of the 384 cities flown from London.
The other London airports operate to 308 cities, with Gatwick on its own serving 214. London is
similar to other leading world cities in operating a multiple airport system rather than a mega
transfer hub.
Regional Connectivity
Regional connectivity has been transformed by government policies of market liberalisation. There
are more direct flights from UK regional airports to more destinations than ever before. UK regional
access to transfer hubs has also improved greatly. Regional passengers now have a much greater
choice of airlines and hub airports for markets that are not served direct. These trends are positive for
the regions’ business development and alleviate the need for transfer and long haul direct services at
London’s airports.

SD1 Strategic Argument – Overview
16 Response to Airports Commission Updated Scheme Design
The 2+2 solution will enhance connectivity from the regions. Gatwick already serves more domestic
destinations than Heathrow. Heathrow will continue to play an important role in connecting regional
passengers to the world. However, 2+2 would give regional passengers a genuine choice of two
transfer points in London and Gatwick would put in place mechanisms that will enhance regional
connectivity further, including.
Incentives for additional and start-up regional services;
Competitive charging structures for regional services;
Marketing support to airlines and joint marketing with regional airports where possible;
Further radical development of the Gatwick Connect product to facilitate regional transfers:
Strong support for Government action to introduce Public Service Obligation (PSO) routes to
maintain and enhance regional connectivity.
Connecting through an expanded Gatwick will involve much lower airport charges (at least £20 per
passenger lower in 2014 prices) and it should be noted that the regions are benefitting from new and
better options for connecting to long haul destinations through alternative fast growing hubs.
Pro-competition
A major feature in our analysis is the competitive benefit for the UK economy through effective choice
of competing carriers with 2+2 serving all airline types and models. Aviation market competition has
dramatically increased in recent years driven by market liberalisation, the emergence of LCCs to
compete with Full Service Carriers (FSCs), new aircraft technology and innovation. Aviation is similar
to other industries with competition between airlines and airports driving efficiency leading to lower
fares, better service and innovation. Airline costs continue to reduce as a result of competition and
convergence of short haul operating models, and the same features will become increasingly
apparent in the long haul market.
Gatwick expansion will generate substantial additional competition and this will intensify over time as
more routes are contested between London’s two main airports by the most competitive airline
business models. In contrast, Heathrow expansion would increase its already significant market
power and lead to relatively high air fares, less innovation and less choice.
The reduced competition and high costs of 3+1 would inevitably see London reduced to more of a
niche role, serving a narrower range of airlines, passengers and destinations.
Oxera has estimated:
A direct competition benefit from expanding Gatwick relative to Heathrow of between £10bn and
£14bn in NPV terms as a result of the reductions in fares resulting from greater intensity of
competition between airlines;
An indirect competition effect, as a result of the greater intensity of competition from Gatwick
versus Heathrow expansion, which could be as much as the direct effect, an additional £10bn-
£14bn in NPV terms.
SD1 Strategic Argument – Overview
Response to Airports Commission Updated Scheme Design 17
The relatively recent break up of BAA, following the intervention of the Competition Commission, has
resulted in increasing competition benefits in both the London and Scottish marketplaces. It is critical
that the positive aspects of competition on price, service, efficiency and innovation are maintained
and that we do not fall back to the negative impacts which were seen while the airports were under
common ownership with little or no competition and poor service levels.
Improved Passenger and User Experience
Innovation
Competition in the market is driving innovation and to remain competitive airports need to be in a
position both to drive these changes and to respond proactively to them. Gatwick has a strong record
of leading the industry in innovation and technology.
Service quality levels are at a record high, Gatwick’s relative ASQ ranking has never been better.
Examples of innovations that deliver improvements in the passenger experience include Gatwick’s
best in class security product (consistently high throughput and high SQR performance levels)
and unique PRM service offerings.
The increasing pace of innovation in the airline market requires a clear understanding and
dynamic approach to customer needs. Gatwick is at the forefront of delivering highly relevant and
timely solutions to some of the world’s fastest growing airlines. Through Gatwick Connect, airlines
and passengers can now benefit from a previously unfulfilled market for self-connecting traffic.
Making use of existing capacity and capital is critical. Gatwick’s runway program – ACDM55 –
delivers more peak capacity than ever before.
Gatwick has a range of further innovations in the pipeline.
Passengers
Expanding Gatwick will deliver a number of major benefits for passengers with more flights from their
local London airport versus concentrating more flights at Heathrow. Better and more flexible airport
infrastructure at a 2 runway Gatwick allows rapid movement of passengers (maximum of 7 minutes)
to / from the Long Stay Car Park to all terminals versus up to 25 minutes at Heathrow.
The transfer product at Gatwick will be superior for connecting passengers, with a maximum 45
minute transfer time compared with up to 115 minutes at Heathrow. Gatwick Connect will facilitate the
transfer product for connections between airlines, enabled by technology that removes reliance on
airlines to provide the transfer product. This is a first for the UK and a clear example of airport
innovation to improve the passenger experience. This product is scheduled for further phased
development over the next three years.
Freight
Gatwick can provide the land, the infrastructure and the excellent surface access networks needed to
promote the expansion of freight operations at a price that will foster real competition and growth.
This will contrast with the position at Heathrow where there are high costs, poor efficiency and where
there is already a shortage of space resulting in freight forward agencies being scattered around
the area.
Gatwick would also progress the development of warehouse and logistics facilities on and around the
airport. The immediate vicinity of the airport is much less space-constrained than Heathrow and much
less congested.
SD1 Strategic Argument – Overview
18 Response to Airports Commission Updated Scheme Design
Economic Benefits
Gatwick expansion provides much greater economic benefits than Heathrow expansion. Oxera has
undertaken independent analysis to quantify these benefits. The result of this work is that Gatwick
delivers £40bn more benefit to the UK economy than Heathrow. The present value (PV) of Gatwick
R2 is £52bn excluding wider economic impacts (WEIs), and £79bn including WEIs, providing a total
benefit–cost ratio (BCR) of 4.9 (excluding WEIs). The PV of the Heathrow scheme is £29bn excluding
WEIs, and £51bn including WEIs, providing a BCR of 1.5 (excluding WEIs).
This analysis underpins Gatwick expansion as the preferred option for providing the additional runway
capacity required to meet the UK’s need for additional aviation connectivity, by providing a solution
that would have lower costs, superior economic benefits and lower environmental costs than the
alternative of an additional runway at Heathrow.
Further Gatwick expansion is expected to contribute a net positive £15bn to the public sector purse,
compared to £11bn for 3+1.
At the local level, expansion at Gatwick will create an extra 22,000 airport related jobs by 2050,
equivalent to a contribution of £1.73 billion per year to the local economy. These additional jobs are
expected to result in up to an extra 9,300 households.
2+2 is expected to attract new business to the Gatwick Diamond and Coast to Capital LEP areas,
generating clusters of air-travel intensive and high productivity businesses with associated socio-
economic and quality of life benefits from employment generation.
Overally, 2+2 offers the potential to create an extra 100,000 jobs in London and the greater South
East region (54,000 in London and 46,000 in the rest of the South East).
All of these local and regional jobs will make a significant contribution to the regeneration of key areas
of focus, particularly Croydon and the South coast.
Surface Access Provision
Outstanding surface access provision is a key feature of our scheme. We are already at class leading
levels for a major airport with almost 45% of our passengers using public transport compared with
Heathrow at 41%. Looking forward with the Gatwick expansion, Gatwick will:
Achieve the highest use of sustainable modes of transport: it will achieve a 60% public transport
mode share for customers (46m by 2050) and a 50% sustainable mode share for staff;
Accommodate the needs of other transport users: in 2040 and 2050 there will be enough road and
rail capacity to serve the airport, background users and the economic growth generated. Both
Network Rail and the Highways Agency support this analysis;
Provide access from the widest catchment area: 3.2m people live within 30 minutes, 10.8m within
45 minutes and 14.8m people within 60 minutes – better than any other UK airport.
Our transport strategy builds on Gatwick’s success to date, and will be achieved by:
The already planned and committed rail schemes delivering a near tripling of the capacity of the
rail system between 2012 and 2030 by the near doubling of the frequency of trains, and
lengthening trains up to 12 cars. Today only 4% of rail capacity is used by air travellers on the
busiest sections of the railway in the peak hours. This will rise to just 5-6% in 2035;
SD1 Strategic Argument – Overview
Response to Airports Commission Updated Scheme Design 19
Better quality public transport: new trains, longer trains, better stations and a new regional
transport hub – the Gatwick Gateway;
Doubling the capacity of key road junctions to access the airport;
Increasing the number of new bus and coach services serving more destinations and more
frequently;
Delivering seamless interchange between the airport and surface access;
Reconnecting local communities and improving their transport.
Sustainable
Sustainable development is enshrined in UK planning, economic and transport policy. Government
and the aviation industry recognise the strategic need to promote capacity development that
minimises negative environmental and social impact, whilst actively exploring opportunities to
enhance sustainability performance.
Gatwick currently demonstrates industry leading sustainability performance with, compared to
Heathrow, significantly less impact on the environment and quality of life of local communities. This is
coupled with strong enhancement measures to increase benefits to socio-economic development,
environmental protection and quality of life. This will be continued under expanded operations which
offer London and the UK, the opportunity to expand capacity, enhance connectivity and achieve
sustainable local and wider socio-economic growth without requiring trade-offs in respect of seriously
detrimental local social and environmental impact. Unlike Heathrow, the second runway can readily
be accommodated within the physical, environmental and social footprint of our location.
Gatwick’s commitment to sustainable development through existing and future governance, especially
the LGW R2 Sustainability Strategy, demonstrates our strategic focus on enhancing sustainability.
Flexibility within our scheme design, and ability to cater for all carrier types, will enable capacity to be
provided in line with market demand leading to a sustainable business case
The second runway at Gatwick will support spatial and socio-economic strategy objectives through
promoting sustainable growth, development and connectivity; increasing the potential for export
driven economic growth; promoting regional growth (through job creation and aiding regeneration);
maintaining connectivity to the regions; supporting London to continue to be internationally
competitive; and helping to rebalance economic growth around London rather than overheating the
M4 corridor.
Environmental Benefits of 2+2
Gatwick’s location means that the airport already has a relatively small noise impact on local
residents, with a small fraction of the number of people impacted around Heathrow. Based on
preliminary information, expansion at Heathrow could result in approximately 190,000 people being
affected by noise, while expansion at Gatwick would affect approximately 14,000.
We are confident that we can continue to improve our noise performance with 2+2 through:

SD1 Strategic Argument – Overview
20 Response to Airports Commission Updated Scheme Design
Provision of noise bunds, walls and landscaping; the most generous and extensive noise
insulation scheme in Europe;
Expansion will largely take place within the established safeguarded zone - actual and perceived
impacts are therefore less than 3+1.
The compact nature of the new terminal, runway, taxiways and other aspects of the airfield layout
brings inherent benefits in terms of:
Operational efficiency, shorter passenger transfer times, and reduced noise, carbon and land-take
impacts;
Loss of many fewer residential and community buildings.
We recognise, however, that more flights will mean some more noise nuisance for local residents
whatever mitigation measures are put in place. We have therefore committed to:
An annual £1,000, indexed at CPI, Council Tax contribution for affected residents within 57 Leq
contour.
Resilience and Risk Benefits
From a resilience and risk perspective, 2+2 is inherently more resilient for the London system than a
less balanced 3+1. Clearly, temporary closure or disruption of one of two 2 runway airports would
have less effect than closure of or disruption at a single 3 runway airport.
Gatwick’s compact 3 terminal configuration with rapid landside and airside connections will allow
easier coordination of operations than a more fragmented arrangement at Heathrow. High
capacity and frequent rail services allow for quick dispersal of passenger build up if necessary.
Gatwick expansion allows airport resilience and systems redundancy to be further enhanced
beyond Gatwick’s currently planned improvements.
Conclusion
Across all these measures Gatwick is the better solution and the only one which will maintain the UK’s
status as Europe’s most important aviation hub in the long term.
SD1 Strategic Argument – 1.Structure of the Strategic Argument
Response to Airports Commission Updated Scheme Design 21
1. Structure of the Strategic Argument
This paper seeks to address the requirement in the Airports Commission’s terms of reference “for
additional capacity to maintain the UK’s position as Europe’s most important aviation hub” and to
“make recommendations for ensuring that the need is met as expeditiously as practicable within the
required timescales”.
The Commission’s revised Appraisal Framework, issued in April 2014, included details of the Strategic
Argument requirements:
“Why a scheme is well-placed to address the UK’s future aviation capacity and connectivity needs,
and how it may support the socio-economic development of local areas, regions and the UK as
a whole.”
This paper covers, in the order set out below, the following elements of the Strategic Argument as
required by the Appraisal Framework.
Section 2: Strategic Fit
To provide additional capacity that facilitates connectivity in line with the assessment of need;
To improve the experience of passengers and other users of aviation;
To maximise the benefits of competition to aviation users and the broader economy;
To maximise benefits in line with relevant long term strategies for economic and spatial
development.
Section 3: Economy Impacts
To maximise economic benefits and support the competitiveness of the UK economy.
Section 4: Local Economy Impacts
To promote employment and economic growth in the local area and surrounding region;
To produce positive outcomes for local communities and the local economy from any surface
access that may be required to support the proposal.
Section 5: Surface Access
To maximise number of passengers and workforce accessing the airport via sustainable modes of
transport;
To accommodate needs of other users of transport networks, such as commuters, intercity
travellers and freight;
To enable access to the airport from a wide catchment area and attract the highest possible public
transport mode share.
SD1 Strategic Argument – 1.Structure of the Strategic Argument
22 Response to Airports Commission Updated Scheme Design
The following areas are dealt with more fully in other parts of the response but are also discussed
where relevant in this paper.
Cost
To make efficient use of public funds, where they are required, and ensure that the benefits of
schemes clearly outweigh the costs, taking account of social, environmental and economic costs
and benefits.
Delivery
To be affordable and financeable, including any public expenditure that may be required and
taking account of the needs of airport users;
To have the equivalent overall capacity of one new runway operational by 2030.
Operational Viability
To enhance individual airport and airports system resilience;
To ensure individual airport and airports system efficiency;
To build flexibility into scheme designs.

SD1 Strategic Argument – 2.Strategic Fit
Response to Airports Commission Updated Scheme Design 23
2. Strategic Fit
In this section we will address the following objectives from the Appraisal Framework:
“To provide additional capacity that facilitates connectivity in line with the assessment of need”;
“To improve the experience of passengers and other users of aviation”;
“To maximise the benefits of competition to aviation users and the broader economy”;
“To maximise benefits in line with relevant long term strategies for economic and spatial
development”.
Before turning specifically to the first of these objectives, we believe that it is important to set the
debate in the context of developments which we are seeing in the airline industry and our assessment
of the need for capacity in the London market, which we cover in the following two sections.
2.1 Aviation Industry Developments
Context
The aviation industry is constantly evolving. The pace of change is not uniform – periods of relative
stability often precede major structural changes. Given the UK’s status as an island trading nation,
global aviation developments will strongly influence the future size and shape of our own aviation
sector.
The Airports Commission has highlighted that schemes to meet the UK’s long term airport capacity
requirements must perform well under a range of possible future aviation scenarios. This is clearly
sensible as the future cannot be forecast with great certainty.
However, we believe the direction of travel is clear. The changes the industry is currently experiencing
are likely to deepen rather than reverse, and while the exact form of the future aviation sector may not
be known, we can predict the broad parameters of future development with some confidence.
Accordingly, we do not believe that all potential outcomes should be considered equally likely. The
selected solution needs to be robust to all plausible outcomes but, in particular, should perform well
for the most likely scenarios.
In this section of the Strategic Argument, we highlight some key aviation trends and discuss their
implications for the future of the aviation sector.

SD1 Strategic Argument – 2. Strategic Fit
24 Response to Airports Commission Updated Scheme Design
Hub and Spoke Model
Key findings: The predominant mode of air travel in the UK is on direct flights, with circa 87% of
passengers travelling on this basis. The importance of the transfer traffic segment in the UK is low
and will continue to diminish over time. Competition from much lower cost and more efficient
alternatives (eg Middle East hubs) is set to intensify dramatically over the next decades. This coupled
with the impact of long haul hub-busting aircraft which account for the overwhelming majority of new
wide body orders will accelerate this trend. A London airport expansion strategy that is based on
transfer traffic would be deeply flawed.
Passengers travel to destinations either on a point to point basis (direct flights) or transfer between
flights at an intermediate airport. In general, passengers prefer to fly direct if this option is available.
However, for smaller markets, this may not be possible. Passengers may also choose to transfer
flights even where a direct service is available – for reasons of price, or to have a better choice of
flight times. Likewise, carriers will increase or decrease the numbers of transfer passengers carried
depending on the underlying demand for origin and destination (O&D) passengers which is, to some
extent, linked to the economic cycle. The key point is that transfer passenger volumes tend to be
variable in nature.
The predominant mode of air travel in the UK is on direct flights, with circa 87% of all passenger
itineraries to, from and within the UK being undertaken on this basis1. We believe that Heathrow and
other European transfer airports will continue to play a role in serving future transfer traffic demand,
but the importance of this traffic segment in the UK will continue to diminish over time.
Transfer passengers typically pay much lower fares than point to point passengers, and add
complexity and cost to airline operations. However, on thinner markets with smaller volumes of direct
passengers, the hub and spoke model aggregates demand from a range of indirect markets and can
make these routes viable.
Heathrow has traditionally targeted transfer passengers to support a larger network than would
otherwise be the case. The transfer market is price and time sensitive and competitive compared with
point to point traffic. Competition in the transfer market has already led to market share loss at
Heathrow. Competition from much lower cost and more efficient alternatives is set to intensify
dramatically over the next decades. This coupled with the equally dramatic expected impact of long
haul hub-busting aircraft will accelerate these trends. Expanding Heathrow would accelerate its
decline as a transfer option as it would further drive up its costs and reduce its competitiveness. A
London airport expansion strategy that is based on transfer traffic would be deeply flawed.
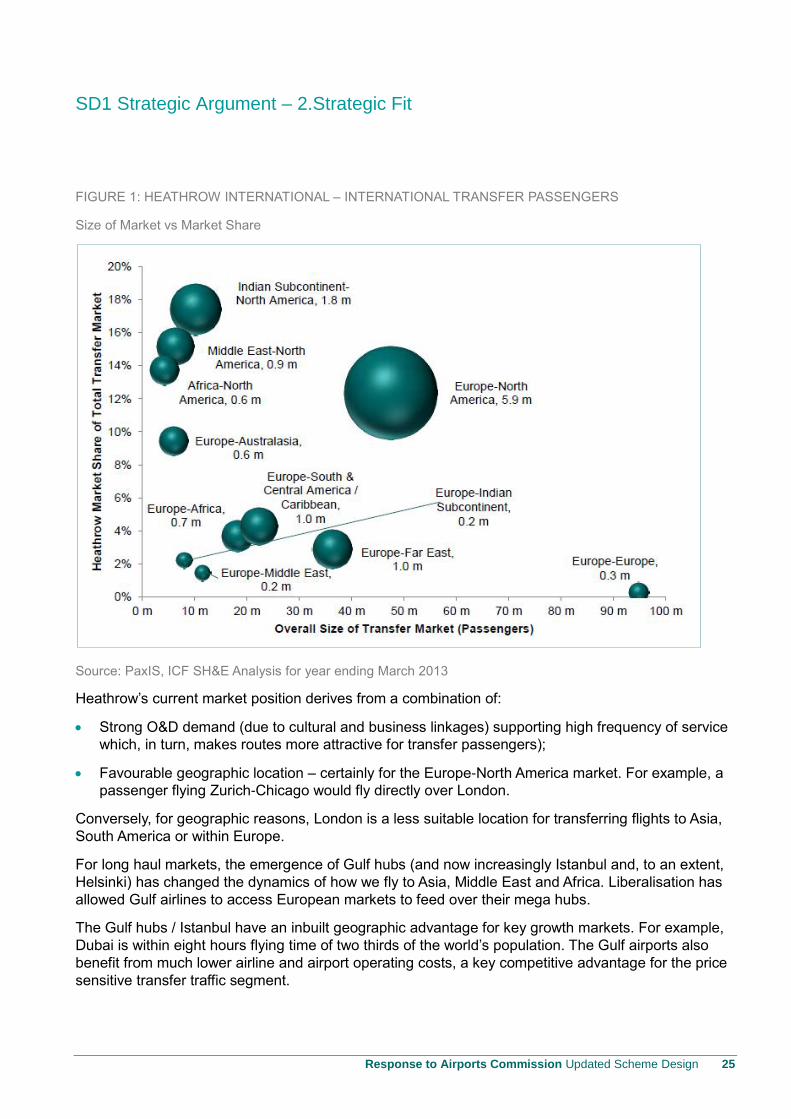
In 2013, circa 14% of London airport traffic was transfer, a similar share to the total UK market. This
traffic was concentrated on the oneworld alliance at Heathrow, and in particular linking Europe/Indian
sub-continent to North America. Heathrow has a 12% share of the huge Europe-North America
transfer market, and an even higher share, 17%, of the Indian sub-continent-North America market.
Heathrow also has a significant share of the Middle East to North America transfer market. The
respective Heathrow market share and overall size of the transfer markets are illustrated in the figure
below.
1 Based on ICF SH&E analysis of PaxIS data for 2013. 13% of passenger journeys starting or ending in the UK involved a
transfer at an intermediate point (either at a UK airport or an overseas airport).
SD1 Strategic Argument – 2.Strategic Fit
Response to Airports Commission Updated Scheme Design 25
FIGURE 1: HEATHROW INTERNATIONAL – INTERNATIONAL TRANSFER PASSENGERS
Size of Market vs Market Share
Source: PaxIS, ICF SH&E Analysis for year ending March 2013
Heathrow’s current market position derives from a combination of:
Strong O&D demand (due to cultural and business linkages) supporting high frequency of service
which, in turn, makes routes more attractive for transfer passengers);
Favourable geographic location – certainly for the Europe-North America market. For example, a
passenger flying Zurich-Chicago would fly directly over London.
Conversely, for geographic reasons, London is a less suitable location for transferring flights to Asia,
South America or within Europe.
For long haul markets, the emergence of Gulf hubs (and now increasingly Istanbul and, to an extent,
Helsinki) has changed the dynamics of how we fly to Asia, Middle East and Africa. Liberalisation has
allowed Gulf airlines to access European markets to feed over their mega hubs.
The Gulf hubs / Istanbul have an inbuilt geographic advantage for key growth markets. For example,
Dubai is within eight hours flying time of two thirds of the world’s population. The Gulf airports also
benefit from much lower airline and airport operating costs, a key competitive advantage for the price
sensitive transfer traffic segment.
SD1 Strategic Argument – 2. Strategic Fit
26 Response to Airports Commission Updated Scheme Design
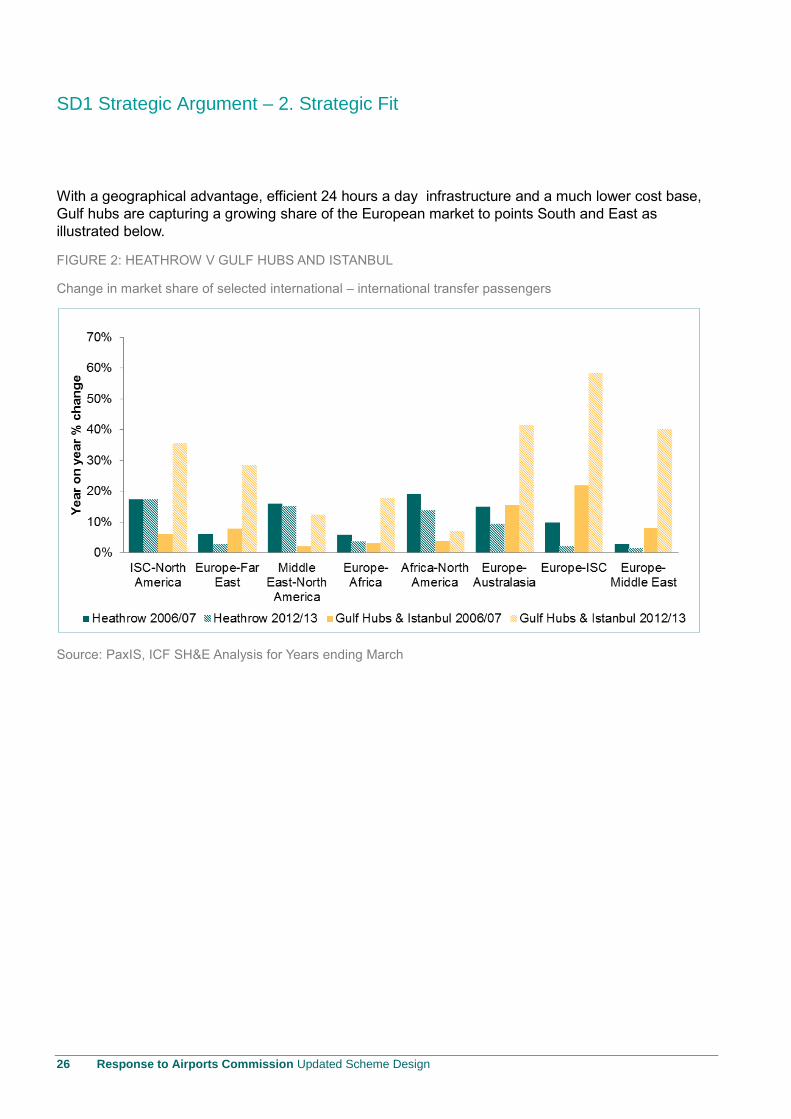
With a geographical advantage, efficient 24 hours a day infrastructure and a much lower cost base,
Gulf hubs are capturing a growing share of the European market to points South and East as
illustrated below.
FIGURE 2: HEATHROW V GULF HUBS AND ISTANBUL
Change in market share of selected international – international transfer passengers
Source: PaxIS, ICF SH&E Analysis for Years ending March

SD1 Strategic Argument – 2.Strategic Fit
Response to Airports Commission Updated Scheme Design 27
Istanbul and the Gulf hubs will continue to capture market share. Ambitious expansion plans are well
advanced. The figure below shows that the 5 major hub airports in the region will have a combined
capacity of 475mppa when all capacity enhancements are delivered.
FIGURE 3: CURRENT PASSENGER VOLUMES AND PLANNED CAPACTIY
Middle East Hubs and Istanbul
Source: Airports Press Announcements, ICF SH&E Analysis
The capacity growth at Gulf/Istanbul hubs is matched by planned fleet growth from the hub carriers
serving these airports. In November 2013, the Middle East/Turkish carriers all made significant orders
(mostly for large wide body aircraft) at the Dubai Air Show2:
Turkish Airlines has 269 aircraft on order and expect to double its seat capacity by 2020.
Emirates has 385 aircraft on order, and expect to be operating a fleet of 400 by 2020.
Qatar Airways has 239 aircraft on order, and is likely to be operating a fleet of around 300
by 2020.
Etihad Airways has 230 aircraft on order and is likely to operate more than 300 aircraft by 2020.
2 Analysis and research by ICF SH&E
SD1 Strategic Argument – 2. Strategic Fit
28 Response to Airports Commission Updated Scheme Design
Market Liberalisation
Key findings: Market deregulation and the emergence of low cost carriers have radically changed
market structure with low cost carriers having around 45% share of all UK short haul traffic and further
substantial market share gains inevitable. The economics of the LCC model are based on maximising
aircraft utilisation, simplified processes and the removal of the complexities of operating a co-
ordinated network of services through transfer hubs. This model has proved to be the superior model
throughout the world where aviation services have been liberalised. The efficiency benefits of the LCC
model outweigh the transfer benefits of the traditional model in the short/medium haul aviation
markets.
The introduction in the 1990s of the single aviation market within Europe has liberalised
intra-EU flying:
“Air transport had been traditionally a highly regulated industry, dominated by national flag carriers and state-owned airports. The internal market has removed all commercial restrictions for airlines flying within the EU, such as restrictions on the routes, the number of flights or the setting of fares. All EU airlines may operate air services on any route within the EU.
Prices have fallen dramatically, in particular on the most popular routes. But it is especially in terms of choice of routes that progress is impressive. European policy has profoundly transformed the air transport industry by creating the conditions for competitiveness and ensuring both quality of service and the highest level of safety. Consumers, airlines, airports and employees have all benefited as this policy has led to more activity, new routes and airports, greater choice, low prices and an increased overall quality of service.”
Source: European Commission website
Restrictions have also been relaxed or removed in some long haul markets – for example, the EU-US
Open Skies implemented in 2008. This has led to more competition, lower fares and improved
service.
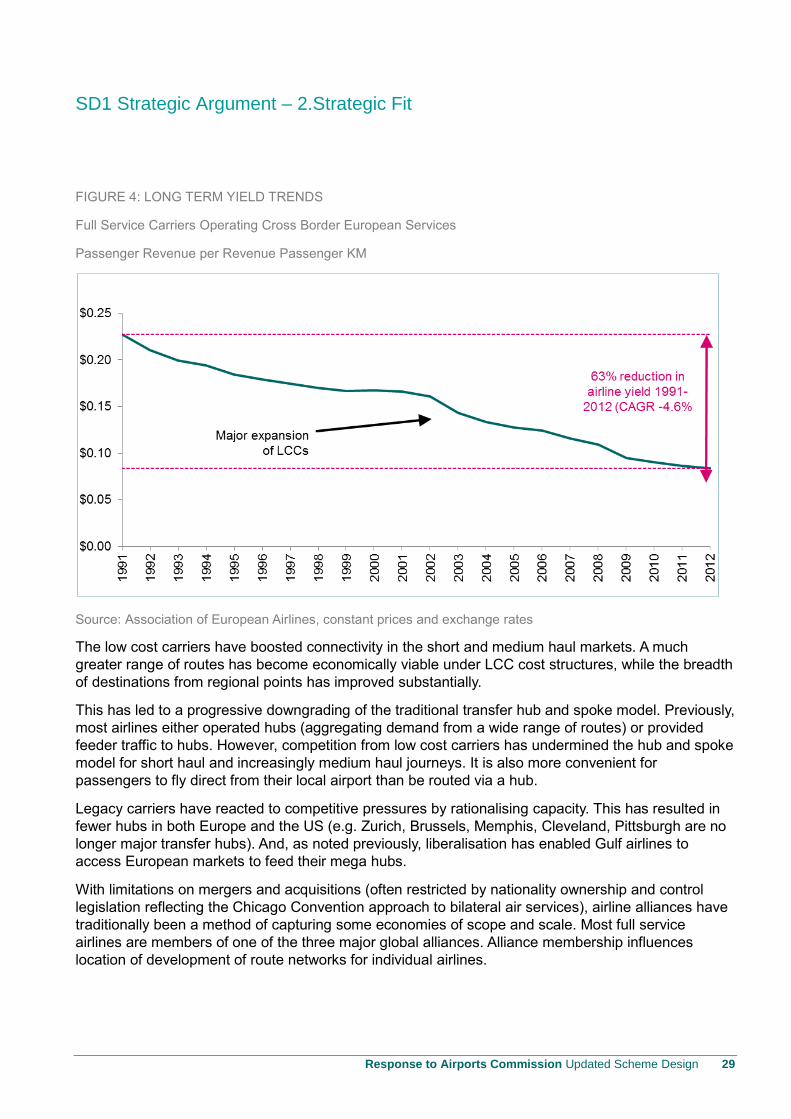
Market liberalisation has led to structural changes within the aviation industry. The emergence of the
low cost carriers has resulted in strong downward pressure on prices, prompting airlines to seek
greater efficiencies and focus their product offerings on areas which are valued by customers. The
figure below shows the dramatic year on year reductions in intra-European fares of legacy carriers.
IATA / InterVISTAS3 has estimated that full removal of regulatory constraints can result in fare
reductions of 50%.
The economics of the LCC model are based on maximising aircraft utilisation, simplified processes
and the removal of the complexities of operating a co-ordinated network of services through transfer
hubs. This model has proved to be the superior model in the UK, Europe and throughout the world
where aviation services have been liberalised. This is because the efficiency benefits of the LCC
model outweigh the transfer benefits of the traditional model in the short/medium haul aviation
markets.
3 IATA commissioned InterVISTAS-EU Consulting Inc. to undertake the 12 country studies. The aim of the studies was to
investigate two forms of liberalisation: market access (i.e., liberalising air services agreement arrangements) and foreign
ownership and control. One such report was “The Impact of International Air Service Liberalisation on Brazil”, July 2009.
SD1 Strategic Argument – 2.Strategic Fit
Response to Airports Commission Updated Scheme Design 29
FIGURE 4: LONG TERM YIELD TRENDS
Full Service Carriers Operating Cross Border European Services
Passenger Revenue per Revenue Passenger KM
Source: Association of European Airlines, constant prices and exchange rates
The low cost carriers have boosted connectivity in the short and medium haul markets. A much
greater range of routes has become economically viable under LCC cost structures, while the breadth
of destinations from regional points has improved substantially.
This has led to a progressive downgrading of the traditional transfer hub and spoke model. Previously,
most airlines either operated hubs (aggregating demand from a wide range of routes) or provided
feeder traffic to hubs. However, competition from low cost carriers has undermined the hub and spoke
model for short haul and increasingly medium haul journeys. It is also more convenient for
passengers to fly direct from their local airport than be routed via a hub.
Legacy carriers have reacted to competitive pressures by rationalising capacity. This has resulted in
fewer hubs in both Europe and the US (e.g. Zurich, Brussels, Memphis, Cleveland, Pittsburgh are no
longer major transfer hubs). And, as noted previously, liberalisation has enabled Gulf airlines to
access European markets to feed their mega hubs.
With limitations on mergers and acquisitions (often restricted by nationality ownership and control
legislation reflecting the Chicago Convention approach to bilateral air services), airline alliances have
traditionally been a method of capturing some economies of scope and scale. Most full service
airlines are members of one of the three major global alliances. Alliance membership influences
location of development of route networks for individual airlines.
SD1 Strategic Argument – 2. Strategic Fit
30 Response to Airports Commission Updated Scheme Design
However, as the role of hub airports is changing, the nature of airline partnerships is also evolving.
Recent trends are for breadth rather than depth in cooperation. A number of airlines have started to
cooperate on a tactical basis with airlines from a different alliance. While alliances are likely to be a
continuing feature of the airline sector, the alliance groupings are likely to be subject to change.
Aviation is no different from most other industries. The removal of artificial barriers to competition has
resulted in greater efficiencies, innovation and more customer focus, which in turn benefit the
consumer through lower prices and better service.
Innovation and Technology
Key findings: Competition in the market is driving innovation and, to remain competitive, airports
need to be in a position both to drive these changes and to respond proactively to them. Gatwick has
a strong record of leading the industry in innovation and technology.
Competition has been a driver of both airport and airline innovation. Innovation can be in the form of
technological developments. Examples include price comparison websites, online or kiosk check-in,
self-scan security, advanced Customer Relationship Management, baggage tracking, and improved
air traffic control systems (resulting in increases in runway capacity).
Airports are also innovating in other ways. For example, Gatwick has recently launched the first stage
of Gatwick Connect, an airport developed and operated product that facilitates transfers without the
active involvement of airlines. This and other technology based developments led by Gatwick are
discussed in detail later in this document.
Finally, changes in aircraft technology are also resulting in structural changes in the aviation sector.
This is also discussed in a later section of this document.
UK Airline and Airport Market
Key findings: The relatively recent breakup of BAA, following the intervention of the Competition
Commission, has resulted in increasing competition benefits in both the London and Scottish
marketplaces. It is critical that the positive aspects of competition on price, service, efficiency and
innovation are maintained and that we do not fall back to the negative impacts which were seen while
the airports were under common ownership with little or no competition. The products and operating
methods of airlines have been, and will remain, innovative and fluid in responding to market demands.
The solution for airport capacity in the London airport system needs to recognise and allow for this
need for flexibility.
The UK has been at the forefront of change in the European aviation sector. For example, it was an
early adopter of the low cost carrier model and was the first to privatise airports. More recently, the
breakup of BAA, following the intervention of the Competition Commission, has also resulted in
increasing competition benefits in both the London and Scottish marketplaces.
The level of direct route competition between both airlines and airports has been increasing. The
number of routes contested between different airlines has grown; there has been even stronger
growth in the number of routes contested between different airports as shown in the figure below.
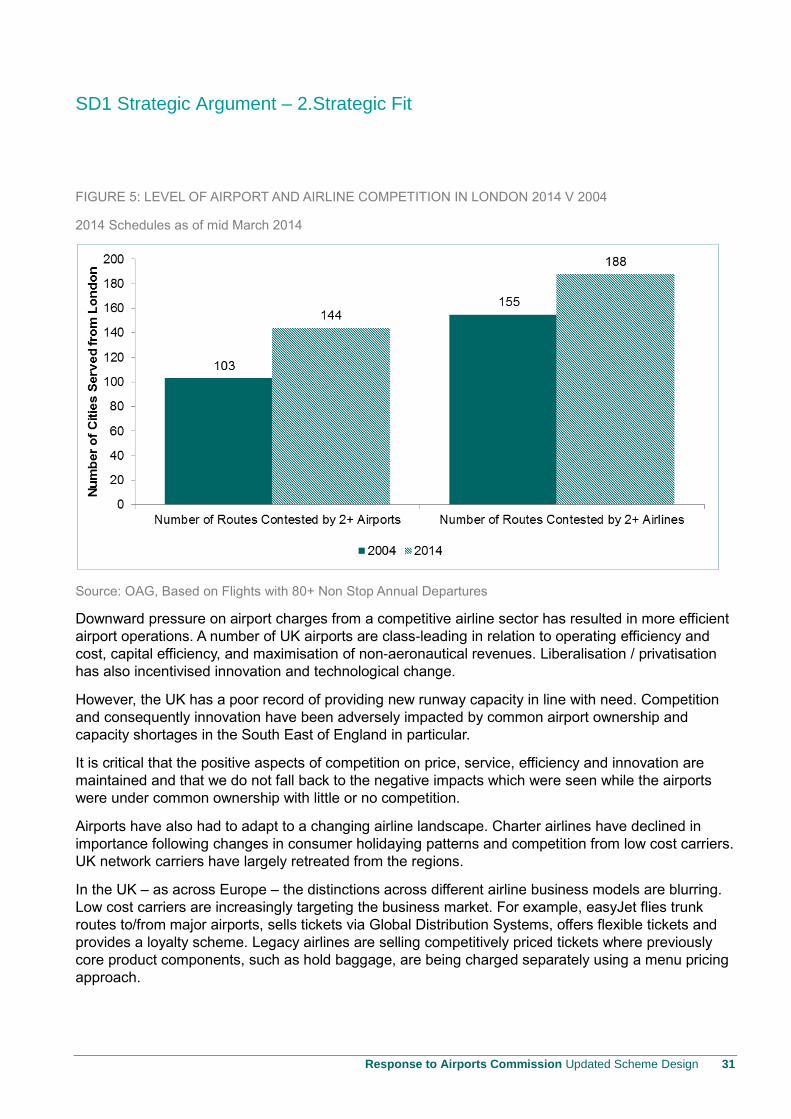
SD1 Strategic Argument – 2.Strategic Fit
Response to Airports Commission Updated Scheme Design 31
FIGURE 5: LEVEL OF AIRPORT AND AIRLINE COMPETITION IN LONDON 2014 V 2004
2014 Schedules as of mid March 2014
Source: OAG, Based on Flights with 80+ Non Stop Annual Departures
Downward pressure on airport charges from a competitive airline sector has resulted in more efficient
airport operations. A number of UK airports are class-leading in relation to operating efficiency and
cost, capital efficiency, and maximisation of non-aeronautical revenues. Liberalisation / privatisation
has also incentivised innovation and technological change.
However, the UK has a poor record of providing new runway capacity in line with need. Competition
and consequently innovation have been adversely impacted by common airport ownership and
capacity shortages in the South East of England in particular.
It is critical that the positive aspects of competition on price, service, efficiency and innovation are
maintained and that we do not fall back to the negative impacts which were seen while the airports
were under common ownership with little or no competition.
Airports have also had to adapt to a changing airline landscape. Charter airlines have declined in
importance following changes in consumer holidaying patterns and competition from low cost carriers.
UK network carriers have largely retreated from the regions.
In the UK – as across Europe – the distinctions across different airline business models are blurring.
Low cost carriers are increasingly targeting the business market. For example, easyJet flies trunk
routes to/from major airports, sells tickets via Global Distribution Systems, offers flexible tickets and
provides a loyalty scheme. Legacy airlines are selling competitively priced tickets where previously
core product components, such as hold baggage, are being charged separately using a menu pricing
approach.
SD1 Strategic Argument – 2. Strategic Fit
32 Response to Airports Commission Updated Scheme Design
Low cost carriers are also providing feed and/or operating services on behalf of full service airlines.
Germanwings operates services for Lufthansa to all German airports except the hubs at Frankfurt and
Munich. Air Berlin feeds traffic to Etihad.
While there is some convergence of business models, there is a general migration in the direction of
the low cost carrier model for short haul flying because it represents the economically most effective
method of supplying capacity to the market. Consumers are increasingly giving priority to price,
convenience and reliability, the core proposition of LCCs.
Full service airlines have struggled to make a return on short haul flying. For strategic reasons (feed
and market share), the main legacy airlines continue to compete in this market, but almost all of the
growth in short haul traffic is being provided by low cost carriers.
Long haul continues to be dominated by legacy airlines. Long haul flights are more regulated than
flights within the single European aviation market and have higher barriers to entry.
Typically, long haul accounts for most of the profits made by legacy carriers. As legacy carrier short
haul networks have contracted under pressure from low cost carriers, growth has often been focussed
on long haul. Charter airlines are also expanding into long haul markets for similar reasons.
Low cost long haul is becoming established in Asia through the likes of Air Asia X, Jetstar and Scoot
but is currently a small component of the sector in Europe. Norwegian is moving into this market, with
long haul services being introduced at various airports including Gatwick. Ryanair has publicly talked
about its future ambitions in the long haul market but no firm steps have been taken to date.
It is probable that the long haul market will experience changes similar to developments in the short
haul market with the lowest cost, most efficient models predominating, albeit not to the same extent.
European network airlines will retain an important role in this segment but their share is almost certain
to be eroded by both growth of non-European network airlines and some form of long haul low cost
airlines.
The products and operating methods of airlines have been and will remain innovative and fluid
responding to market demands. The solution for capacity in the London region needs to recognise
and allow for this.
London’s Position in Aviation
Key findings: London is the best connected city in the world - London itself is the hub – not individual
airports. The role of Heathrow should not be overstated. Heathrow serves 173 of the 384 cities flown
from London. The other London airports operate to 308 cities, with Gatwick on its own serving 214.
London is similar to other leading world cities in operating a multiple airport system rather than a
mega transfer hub.
London is the best connected city in the world due to the strength of the economy, its attractiveness
for visitors and the size and diversity of its population. This in turn means that local demand for air
travel to and from London is the highest in the world.
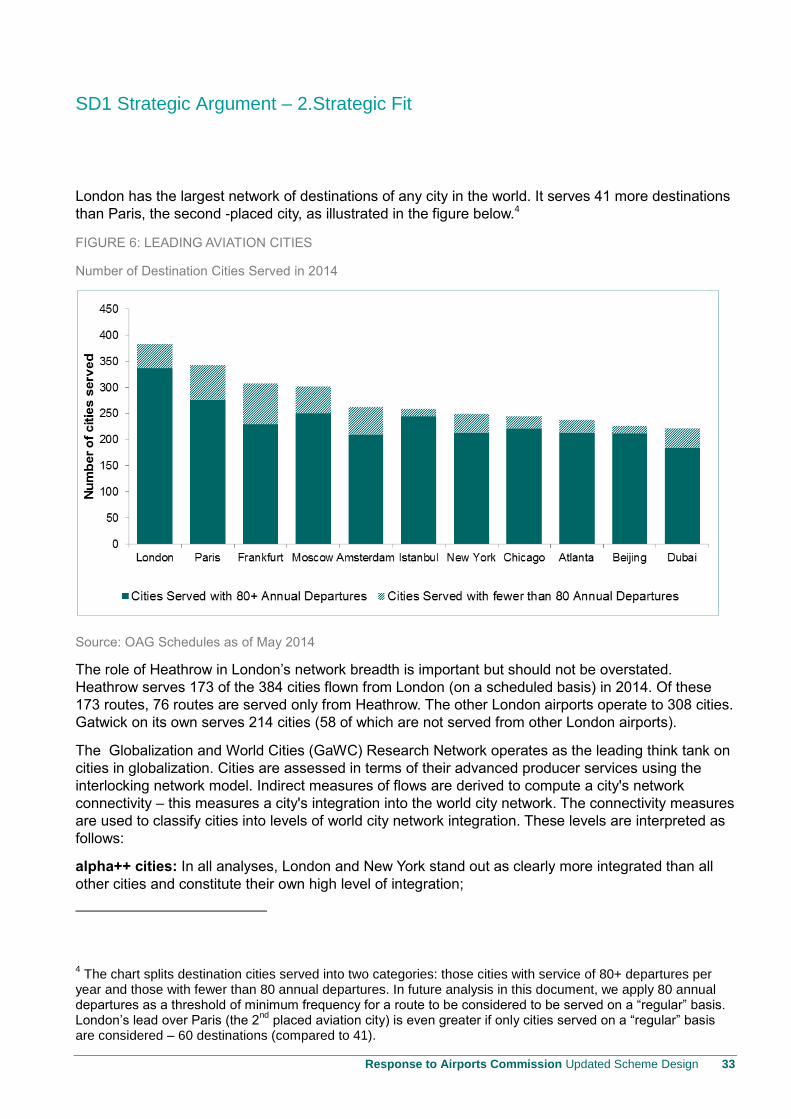
SD1 Strategic Argument – 2.Strategic Fit
Response to Airports Commission Updated Scheme Design 33
London has the largest network of destinations of any city in the world. It serves 41 more destinations
than Paris, the second -placed city, as illustrated in the figure below.4
FIGURE 6: LEADING AVIATION CITIES
Number of Destination Cities Served in 2014
Source: OAG Schedules as of May 2014
The role of Heathrow in London’s network breadth is important but should not be overstated.
Heathrow serves 173 of the 384 cities flown from London (on a scheduled basis) in 2014. Of these
173 routes, 76 routes are served only from Heathrow. The other London airports operate to 308 cities.
Gatwick on its own serves 214 cities (58 of which are not served from other London airports).
The Globalization and World Cities (GaWC) Research Network operates as the leading think tank on
cities in globalization. Cities are assessed in terms of their advanced producer services using the
interlocking network model. Indirect measures of flows are derived to compute a city's network
connectivity – this measures a city's integration into the world city network. The connectivity measures
are used to classify cities into levels of world city network integration. These levels are interpreted as
follows:
alpha++ cities: In all analyses, London and New York stand out as clearly more integrated than all
other cities and constitute their own high level of integration;
4 The chart splits destination cities served into two categories: those cities with service of 80+ departures per
year and those with fewer than 80 annual departures. In future analysis in this document, we apply 80 annual departures as a threshold of minimum frequency for a route to be considered to be served on a “regular” basis. London’s lead over Paris (the 2
nd placed aviation city) is even greater if only cities served on a “regular” basis
are considered – 60 destinations (compared to 41).
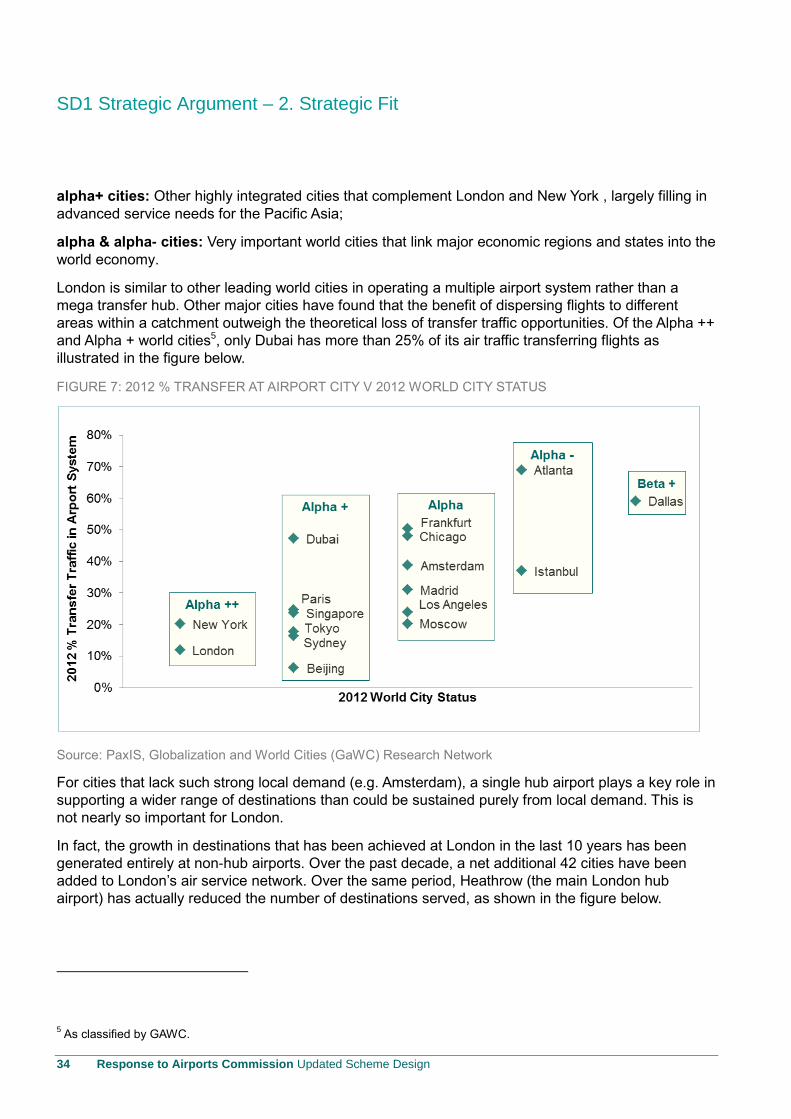
SD1 Strategic Argument – 2. Strategic Fit
34 Response to Airports Commission Updated Scheme Design
alpha+ cities: Other highly integrated cities that complement London and New York , largely filling in
advanced service needs for the Pacific Asia;
alpha & alpha- cities: Very important world cities that link major economic regions and states into the
world economy.
London is similar to other leading world cities in operating a multiple airport system rather than a
mega transfer hub. Other major cities have found that the benefit of dispersing flights to different
areas within a catchment outweigh the theoretical loss of transfer traffic opportunities. Of the Alpha ++
and Alpha + world cities5, only Dubai has more than 25% of its air traffic transferring flights as
illustrated in the figure below.
FIGURE 7: 2012 % TRANSFER AT AIRPORT CITY V 2012 WORLD CITY STATUS
Source: PaxIS, Globalization and World Cities (GaWC) Research Network
For cities that lack such strong local demand (e.g. Amsterdam), a single hub airport plays a key role in
supporting a wider range of destinations than could be sustained purely from local demand. This is
not nearly so important for London.
In fact, the growth in destinations that has been achieved at London in the last 10 years has been
generated entirely at non-hub airports. Over the past decade, a net additional 42 cities have been
added to London’s air service network. Over the same period, Heathrow (the main London hub
airport) has actually reduced the number of destinations served, as shown in the figure below.
5 As classified by GAWC.
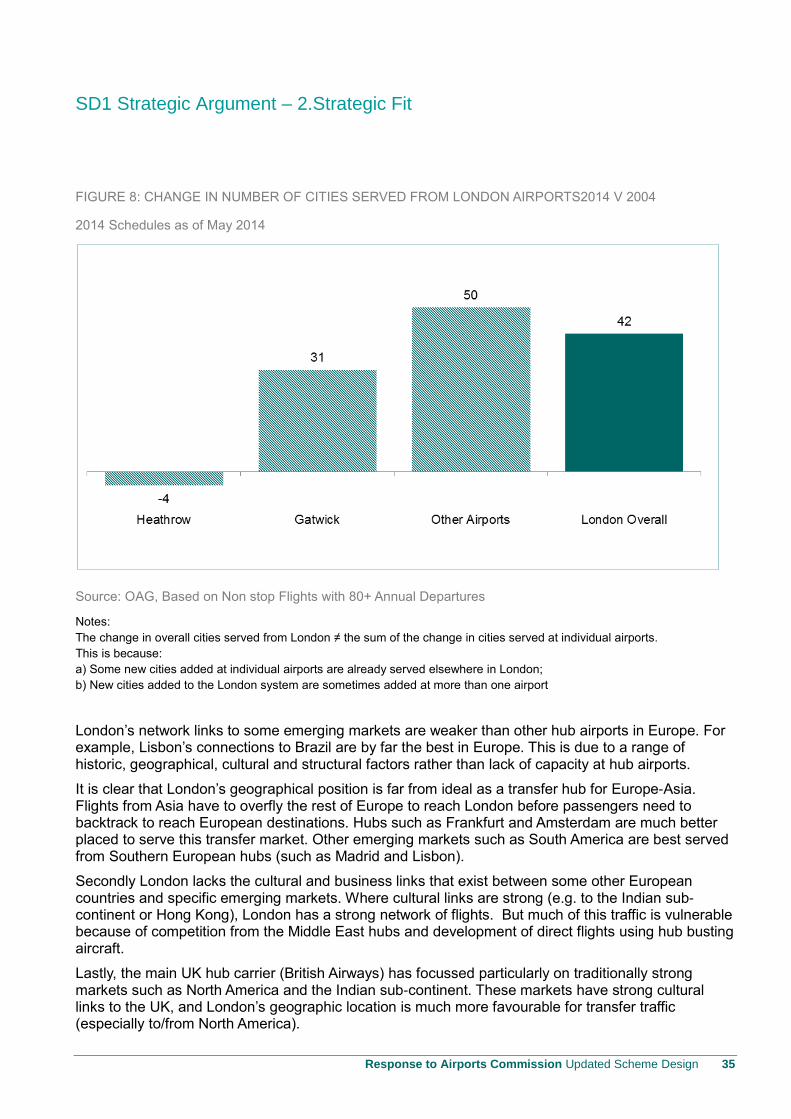
SD1 Strategic Argument – 2.Strategic Fit
Response to Airports Commission Updated Scheme Design 35
FIGURE 8: CHANGE IN NUMBER OF CITIES SERVED FROM LONDON AIRPORTS2014 V 2004
2014 Schedules as of May 2014
Source: OAG, Based on Non stop Flights with 80+ Annual Departures
Notes:
The change in overall cities served from London ≠ the sum of the change in cities served at individual airports.
This is because:
a) Some new cities added at individual airports are already served elsewhere in London;
b) New cities added to the London system are sometimes added at more than one airport
London’s network links to some emerging markets are weaker than other hub airports in Europe. For example, Lisbon’s connections to Brazil are by far the best in Europe. This is due to a range of historic, geographical, cultural and structural factors rather than lack of capacity at hub airports.
It is clear that London’s geographical position is far from ideal as a transfer hub for Europe-Asia. Flights from Asia have to overfly the rest of Europe to reach London before passengers need to backtrack to reach European destinations. Hubs such as Frankfurt and Amsterdam are much better placed to serve this transfer market. Other emerging markets such as South America are best served from Southern European hubs (such as Madrid and Lisbon).
Secondly London lacks the cultural and business links that exist between some other European countries and specific emerging markets. Where cultural links are strong (e.g. to the Indian sub-continent or Hong Kong), London has a strong network of flights. But much of this traffic is vulnerable because of competition from the Middle East hubs and development of direct flights using hub busting aircraft.
Lastly, the main UK hub carrier (British Airways) has focussed particularly on traditionally strong markets such as North America and the Indian sub-continent. These markets have strong cultural links to the UK, and London’s geographic location is much more favourable for transfer traffic (especially to/from North America).
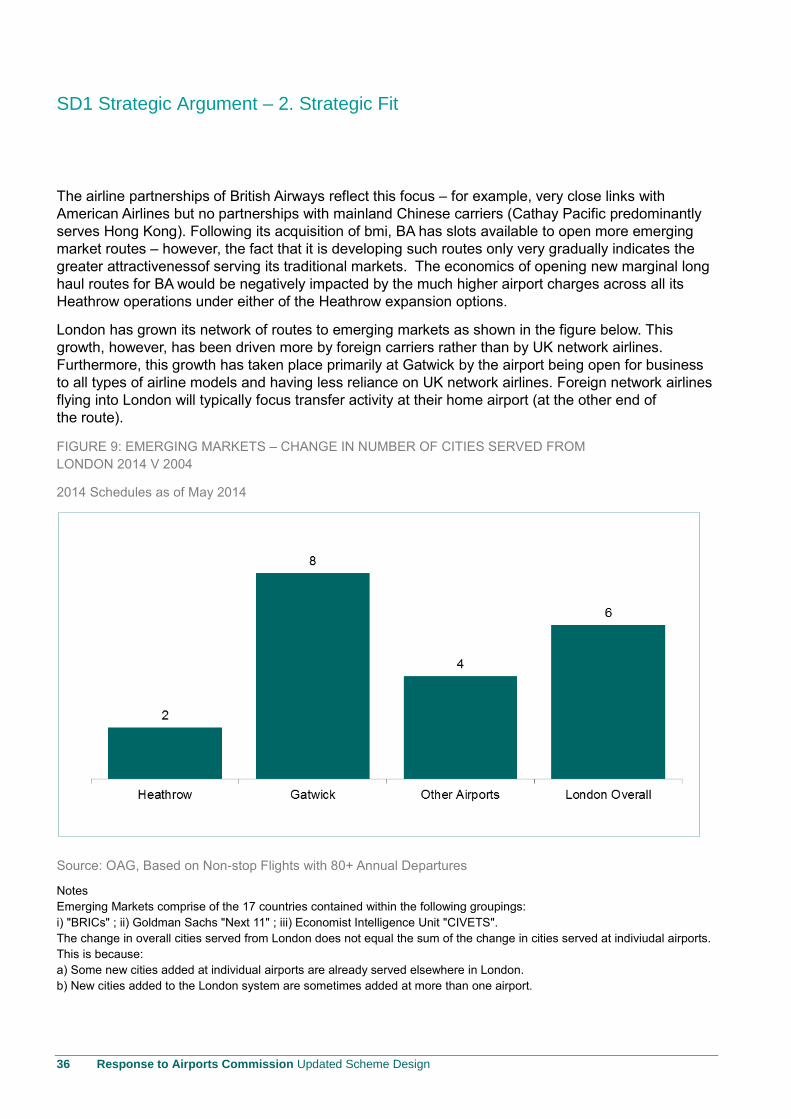
SD1 Strategic Argument – 2. Strategic Fit
36 Response to Airports Commission Updated Scheme Design
The airline partnerships of British Airways reflect this focus – for example, very close links with
American Airlines but no partnerships with mainland Chinese carriers (Cathay Pacific predominantly
serves Hong Kong). Following its acquisition of bmi, BA has slots available to open more emerging
market routes – however, the fact that it is developing such routes only very gradually indicates the
greater attractivenessof serving its traditional markets. The economics of opening new marginal long
haul routes for BA would be negatively impacted by the much higher airport charges across all its
Heathrow operations under either of the Heathrow expansion options.
London has grown its network of routes to emerging markets as shown in the figure below. This
growth, however, has been driven more by foreign carriers rather than by UK network airlines.
Furthermore, this growth has taken place primarily at Gatwick by the airport being open for business
to all types of airline models and having less reliance on UK network airlines. Foreign network airlines
flying into London will typically focus transfer activity at their home airport (at the other end of
the route).
FIGURE 9: EMERGING MARKETS – CHANGE IN NUMBER OF CITIES SERVED FROM
LONDON 2014 V 2004
2014 Schedules as of May 2014
Source: OAG, Based on Non-stop Flights with 80+ Annual Departures
Notes
Emerging Markets comprise of the 17 countries contained within the following groupings:
i) "BRICs" ; ii) Goldman Sachs "Next 11" ; iii) Economist Intelligence Unit "CIVETS".
The change in overall cities served from London does not equal the sum of the change in cities served at indiviudal airports.
This is because:
a) Some new cities added at individual airports are already served elsewhere in London.
b) New cities added to the London system are sometimes added at more than one airport.
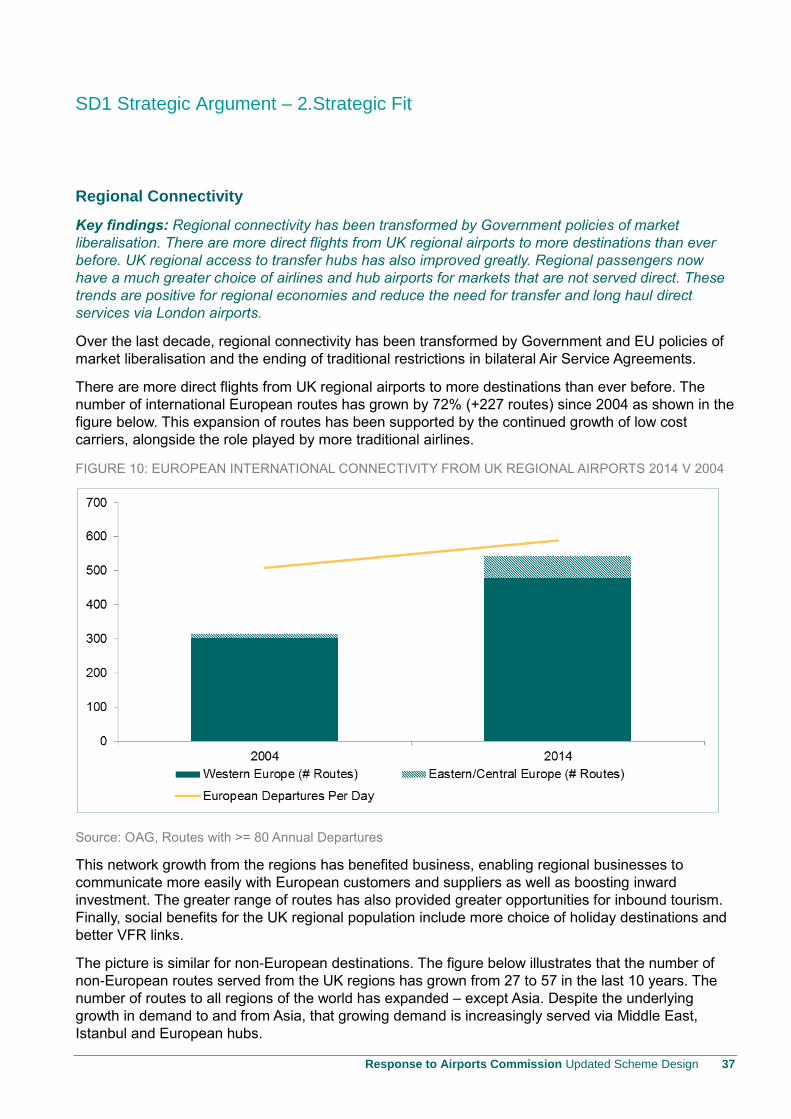
SD1 Strategic Argument – 2.Strategic Fit
Response to Airports Commission Updated Scheme Design 37
Regional Connectivity
Key findings: Regional connectivity has been transformed by Government policies of market
liberalisation. There are more direct flights from UK regional airports to more destinations than ever
before. UK regional access to transfer hubs has also improved greatly. Regional passengers now
have a much greater choice of airlines and hub airports for markets that are not served direct. These
trends are positive for regional economies and reduce the need for transfer and long haul direct
services via London airports.
Over the last decade, regional connectivity has been transformed by Government and EU policies of
market liberalisation and the ending of traditional restrictions in bilateral Air Service Agreements.
There are more direct flights from UK regional airports to more destinations than ever before. The
number of international European routes has grown by 72% (+227 routes) since 2004 as shown in the
figure below. This expansion of routes has been supported by the continued growth of low cost
carriers, alongside the role played by more traditional airlines.
FIGURE 10: EUROPEAN INTERNATIONAL CONNECTIVITY FROM UK REGIONAL AIRPORTS 2014 V 2004
Source: OAG, Routes with >= 80 Annual Departures
This network growth from the regions has benefited business, enabling regional businesses to
communicate more easily with European customers and suppliers as well as boosting inward
investment. The greater range of routes has also provided greater opportunities for inbound tourism.
Finally, social benefits for the UK regional population include more choice of holiday destinations and
better VFR links.
The picture is similar for non-European destinations. The figure below illustrates that the number of
non-European routes served from the UK regions has grown from 27 to 57 in the last 10 years. The
number of routes to all regions of the world has expanded – except Asia. Despite the underlying
growth in demand to and from Asia, that growing demand is increasingly served via Middle East,
Istanbul and European hubs.
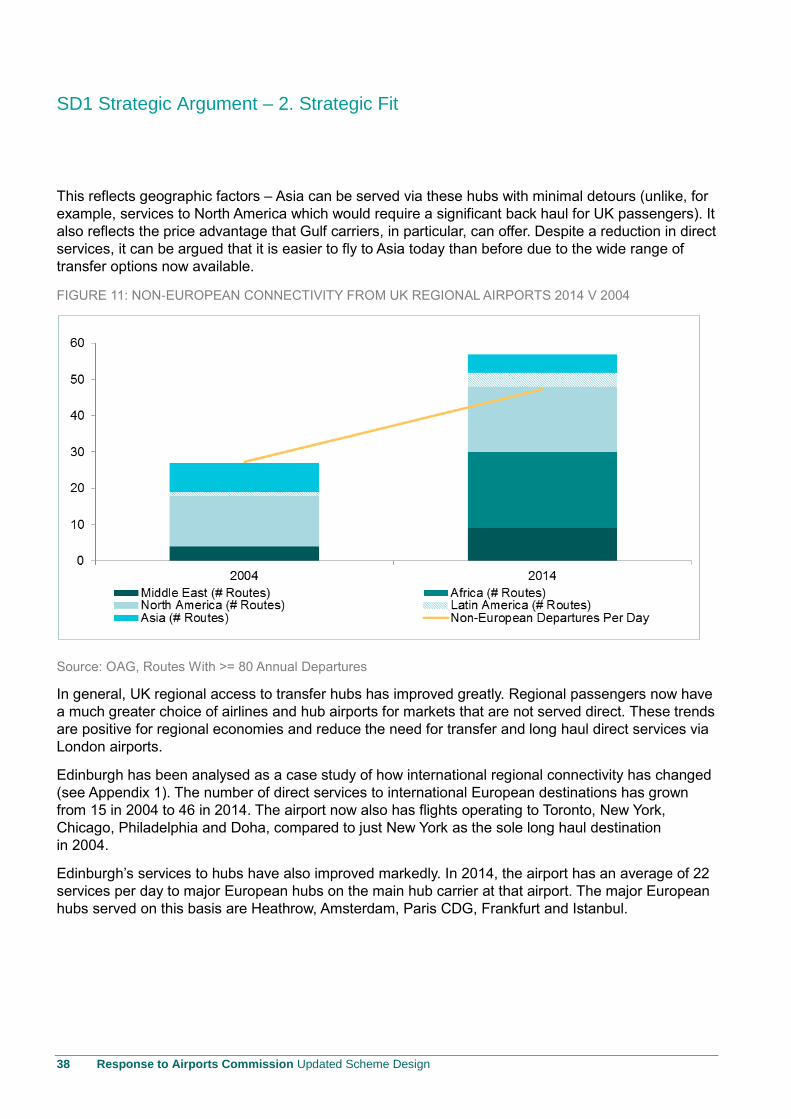
SD1 Strategic Argument – 2. Strategic Fit
38 Response to Airports Commission Updated Scheme Design
This reflects geographic factors – Asia can be served via these hubs with minimal detours (unlike, for
example, services to North America which would require a significant back haul for UK passengers). It
also reflects the price advantage that Gulf carriers, in particular, can offer. Despite a reduction in direct
services, it can be argued that it is easier to fly to Asia today than before due to the wide range of
transfer options now available.
FIGURE 11: NON-EUROPEAN CONNECTIVITY FROM UK REGIONAL AIRPORTS 2014 V 2004
Source: OAG, Routes With >= 80 Annual Departures
In general, UK regional access to transfer hubs has improved greatly. Regional passengers now have
a much greater choice of airlines and hub airports for markets that are not served direct. These trends
are positive for regional economies and reduce the need for transfer and long haul direct services via
London airports.
Edinburgh has been analysed as a case study of how international regional connectivity has changed
(see Appendix 1). The number of direct services to international European destinations has grown
from 15 in 2004 to 46 in 2014. The airport now also has flights operating to Toronto, New York,
Chicago, Philadelphia and Doha, compared to just New York as the sole long haul destination
in 2004.
Edinburgh’s services to hubs have also improved markedly. In 2014, the airport has an average of 22
services per day to major European hubs on the main hub carrier at that airport. The major European
hubs served on this basis are Heathrow, Amsterdam, Paris CDG, Frankfurt and Istanbul.
SD1 Strategic Argument – 2.Strategic Fit
Response to Airports Commission Updated Scheme Design 39
2.2 Assessment of Need
In this section, we define what we believe the Commission wants to have covered by the assessment
of need and then go on to set out with more granularity our view of the future UK needs in relation to
aviation. In other words, how can airports and airlines best serve the interests of the UK?
We highlight our view on the future demand for air travel at London airports as well as the aggregate
demand and nature of demand. What destinations will we fly to? How will we fly there? Where will
demand originate from? What types of airlines will we be using?
There are some clear indications that the nature of air travel demand will change markedly over the
next 30 years. Equally, no one can predict the future with any great certainty. Therefore, any solution
will need to be robust and flexible to reflect the full range of plausible outcomes. We believe the
Gatwick 2+2 proposal is the best solution that addresses each of the assessment of need
requirements.
Context
Air travel plays an important role in the development of the UK economy, provides important
connectivity for businesses, links dispersed families, is the main mode of travel for holidays abroad
and foreign visitors to the UK, and facilitates rapid import and export of goods.
The UK is a major global aviation hub, supported by London’s airport system as a whole, rather than
just Heathrow. Aviation has helped London to become the best connected city in the world,
underpinning its status as a leading global city. Domestic air and rail services link the different regions
of the UK, both economically and socially. The increasing range of international direct air services
from the regions support stronger trade links, inbound investment and inbound tourism. Direct
services from the regions are complemented by access to transfer hub airports. The regions
increasingly benefit from the transfer opportunities provided by a range of transfer airport options, not
just London.
Air travel is no longer the preserve of the affluent. Passengers are increasingly valuing convenience,
price and reliability over the provision of traditional services such as free meals on board. As more
people fly regularly, the need to minimise travel time becomes more important. The ability to conduct
business in Europe as a day trip is often a key consideration. To an individual, connectivity is being
able to fly direct from a convenient airport, with a convenient schedule, at a reasonable cost. This
could involve flying out of a London airport close to the home or office and flying back into another
airport better located for the home, office or hotel.
The product offering to passengers is becoming increasingly sophisticated, with menu pricing
becoming more common. The difference in the needs of business and leisure passengers is eroding.
For years, small and medium enterprises have been seeking to minimise travel related expenditure.
More recently, many larger corporations have implemented travel policies that stipulate economy
cabin flying or use of the lowest cost option.
Interpretation of Assessment of Need
The Terms of Reference for the Airports Commission set out that it “will examine the scale and timing
of any requirement for additional capacity to maintain the UK’s position as Europe’s most important
aviation hub, and it will identify and evaluate how any need for additional capacity should be met in
the short, medium and long term”.

SD1 Strategic Argument – 2. Strategic Fit
40 Response to Airports Commission Updated Scheme Design
In its Interim Report, the Commission discussed the UK’s aviation capacity and connectivity needs.
The value of direct services and frequency of service was analysed for domestic, short haul and long
haul markets. Services to and from emerging markets were identified as of particular importance to
business passengers. The Commission highlighted the importance of air fares. Higher air fares lead
to higher costs for users and depress demand – with both of these effects having negative economic
consequences.
The Commission set out how the provision of airport capacity influences economic costs. Three types
of potential impact were identified:
The economic costs and benefits for providers (airports and airlines) and users (passengers)
resulting from a constrained airport system;
The direct economic impacts on business associated with constrained airport capacity, including
impacts on trade, foreign direct investment (FDI) and tourism;
The wider impacts on the economy associated with changes in trade, investment and tourism.
The Commission’s Interim Report also indicated that delivery of a final recommendation would reflect
the risks and opportunities within each of the proposals, and would ultimately have to demonstrate
that the best solution:
Delivered the capacity needed in line with the estimated capacity requirement;
Was sufficiently flexible to cope with uncertainty around the future development of the industry;
and
Performed well across a balanced assessment of various factors identified in the sift criteria.
In addition to the above, our interpretation of the Commission’s Assessment of Need is that new
runway capacity should also:
Help to safeguard the UK’s position as Europe’s most important aviation hub by enabling the
London airport system to increase the range of markets served directly. Improving services to
emerging markets are a particular priority given their increasing importance and the UK’s relatively
weak existing network to destinations in these markets;
Improve schedule frequency, both in aggregate and at local airports. This will drive cost savings to
users through more efficient use of time;
Support the ability of all airlines to compete with each other, which will make air travel more
affordable through competition and the greater availability of lower cost carrier options;
Improve reliability of air services through more efficient / streamlined airport infrastructure. This in
turn also leads to cost savings for users;
Be as sustainable as possible: mitigate negative impacts to the environment and quality of life of
local communities, whilst enhancing positive impacts and contribution to socio-economic
development.
We have designed our scheme to respond to this understanding of the assessment of need.
SD1 Strategic Argument – 2.Strategic Fit
Response to Airports Commission Updated Scheme Design 41
Demand Outlook
Key findings: Demand for air travel from the UK continues to grow. ICF SH&E forecast that the
unconstrained passenger demand for the London airport system will reach 243 million passengers per
year by 2050. By 2030, unconstrained traffic is forecast to reach 197mppa, significantly in excess of
existing airport capacity. Therefore, new capacity is needed and needed earlier than the
Commission’s objective of 2030.
Demand for air travel from the UK continues to grow, linked to the economic growth of the UK, its
trading partners and inbound tourism markets. Other factors such as taxation, fuel prices, and airline
supply side developments also influence demand for air travel.
ICF SH&E has developed independent traffic forecasts for the London market in the period to 2052.
The traffic forecast model integrates both demand side and supply side issues. It uses a conventional
top down approach in relation to underlying demand growth (i.e. underlying traffic growth is a function
of economic growth). We believe that these traffic forecasts give a better representation of future
trends and traffic allocation across the London airports than the Department for Transport (DfT)’s
traffic model, which is too focused on historical patterns of supply and demand.
Consequently, compared to some more conventional approaches, there is more focus on market
issues. The ICF SH&E model explicitly considers structural changes in the market which have been
explained in Section 2.1.
A number of key areas are given more prominence by ICF SH&E than in the DfT’s national air
passenger demand and allocation models:
The impact of cost and efficiency of airport infrastructure on airline decision making;
The changing role of transfer hubs in Europe. This includes how London is increasingly becoming
a destination (a spoke) rather than a hub in many markets (for geographic and competition
reasons);
The growing importance of new generation airlines6 serving the UK;
How changes in the critical mass of services can influence an airport’s attractiveness in the future.
Taking all these factors into account, ICF SH&E forecast that the unconstrained passenger demand
for the London Airport System will reach 243 million passengers per year by 2050. This compares to
271m forecast7 by the Airports Commission in its Interim Report. The main difference between the
forecasts, illustrated in the figure below, relates to the most mature markets, where ICF SH&E project
lower growth in the latter half of the forecast period. This takes into account the clear evidence of
slowing growth in the most mature aviation markets, firstly, North America and secondly, Europe.
6 Airlines that are not traditional European legacy model airlines – new model hub and spoke airlines (e.g. Turkish Airlines,
Emirates, Etihad and Qatar), Asian fast growth airlines and low cost carriers in their various forms. A common factor is these
airlines do not rely on transfer traffic within the UK (either operating a point to point business model or feeding their own
hubs outside of the UK). 7 Carbon Traded, Capacity Unconstrained Scenario.
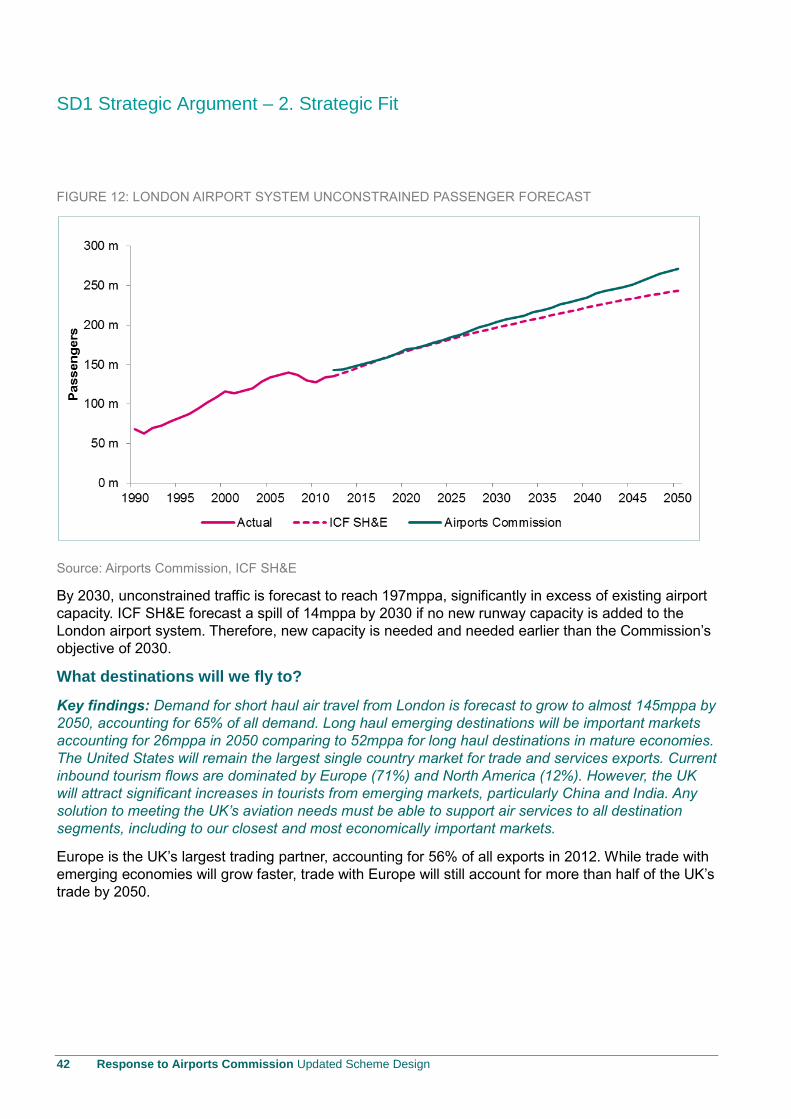
SD1 Strategic Argument – 2. Strategic Fit
42 Response to Airports Commission Updated Scheme Design
FIGURE 12: LONDON AIRPORT SYSTEM UNCONSTRAINED PASSENGER FORECAST
Source: Airports Commission, ICF SH&E
By 2030, unconstrained traffic is forecast to reach 197mppa, significantly in excess of existing airport
capacity. ICF SH&E forecast a spill of 14mppa by 2030 if no new runway capacity is added to the
London airport system. Therefore, new capacity is needed and needed earlier than the Commission’s
objective of 2030.
What destinations will we fly to?
Key findings: Demand for short haul air travel from London is forecast to grow to almost 145mppa by
2050, accounting for 65% of all demand. Long haul emerging destinations will be important markets
accounting for 26mppa in 2050 comparing to 52mppa for long haul destinations in mature economies.
The United States will remain the largest single country market for trade and services exports. Current
inbound tourism flows are dominated by Europe (71%) and North America (12%). However, the UK
will attract significant increases in tourists from emerging markets, particularly China and India. Any
solution to meeting the UK’s aviation needs must be able to support air services to all destination
segments, including to our closest and most economically important markets.
Europe is the UK’s largest trading partner, accounting for 56% of all exports in 2012. While trade with
emerging economies will grow faster, trade with Europe will still account for more than half of the UK’s
trade by 2050.
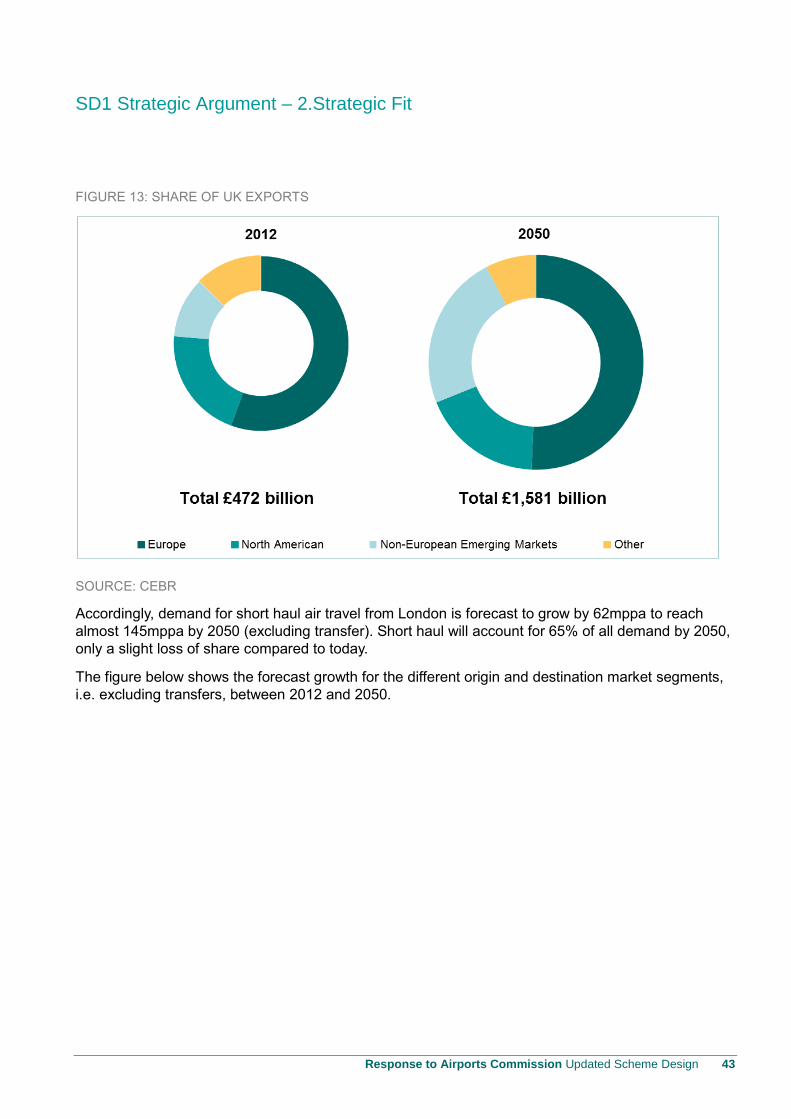
SD1 Strategic Argument – 2.Strategic Fit
Response to Airports Commission Updated Scheme Design 43
FIGURE 13: SHARE OF UK EXPORTS
SOURCE: CEBR
Accordingly, demand for short haul air travel from London is forecast to grow by 62mppa to reach
almost 145mppa by 2050 (excluding transfer). Short haul will account for 65% of all demand by 2050,
only a slight loss of share compared to today.
The figure below shows the forecast growth for the different origin and destination market segments,
i.e. excluding transfers, between 2012 and 2050.
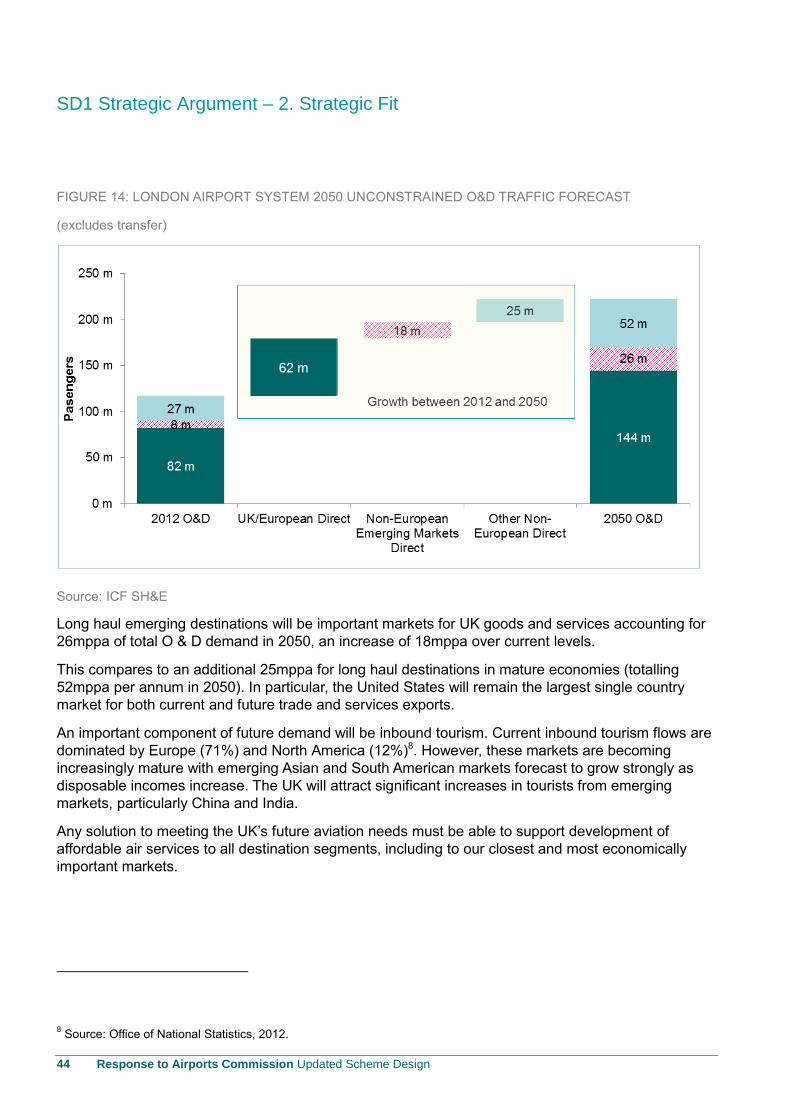
SD1 Strategic Argument – 2. Strategic Fit
44 Response to Airports Commission Updated Scheme Design
FIGURE 14: LONDON AIRPORT SYSTEM 2050 UNCONSTRAINED O&D TRAFFIC FORECAST
(excludes transfer)
Source: ICF SH&E
Long haul emerging destinations will be important markets for UK goods and services accounting for
26mppa of total O & D demand in 2050, an increase of 18mppa over current levels.
This compares to an additional 25mppa for long haul destinations in mature economies (totalling
52mppa per annum in 2050). In particular, the United States will remain the largest single country
market for both current and future trade and services exports.
An important component of future demand will be inbound tourism. Current inbound tourism flows are
dominated by Europe (71%) and North America (12%)8. However, these markets are becoming
increasingly mature with emerging Asian and South American markets forecast to grow strongly as
disposable incomes increase. The UK will attract significant increases in tourists from emerging
markets, particularly China and India.
Any solution to meeting the UK’s future aviation needs must be able to support development of
affordable air services to all destination segments, including to our closest and most economically
important markets.
8 Source: Office of National Statistics, 2012.
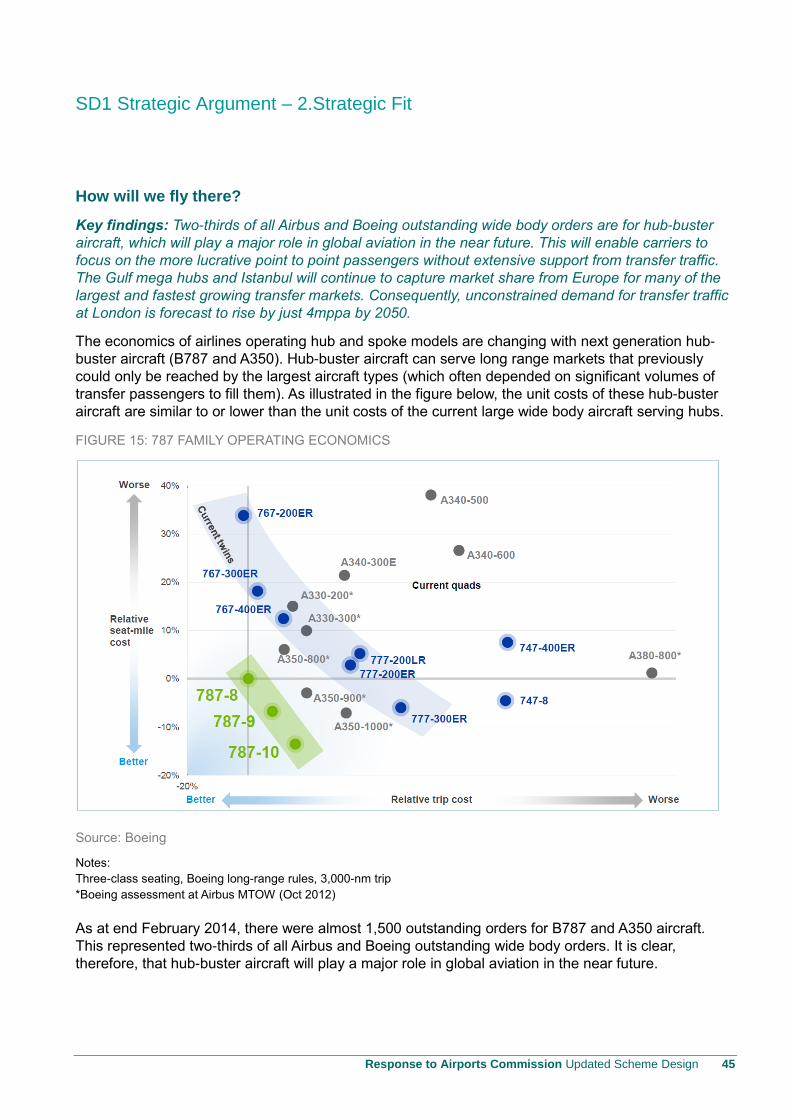
SD1 Strategic Argument – 2.Strategic Fit
Response to Airports Commission Updated Scheme Design 45
How will we fly there?
Key findings: Two-thirds of all Airbus and Boeing outstanding wide body orders are for hub-buster
aircraft, which will play a major role in global aviation in the near future. This will enable carriers to
focus on the more lucrative point to point passengers without extensive support from transfer traffic.
The Gulf mega hubs and Istanbul will continue to capture market share from Europe for many of the
largest and fastest growing transfer markets. Consequently, unconstrained demand for transfer traffic
at London is forecast to rise by just 4mppa by 2050.
The economics of airlines operating hub and spoke models are changing with next generation hub-
buster aircraft (B787 and A350). Hub-buster aircraft can serve long range markets that previously
could only be reached by the largest aircraft types (which often depended on significant volumes of
transfer passengers to fill them). As illustrated in the figure below, the unit costs of these hub-buster
aircraft are similar to or lower than the unit costs of the current large wide body aircraft serving hubs.
FIGURE 15: 787 FAMILY OPERATING ECONOMICS
Source: Boeing
Notes:
Three-class seating, Boeing long-range rules, 3,000-nm trip
*Boeing assessment at Airbus MTOW (Oct 2012)
As at end February 2014, there were almost 1,500 outstanding orders for B787 and A350 aircraft.
This represented two-thirds of all Airbus and Boeing outstanding wide body orders. It is clear,
therefore, that hub-buster aircraft will play a major role in global aviation in the near future.
SD1 Strategic Argument – 2. Strategic Fit
46 Response to Airports Commission Updated Scheme Design
These hub-buster aircraft will allow airlines to serve thinner routes without the need for large volumes
of lower yielding and more transient transfer traffic. This will enable carriers to focus on the more
lucrative point to point passengers. In particular, services to emerging market destinations will be
increasingly viable without extensive support from transfer traffic.
Furthermore, the eastwards shift in the world’s economic centre of gravity will continue to erode the
position of traditional European hub airports. The Gulf mega hubs and Istanbul will continue to
capture market share from Europe for many of the largest and fastest growing transfer markets. Other
less significant hubs, such as Helsinki and Moscow, will also have an impact on routes over the Arctic.
These competitor airports have significant geographical advantages, as discussed earlier in this
document.
Airports in North West Europe, and London in particular, will retain a key role in linking flows from
Europe and the Indian sub-continent to North America. However, London’s position in most other
transfer markets will be a niche one.
In 2013, transfer traffic accounted for only 14% of total passengers at London airports.
Unconstrained demand for transfer traffic at London is forecast to rise by just 4mppa to 22mppa
between 2012 and 2050 (representing 9% of total passengers). As discussed, more passengers will
be flying direct, whilst Europe will continue to lose share of transfer traffic to Middle East and
Asian hubs.

SD1 Strategic Argument – 2.Strategic Fit
Response to Airports Commission Updated Scheme Design 47
Where will demand originate from?
Key findings: Demand will continue to be dispersed across the UK and the different areas of the
South East. Airport capacity should reflect the dispersed nature of demand, and should not be
concentrated in one location.
The proportion of foreign passengers to/from the UK is expected to rise, especially for routes to less
mature long haul destinations. This is because economic growth in these markets will be significantly
higher than in the UK, resulting in a shift in the nationality mix of traffic flows.
Demand for air services is sourced from across the UK. In 2012, CAA survey data indicates that
around 60% of O&D passengers in the UK had an initial surface origin or final surface destination in
the regions (compared to around 40% to/from the South East of England).
For the London airport system, there is a high degree of catchment overlap as shown in the figure
below. Only 11% of passengers originate from Heathrow’s core catchment (as defined by the
Competition Commission, based on districts where Heathrow is the only airport capturing more than
20% of the market9).
Gatwick has a smaller core catchment. However, almost two-thirds of London passengers are
travelling to or from parts of the overall Gatwick catchment (comprising core and overlapping
catchment areas).
9 As defined by the Competition Commission, based on districts where Heathrow is the only airport capturing more than 20%
of the market. In this measure, the size of Heathrow’s catchment is boosted by the current range of flights at the airport
(which passengers will travel long distances to access).

SD1 Strategic Argument – 2. Strategic Fit
48 Response to Airports Commission Updated Scheme Design
FIGURE 16: LONDON AIRPORTS CATCHMENT ANALYSIS
Source: Competition Commission, CAA Survey 2006, Gatwick Analysis
Notes:
A district is considered part of an airport catchment if >20% of traffic from that district uses the airport.
Core catchment relates to districts where only one airport achieves a share > 20%.
What types of airlines will we be using?
Key findings: Continued growth of low cost short haul capacity is supported by supply side analysis
of aircraft orders with the vast majority of growth aircraft going to the main UK and European low cost
carriers (LCCs). The forecast increase in demand to London from Asian growth markets will lead to
an increase in direct services which do not rely on London as a source of transfer passengers. These
passengers will be fed from the airline networks at the other end of the route. Long haul forecasts are
further supported by supply side analysis of aircraft orders with the vast majority of growth aircraft
going to well-resourced non-European carriers supporting the forecast that foreign carriers will
provide a very significant proportion of new long haul growth to London.
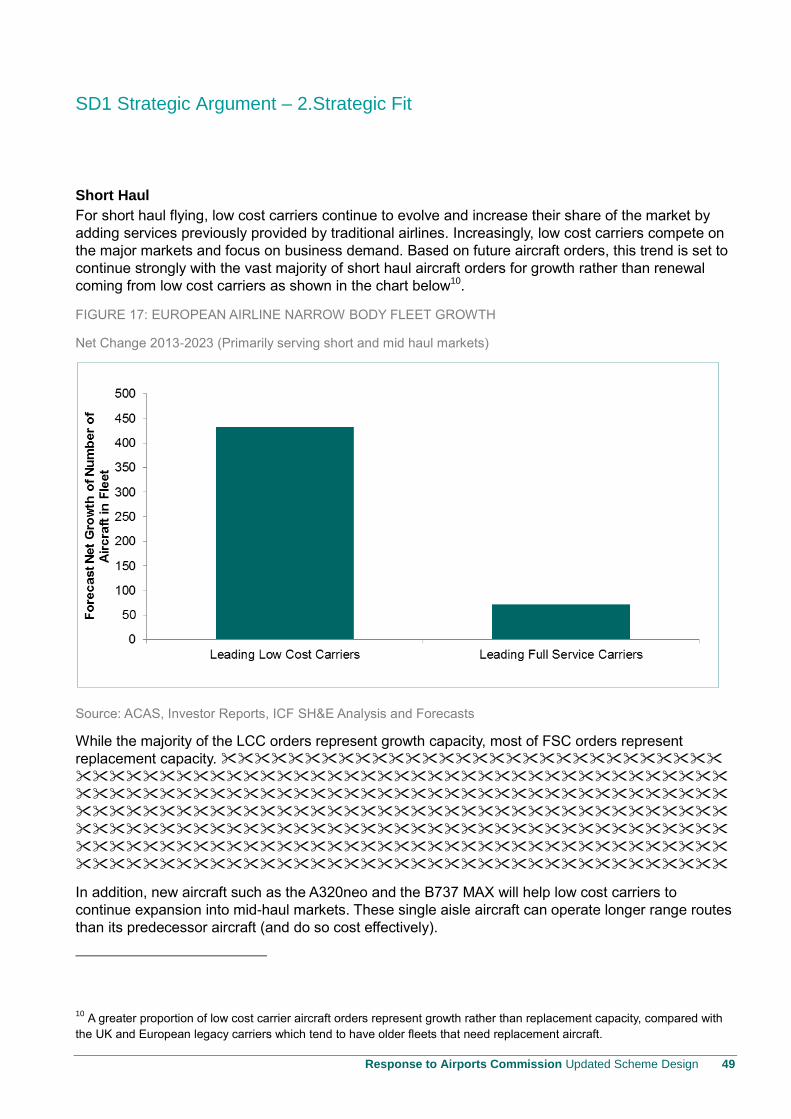
SD1 Strategic Argument – 2.Strategic Fit
Response to Airports Commission Updated Scheme Design 49
Short Haul
For short haul flying, low cost carriers continue to evolve and increase their share of the market by
adding services previously provided by traditional airlines. Increasingly, low cost carriers compete on
the major markets and focus on business demand. Based on future aircraft orders, this trend is set to
continue strongly with the vast majority of short haul aircraft orders for growth rather than renewal
coming from low cost carriers as shown in the chart below10.
FIGURE 17: EUROPEAN AIRLINE NARROW BODY FLEET GROWTH
Net Change 2013-2023 (Primarily serving short and mid haul markets)
Source: ACAS, Investor Reports, ICF SH&E Analysis and Forecasts
While the majority of the LCC orders represent growth capacity, most of FSC orders represent
replacement capacity.
In addition, new aircraft such as the A320neo and the B737 MAX will help low cost carriers to
continue expansion into mid-haul markets. These single aisle aircraft can operate longer range routes
than its predecessor aircraft (and do so cost effectively).
10 A greater proportion of low cost carrier aircraft orders represent growth rather than replacement capacity, compared with
the UK and European legacy carriers which tend to have older fleets that need replacement aircraft.
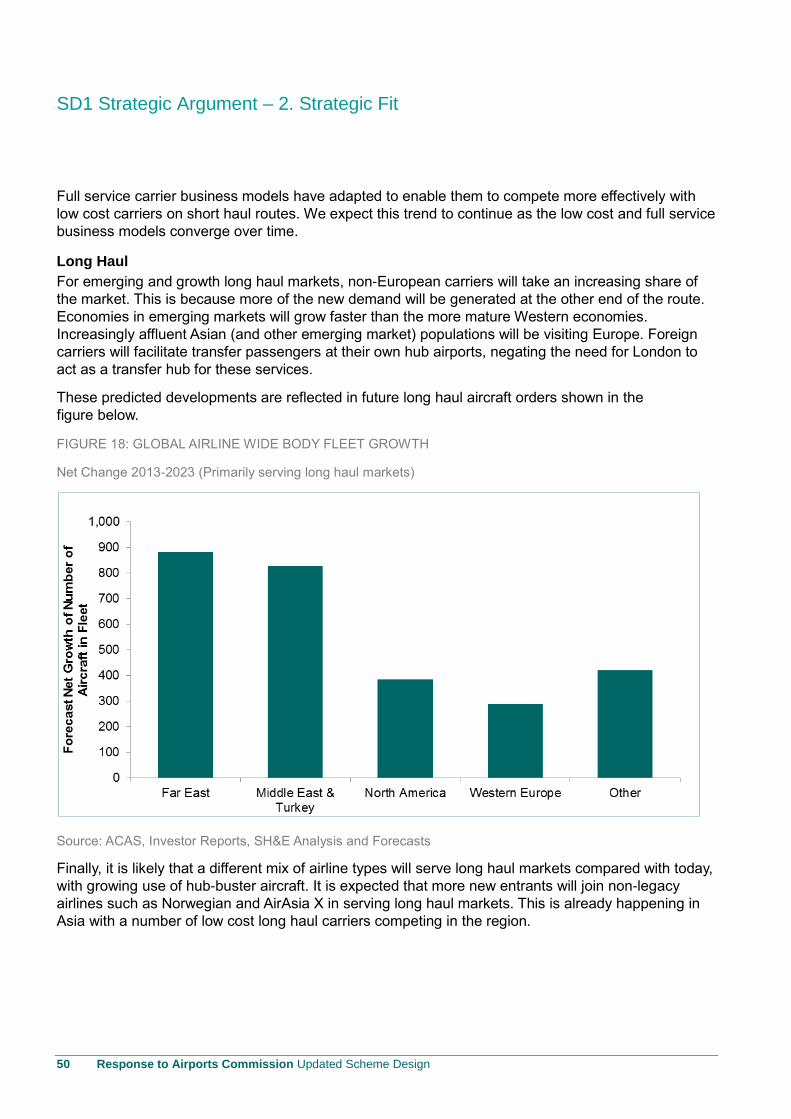
SD1 Strategic Argument – 2. Strategic Fit
50 Response to Airports Commission Updated Scheme Design
Full service carrier business models have adapted to enable them to compete more effectively with
low cost carriers on short haul routes. We expect this trend to continue as the low cost and full service
business models converge over time.
Long Haul
For emerging and growth long haul markets, non-European carriers will take an increasing share of
the market. This is because more of the new demand will be generated at the other end of the route.
Economies in emerging markets will grow faster than the more mature Western economies.
Increasingly affluent Asian (and other emerging market) populations will be visiting Europe. Foreign
carriers will facilitate transfer passengers at their own hub airports, negating the need for London to
act as a transfer hub for these services.
These predicted developments are reflected in future long haul aircraft orders shown in the
figure below.
FIGURE 18: GLOBAL AIRLINE WIDE BODY FLEET GROWTH
Net Change 2013-2023 (Primarily serving long haul markets)
Source: ACAS, Investor Reports, SH&E Analysis and Forecasts
Finally, it is likely that a different mix of airline types will serve long haul markets compared with today,
with growing use of hub-buster aircraft. It is expected that more new entrants will join non-legacy
airlines such as Norwegian and AirAsia X in serving long haul markets. This is already happening in
Asia with a number of low cost long haul carriers competing in the region.

SD1 Strategic Argument – 2.Strategic Fit
Response to Airports Commission Updated Scheme Design 51
Gatwick’s View of how the Assessment of Need can best be met
Key findings: ICF SH&E forecasts indicate that there will be an additional 87mppa of demand by
2040 growing to 108mppa by 2050. Making maximum use of existing runway capacity (Do Minimum)
can deliver around 68mppa by 2050. Therefore, a long term runway solution for London will need to
add capacity of around 40mppa by 2050.
New runway capacity should be accessible to all airline types. Growth in the industry will continue
to be driven by the fast growing new generation airlines, where competitive airport charges and
efficient airport infrastructure are vital.
Additional expensive hub capacity as proposed by Heathrow does not make sense. Transfer
passengers have lower intrinsic value to the UK than O&D passengers.
The future London airport system should be dispersed rather than concentrated, ensuring the
maximum number of passengers can travel to/from their local airport. It will also improve
resilience, relieve pressure on surface transport infrastructure, and spread the associated
economic benefits of aviation development more widely.
The ease with which people can travel to, from and within the UK (connectivity) is a key issue for the
country. The availability of convenient air services - from convenient airports - to and from key
business, leisure and visiting friends and relatives (VFR) destinations is vital for the UK’s future
prosperity.
As well as convenient schedules (destinations/frequency), affordable air fares are a key dimension of
connectivity. Growing competition between airlines, and more recently airports, has resulted in
substantial reductions in average fares over the last decade.
Our assessment of how the need for future UK capacity can be met is set out below.
Scale and Timing of Capacity
The ICF SH&E demand forecasts indicate that there will be an additional 87mppa of demand by 2040
(relative to 2012) from the London airport system. This figure will grow to 108mppa by 2050.
Making maximum use of existing runway capacity (Do Minimum) can deliver a maximum of around an
additional 68mppa by 2050 at increasing cost in terms of resilience. Therefore, a long term runway
solution for London will need to add capacity of around 40mppa by 2050, over and above the Do
Minimum case.
The Airports Commission forecasts have slightly stronger growth in the long term11. If this proves to
be correct, this would bring forward the time when a second new runway was needed in the London
airport system. However, the implications of slightly faster or slower long term growth are not critical
when considering the first new runway.
The Airports Commission is recommending a new runway from 2030. We believe that a new runway
is needed before then, especially given the recent more positive recovery in both economic and
aviation growth in the UK. Between 2025 and 2030, we forecast that a cumulative total of 40m
passengers will be lost from London airports in the absence of new runway capacity.
11 The differences are discussed in more depth earlier in the report, in the “Demand Outlook” section.
SD1 Strategic Argument – 2. Strategic Fit
52 Response to Airports Commission Updated Scheme Design
Type of Capacity
New runway capacity should be located where it generates the most benefit for the UK, i.e. the
scheme which generates the best connectivity, subject to satisfying wider considerations identified by
the Airports Commission.
It is essential also that new runway capacity will allow the UK aviation sector to continue to compete
and innovate. This will generate substantial benefits in the form of lower fares, improved breadth of
destinations, and better service. Only in this way will consumer demand for efficient, value for money
travel be met.
With this in mind, new runway capacity should be accessible to all airline types. Growth in the industry
will continue to be driven by the fast growing new generation airlines, where competitive airport
charges and efficient airport infrastructure are vital. Capacity should also be suitable for legacy
airlines, meeting their needs.
We do not believe that additional hub capacity as proposed by Heathrow makes sense. Transfer
passengers have lower intrinsic value to the UK than O&D passengers. They play a role in supporting
routes with weak O&D demand but, as previously discussed, this role is limited. It is highly likely that
transfer traffic will become relatively less important at London in the future, regardless of airport
capacity. Even without expansion, London already has a potential 85mppa of hub capacity in the form
of Heathrow’s existing operation.
The stark distinction between hub and point to point capacity is an over simplification. Gatwick’s
strategy to offer an efficient transfer product, facilitated by the ongoing development of Gatwick
Connect, will build on the growing phenomenon of self-connecting passengers and increase the
number of passengers transferring at Gatwick. The class leading minimum connect time of 45
minutes and compact layout will further enhance the attractiveness of Gatwick for transferring
passengers.
Furthermore, we believe strongly that the future London airport system should be dispersed rather
than concentrated. This will ensure the maximum number of passengers can travel to/from their local
airport. It will also improve resilience, relieve pressure on surface transport infrastructure, and spread
the associated economic benefits of aviation development more widely.
The London airport system as a whole must maximise the connectivity opportunities across the full
range of airline business models, not cater largely for the legacy carrier model which trends show is
already in relative decline. There is a clear need for competitive cost and efficiency to allow natural
growth of all segments. Finally, the future London airport system needs to be flexible enough to
accommodate a range of potential outcomes.
SD1 Strategic Argument – 2.Strategic Fit
Response to Airports Commission Updated Scheme Design 53
Discussion of Airports Commission Scenarios
Key findings: Overall we regard a combination of Scenarios B and C to be the most likely as this is
essentially a continuation of existing trends – the decline of the European hubs and the continuing
growth of LCCs. European hubs will lose their historic pre-eminent position. Europe will become – in
many markets – a spoke rather than a hub. The importance of cost effective airport infrastructure is
clearly critical with the continuing growth of LCCs and point to point traffic in London is key.
In its Interim Report, the Airports Commission outlined four potential scenarios for the future of the
global aviation sector. The implications of each of these are discussed in the following sections of
this document.
Scenario A: Global Growth. Hub-and-spoke dominates the aviation market.
In this scenario, Europe retains a leading position within global traffic flows. This scenario would
indicate that hubs would continue to play an important role within Europe.
We consider this outcome somewhat unlikely given ongoing market developments, the high degree of
visibility of key aviation industry trends, and the expected lower economic growth of Europe relative to
emerging economies. Nevertheless, the strong growth of Asia that is a feature of this scenario would
disadvantage Heathrow in hub terms due to its geographic position.
Even if the conditions are favourable, new hub capacity in the UK would need to be cost effective and
efficient to make lower yielding transfer traffic economic for airlines. A high direct and indirect cost
solution as proposed by Heathrow would reduce, not increase, its share of transfer traffic.
Alternatively, with strong demand for transfer traffic, a complementary and more competitive dual hub
could emerge in London – similar to the systems in Paris, Frankfurt/Munich, New York and Chicago.
Scenario B: Relative decline of Europe. Hub-and-spoke dominates the aviation market; Europe
outside major global traffic flows.
We would see this as a more realistic scenario than Scenario A, given recent aviation and economic
trends.
While the hub and spoke model will continue to dominate globally, European hubs will lose their
historic pre-eminent position. Europe will become – in many markets – a spoke rather than a hub.
In this scenario, point to point capacity is the prime consideration for London.
SD1 Strategic Argument – 2. Strategic Fit
54 Response to Airports Commission Updated Scheme Design
Scenario C: Low-cost is king. Point-to-point dominates the aviation market; Europe within
major global traffic flows.
From a European perspective, the implications for airport capacity are similar to Scenario B. However,
the importance of cost effective airport infrastructure is clearly critical for this scenario.
Overall, this, in combination with Scenario B, can be considered the most likely scenario as it is
essentially a continuation of existing trends. This scenario does not explicitly mention Gulf carriers –
we believe that despite the general strength in point to point traffic, Gulf airlines will remain successful
in operating hub and spoke models because of their unique advantages in terms of cost structure,
financial backing.and low cost ultra-modern 24 hours-a-day hub airports.
Scenario D: Global fragmentation. Point-to-point dominates the aviation market; overall
relative decline in global traffic flows.
This is a pessimistic, although possible, scenario. Given the continued importance of point to point,
though, this scenario would also be best served by the provision of cost efficient point to point airport
capacity.
In the next sections of this document, we turn to the specific objectives set out by the Commission
and explain why we believe that a London airport system featuring Gatwick with two runways is best
placed to meet these requirements.
SD1 Strategic Argument – 2.Strategic Fit
Response to Airports Commission Updated Scheme Design 55
Objective: “To provide additional capacity that facilitates connectivity in line with the assessment
of need”
2.3 Gatwick Two Runway Master Plan
Context
Gatwick’s current infrastructure is focussed on operational excellence, and its single runway is
already the most efficient in the world. Since the change of ownership in 2009, management has
driven continuous operational innovations to increase peak air transport movements (ATMs) from 50
to 55 in 2014. Further improvements in peak hour movements to 58 are targeted by 2018 with an
ultimate peak target of 60 movements by the early 2020s. These improvements have not been
factored into Gatwick’s capacity estimates and so represent an upside to all the capacity projections
in this submission.
Gatwick’s efficient infrastructure enables airlines to achieve high levels of aircraft utilisation. Short taxi
times and optimised ground handling infrastructure result in much lower turnaround times than can be
achieved at Heathrow.
.
FIGURE 19:
The poor operational reliability of Heathrow results in its airlines building buffers into their scheduled
block times. On average, published block times from Gatwick are 4 minutes shorter than the
corresponding Heathrow route as illustrated below.
FIGURE 20: GATWICK V HEATHROW PUBLISHED BLOCK TIMES ON OVERLAPPING ROUTES
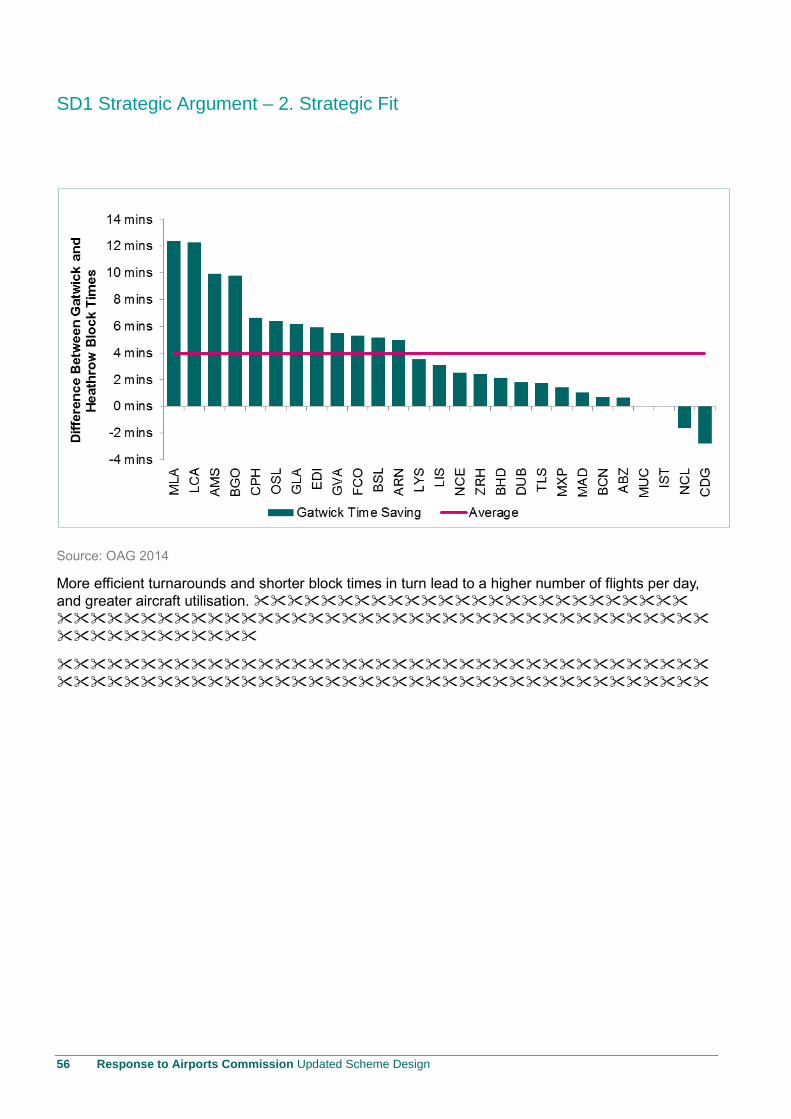
SD1 Strategic Argument – 2. Strategic Fit
56 Response to Airports Commission Updated Scheme Design
Source: OAG 2014
More efficient turnarounds and shorter block times in turn lead to a higher number of flights per day,
and greater aircraft utilisation.
SD1 Strategic Argument – 2.Strategic Fit
Response to Airports Commission Updated Scheme Design 57
FIGURE 21:
This drive to maximise efficiency at the lowest cost for airlines is at the centre of developing our
scheme proposals. We fully recognise the linkage between low airport charges and efficient
infrastructure, enabling airlines to pass on these benefits to passengers through lower fares, new
destinations and increased frequencies. This increases the attractiveness of Gatwick for airlines and
underpins our traffic forecasts. Key features in our Master Plan are:
Efficient taxiing journey and minimised delays, to reduce turnaround times and fuel burn;
Facilities that lend themselves to efficient crew utilisation and rostering;
Facilities tailored to different types of airline models and that allow airlines to differentiate their
products;
Airport facilities with a high level of utilisation;
Support activities such as aircraft servicing, cargo and car parking in locations close to the areas
they serve.

SD1 Strategic Argument – 2. Strategic Fit
58 Response to Airports Commission Updated Scheme Design
Master Plan Overview
Key findings: A new runway will provide a capacity in 2050 equivalent to around 95mppa. Peak hour
capacity will increase from 55 to 98 ATMs with two runways. This translates to an additional 260,000
ATMs per year. We view this as conservative based on our track record of optimising our current
runway and airfield systems.
Gatwick’s Master Plan has been developed around a highly efficient and optimised independent
mixed mode two-runway system. A new 3,400m runway, in combination with the existing similar
length runway, will provide a capacity in 2050 equivalent to around 95mppa.
FIGURE 22: GATWICK MASTER PLAN LAYOUT
Building on existing operating expertise, simulation modelling confirms that peak hour capacity will
increase from 55 to 98 ATMs with two runways. We view this as conservative based on our track
record of optimising our current runway and airfield systems. However, this conservative view
translates to an additional 260,000 ATMs per year. Gatwick’s total annual ATM capacity would rise to
560,000 from the current 300,000 ATM annual capacity.
Core to Gatwick’s ability to deliver this step change in capacity is:
Compact and efficient apron and taxiway configurations that can reliably support high levels of
throughput, allowing maximisation of runway utilisation and supporting rapid turnaround of aircraft.
The proximity and connectivity between terminals will enhance the operational efficiency for all
operators at the airport;
SD1 Strategic Argument – 2.Strategic Fit
Response to Airports Commission Updated Scheme Design 59
Both runways operating in independent mixed mode, maximising utilisation while minimising ATC
workload, airfield congestion and runway crossing movements;
A design which is suitable for a range of airline business models and aircraft types;
Runway capacity that can be delivered sooner, as early as 2025, relieving the pressure on the
London airport system that the Commission conclude in its Interim report would otherwise be
substantial by 2030;
Simplicity and clarity of Gatwick’s 3 terminal Master Plan that will make navigation through the
airport simple and intuitive for users. Short door to gate distances and minimum level changes will
make the journey easy for all.
Our analysis has excluded our targeted increases in efficiency in the period leading up to the opening
of a new runway. Gatwick is currently planning to increase peak hour runway capacity from the
current 55 to 58 over the next three years with a target capacity of 60 peak movements in the early
2020s.
Heathrow’s July 2013 submission to the Airports Commission indicated an additional 260,000 ATMs
from a third runway. However – for a variety of environmental, airfield complexity and airspace
reasons – we believe that a more realistic assessment of incremental ATMs would be up to 190,000.
This would give Heathrow a total annual ATM capacity of around 670,000 ATMs with a third runway.
Heathrow’s proposed complex method of runway alternation, necessary to mitigate the air noise
impacts, will result in longer and highly unpredictable travel times. The current taxiways between the
runways at Heathrow have to accommodate flights handling around 70mppa. With a third runway,
these existing taxiways will handle flights with well in excess of 100mppa. We believe delays of
several minutes are likely to be a feature of operations owing to:
The longer and less predictable nature of the taxiing distances making the ground movement
controller’s job much more challenging;
The need to maintain a ‘bank’ of queuing aircraft at the holding point for the departures-only
runway to ensure that the optimum departures sequence needed to achieve the runway
movement rate can be achieved.
Similarly Heathrow’s ‘arrivals-only’ runway, with its limited flexibility for accommodating peaks in
departure demand, is likely to result in a higher level of arrivals delay than at Gatwick with its two
mixed mode runways.
Airfield
Key findings: Our efficient airfield design is a simple but flexible arrangement of taxiways and taxi
lanes serving the runways and aprons. The innovative design concentrates usage of the aprons close
to the runways resulting in short taxi times and uncongested flows.
The Gatwick R2 Master Plan has been optimised to support the two runway system with a runway
separation of 1,045m which allows simultaneous independent mixed mode operations on the runways
for all aircraft types including Code F. There is sufficient room for supporting taxiways and midfield
apron capacity but the design avoids additional environmental impacts that a wider separation would
introduce.
SD1 Strategic Argument – 2. Strategic Fit
60 Response to Airports Commission Updated Scheme Design
The airfield northern zone serves the existing apron and North and South Terminals. The southern
zone serves the new midfield apron and new terminal. The capacity of each zone is split roughly
equally with each zone serving between 45 and 50mppa. This is consistent with the most recent DfT
assessment of Gatwick’s single runway capacity and allows additional capacity beyond the existing
runway to be provided by the new runway and midfield apron, enabling rapid delivery of new capacity
with minimum disruption to existing operations.
The midfield is compact and efficient with new parallel Code F (inner) and Code E (outer) taxiways to
both the north of the new and south of the existing runways. Two dual Code F cross-field taxiways
allow efficient circulation for aircraft of all sizes. Rapid exit junctions for narrow bodied and wide
bodied aircraft minimise runway occupancy times and suitable aircraft hold provisions and dedicated
pushback taxi lanes allow free flow taxiing circulation to maximise runway utilisation and capacity.
The average free flow travel time between leaving stand to start of roll on the runway is 7 minutes. In
2050, with 98 scheduled flights in the peak hour, delays will be below the industry standard of 10
minute average in the peak hour.
Airspace
Key findings: Dispersing airport capacity, by providing a second runway at Gatwick, will avoid a
concentration of air routes in one part of the South East’s airspace, as well as avoiding a significant
growth in flights over densely populated central London.
Although detailed airspace design has not yet been undertaken, discussions with NATS have not
suggested any reason why the planned level of throughput cannot be achieved within an
appropriately re-designed airspace system.
Similarly, NATS has not indicated any reason why the addition of a second runway at Gatwick would
adversely impact current operations at other airports including Redhill Aerodrome.
Dispersing airport capacity, by providing a second runway at Gatwick, will avoid a concentration of air
routes in one part of the South East’s airspace, as well as avoiding a significant growth in flights over
densely populated central London.
Aprons
Key findings: Our versatile aircraft stand arrangement allows for either two narrow body or one wide
body aircraft to be accommodated which will cater for different demands through the day.
Our modelling indicates that there is more than adequate stand capacity of gates in the northern and
midfield aprons to accommodate the required traffic movements. Our base Master Plan provides 106
stands in the northern apron and 104 stands in the midfield apron. The wide body stands are
designed to accommodate either one Code E or two Code C aircraft, so the total stands could number
269 if the smaller stand size is considered.
The versatile aircraft stand arrangement allows for either two narrow body or one wide body aircraft to
be accommodated which will cater for different demands through the day. This means in 2050 we
achieve a stand utilisation of 2,500 ATMs/stand. As a result, our piers and satellites do not have to be
larger than necessary and the gates most convenient for passengers can be most intensively used.
SD1 Strategic Argument – 2.Strategic Fit
Response to Airports Commission Updated Scheme Design 61
Terminals
Key findings: The new terminal will be a state of the art facility built in phases up to 50mppa. Each
terminal will accommodate a mix of airline and passenger markets (short haul, long haul, domestic,
low cost and full service). All terminals will be connected to a landside shuttle, providing rapid access
and a maximum 2½ minute over ground journey time to the Gatwick Gateway for rail, coach, car
rental and bus services. The proximity of our three terminals to each other, with the excellent landside
and airside connections, results in a high level of operational efficiency.
Terminal strategy is based on creating an easy to navigate layout for passengers, providing easy movement from surface access modes through one of the three terminals to aircraft. The existing North and South Terminals will continue their successful upgrading and modernisation to provide up to 22.5mppa capacity in each.
The new Terminal will be a state of the art facility built in phases up to 50mppa. The new midfield terminal will adopt a ‘loose fit’ approach allowing ready re-configuration of internal space to accommodate changing check-in, security and immigration procedures and technologies. A modular building form will allow easy incremental expansion as growth in demand dictates.
All three terminals will embed new technologies to ensure processes are seamless and un-intrusive for passengers. Each will accommodate a mix of airline and passenger markets (short haul, long haul, domestic, low cost and full service) with services and facilities customised to promote the growth of all sectors including fully equipped to accommodate a hub type operation.
All terminals will be connected to a landside shuttle, providing rapid access and a maximum 2½ minute journey time to the Gatwick Gateway for rail, coach, car rental and bus services. Long term car parking is consolidated into the area to the east of the railway and short term parking provided adjacent to each terminal.
The proximity of our three terminals to each other, with the excellent landside and airside connections, results in a high level of operational efficiency for airport operator, airlines and service providers. The short distances between and within terminals means less time is taken for passenger transfers allowing industry leading 45m MCTs to be achieved, irrespective of terminal, and irrespective of airline. At Heathrow, the MCT for inter terminal transfers could be up to 115 minutes due to the dispersed nature of the site. A further remote terminal at Heathrow will not improve this situation.
The compact terminal layout ensures rapid staff and equipment movements, assisting high levels of productivity. The same is true for the airfield. Operational functions will be consolidated into locations that can readily serve the apron areas, rather than being fragmented and separated by large distances. For example, the travel distance between the most distant parts of the midfield apron to the opposite end of the north apron is approximately 5,600m compared to 7,300m for the Heathrow proposals.
Gatwick’s proposed compact terminal plan will require only one satellite. In contrast, Heathrow’s dispersed four terminals will require some 7 additional satellites/piers adding more to passenger journey times and inconvenience.
Gatwick Gateway’s transport interchange facilities and the long term and staff car parking located in the eastern campus allow efficient and rapid movement of passengers and staff via frequent short shuttle services. This facilitates rapid long term car park to terminal building journey times of a maximum of 7 minutes. The interchange will be attractive, bright and easy to use with all services above ground. Facilities will be well utilised and not suffer from the inefficiencies of multiple facilities separated by large distances.
SD1 Strategic Argument – 2. Strategic Fit
62 Response to Airports Commission Updated Scheme Design
Support Facilities
Key findings: There will be a comprehensive range of support facilities including cargo, fuel farm,
maintenance, and workshops. Additional cargo capacity has been included to process the circa 1.1
million tonnes of cargo forecast in 2050.
Adaptability and Flexibility
Key findings: The Master Plan has been developed and future-proof tested to support a range of
aircraft mixes and operating models.
The design provides the flexibility to fully accommodate all airline types to address the wide range of
possible future traffic development scenarios identified by the Commission. This includes intensive
point to point short and long haul operations, as well as being able to fully accommodate transferring
passengers with a rapid minimum connect time of 30 minutes for an intra-terminal transfer and 45
minutes for an inter-terminal transfer. Gatwick Connect’s innovative use of technology to facilitate
transfers is a first for airports worldwide and demonstrates the innovation embedded in the scheme
design.
This flexibility and adaptability is central to the provision of sustainable long term infrastructure
capacity. For example, a variety of midfield apron and pier configurations can be accommodated
within the taxiway geometry which will allow different arrangements of gate sizes, loading bridges,
walk-out gates and remote stands. These configurations have been tested against the varying
requirements of full service hub, low cost carrier, long-haul point to point and domestic regional airline
models.
The development of the Gatwick Gateway interchange, new rolling stock, redevelopment of London
stations and new and refurbished airport facilities will ensure the required surface access capacity is
provided and, as importantly, that the whole passenger experience is fit for a national gateway for the
UK in the 21st century.
SD1 Strategic Argument – 2.Strategic Fit
Response to Airports Commission Updated Scheme Design 63
2.4 Delivery
Context
The UK cannot afford to choose a scheme where there is a significant risk to delivery. Therefore there
is a need for a scheme that:
Is deliverable in planning and political terms;
Is simple and low risk to build and operate, not overly complex;
Has cost and time certainty;
Avoids over dependence on one airline or airline business model;
Can and will be financed without government subsidy;
Is deliverable in planning and political terms.
The Gatwick scheme is a relatively straightforward construction project. The phased approach to
delivering the Master Plan will align investment with passenger demand, and ensure scheme costs
are kept low. In summary, the Gatwick scheme:
Is phased to de-risk schedule, construction and delivery with minimal impacts on the wider
community;
Does not rely on any additional Government funds and has a financing strategy that is sustainable
and robust;
Delivers £79bn economic benefits for the UK in aggregate, plus a further £10-14bn of indirect
competition benefits, as well as significant benefits for the local community;
Works with the local community in taking this case forward and delivers to the community
significant new jobs, and longer term benefits;
Minimises environmental impacts.
Our approach has been developed in conjunction with relevent economic, construction, and financial
experts which gives very high degree of confidence that the delivery of a second runway at Gatwick
will be delivered at much lower cost than Heathrow, be open significantly sooner (by 2025), deliver
more capacity and generate over £40bn more in economic benefits than Heathrow.
The risks associated with the Heathrow scheme are many and significant. The planning,
environmental, surface access and political challenges associated with a Heathrow option mean there
must be significant doubt as to whether another runway there would ever be built.
Expansion at Gatwick is more deliverable than the Heathrow options, gives much greater certainty,
and does not put at risk the benefits of new runway capacity for the South East within the
Commission’s stated timeframe.
SD1 Strategic Argument – 2. Strategic Fit
64 Response to Airports Commission Updated Scheme Design
Timing
Key findings: We have a high degree of confidence that we can open the new runway by 2025.
Construction could commence before the end of the next Parliament. A third runway at Heathrow
is unlikely to be available before 2030 significantly delaying the economic benefits of new
runway capacity.
The key risks to this are achieving the dates for the subsequent incorporation of the Airports Commission’s recommendations into the National Policy Statement, and ultimately the Development Consent Order (DCO) process.
Gatwick has a much higher likelihood of achieving the Development Consent Order due to pre-existing safeguarding of the site for airport development, unlike Heathrow where significant land has to be acquired leading to major displacement of people and businesses.
The key risks for Gatwick to manage are land and property acquisition in time to support construction activity, the agreement of airspace re-design and subsequent commissioning of the runway and associated infrastructure.
Realistically, a third runway at Heathrow is unlikely to be available before 2030. This is due to the complexity of adding infrastructure to an already constrained and dispersed airport site Accordingly, in the years between 2025 and 2030 – when existing runways at all London airports will essentially be full – only the Gatwick option will be able to provide the UK with much needed additional capacity. As a result, the economic benefits of new runway capacity will be delivered much earlier in the Gatwick solution.
Construction Viability
Key findings: The Gatwick Runway 2 Project is a simple construction project with none of the
extreme complexities faced by Heathrow. It will deliver more passengers than Heathrow expansion,
more capacity and the right type of capacity. It also delivers this earlier, with greater certainty and at
lower cost for airlines.
The Gatwick Runway 2 Project is simple by comparison to the Heathrow options since it:
Necessitates only minor land acquisition outside of the existing safeguarded areas with the majority of land in in agricultural or light industrial use;
Relies upon tried and trusted technical designs and engineering solutions;
Makes limited physical changes to the local natural and built environment;
Has no major interface challenges with road, rail or utility networks;
Can be developed largely in landside areas, independent of existing airside operations.
Accordingly, not only does this result in a relatively lower cost expansion in UK runway capacity, the programme is inherently low risk, and estimates and assessments can be made with a higher degree of confidence than a more complex infrastructure undertaking, such as Heathrow R3.
Construction of Heathrow R3 is a highly complex proposition which would include;
Diversion or tunnelling of the busiest section of the M25, Europe’s busiest motorway;
Closure or diversion of two major A roads, the A4 and the A3044;
Maintaining access to a fully operational Terminal 5 during construction of Terminal 6;

SD1 Strategic Argument – 2.Strategic Fit
Response to Airports Commission Updated Scheme Design 65
A considerably longer construction period than at Gatwick;
Impact of construction in terms of traffic, pollution, noise and replacement of rail access for construction in an already over congested area;
Reliance on third parties re-provision (for example in relation to existing landfill and waste to energy sites which must be re-provided before construction can take place).
The Heathrow proposal also requires significant residential, industrial and commercial land take leading to relocation of many more people and businesses than the Gatwick solution.
Local Engagement
Key findings: Gatwick has more support from its local communities than Heathrow.
Extensive engagement has already been undertaken with local communities, politicians, passengers, business and the airport’s staff. In addition Gatwick has:
Established effective working relationships with a wide-ranging network of consultees and stakeholders who will be closely involved in current and future engagement on the second runway;
Undertaken specific engagement on surface access with the local community via a dedicated forum with over 70 member organisations;
Implemented of a Noise Action Plan to measure the airport’s performance on noise management and mitigation over the next five years;
Demonstrated its commitments to tacking environmental impacts by achieving its air quality and carbon emission goals every year.
Cost
Key findings: The delivery cost for Gatwick is significantly lower at £7.8bn compared to £17bn for
Heathrow. The risk around the Gatwick figure is also far lower given the simpler construction scheme.
The delivery cost (at 2014 prices) of the Gatwick scheme is £7.8bn compared to £17bn for Heathrow, providing lower costs for airlines and passengers and lower costs to the taxpayer (Heathrow indicated a requirement for approximately £4-6 billion of Government subsidies in its 2013 submission).
In contrast, Gatwick’s airport related investment will be entirely privately funded, and the vast majority of surface access needs for the second runway can be accommodated within already committed road and rail schemes.
We have robustly modelled the risks and carried out an intensive cost review process. Our cost basis has been developed by Turner & Townsend with support from Bechtel. This work is informed by Gatwick’s data from over £1bn of successfully delivered infrastructure in recent years, and independent consultant benchmarks that substantiate over 70% by value of our capital cost forecast.
The first phase of the programme, which includes the opening of the new runway by 2025, requires only a £2.1bn investment (out of a total of £7.8bn). This ensures the key aviation demand is met at the earliest opportunity, whilst reducing the financing pressures at the most pivotal point and moderating charges paid by airport users.
Subsequent expansion phases of the programme then follow in line with aviation demand as outlined in the figure below. This economically rational approach ensures the interests of users, bond holders and equity investors are all aligned.
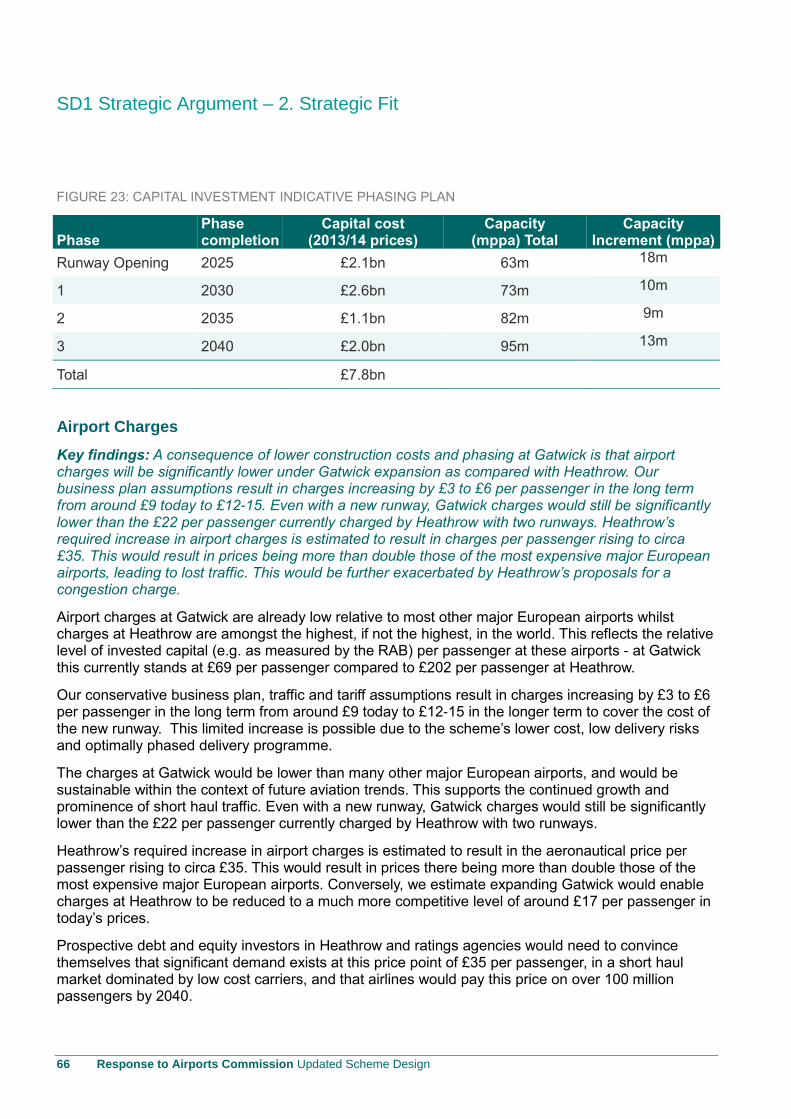
SD1 Strategic Argument – 2. Strategic Fit
66 Response to Airports Commission Updated Scheme Design
FIGURE 23: CAPITAL INVESTMENT INDICATIVE PHASING PLAN
Phase Phase completion
Capital cost (2013/14 prices)
Capacity (mppa) Total
Capacity Increment (mppa)
Runway Opening 2025 £2.1bn 63m 18m
1 2030 £2.6bn 73m 10m
2 2035 £1.1bn 82m 9m
3 2040 £2.0bn 95m 13m
Total
£7.8bn
Airport Charges
Key findings: A consequence of lower construction costs and phasing at Gatwick is that airport charges will be significantly lower under Gatwick expansion as compared with Heathrow. Our business plan assumptions result in charges increasing by £3 to £6 per passenger in the long term from around £9 today to £12-15. Even with a new runway, Gatwick charges would still be significantly lower than the £22 per passenger currently charged by Heathrow with two runways. Heathrow’s required increase in airport charges is estimated to result in charges per passenger rising to circa £35. This would result in prices being more than double those of the most expensive major European airports, leading to lost traffic. This would be further exacerbated by Heathrow’s proposals for a congestion charge.
Airport charges at Gatwick are already low relative to most other major European airports whilst charges at Heathrow are amongst the highest, if not the highest, in the world. This reflects the relative level of invested capital (e.g. as measured by the RAB) per passenger at these airports - at Gatwick this currently stands at £69 per passenger compared to £202 per passenger at Heathrow.
Our conservative business plan, traffic and tariff assumptions result in charges increasing by £3 to £6 per passenger in the long term from around £9 today to £12-15 in the longer term to cover the cost of the new runway. This limited increase is possible due to the scheme’s lower cost, low delivery risks and optimally phased delivery programme.
The charges at Gatwick would be lower than many other major European airports, and would be sustainable within the context of future aviation trends. This supports the continued growth and prominence of short haul traffic. Even with a new runway, Gatwick charges would still be significantly lower than the £22 per passenger currently charged by Heathrow with two runways.
Heathrow’s required increase in airport charges is estimated to result in the aeronautical price per passenger rising to circa £35. This would result in prices there being more than double those of the most expensive major European airports. Conversely, we estimate expanding Gatwick would enable charges at Heathrow to be reduced to a much more competitive level of around £17 per passenger in today’s prices.
Prospective debt and equity investors in Heathrow and ratings agencies would need to convince themselves that significant demand exists at this price point of £35 per passenger, in a short haul market dominated by low cost carriers, and that airlines would pay this price on over 100 million passengers by 2040.
SD1 Strategic Argument – 2.Strategic Fit
Response to Airports Commission Updated Scheme Design 67
In addition Heathrow’s proposals for a congestion charge would add significantly to the effective cost per passenger for many years.
Financing
Key findings: Gatwick can finance the second runway and associated passenger infrastructure with
no requirement for additional Government support. The deliverability, affordability and financeability of
Gatwick’s proposal is assured with a significantly higher level of confidence than Heathrow’s far more
expensive and riskier proposal.
Gatwick’s analysis indicates that the £7.8bn capital cost of a second runway would be financed
through debt and equity, comprised of retained and reinvested surplus cash
flows and new equity injections. The debt markets and shareholders can provide this without any
additional Government support.
The track record of recent debt issues by Gatwick, the airport sector and, more widely, UK
infrastructure supports this statement. In 2013, UK infrastructure raised £7bn in bond financing. More
specifically, Gatwick’s last five public bonds attracted bids from bond investors in countries.
worth of orders was received from investors and Gatwick has so far raised in the
bond markets to date. Gatwick also has the option to fund from the global capital markets to optimise
the funding mix, as well as utilize new funding such as the European Investment Bank (EIB) who have
approached Gatwick to offer its financial support. Gatwick has a strong credit rating (BBB+) with the
major credit rating agencies (Fitch / Standard & Poor’s) which it can build upon to deliver additional
debt financing.
Gatwick’s existing shareholders have the resources to meet the existing equity funding requirement of
out of operating cash flow and through new equity. In contrast, Heathrow would require
of debt and of equity.
This assumes that appropriate contractual and/or regulatory arrangements are put in place to provide
certainty and clarity for Gatwick’s equity and debt providers, and for its airline customers.
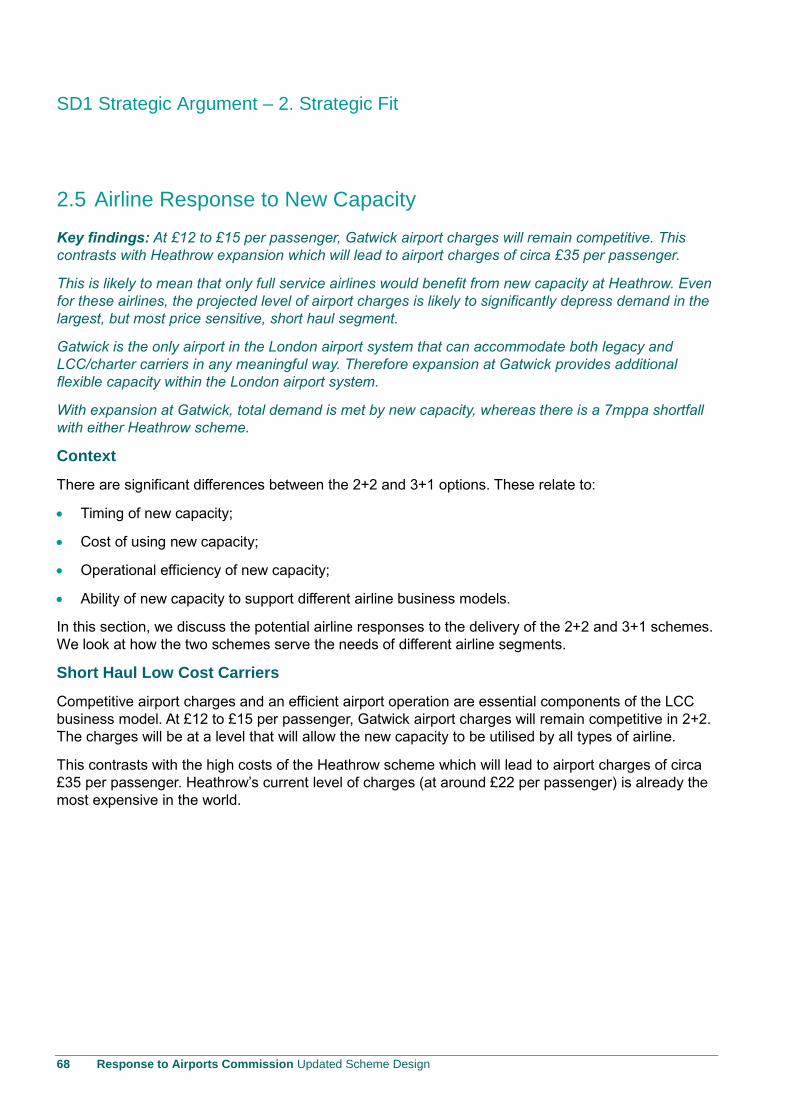
SD1 Strategic Argument – 2. Strategic Fit
68 Response to Airports Commission Updated Scheme Design
2.5 Airline Response to New Capacity
Key findings: At £12 to £15 per passenger, Gatwick airport charges will remain competitive. This
contrasts with Heathrow expansion which will lead to airport charges of circa £35 per passenger.
This is likely to mean that only full service airlines would benefit from new capacity at Heathrow. Even
for these airlines, the projected level of airport charges is likely to significantly depress demand in the
largest, but most price sensitive, short haul segment.
Gatwick is the only airport in the London airport system that can accommodate both legacy and
LCC/charter carriers in any meaningful way. Therefore expansion at Gatwick provides additional
flexible capacity within the London airport system.
With expansion at Gatwick, total demand is met by new capacity, whereas there is a 7mppa shortfall
with either Heathrow scheme.
Context
There are significant differences between the 2+2 and 3+1 options. These relate to:
Timing of new capacity;
Cost of using new capacity;
Operational efficiency of new capacity;
Ability of new capacity to support different airline business models.
In this section, we discuss the potential airline responses to the delivery of the 2+2 and 3+1 schemes.
We look at how the two schemes serve the needs of different airline segments.
Short Haul Low Cost Carriers
Competitive airport charges and an efficient airport operation are essential components of the LCC
business model. At £12 to £15 per passenger, Gatwick airport charges will remain competitive in 2+2.
The charges will be at a level that will allow the new capacity to be utilised by all types of airline.
This contrasts with the high costs of the Heathrow scheme which will lead to airport charges of circa
£35 per passenger. Heathrow’s current level of charges (at around £22 per passenger) is already the
most expensive in the world.
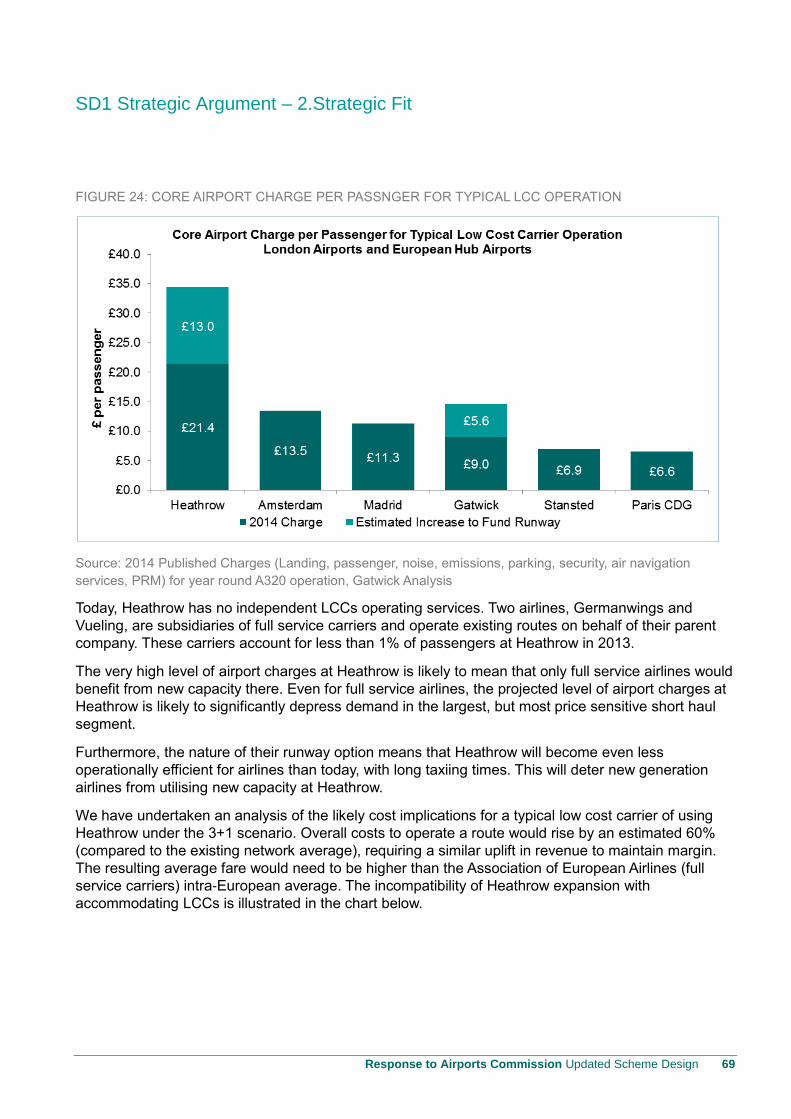
SD1 Strategic Argument – 2.Strategic Fit
Response to Airports Commission Updated Scheme Design 69
FIGURE 24: CORE AIRPORT CHARGE PER PASSNGER FOR TYPICAL LCC OPERATION
Source: 2014 Published Charges (Landing, passenger, noise, emissions, parking, security, air navigation
services, PRM) for year round A320 operation, Gatwick Analysis
Today, Heathrow has no independent LCCs operating services. Two airlines, Germanwings and
Vueling, are subsidiaries of full service carriers and operate existing routes on behalf of their parent
company. These carriers account for less than 1% of passengers at Heathrow in 2013.
The very high level of airport charges at Heathrow is likely to mean that only full service airlines would
benefit from new capacity there. Even for full service airlines, the projected level of airport charges at
Heathrow is likely to significantly depress demand in the largest, but most price sensitive short haul
segment.
Furthermore, the nature of their runway option means that Heathrow will become even less
operationally efficient for airlines than today, with long taxiing times. This will deter new generation
airlines from utilising new capacity at Heathrow.
We have undertaken an analysis of the likely cost implications for a typical low cost carrier of using
Heathrow under the 3+1 scenario. Overall costs to operate a route would rise by an estimated 60%
(compared to the existing network average), requiring a similar uplift in revenue to maintain margin.
The resulting average fare would need to be higher than the Association of European Airlines (full
service carriers) intra-European average. The incompatibility of Heathrow expansion with
accommodating LCCs is illustrated in the chart below.
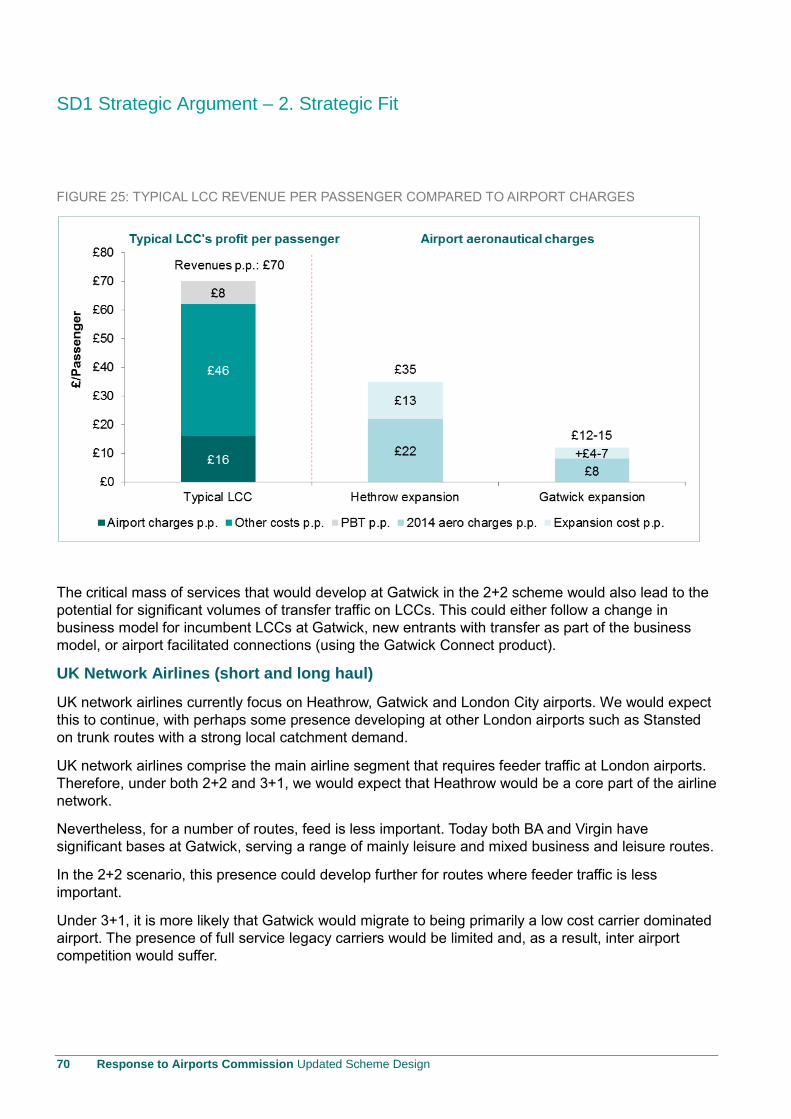
SD1 Strategic Argument – 2. Strategic Fit
70 Response to Airports Commission Updated Scheme Design
FIGURE 25: TYPICAL LCC REVENUE PER PASSENGER COMPARED TO AIRPORT CHARGES
The critical mass of services that would develop at Gatwick in the 2+2 scheme would also lead to the
potential for significant volumes of transfer traffic on LCCs. This could either follow a change in
business model for incumbent LCCs at Gatwick, new entrants with transfer as part of the business
model, or airport facilitated connections (using the Gatwick Connect product).
UK Network Airlines (short and long haul)
UK network airlines currently focus on Heathrow, Gatwick and London City airports. We would expect
this to continue, with perhaps some presence developing at other London airports such as Stansted
on trunk routes with a strong local catchment demand.
UK network airlines comprise the main airline segment that requires feeder traffic at London airports.
Therefore, under both 2+2 and 3+1, we would expect that Heathrow would be a core part of the airline
network.
Nevertheless, for a number of routes, feed is less important. Today both BA and Virgin have
significant bases at Gatwick, serving a range of mainly leisure and mixed business and leisure routes.
In the 2+2 scenario, this presence could develop further for routes where feeder traffic is less
important.
Under 3+1, it is more likely that Gatwick would migrate to being primarily a low cost carrier dominated
airport. The presence of full service legacy carriers would be limited and, as a result, inter airport
competition would suffer.
SD1 Strategic Argument – 2.Strategic Fit
Response to Airports Commission Updated Scheme Design 71
Foreign Network Airlines (short haul)
For short haul foreign carriers, feed is already limited at Heathrow and of little economic value.
However, having a competitive schedule in terms of frequency and timings is of much greater
importance.
Under 2+2, we would expect that major short haul trunk routes would be served from both Heathrow
and Gatwick by foreign legacy airlines. Thinner routes would be served from just Gatwick (due to
reasons of cost / efficiency and slots) whilst medium sized markets would be concentrated on
Heathrow. The current attractiveness that Heathrow enjoys due to its greater critical mass of services
would be eliminated over time.
Foreign Network Airlines (Long Haul) and Long Haul Low Cost
For long haul, we forecast that foreign airlines and low cost airlines will erode the market share of UK
network airlines. This is due to the structural changes in the industry previously discussed, including
the expected stronger demand growth from the non-London end of the route.
The need to operate to a hub at the London end is of limited importance to these types of airlines. The
exception is if a foreign network carrier is cooperating with a UK network airline at Heathrow. Even
then, this is fairly marginal for routes eastwards (due to geographic factors).
Therefore, we anticipate that under 2+2, Gatwick would develop a wide range of long haul services,
focussing on emerging markets. Some feed would naturally emerge given the range of both short haul
and long haul routes that will develop. There would be some duplication of routes between Heathrow
and Gatwick, while Heathrow is likely to retain its pre-eminent position for services to North America
and the Indian sub-continent.
In the 3+1 scenario, long haul will be dominated by UK network airlines. The conditions would not be
in place for the growth of different airline models. While Gatwick would maintain a long haul
programme, it would tend to focus largely on leisure destinations and would not provide strong
competition to operators at Heathrow.
Ability of Schemes to Accommodate Demand
Today, Gatwick serves all of the main airline business models (full service, low cost and charter
airlines) in all key markets (domestic, short haul and long haul). The combination of a strong
catchment, efficient infrastructure and low airport charges make it attractive to all types of airlines as
shown in the figure below.
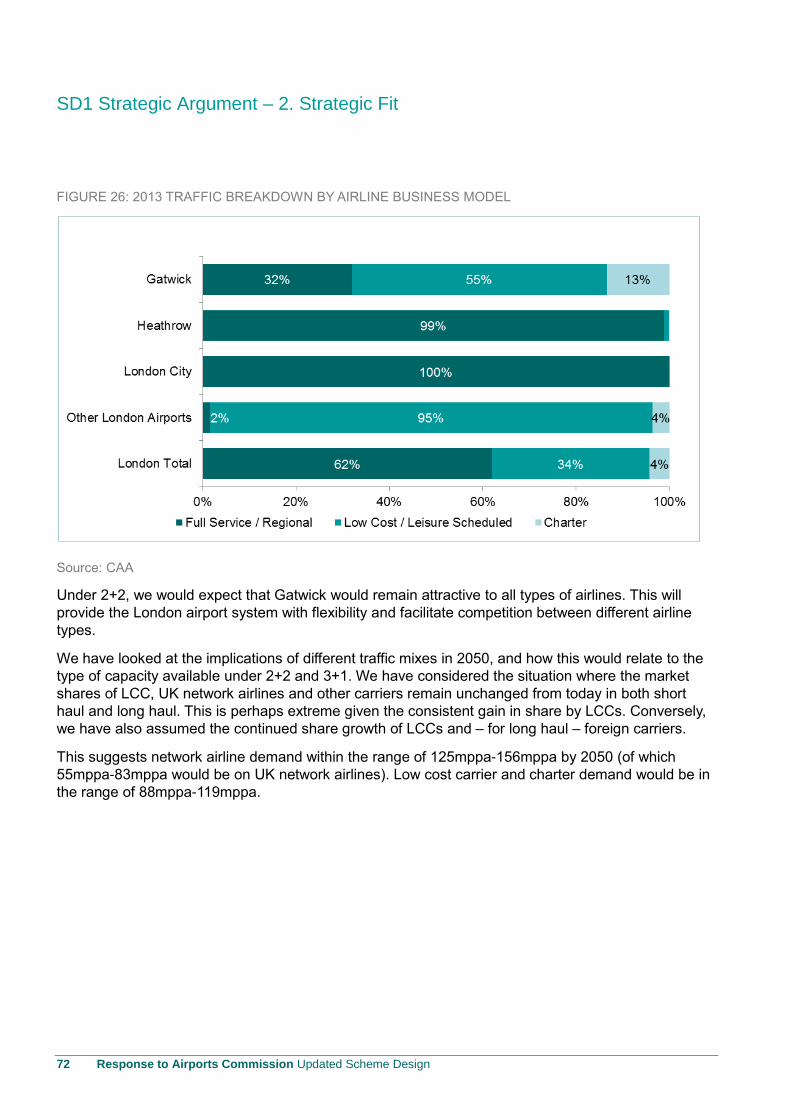
SD1 Strategic Argument – 2. Strategic Fit
72 Response to Airports Commission Updated Scheme Design
FIGURE 26: 2013 TRAFFIC BREAKDOWN BY AIRLINE BUSINESS MODEL
Source: CAA
Under 2+2, we would expect that Gatwick would remain attractive to all types of airlines. This will
provide the London airport system with flexibility and facilitate competition between different airline
types.
We have looked at the implications of different traffic mixes in 2050, and how this would relate to the
type of capacity available under 2+2 and 3+1. We have considered the situation where the market
shares of LCC, UK network airlines and other carriers remain unchanged from today in both short
haul and long haul. This is perhaps extreme given the consistent gain in share by LCCs. Conversely,
we have also assumed the continued share growth of LCCs and – for long haul – foreign carriers.
This suggests network airline demand within the range of 125mppa-156mppa by 2050 (of which
55mppa-83mppa would be on UK network airlines). Low cost carrier and charter demand would be in
the range of 88mppa-119mppa.
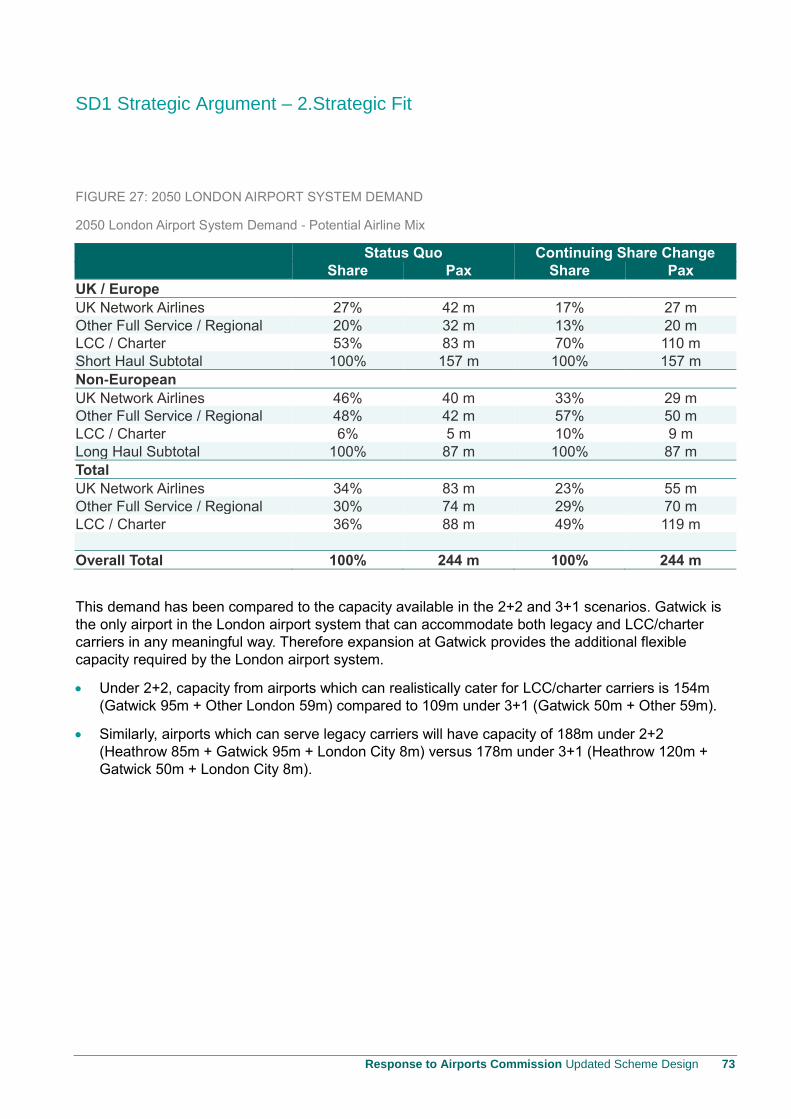
SD1 Strategic Argument – 2.Strategic Fit
Response to Airports Commission Updated Scheme Design 73
FIGURE 27: 2050 LONDON AIRPORT SYSTEM DEMAND
2050 London Airport System Demand - Potential Airline Mix
Status Quo Continuing Share Change
Share Pax Share Pax
UK / Europe UK Network Airlines 27% 42 m 17% 27 m
Other Full Service / Regional 20% 32 m 13% 20 m
LCC / Charter 53% 83 m 70% 110 m
Short Haul Subtotal 100% 157 m 100% 157 m
Non-European UK Network Airlines 46% 40 m 33% 29 m
Other Full Service / Regional 48% 42 m 57% 50 m
LCC / Charter 6% 5 m 10% 9 m
Long Haul Subtotal 100% 87 m 100% 87 m
Total UK Network Airlines 34% 83 m 23% 55 m
Other Full Service / Regional 30% 74 m 29% 70 m
LCC / Charter 36% 88 m 49% 119 m
Overall Total 100% 244 m 100% 244 m
This demand has been compared to the capacity available in the 2+2 and 3+1 scenarios. Gatwick is
the only airport in the London airport system that can accommodate both legacy and LCC/charter
carriers in any meaningful way. Therefore expansion at Gatwick provides the additional flexible
capacity required by the London airport system.
Under 2+2, capacity from airports which can realistically cater for LCC/charter carriers is 154m
(Gatwick 95m + Other London 59m) compared to 109m under 3+1 (Gatwick 50m + Other 59m).
Similarly, airports which can serve legacy carriers will have capacity of 188m under 2+2
(Heathrow 85m + Gatwick 95m + London City 8m) versus 178m under 3+1 (Heathrow 120m +
Gatwick 50m + London City 8m).
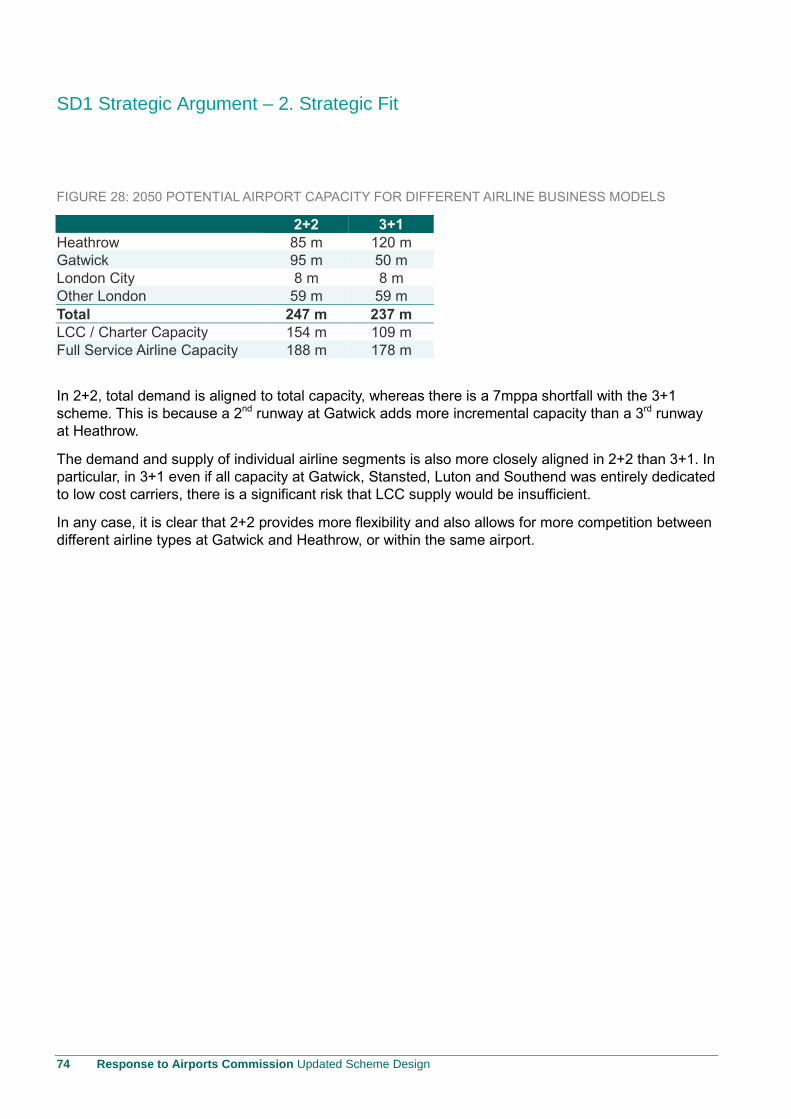
SD1 Strategic Argument – 2. Strategic Fit
74 Response to Airports Commission Updated Scheme Design
FIGURE 28: 2050 POTENTIAL AIRPORT CAPACITY FOR DIFFERENT AIRLINE BUSINESS MODELS
2+2 3+1
Heathrow 85 m 120 m
Gatwick 95 m 50 m
London City 8 m 8 m
Other London 59 m 59 m
Total 247 m 237 m
LCC / Charter Capacity 154 m 109 m
Full Service Airline Capacity 188 m 178 m
In 2+2, total demand is aligned to total capacity, whereas there is a 7mppa shortfall with the 3+1
scheme. This is because a 2nd runway at Gatwick adds more incremental capacity than a 3rd runway
at Heathrow.
The demand and supply of individual airline segments is also more closely aligned in 2+2 than 3+1. In
particular, in 3+1 even if all capacity at Gatwick, Stansted, Luton and Southend was entirely dedicated
to low cost carriers, there is a significant risk that LCC supply would be insufficient.
In any case, it is clear that 2+2 provides more flexibility and also allows for more competition between
different airline types at Gatwick and Heathrow, or within the same airport.
SD1 Strategic Argument – 2.Strategic Fit
Response to Airports Commission Updated Scheme Design 75
Airports Commission Scenarios
Key findings: As new runway capacity at Gatwick would be suitable for all types of airlines, the
Gatwick solution is more future proof, and sufficiently robust and flexible to support the full range of
plausible outcomes.
We have considered the four scenarios outlined by the Airports Commission. As discussed above we
consider that the most likely outcome is a mix of Scenarios B and C which reflects a continuation of
existing trends.
Scenario A could be seen as consistent with the assumption that UK network airlines will retain their
existing market position. This results in demand for UK network airlines of 83mppa in 2050. However,
this would assume no further competitive inroads from the Middle East carriers and new low cost long
haul carriers and no impact from the new generation of hub buster aircraft, which appears an unlikely
outcome – discounting the validity of this scenario. In practice, some routes from UK network airlines
will have limited feed requirements and will be operated from London City and Gatwick. Furthermore,
in 2+2, Gatwick can also provide significant volumes of feed traffic.
Equally, foreign legacy airlines will still wish to access Heathrow. However, in broad terms, even in the
maximum hub and spoke scenario, sufficient hub capacity is available to meet needs.
Scenario B sees the requirement for more point to point capacity, with legacy airlines remaining
prominent. 2+2 would meet this need much better than 3+1 as more demand can be served from
local airports at much lower costs for airlines.
Low cost carriers are a key feature of Scenario C. Clearly, 2+2 is much better placed to meet this
scenario than 3+1.
Finally, the more pessimistic Scenario D also prioritises point to point capacity. In a weak demand
environment, the more competitive costs of 2+2 again make this a much more appropriate solution.
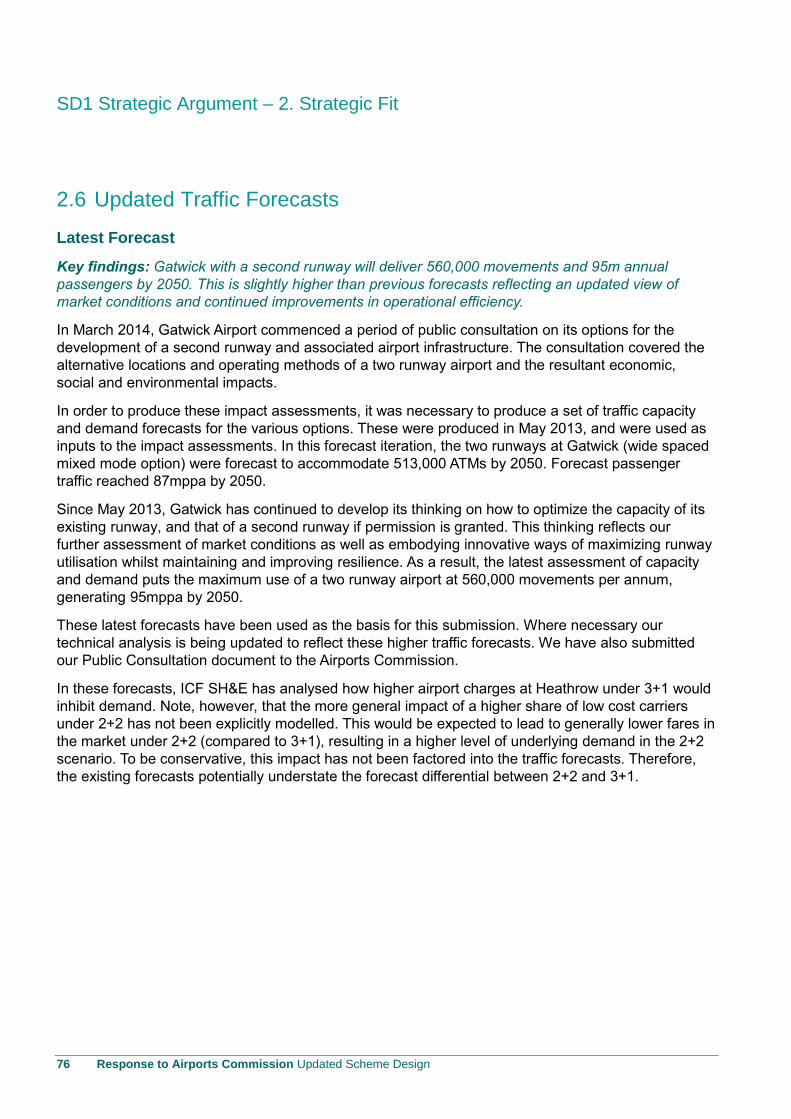
SD1 Strategic Argument – 2. Strategic Fit
76 Response to Airports Commission Updated Scheme Design
2.6 Updated Traffic Forecasts
Latest Forecast
Key findings: Gatwick with a second runway will deliver 560,000 movements and 95m annual
passengers by 2050. This is slightly higher than previous forecasts reflecting an updated view of
market conditions and continued improvements in operational efficiency.
In March 2014, Gatwick Airport commenced a period of public consultation on its options for the
development of a second runway and associated airport infrastructure. The consultation covered the
alternative locations and operating methods of a two runway airport and the resultant economic,
social and environmental impacts.
In order to produce these impact assessments, it was necessary to produce a set of traffic capacity
and demand forecasts for the various options. These were produced in May 2013, and were used as
inputs to the impact assessments. In this forecast iteration, the two runways at Gatwick (wide spaced
mixed mode option) were forecast to accommodate 513,000 ATMs by 2050. Forecast passenger
traffic reached 87mppa by 2050.
Since May 2013, Gatwick has continued to develop its thinking on how to optimize the capacity of its
existing runway, and that of a second runway if permission is granted. This thinking reflects our
further assessment of market conditions as well as embodying innovative ways of maximizing runway
utilisation whilst maintaining and improving resilience. As a result, the latest assessment of capacity
and demand puts the maximum use of a two runway airport at 560,000 movements per annum,
generating 95mppa by 2050.
These latest forecasts have been used as the basis for this submission. Where necessary our
technical analysis is being updated to reflect these higher traffic forecasts. We have also submitted
our Public Consultation document to the Airports Commission.
In these forecasts, ICF SH&E has analysed how higher airport charges at Heathrow under 3+1 would
inhibit demand. Note, however, that the more general impact of a higher share of low cost carriers
under 2+2 has not been explicitly modelled. This would be expected to lead to generally lower fares in
the market under 2+2 (compared to 3+1), resulting in a higher level of underlying demand in the 2+2
scenario. To be conservative, this impact has not been factored into the traffic forecasts. Therefore,
the existing forecasts potentially understate the forecast differential between 2+2 and 3+1.
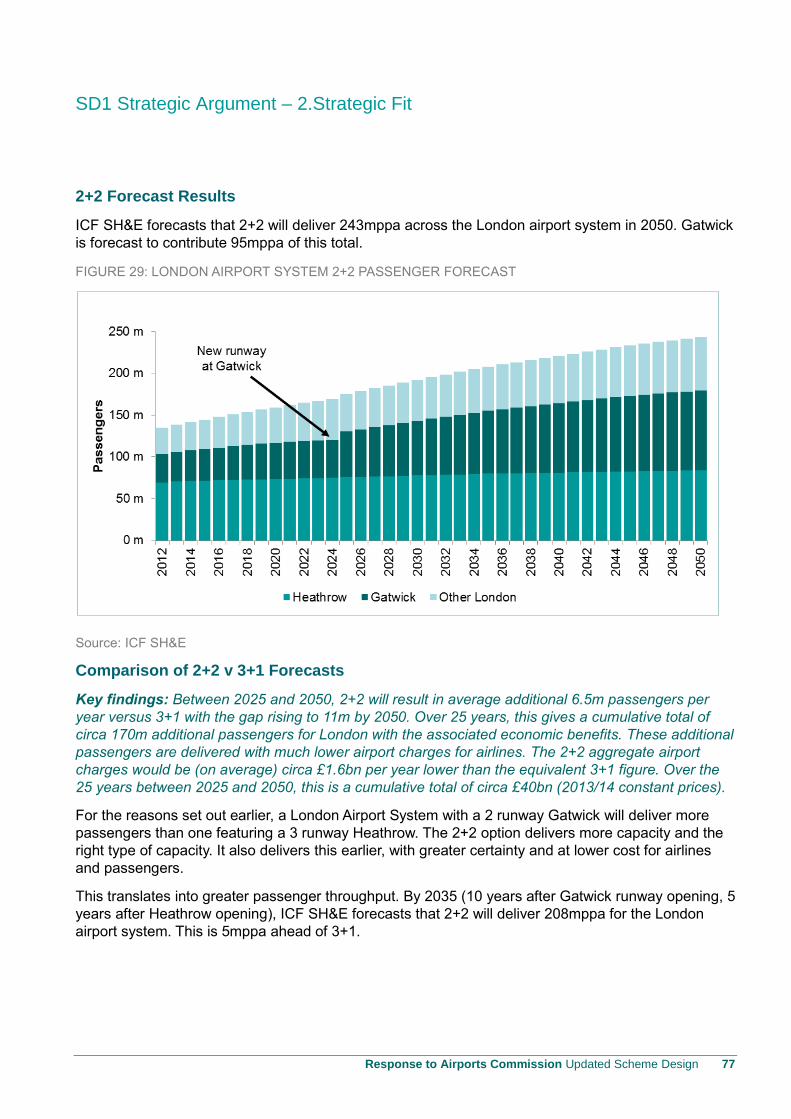
SD1 Strategic Argument – 2.Strategic Fit
Response to Airports Commission Updated Scheme Design 77
2+2 Forecast Results
ICF SH&E forecasts that 2+2 will deliver 243mppa across the London airport system in 2050. Gatwick
is forecast to contribute 95mppa of this total.
FIGURE 29: LONDON AIRPORT SYSTEM 2+2 PASSENGER FORECAST
Source: ICF SH&E
Comparison of 2+2 v 3+1 Forecasts
Key findings: Between 2025 and 2050, 2+2 will result in average additional 6.5m passengers per
year versus 3+1 with the gap rising to 11m by 2050. Over 25 years, this gives a cumulative total of
circa 170m additional passengers for London with the associated economic benefits. These additional
passengers are delivered with much lower airport charges for airlines. The 2+2 aggregate airport
charges would be (on average) circa £1.6bn per year lower than the equivalent 3+1 figure. Over the
25 years between 2025 and 2050, this is a cumulative total of circa £40bn (2013/14 constant prices).
For the reasons set out earlier, a London Airport System with a 2 runway Gatwick will deliver more
passengers than one featuring a 3 runway Heathrow. The 2+2 option delivers more capacity and the
right type of capacity. It also delivers this earlier, with greater certainty and at lower cost for airlines
and passengers.
This translates into greater passenger throughput. By 2035 (10 years after Gatwick runway opening, 5
years after Heathrow opening), ICF SH&E forecasts that 2+2 will deliver 208mppa for the London
airport system. This is 5mppa ahead of 3+1.
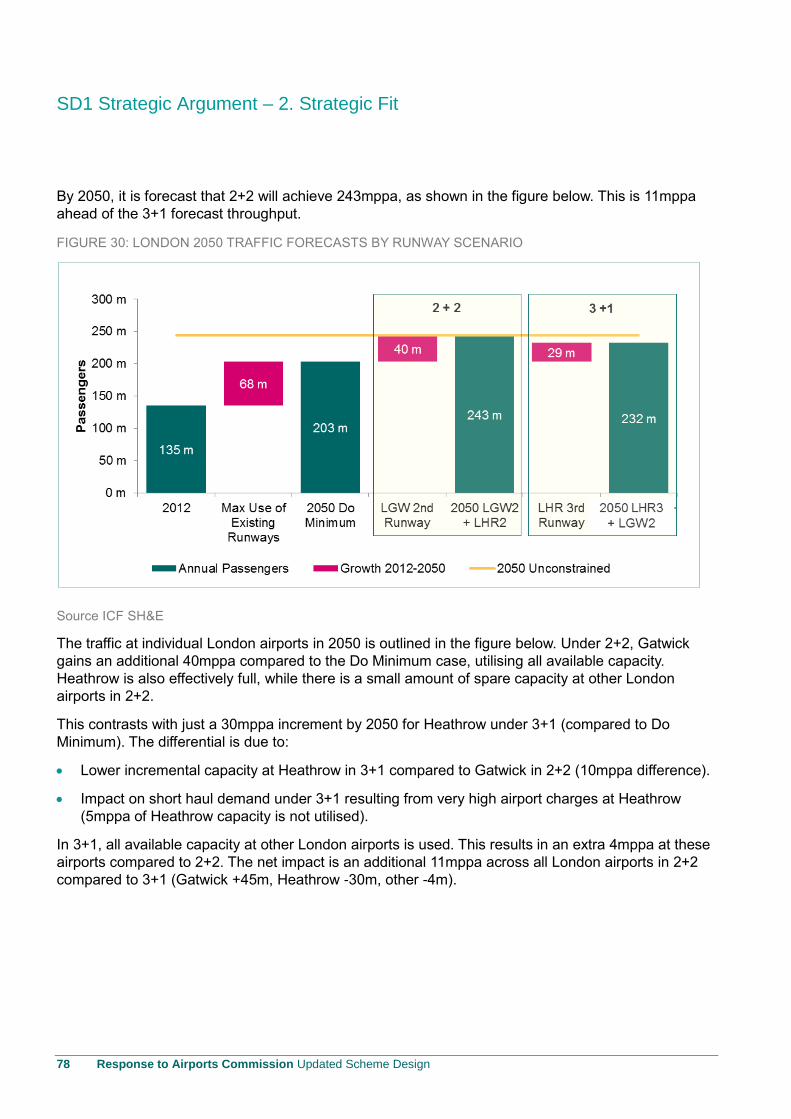
SD1 Strategic Argument – 2. Strategic Fit
78 Response to Airports Commission Updated Scheme Design
By 2050, it is forecast that 2+2 will achieve 243mppa, as shown in the figure below. This is 11mppa
ahead of the 3+1 forecast throughput.
FIGURE 30: LONDON 2050 TRAFFIC FORECASTS BY RUNWAY SCENARIO
Source ICF SH&E
The traffic at individual London airports in 2050 is outlined in the figure below. Under 2+2, Gatwick
gains an additional 40mppa compared to the Do Minimum case, utilising all available capacity.
Heathrow is also effectively full, while there is a small amount of spare capacity at other London
airports in 2+2.
This contrasts with just a 30mppa increment by 2050 for Heathrow under 3+1 (compared to Do
Minimum). The differential is due to:
Lower incremental capacity at Heathrow in 3+1 compared to Gatwick in 2+2 (10mppa difference).
Impact on short haul demand under 3+1 resulting from very high airport charges at Heathrow
(5mppa of Heathrow capacity is not utilised).
In 3+1, all available capacity at other London airports is used. This results in an extra 4mppa at these
airports compared to 2+2. The net impact is an additional 11mppa across all London airports in 2+2
compared to 3+1 (Gatwick +45m, Heathrow -30m, other -4m).
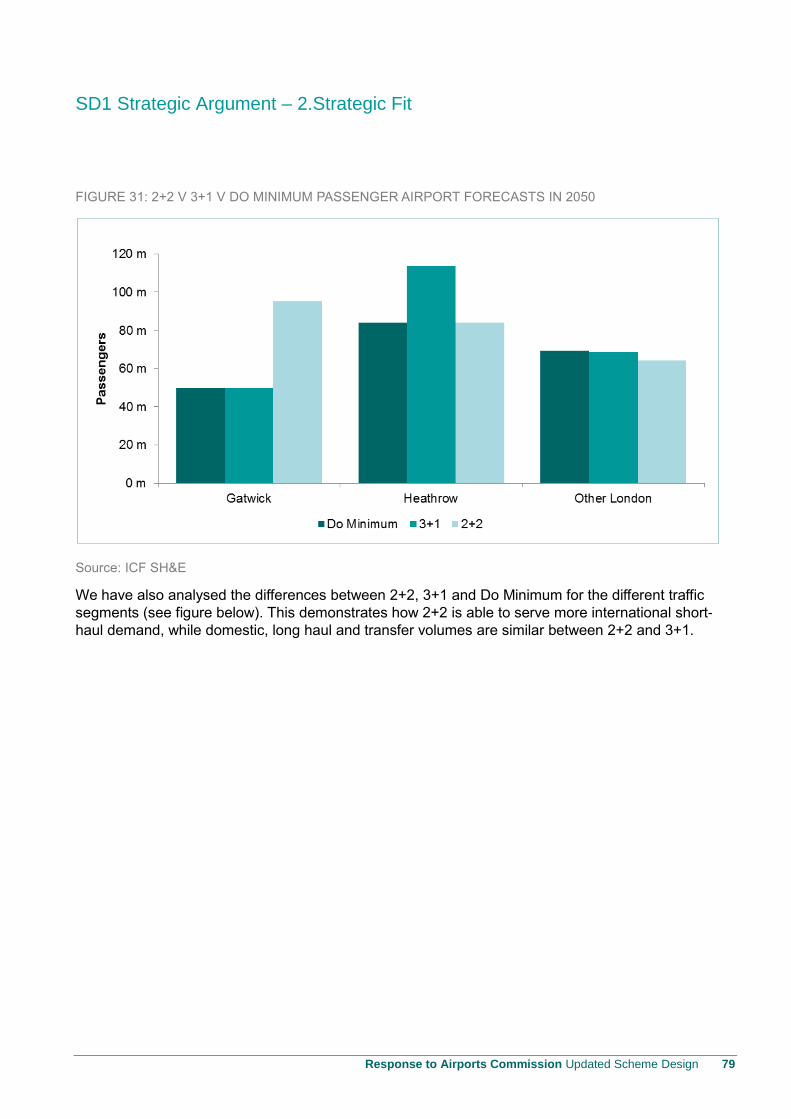
SD1 Strategic Argument – 2.Strategic Fit
Response to Airports Commission Updated Scheme Design 79
FIGURE 31: 2+2 V 3+1 V DO MINIMUM PASSENGER AIRPORT FORECASTS IN 2050
Source: ICF SH&E
We have also analysed the differences between 2+2, 3+1 and Do Minimum for the different traffic
segments (see figure below). This demonstrates how 2+2 is able to serve more international short-
haul demand, while domestic, long haul and transfer volumes are similar between 2+2 and 3+1.

SD1 Strategic Argument – 2. Strategic Fit
80 Response to Airports Commission Updated Scheme Design
FIGURE 32: 2+2 V 3+1 V DO MINIMUM PASSENGER TYPE FORECASTS FOR LONDON IN 2050
Source ICF SH&E
Business passengers are forecast to remain a fairly constant proportion of O&D demand at around
24%. By 2050, this equates to circa 54mppa. The share of foreign passengers is expected to rise to
41% of O&D passengers by 2050 (to 91mppa).
Cumulative Impact of 2+2 v 3+1
Between 2025 and 2050, 2+2 will result in average additional 6.5m passengers per year versus 3+1.
Over 25 years, this gives a cumulative total of circa 170m additional passengers.
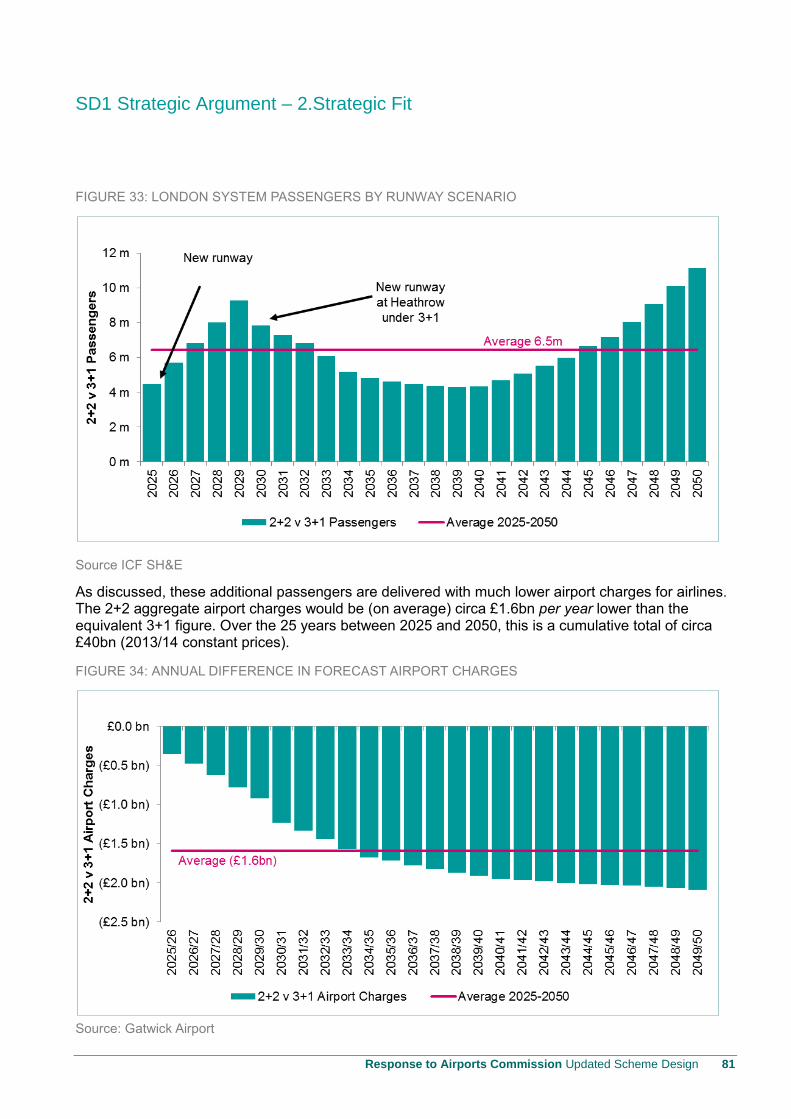
SD1 Strategic Argument – 2.Strategic Fit
Response to Airports Commission Updated Scheme Design 81
FIGURE 33: LONDON SYSTEM PASSENGERS BY RUNWAY SCENARIO
Source ICF SH&E
As discussed, these additional passengers are delivered with much lower airport charges for airlines. The 2+2 aggregate airport charges would be (on average) circa £1.6bn per year lower than the equivalent 3+1 figure. Over the 25 years between 2025 and 2050, this is a cumulative total of circa £40bn (2013/14 constant prices).
FIGURE 34: ANNUAL DIFFERENCE IN FORECAST AIRPORT CHARGES
Source: Gatwick Airport

SD1 Strategic Argument – 2. Strategic Fit
82 Response to Airports Commission Updated Scheme Design
2.7 Connectivity
Context
The quality of connectivity is defined in terms of three main factors:
Range of destinations served from convenient / local airports;
Schedule quality (frequency / timing);
Value for money / affordability of flying.
Our approach to forecasting future connectivity
ICF SH&E has forecast the route network from London (and individual airports) for the spot years of
2024, 2035 and 2050. This forecast has been undertaken by considering existing demand for
individual destinations, growth in demand over time, and when a market will become viable (in terms
of airline economics) and for what particular airline business model.
This approach reflects top down growth but also models how airlines are likely to react to new
opportunities. For some routes, feeder traffic is likely to continue to be an important component.
These are typically routes where London is in a strong geographical position for transfer traffic and
the underlying O&D demand is insufficiently strong. For other markets, low cost carriers (either short
haul or long haul) are the only suitable candidates for serving a new route. Finally, a range of routes
will be capable of being served by either network or point to point carriers or both.
The forecasts have been based on current airlines. Of course, by 2050, the airline structure will have
changed significantly from today. In the absence of any firm information on future airlines, the
projections have been tested against the airlines of today i.e. identifying a credible existing airline
candidate to serve a new route opportunity. The impact of new aircraft technology has been reflected
in the analysis.
The evolution of existing routes has also been modelled, with new airlines entering the market when a
minimum demand threshold has been exceeded.
This analysis has been undertaken for 2+2, 3+1 and the Do Minimum scenarios.
Clearly, for individual routes, the forecasts must be considered as indicative. However, at an
aggregate level, we believe the projections reflect the likely development of route networks under
different capacity outcomes.
Connectivity for the South East
Key findings: The dispersed nature of 2+2 will mean that more passengers will be able to fly from
their local or most convenient airport. The 2+2 solution will serve more destinations from London than
3+1 delivering 440 destinations in 2050 compared to 413.
The dispersed nature of 2+2 will mean that more passengers will be able to fly from their local or most
convenient airport. A two runway Gatwick will enable passengers in the Gatwick catchment to use the
airport for more destinations than if growth was concentrated at Heathrow. 2+2 will also provide more
choice for passengers in overlapping catchment areas.
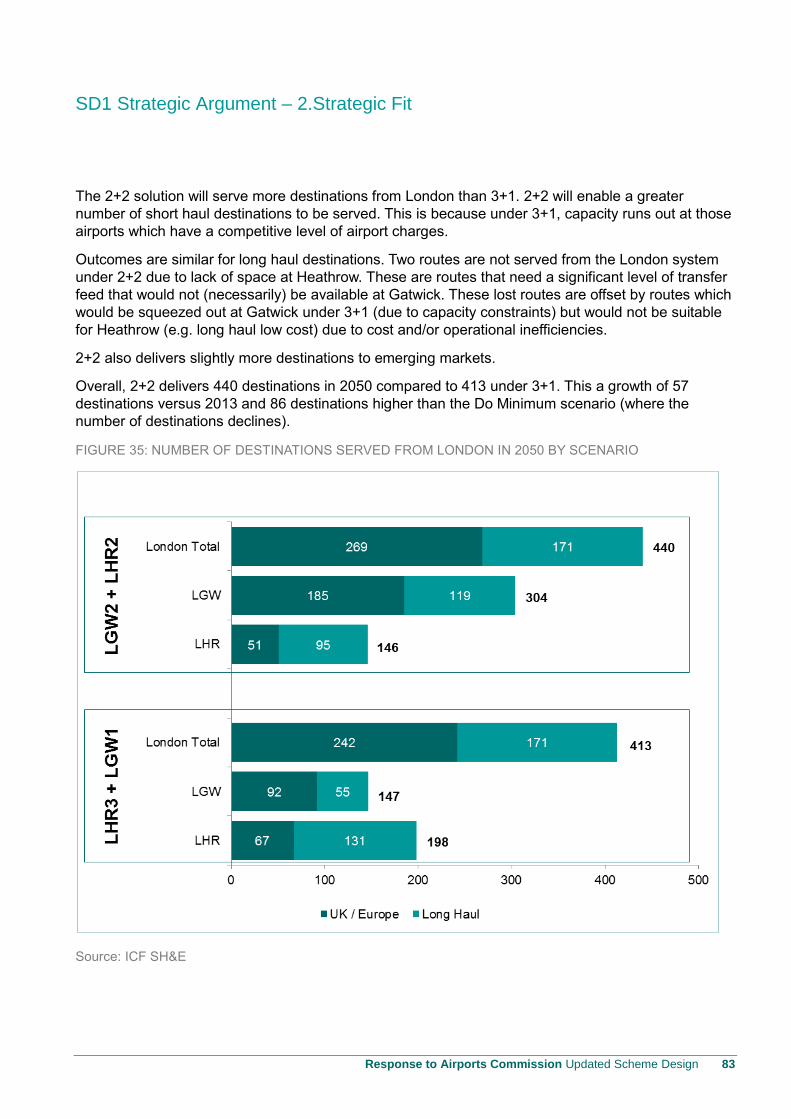
SD1 Strategic Argument – 2.Strategic Fit
Response to Airports Commission Updated Scheme Design 83
The 2+2 solution will serve more destinations from London than 3+1. 2+2 will enable a greater
number of short haul destinations to be served. This is because under 3+1, capacity runs out at those
airports which have a competitive level of airport charges.
Outcomes are similar for long haul destinations. Two routes are not served from the London system
under 2+2 due to lack of space at Heathrow. These are routes that need a significant level of transfer
feed that would not (necessarily) be available at Gatwick. These lost routes are offset by routes which
would be squeezed out at Gatwick under 3+1 (due to capacity constraints) but would not be suitable
for Heathrow (e.g. long haul low cost) due to cost and/or operational inefficiencies.
2+2 also delivers slightly more destinations to emerging markets.
Overall, 2+2 delivers 440 destinations in 2050 compared to 413 under 3+1. This a growth of 57
destinations versus 2013 and 86 destinations higher than the Do Minimum scenario (where the
number of destinations declines).
FIGURE 35: NUMBER OF DESTINATIONS SERVED FROM LONDON IN 2050 BY SCENARIO
Source: ICF SH&E
SD1 Strategic Argument – 2. Strategic Fit
84 Response to Airports Commission Updated Scheme Design
The number of destinations served with strong frequency has also been considered. We have
considered routes with a minimum threshold of 5 flights per week for long haul and 10 flights per week
for short haul destinations. 2+2 is also superior under this measure, with 296 routes served compared
to 292 under 3+1.
Furthermore, 2+2 will contribute more flights than 3+1 (almost 600 per week by 2050). Also, as
previously discussed, 2+2 is a more operationally efficient and much better value for money option
than 3+1, resulting in lower airport charges and consequently lower air fares for consumers.
Connectivity for UK regions
Key findings: The 2+2 solution will enhance connectivity from the regions. Gatwick already serves
more domestic destinations than Heathrow whose domestic services have been progressively cut
back of eliminated. Heathrow will continue to play an important role in connecting regional passengers
to the world. However, 2+2 would give regional passengers a genuine choice of two transfer points in
London and Gatwick would put in place mechanisms that will enhance regional connectivity further.
Given the high level of connectivity London already enjoys, connectivity is arguably an even more
important issue for the regions than it is for the South East of England.
We consider that the decision on where to place runway capacity in the South East should be part of
a set of measures to continue improving connectivity for the UK as a whole.
Over the last decade, regional connectivity has been transformed. There are more direct flights to
more destinations than ever before. Access to transfer hubs has also improved greatly, with regional
passengers having a much greater choice of airlines and hub airports for markets that are not
served direct.
Connectivity within the UK has benefited from upgraded rail infrastructure. However, domestic air
connectivity has declined, particularly due to increases in Air Passenger Duty.
It is imperative that future policy supports continued development of direct services from the regions
and access to a wide range of hub airports. Nevertheless, good connectivity to London from the
regions remains important.
The 2+2 solution will enhance connectivity from the regions. Gatwick already serves more domestic
destinations than Heathrow. In future, Heathrow will continue to play an important role in connecting
regional passengers to the world. However, 2+2 would give regional passengers a genuine choice of
two transfer points in London (as well as international hub airports).
A 2 runway Gatwick (with ultimately circa 95mppa) will provide many transfer options for regional
passengers (whether within an alliance, interline or self-connect).
With some route overlap between Heathrow and Gatwick, the 2+2 option would allow transfer
possibilities across a much wider range of destinations than by concentrating regional transfers at
Heathrow under 3+1.
2+2 would also facilitate transfer onto new generation airlines. This would not be possible at a
high cost and operationally inefficient Heathrow dominated by legacy carriers.
Transfer flights via Gatwick would be more competitively priced than via Heathrow (due to lower
airport charges and a different airline mix). The transfer experience would also be better, with
much lower minimum connect times due to the highly integrated and compact airport layout.
SD1 Strategic Argument – 2.Strategic Fit
Response to Airports Commission Updated Scheme Design 85
Under 2+2, businesses in the regions travelling to London would benefit from lower air fares. This
is particularly important for the increasing numbers of business people using low cost carriers.
Under 2+2, Gatwick would provide – alongside Heathrow – enhanced connectivity for regional
passengers. This could either emerge as a traditional two airport transfer system (e.g. Frankfurt and
Munich) or as a transfer system supporting separately legacy and new generation airlines (e.g.
Chicago O’Hare and Chicago Midway).
Gatwick would put in place other mechanisms that will enhance regional connectivity:
Incentives for additional and start-up regional services;
Competitive ongoing charging structures for regional services.
Ongoing marketing support to airlines offering regional services, including joint marketing with
regional airports where possible.
Radical development of the Gatwick Connect product to facilitate regional transfers.
Strong support for Government action to introduce Public Service Obligation (PSO) routes to
maintain and enhance regional connectivity.
Conclusion
The UK already enjoys excellent connectivity. This connectivity is provided by airports across the UK,
competing and complementing each other.
Only 2+2 will safeguard existing connectivity and deliver improvements in the future. A wider range of
destinations, better flight frequency, lower prices and more flights from local airports are a key feature
of the 2+2 proposition. This will benefit business, leisure and VFR passengers alike.
In summary, only 2+2 will maintain the UK’s status as Europe’s most important aviation hub in the
long term.
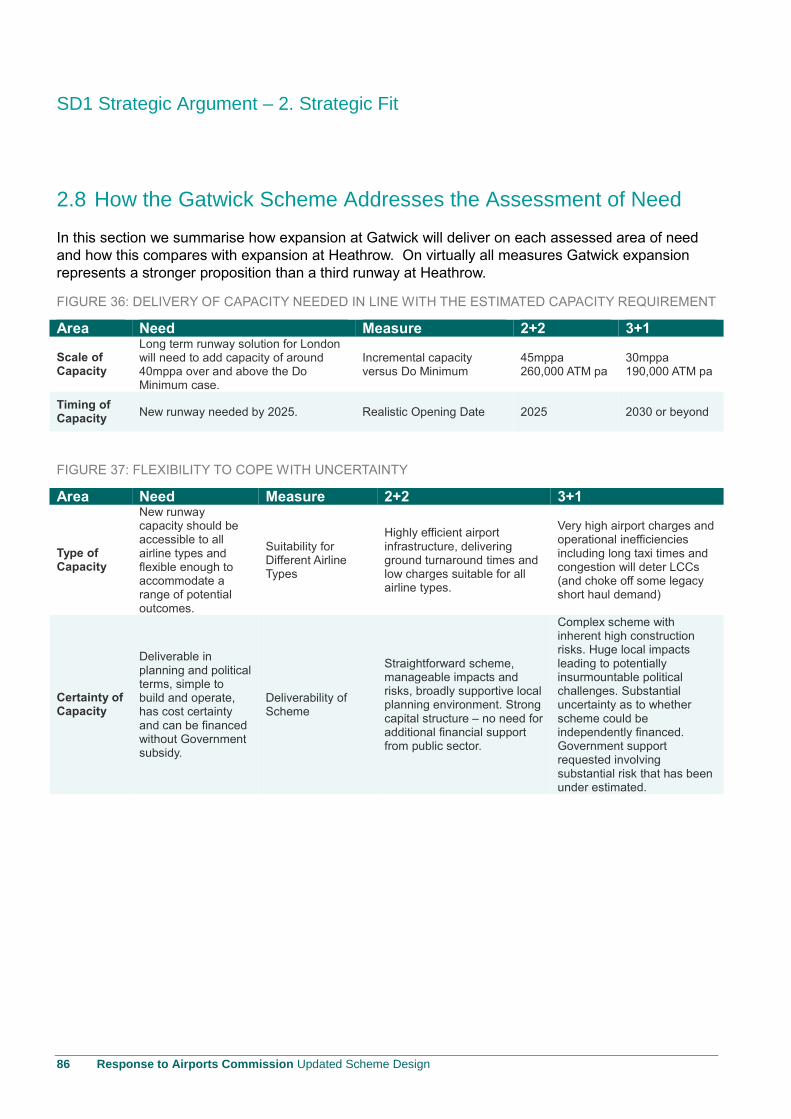
SD1 Strategic Argument – 2. Strategic Fit
86 Response to Airports Commission Updated Scheme Design
2.8 How the Gatwick Scheme Addresses the Assessment of Need
In this section we summarise how expansion at Gatwick will deliver on each assessed area of need
and how this compares with expansion at Heathrow. On virtually all measures Gatwick expansion
represents a stronger proposition than a third runway at Heathrow.
FIGURE 36: DELIVERY OF CAPACITY NEEDED IN LINE WITH THE ESTIMATED CAPACITY REQUIREMENT
Area Need Measure 2+2 3+1
Scale of Capacity
Long term runway solution for London will need to add capacity of around 40mppa over and above the Do Minimum case.
Incremental capacity versus Do Minimum
45mppa 260,000 ATM pa
30mppa 190,000 ATM pa
Timing of Capacity
New runway needed by 2025. Realistic Opening Date 2025 2030 or beyond
FIGURE 37: FLEXIBILITY TO COPE WITH UNCERTAINTY
Area Need Measure 2+2 3+1
Type of Capacity
New runway capacity should be accessible to all airline types and flexible enough to accommodate a range of potential outcomes.
Suitability for Different Airline Types
Highly efficient airport infrastructure, delivering ground turnaround times and low charges suitable for all airline types.
Very high airport charges and operational inefficiencies including long taxi times and congestion will deter LCCs (and choke off some legacy short haul demand)
Certainty of Capacity
Deliverable in planning and political terms, simple to build and operate, has cost certainty and can be financed without Government subsidy.
Deliverability of Scheme
Straightforward scheme, manageable impacts and risks, broadly supportive local planning environment. Strong capital structure – no need for additional financial support from public sector.
Complex scheme with inherent high construction risks. Huge local impacts leading to potentially insurmountable political challenges. Substantial uncertainty as to whether scheme could be independently financed. Government support requested involving substantial risk that has been under estimated.
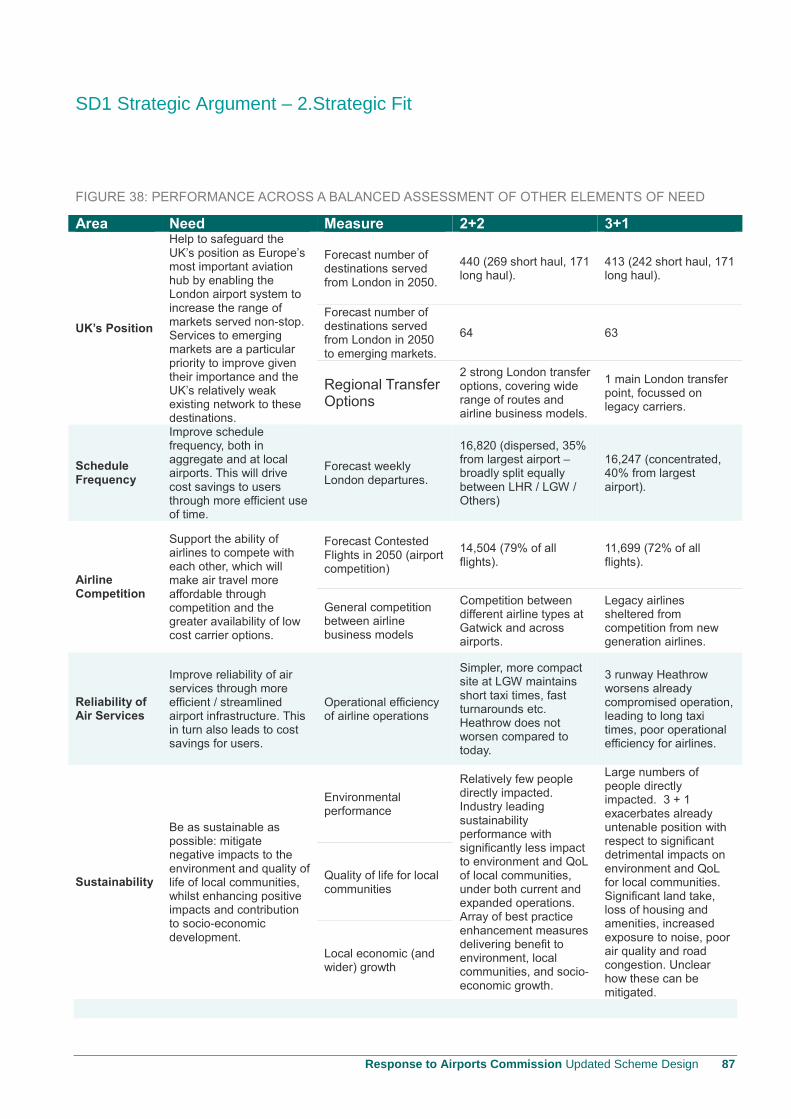
SD1 Strategic Argument – 2.Strategic Fit
Response to Airports Commission Updated Scheme Design 87
FIGURE 38: PERFORMANCE ACROSS A BALANCED ASSESSMENT OF OTHER ELEMENTS OF NEED
Area Need Measure 2+2 3+1
UK’s Position
Help to safeguard the UK’s position as Europe’s most important aviation hub by enabling the London airport system to increase the range of markets served non-stop. Services to emerging markets are a particular priority to improve given their importance and the UK’s relatively weak existing network to these destinations.
Forecast number of destinations served from London in 2050.
440 (269 short haul, 171 long haul).
413 (242 short haul, 171 long haul).
Forecast number of destinations served from London in 2050 to emerging markets.
64 63
Regional Transfer Options
2 strong London transfer options, covering wide range of routes and airline business models.
1 main London transfer point, focussed on legacy carriers.
Schedule Frequency
Improve schedule frequency, both in aggregate and at local airports. This will drive cost savings to users through more efficient use of time.
Forecast weekly London departures.
16,820 (dispersed, 35% from largest airport – broadly split equally between LHR / LGW / Others)
16,247 (concentrated, 40% from largest airport).
Airline Competition
Support the ability of airlines to compete with each other, which will make air travel more affordable through competition and the greater availability of low cost carrier options.
Forecast Contested Flights in 2050 (airport competition)
14,504 (79% of all flights).
11,699 (72% of all flights).
General competition between airline business models
Competition between different airline types at Gatwick and across airports.
Legacy airlines sheltered from competition from new generation airlines.
Reliability of Air Services
Improve reliability of air services through more efficient / streamlined airport infrastructure. This in turn also leads to cost savings for users.
Operational efficiency of airline operations
Simpler, more compact site at LGW maintains short taxi times, fast turnarounds etc. Heathrow does not worsen compared to today.
3 runway Heathrow worsens already compromised operation, leading to long taxi times, poor operational efficiency for airlines.
Sustainability
Be as sustainable as possible: mitigate negative impacts to the environment and quality of life of local communities, whilst enhancing positive impacts and contribution to socio-economic development.
Environmental performance
Relatively few people directly impacted. Industry leading sustainability performance with significantly less impact to environment and QoL of local communities, under both current and expanded operations. Array of best practice enhancement measures delivering benefit to environment, local communities, and socio-economic growth.
Large numbers of people directly impacted. 3 + 1 exacerbates already untenable position with respect to significant detrimental impacts on environment and QoL for local communities. Significant land take, loss of housing and amenities, increased exposure to noise, poor air quality and road congestion. Unclear how these can be mitigated.
Quality of life for local communities
Local economic (and wider) growth
SD1 Strategic Argument – 2. Strategic Fit
88 Response to Airports Commission Updated Scheme Design
Objective: “To improve the experience of passengers and other users
of aviation”
2.9 Innovation in Passenger Experience
Key findings:
Since the change in ownership, Gatwick has delivered a series of innovations.
Service quality levels are at a record high, Gatwick’s relative ASQ ranking has never been better
and passenger ratings are near 2012/13 record levels.
Examples of innovations that deliver improvements in the passenger experience include Gatwick’s
best in class security product (consistently high throughput and high SQR performance levels)
and unique PRM service offerings.
The increasing pace of innovation in the airline market requires a clear understanding and
dynamic approach to customer needs. Gatwick is at the forefront of delivering highly relevant and
timely solutions to some of the world’s fastest growing airlines. Through Gatwick Connect airlines
and passengers can now benefit from a previously unfulfilled market for self-connecting traffic.
Making use of existing capacity and capital is critical. Gatwick’s runway program – ACDM55 –
delivers more peak capacity than ever before.
Gatwick has a range of further innovations in the pipeline.
Our analysis shows that the 2+2 option directly maps into an improved passenger experience and
will lead to a superior passenger experience compared to 3+1.
Context
The improvements in the passenger experience arising from competition between the London airports
is clear for all to see. Improvements at Gatwick since separation from Heathrow have been
continuous and significant. The need to preserve the competitive dynamic that has led to the
innovation resulting in these passenger improvements should be an important part of the
Commission’s decision as to the location of the next runway. In this section, we
Summarise innovations to date;
Demonstrate how these innovations have led to an improvement in the passenger experience;
Discuss how our proposed airport design delivers greater choice and convenience for
passengers;
Discuss the step change in the passenger experience that will be delivered by Gatwick Gateway;
Provide a case study on the step change in the passenger experience that will be delivered by the
next generation of Gatwick Connect, including a discussion of the role of technology by the
renowned academic, Naway K Taneja.
SD1 Strategic Argument – 2.Strategic Fit
Response to Airports Commission Updated Scheme Design 89
Innovations to date
Gatwick has a unique position in the London airport system as it serves all types of airline business
models and has the largest LCC network of any airport in the world. The London airports market is
now becoming more competitive. The break-up by the Competition Commission of the BAA London
airports monopoly was intended to deliver a step-change in the competitive dynamic in London. As
we approach the 5th anniversary of the sale of Gatwick, we can see how competition has driven a
series of innovations at Gatwick. We now explain that Gatwick is at the forefront of innovation in the
development and provision of airport services.
Innovation to deliver improvements in the passenger experience
By developing a superior and differentiated product offering, we can increase the attractiveness of our
offer to our passengers, as well as seeking to attract new passengers and airlines. Examples of the
innovations seen at the airport include the security and the improvement of PRM services.
Improvements in security
One of the main priorities of the new Gatwick management team on change of ownership in
December 2009 was to rectify the sub-standard security product, which was a major source of
passenger detriment at Gatwick and other London airports. Our South Terminal security project
was a £45 million development to consolidate the three separate central search security facilities
into one. This was not part of BAA’s five year investment plan and was financed out of efficiency
savings out of BAA’s capital plan.
This project has significantly improved the passenger experience and regularly features as the
best security area in any European airport. In addition, it has also significantly improved the
efficiency of security central search in the South Terminal, with Gatwick consistently achieving its
SQR performance targets. Moreover the passenger throughput per lane target in South Terminal
is now up to 250 passengers per hour compared to around 165 passengers prior to the change in
ownership. The security products at other London airports has improved in response. The new
security product in Heathrow’s Terminal 2 reflects many of the features that were introduced
in Gatwick.
As part of this project, we introduced segmentation into the security area. We introduced family
assistance lanes at security shortly after sale, as a key response to our review of Gatwick’s
service offering. These were unique amongst UK airports at that time. Family assistance lanes at
Gatwick provide a dedicated security facility, with specially trained staff and wider security aisles
to allow a more tailored processing of passengers travelling with small children. This provides
these passengers, who often travel with more luggage and liquids (including buggies and baby
milk) more space to prepare for the security process. Moreover, we have found it reduces the
stress associated with passing through security as it removes the feeling that passengers not
travelling with small children are being inadvertently held up.
Our innovation in this area has been met with positive feedback from passengers. We also note
there has been a competitive response in this area, with a number of competing airports also
introducing variant of this in their own security product.
The next phase of the roll out of innovation in security is the smart lanes that are being trialled at
Gatwick. This will significantly increase – again – the productivity of the security process.
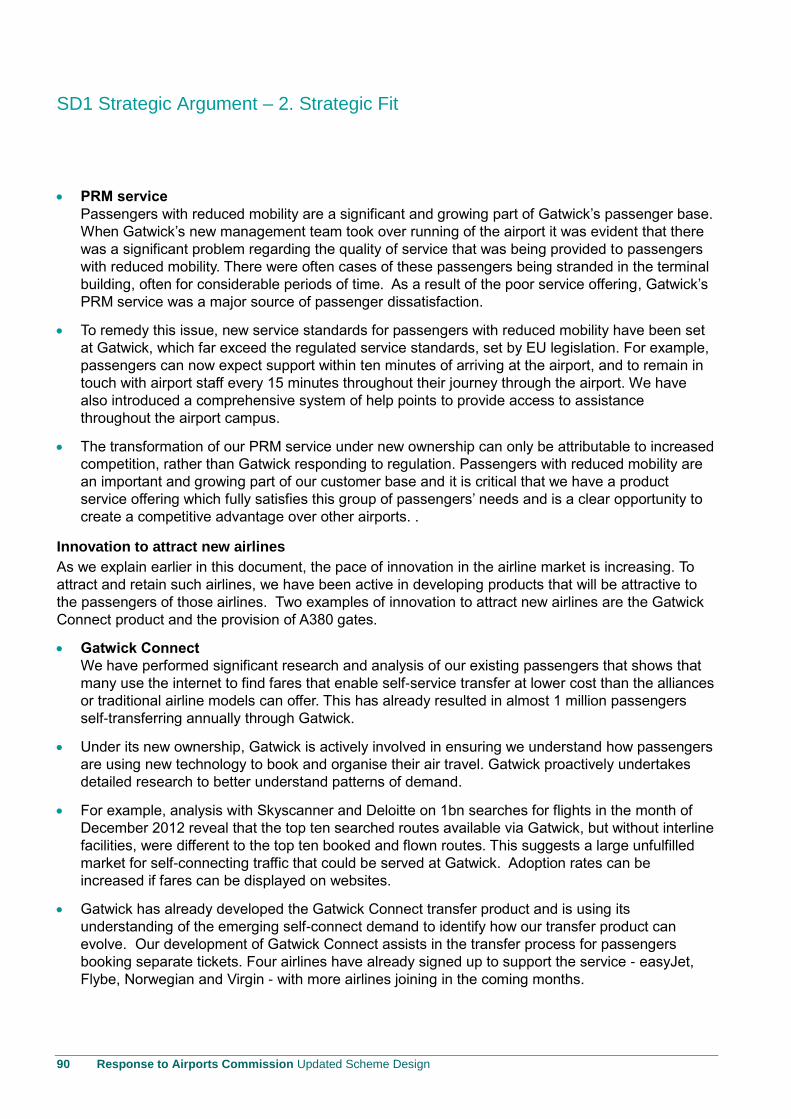
SD1 Strategic Argument – 2. Strategic Fit
90 Response to Airports Commission Updated Scheme Design
PRM service
Passengers with reduced mobility are a significant and growing part of Gatwick’s passenger base.
When Gatwick’s new management team took over running of the airport it was evident that there
was a significant problem regarding the quality of service that was being provided to passengers
with reduced mobility. There were often cases of these passengers being stranded in the terminal
building, often for considerable periods of time. As a result of the poor service offering, Gatwick’s
PRM service was a major source of passenger dissatisfaction.
To remedy this issue, new service standards for passengers with reduced mobility have been set
at Gatwick, which far exceed the regulated service standards, set by EU legislation. For example,
passengers can now expect support within ten minutes of arriving at the airport, and to remain in
touch with airport staff every 15 minutes throughout their journey through the airport. We have
also introduced a comprehensive system of help points to provide access to assistance
throughout the airport campus.
The transformation of our PRM service under new ownership can only be attributable to increased
competition, rather than Gatwick responding to regulation. Passengers with reduced mobility are
an important and growing part of our customer base and it is critical that we have a product
service offering which fully satisfies this group of passengers’ needs and is a clear opportunity to
create a competitive advantage over other airports. .
Innovation to attract new airlines
As we explain earlier in this document, the pace of innovation in the airline market is increasing. To
attract and retain such airlines, we have been active in developing products that will be attractive to
the passengers of those airlines. Two examples of innovation to attract new airlines are the Gatwick
Connect product and the provision of A380 gates.
Gatwick Connect
We have performed significant research and analysis of our existing passengers that shows that
many use the internet to find fares that enable self-service transfer at lower cost than the alliances
or traditional airline models can offer. This has already resulted in almost 1 million passengers
self-transferring annually through Gatwick.
Under its new ownership, Gatwick is actively involved in ensuring we understand how passengers
are using new technology to book and organise their air travel. Gatwick proactively undertakes
detailed research to better understand patterns of demand.
For example, analysis with Skyscanner and Deloitte on 1bn searches for flights in the month of
December 2012 reveal that the top ten searched routes available via Gatwick, but without interline
facilities, were different to the top ten booked and flown routes. This suggests a large unfulfilled
market for self-connecting traffic that could be served at Gatwick. Adoption rates can be
increased if fares can be displayed on websites.
Gatwick has already developed the Gatwick Connect transfer product and is using its
understanding of the emerging self-connect demand to identify how our transfer product can
evolve. Our development of Gatwick Connect assists in the transfer process for passengers
booking separate tickets. Four airlines have already signed up to support the service - easyJet,
Flybe, Norwegian and Virgin - with more airlines joining in the coming months.
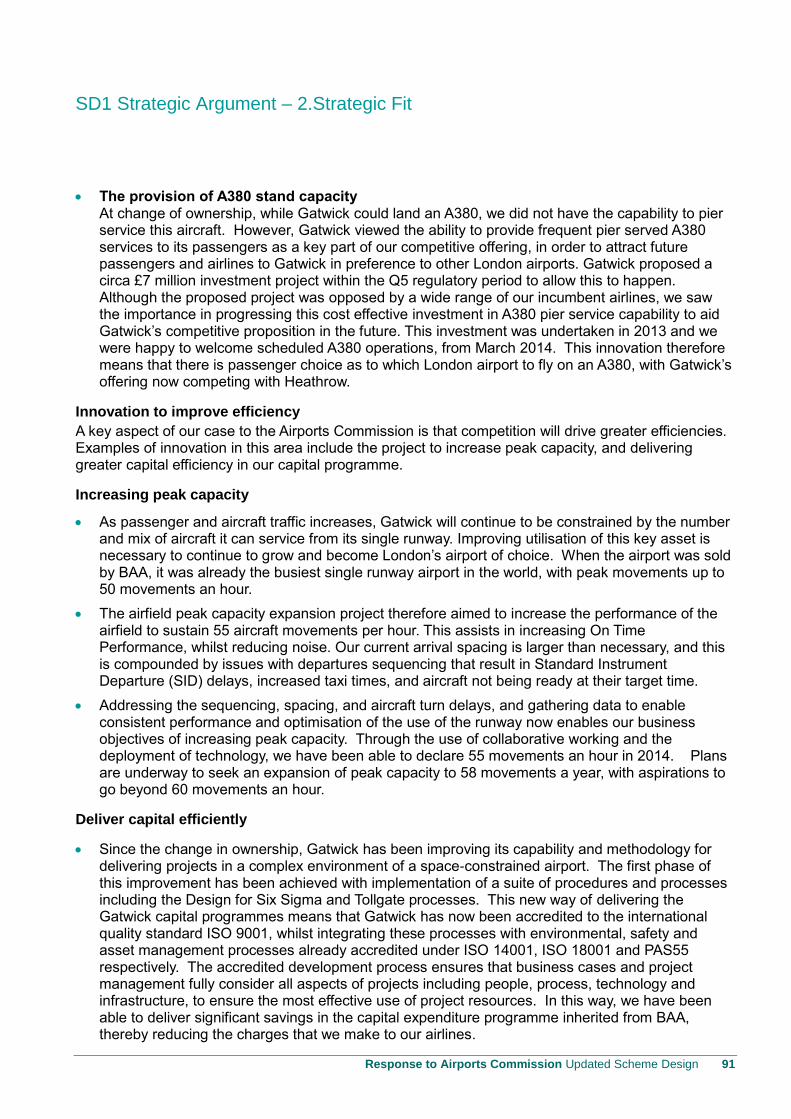
SD1 Strategic Argument – 2.Strategic Fit
Response to Airports Commission Updated Scheme Design 91
The provision of A380 stand capacity At change of ownership, while Gatwick could land an A380, we did not have the capability to pier service this aircraft. However, Gatwick viewed the ability to provide frequent pier served A380 services to its passengers as a key part of our competitive offering, in order to attract future passengers and airlines to Gatwick in preference to other London airports. Gatwick proposed a circa £7 million investment project within the Q5 regulatory period to allow this to happen. Although the proposed project was opposed by a wide range of our incumbent airlines, we saw the importance in progressing this cost effective investment in A380 pier service capability to aid Gatwick’s competitive proposition in the future. This investment was undertaken in 2013 and we were happy to welcome scheduled A380 operations, from March 2014. This innovation therefore means that there is passenger choice as to which London airport to fly on an A380, with Gatwick’s offering now competing with Heathrow.
Innovation to improve efficiency
A key aspect of our case to the Airports Commission is that competition will drive greater efficiencies. Examples of innovation in this area include the project to increase peak capacity, and delivering greater capital efficiency in our capital programme.
Increasing peak capacity
As passenger and aircraft traffic increases, Gatwick will continue to be constrained by the number and mix of aircraft it can service from its single runway. Improving utilisation of this key asset is necessary to continue to grow and become London’s airport of choice. When the airport was sold by BAA, it was already the busiest single runway airport in the world, with peak movements up to 50 movements an hour.
The airfield peak capacity expansion project therefore aimed to increase the performance of the airfield to sustain 55 aircraft movements per hour. This assists in increasing On Time Performance, whilst reducing noise. Our current arrival spacing is larger than necessary, and this is compounded by issues with departures sequencing that result in Standard Instrument Departure (SID) delays, increased taxi times, and aircraft not being ready at their target time.
Addressing the sequencing, spacing, and aircraft turn delays, and gathering data to enable consistent performance and optimisation of the use of the runway now enables our business objectives of increasing peak capacity. Through the use of collaborative working and the deployment of technology, we have been able to declare 55 movements an hour in 2014. Plans are underway to seek an expansion of peak capacity to 58 movements a year, with aspirations to go beyond 60 movements an hour.
Deliver capital efficiently
Since the change in ownership, Gatwick has been improving its capability and methodology for delivering projects in a complex environment of a space-constrained airport. The first phase of this improvement has been achieved with implementation of a suite of procedures and processes including the Design for Six Sigma and Tollgate processes. This new way of delivering the Gatwick capital programmes means that Gatwick has now been accredited to the international quality standard ISO 9001, whilst integrating these processes with environmental, safety and asset management processes already accredited under ISO 14001, ISO 18001 and PAS55 respectively. The accredited development process ensures that business cases and project management fully consider all aspects of projects including people, process, technology and infrastructure, to ensure the most effective use of project resources. In this way, we have been able to deliver significant savings in the capital expenditure programme inherited from BAA, thereby reducing the charges that we make to our airlines.
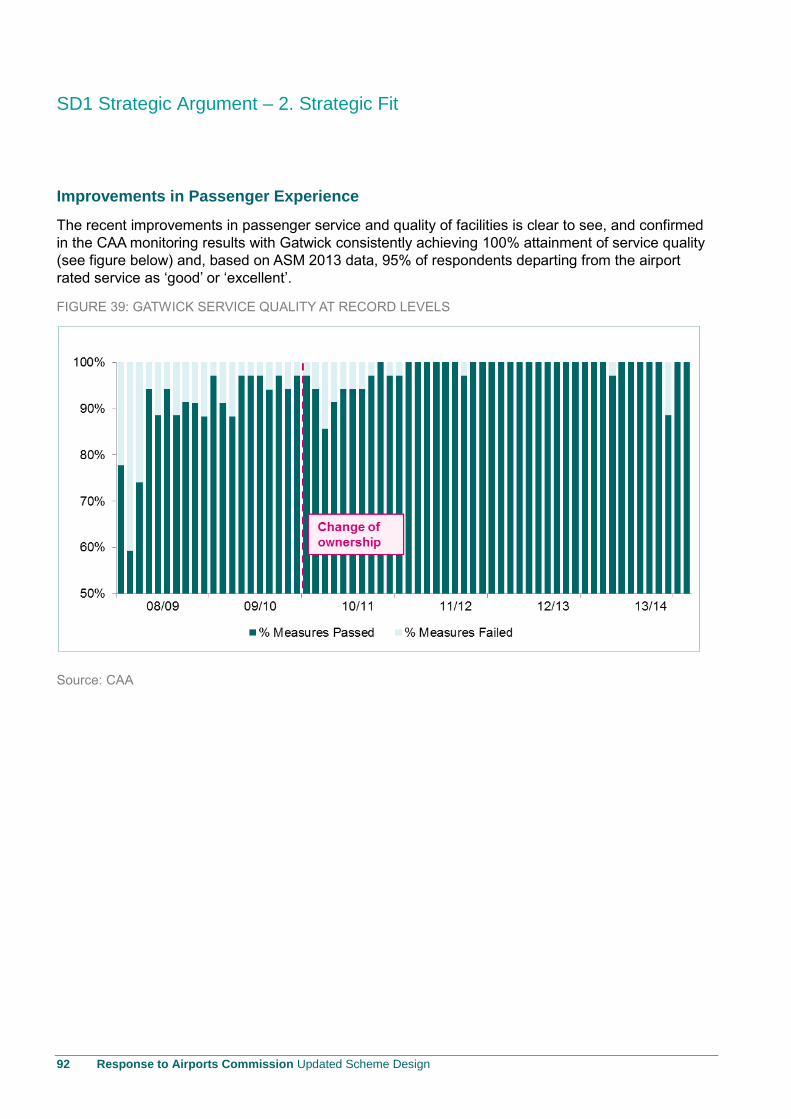
SD1 Strategic Argument – 2. Strategic Fit
92 Response to Airports Commission Updated Scheme Design
Improvements in Passenger Experience
The recent improvements in passenger service and quality of facilities is clear to see, and confirmed
in the CAA monitoring results with Gatwick consistently achieving 100% attainment of service quality
(see figure below) and, based on ASM 2013 data, 95% of respondents departing from the airport
rated service as ‘good’ or ‘excellent’.
FIGURE 39: GATWICK SERVICE QUALITY AT RECORD LEVELS
Source: CAA
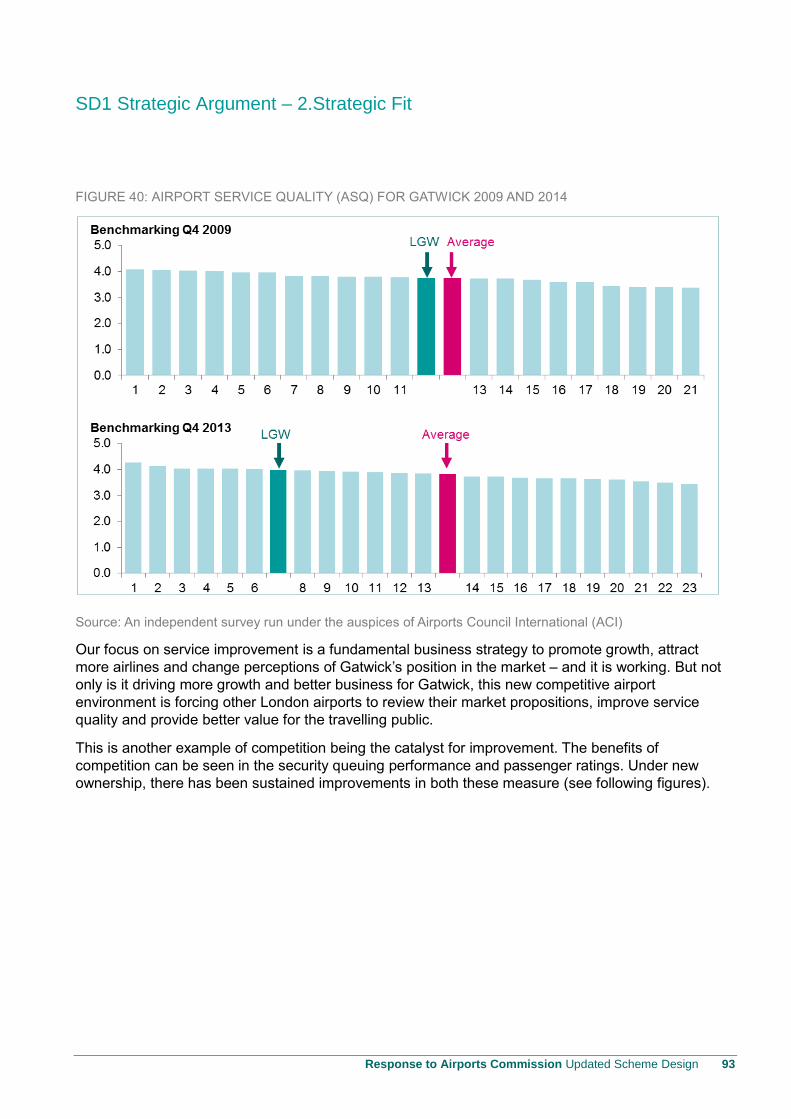
SD1 Strategic Argument – 2.Strategic Fit
Response to Airports Commission Updated Scheme Design 93
FIGURE 40: AIRPORT SERVICE QUALITY (ASQ) FOR GATWICK 2009 AND 2014
Source: An independent survey run under the auspices of Airports Council International (ACI)
Our focus on service improvement is a fundamental business strategy to promote growth, attract
more airlines and change perceptions of Gatwick’s position in the market – and it is working. But not
only is it driving more growth and better business for Gatwick, this new competitive airport
environment is forcing other London airports to review their market propositions, improve service
quality and provide better value for the travelling public.
This is another example of competition being the catalyst for improvement. The benefits of
competition can be seen in the security queuing performance and passenger ratings. Under new
ownership, there has been sustained improvements in both these measure (see following figures).
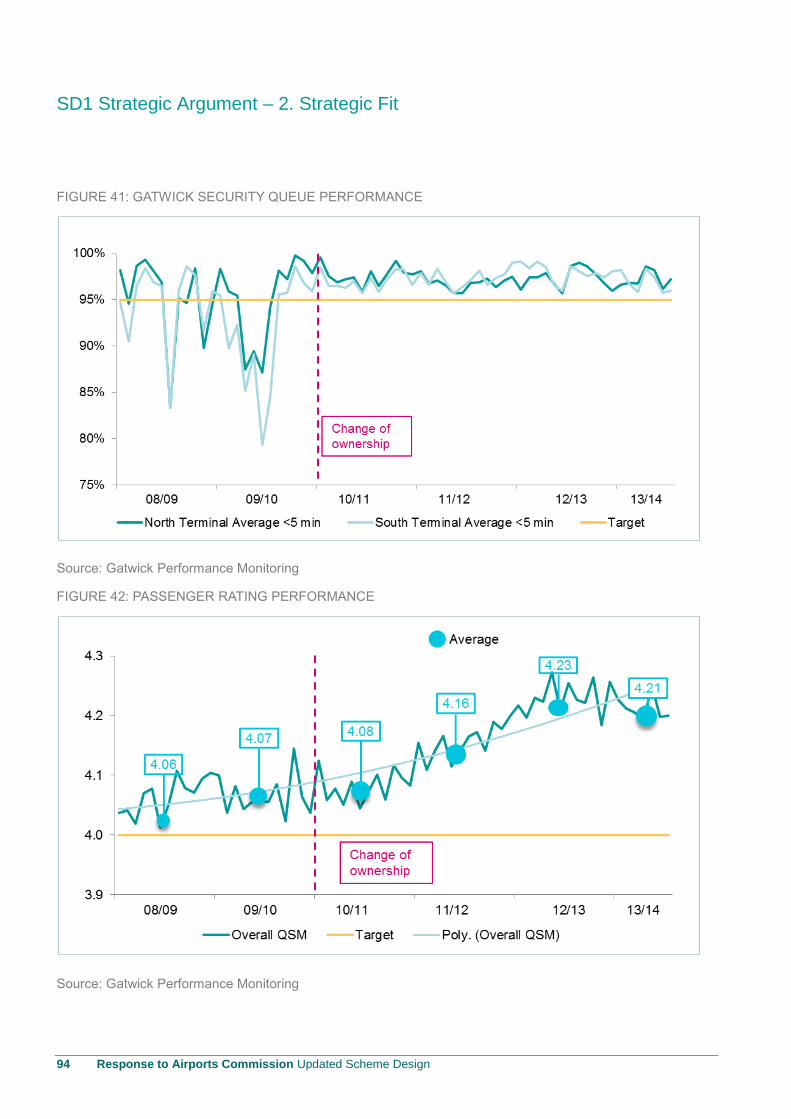
SD1 Strategic Argument – 2. Strategic Fit
94 Response to Airports Commission Updated Scheme Design
FIGURE 41: GATWICK SECURITY QUEUE PERFORMANCE
Source: Gatwick Performance Monitoring
FIGURE 42: PASSENGER RATING PERFORMANCE
Source: Gatwick Performance Monitoring

SD1 Strategic Argument – 2.Strategic Fit
Response to Airports Commission Updated Scheme Design 95
The proposed airport design: Continuing the improvement in passenger experience
The Master Plan is fully aligned with Gatwick’s published passenger commitments, aided by a number of inherent characteristics which allow the airport to be developed to deliver a world class passenger service. The Master Plan has been designed to offer an enhanced passenger experience compared to an expansion at Heathrow. We have carried out a detailed analysis of passenger journey times for a 2 runway Gatwick versus our estimates for a 3 runway Heathrow, with the results shown in the figure below.
FIGURE 43: DETAILED ANALYSIS OF JOURNEY TIMES
Gatwick Two Runways
(minutes)
Heathrow Three Runways
(minutes) Difference
Average travel time to airport 61 70 9
Average travel time from arrival at airport to terminal building
7 20 13
Sub-total: 68 90 22
Average departure/arrival time through terminal
38 45 7
Average taxiing and holding time 7 16 9
Total journey time: 113 151 38
The analysis of each segment of the journey is discussed below.
Journey to and from the Airport
Gatwick is committed to delivery of seamless transport facilities and improved public transport services. Passenger experience by all transport modes is already measured and improvements targeted to address customer feedback. We now want to take transport to another level in terms of access and services.
Taking account of where passengers using Gatwick begin or end their journey in the UK, road and rail journeys to/from the expanded airport will take an average of 61 minutes. This brings all of London’s main terminus railway stations, including Paddington, within a maximum of 50 minutes including average waiting time for a train, and all except Paddington within 45 minutes. For Heathrow, even allowing for Crossrail, the maximum time to reach all of these key interchanges is 56 minutes, with four stations taking at least 50 minutes to reach.
A much higher percentage of rail passengers are able to access Gatwick directly and conveniently by rail than at Heathrow, and many journey times to Gatwick from beyond London are also shorter than to Heathrow. In contrast therefore, the equivalent average journey for passengers travelling to or from a three runway Heathrow will be on average 70 minutes and for some journeys considerably more.
Gatwick’s new passenger interchange, the Gatwick Gateway, provides effective and co-ordinated access across the airport. 60% of all passengers will access the airport via the Gatwick Gateway, adjacent to South Terminal. This single main focus for surface access modes will simplify wayfinding, improve the passenger experience and minimise on-airport connection times. The Gatwick Gateway will be connected directly to the New Terminal and North Terminal by automated above ground people mover (APM). Depending on the mode of access, the total transfer time from long stay carparks to any terminal will be no more than 7 minutes or an average of 3-4 minutes from the Gateway.
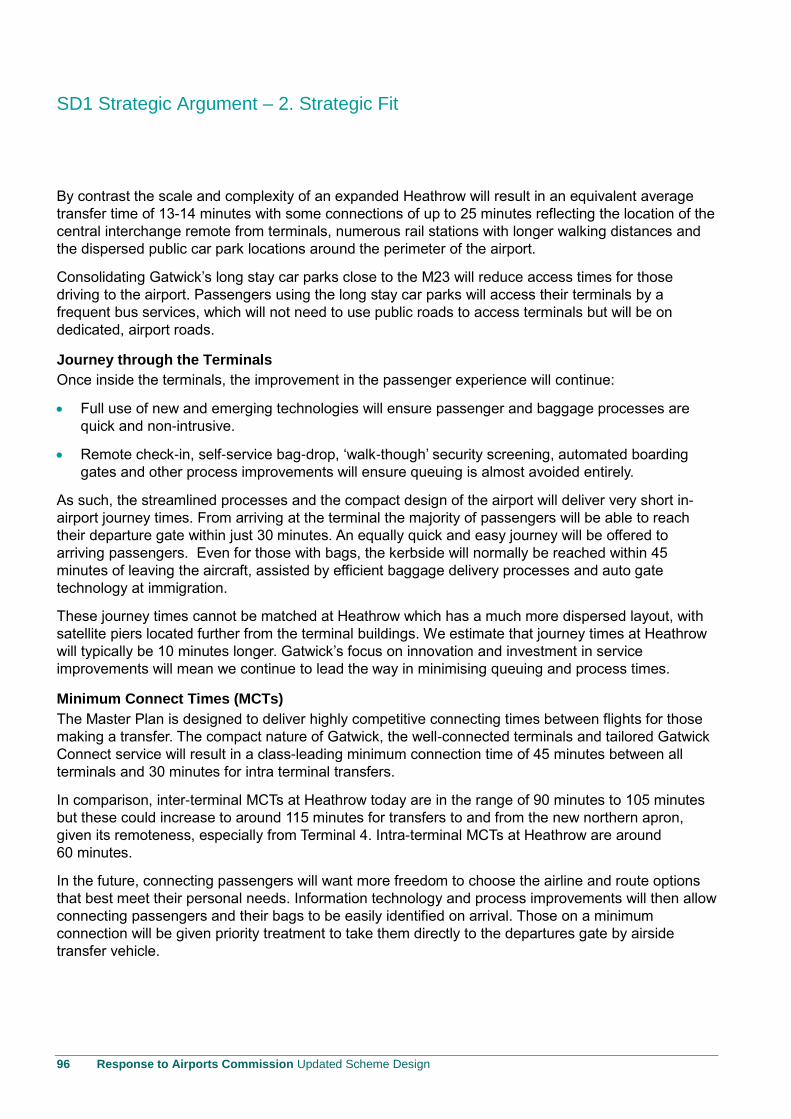
SD1 Strategic Argument – 2. Strategic Fit
96 Response to Airports Commission Updated Scheme Design
By contrast the scale and complexity of an expanded Heathrow will result in an equivalent average
transfer time of 13-14 minutes with some connections of up to 25 minutes reflecting the location of the
central interchange remote from terminals, numerous rail stations with longer walking distances and
the dispersed public car park locations around the perimeter of the airport.
Consolidating Gatwick’s long stay car parks close to the M23 will reduce access times for those
driving to the airport. Passengers using the long stay car parks will access their terminals by a
frequent bus services, which will not need to use public roads to access terminals but will be on
dedicated, airport roads.
Journey through the Terminals
Once inside the terminals, the improvement in the passenger experience will continue:
Full use of new and emerging technologies will ensure passenger and baggage processes are
quick and non-intrusive.
Remote check-in, self-service bag-drop, ‘walk-though’ security screening, automated boarding
gates and other process improvements will ensure queuing is almost avoided entirely.
As such, the streamlined processes and the compact design of the airport will deliver very short in-
airport journey times. From arriving at the terminal the majority of passengers will be able to reach
their departure gate within just 30 minutes. An equally quick and easy journey will be offered to
arriving passengers. Even for those with bags, the kerbside will normally be reached within 45
minutes of leaving the aircraft, assisted by efficient baggage delivery processes and auto gate
technology at immigration.
These journey times cannot be matched at Heathrow which has a much more dispersed layout, with
satellite piers located further from the terminal buildings. We estimate that journey times at Heathrow
will typically be 10 minutes longer. Gatwick’s focus on innovation and investment in service
improvements will mean we continue to lead the way in minimising queuing and process times.
Minimum Connect Times (MCTs)
The Master Plan is designed to deliver highly competitive connecting times between flights for those
making a transfer. The compact nature of Gatwick, the well-connected terminals and tailored Gatwick
Connect service will result in a class-leading minimum connection time of 45 minutes between all
terminals and 30 minutes for intra terminal transfers.
In comparison, inter-terminal MCTs at Heathrow today are in the range of 90 minutes to 105 minutes
but these could increase to around 115 minutes for transfers to and from the new northern apron,
given its remoteness, especially from Terminal 4. Intra-terminal MCTs at Heathrow are around
60 minutes.
In the future, connecting passengers will want more freedom to choose the airline and route options
that best meet their personal needs. Information technology and process improvements will then allow
connecting passengers and their bags to be easily identified on arrival. Those on a minimum
connection will be given priority treatment to take them directly to the departures gate by airside
transfer vehicle.
SD1 Strategic Argument – 2.Strategic Fit
Response to Airports Commission Updated Scheme Design 97
On board the aircraft
It is equally important to provide a fast, reliable and efficient operation on the airfield to avoid delaying
aircraft and passengers on the ground. The Master Plan has been designed with several innovations
to improve the passenger experience.
Taxiing times and runway delays will be minimised, improving both the passenger experience and reducing fuel burn. We will achieve this by locating the new apron between the two runways, offering exceptionally short taxiing distances. However this is not at the cost of congestion. Dedicated apron taxi-lanes keep the ‘push-back’ operation separate from the through-taxiways. This is in contrast to Heathrow where the majority of taxiways linking the runways will frequently be blocked by aircraft pushing back from the adjacent stands.
The method of runway operation also keeps taxiing distances low and predictable. Aircraft will land on the runway closest to their apron and although the departure runway will depend on the destination, the proximity of the runways to the aprons will keep taxiing times short. At Heathrow, the proposed complex method of runway alternation, necessary to mitigate the air noise impacts, will result in longer and highly unpredictable travel times.
In setting their schedules, airlines also need to consider expected delays on arrival and departure caused by congestion on the runway. Here Gatwick offers another advantage; two mixed mode runways. These maximise the flexibility for adjusting the operation to deal with peaks in demand or disruption events such as bad weather. Two of the three runways at Heathrow are proposed to operate in segregated mode. Experience has shown that this is a less resilient method of operation as no flexibility exists to deal with short term peaks and fluctuations in demand.
Holding delays will be minimal at Gatwick with the benefit of redesigned airspace, flexible high-capacity runways and new processes such as A-CDM which will enable controllers to optimise the ground movement control of aircraft. At Heathrow we believe delays of several minutes could still be a feature due to taxiing times and the use of holding points for departing aircraft.
When setting their schedules, airlines also have to take account of not just the average taxiing times but also the maximum that might be experienced. The maximum taxiway and holding times resulting from the characteristics described above are 15 minutes for a two runway Gatwick, compared with 45 minutes for a three runway Heathrow. The equivalent average times are 7 minutes for Gatwick and 16 minutes for Heathrow.
The proposed airport design: Gatwick Gateway
An exciting part of the Gatwick airport design is the Gatwick Gateway. This complete redevelopment
of the area around and including Gatwick station will provide simple, swift and inclusive access right
to the heart of the airport:
Public transport to airport connection will be direct, adjacent and immediate. It will be designed to meet the needs of all, including passengers with reduced mobility or sensory impairment.
Through airport (check-in to flight) is quicker and the people mover will get passengers from the Gateway to any terminal in 2½ minutes.
Transfers are quicker; the people mover will get passengers between the New and North Terminals in under 5 minutes.
Further investment in passenger information systems, integrated and smart ticketing will be made
over the next few years, including Oyster cards arriving at Gatwick in 2014.

SD1 Strategic Argument – 2. Strategic Fit
98 Response to Airports Commission Updated Scheme Design
FIGURE 44: PROPOSED GATWICK GATEWAY
Source: Farrells
For quality, simplicity, speed, ease and convenience, the Gatwick Gateway will be unrivalled and
vastly better than the distant, subterranean and dispersed access at Heathrow.
Gatwick has looked beyond its boundaries to help its customers with travel information via our travel
planning website. This reach to customers will be enhanced when Gatwick has over 1,000 stations
accessible with one change. To capture the benefit from this we will work with train operators to
provide hosted Gatwick contact points at main interchange points to help passengers getting on or
transferring between trains, review flight connection information, print out luggage tags and make their
journey as seamless as possible.
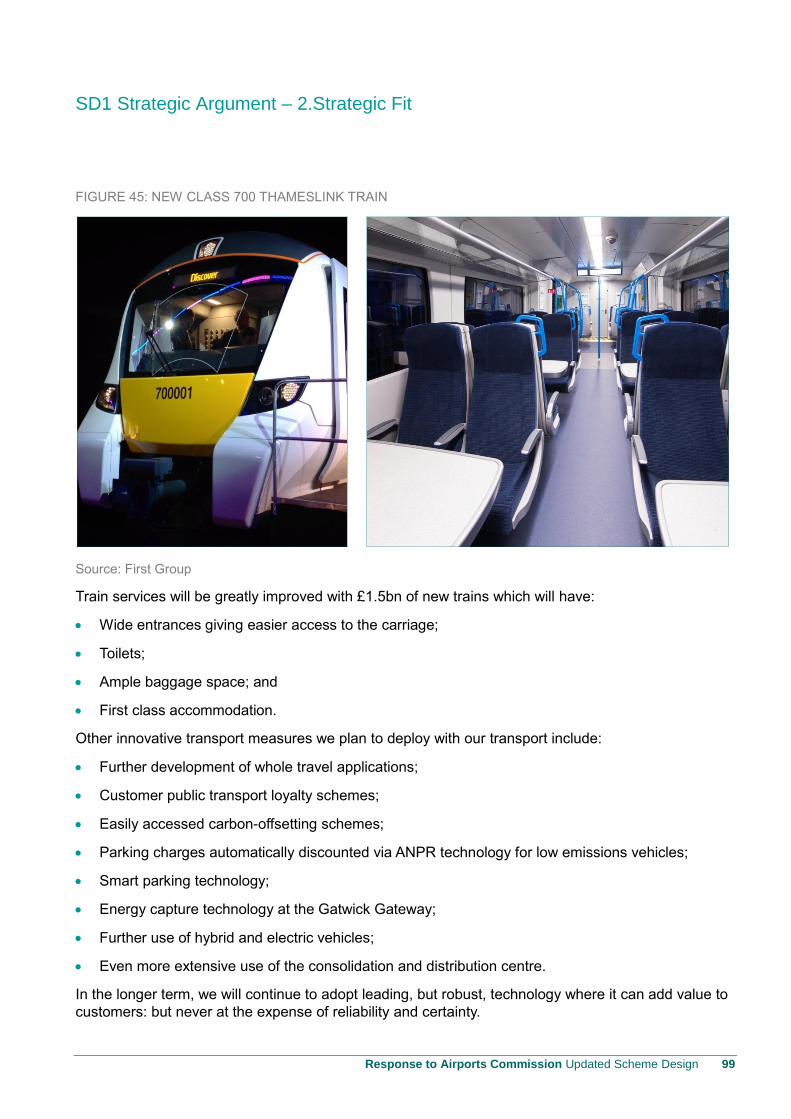
SD1 Strategic Argument – 2.Strategic Fit
Response to Airports Commission Updated Scheme Design 99
FIGURE 45: NEW CLASS 700 THAMESLINK TRAIN
Source: First Group
Train services will be greatly improved with £1.5bn of new trains which will have:
Wide entrances giving easier access to the carriage;
Toilets;
Ample baggage space; and
First class accommodation.
Other innovative transport measures we plan to deploy with our transport include:
Further development of whole travel applications;
Customer public transport loyalty schemes;
Easily accessed carbon-offsetting schemes;
Parking charges automatically discounted via ANPR technology for low emissions vehicles;
Smart parking technology;
Energy capture technology at the Gatwick Gateway;
Further use of hybrid and electric vehicles;
Even more extensive use of the consolidation and distribution centre.
In the longer term, we will continue to adopt leading, but robust, technology where it can add value to
customers: but never at the expense of reliability and certainty.
SD1 Strategic Argument – 2. Strategic Fit
100 Response to Airports Commission Updated Scheme Design
Case study Gatwick Connect: next steps
Gatwick has commissioned a study into “How Technology will drive Transformation of the Aviation
Industry”. Extracts from the foreword by Nawal K. Taneja, Airline Business Strategist, Author and
Aviation Professor Emeritus are reproduced below.
Extracts from foreword by Nawal K. Taneja
Airlines and airports will inevitably need to collaborate in the use of data and enabling technologies to
deliver improved opportunities and experiences to customers, such as booking connections between
non-interlined carriers within seconds in a single transaction, together with a transit product at the
airport that facilitates the transfer of baggage from any airline to any other airline. An onward train
journey and hotel reservation will also be part of the single end to end booking if the consumer wishes
it. Such value-adding services would also provide revenue-related opportunities for airlines and
airports stemming from the use of information from the connected consumers to make relevant and
more affordable offers to the right customers at the right times. It would also transform the connecting
potential at an airport to exploit network opportunities, driven mainly by LCCs, to the maximum.
A few airlines and airports, such as the management team at Gatwick, are stepping up to the
challenge of data-driven marketing, and applying technology solutions which are actually available
now. Airlines and airports that are not laser focused on mining insights from all these sources are
missing a real opportunity to engage with customers and provide personalized services (data-driven
mass customization) as consumers’ value having control over the services they buy. Airlines and
airports that are prepared to focus on understanding the rapidly changing perceptions of value of their
customers will not find that service is irrelevant and little else matters but cost. On the contrary, there
are huge untapped opportunities for value creation for which Internet-powered customers are willing
to pay.
The bottom line is that tomorrow’s travellers will want high degrees of personalized services—
services that they can control, and they want all possible relevant and affordable journey options to be
presented to them quickly, and to be easily bookable. Airlines and airports need to use emerging
technology (the Internet, mobile devices, and emerging bag tag technology, for example) to engage
with constantly-connected customers to enable them to meet their individual needs and improve their
experience. Emerging consumers want convenience, control and choice in making their purchasing
decisions, and they want assurance of a hassle free experience at the airport. Airlines and airports
are held to account in meeting this customer promise by experience-sharing via social channels.
London Gatwick’s vision for this future is becoming reality even now, and in my opinion will become
the new industry norm.
Our development of Gatwick Connect assists in the transfer process for passengers booking separate
tickets. Four airlines have already signed up to support the service - with at least six more airlines in
the process of joining (expected within 6 months).
The next step is significantly bolder, and will establish a completely new concept in connecting travel
across Europe and the World. We have researched the top 600 city pairs and are working with an
online travel agency to create a single booking with three distinct parts:
SD1 Strategic Argument – 2.Strategic Fit
Response to Airports Commission Updated Scheme Design 101
1. Return surface travel to Gatwick from point of origin
2. Gatwick Connect Service
3. Return air travel from Gatwick to destination
The offering will appear on a ticket booking website as a single price, competing alongside point to
point travel, through tickets and interline partner prices. There will be a single booking with 2 issued
tickets and a Gatwick Connect confirmation. Gatwick Connect will assist with the onward connection
baggage processing and other value added services. The Gatwick Connect confirmation will come
with an onward flight promise to ensure the end to end journey is protected from delays and missed
flights.
This will overcome many hurdles for the passenger and greatly simplify the search and comparison
process to present the full list of options including charter, low cost and full service in connecting point
A to B via C. In this way, a new transfer product will be introduced to enhance passenger choice.
Gatwick will replicate the automated baggage transfer process performed by alliance partners and
interline partners seen across Europe, Asia and the Middle East for Gatwick Connect customers. This
will work regardless of alliance membership and interline agreements. The technologies required to
implement such a service already exist, and we are working to bring them into the Gatwick Connect
service proposition by 2018.
The permanent reprogrammable bag tag and radio-frequency tracking device will become a feature of
travel in the near future. Gatwick Connect customers will be able to request a branded permanent tag
or register their existing device on our systems to ensure the bag transfers to the correct aircraft. The
baggage system design incorporates the automation required to enable the Gatwick Connect
process.
By 2020, Gatwick will have 175 directly connected rail stations and over 1,000 stations one change
away. The next natural step to enable seamless journeys is to ensure that Gatwick Connect is also
available to railway passengers transferring from plane to train or plane to train. This will allow the
consumer to choose not only the quality or support of the transfer service between aircraft, but will
also add assistance and assurance to the intermodal journeys as well.
Gatwick is in a unique position due to its diverse carrier base and their varied business models to take
advantage of the changes that technology is bringing to the aviation industry. The technology and
systems required to service the consumer of the future will be very different to the legacy approaches.
Gatwick Connect is already established with a clear strategy that follows the timeline below:
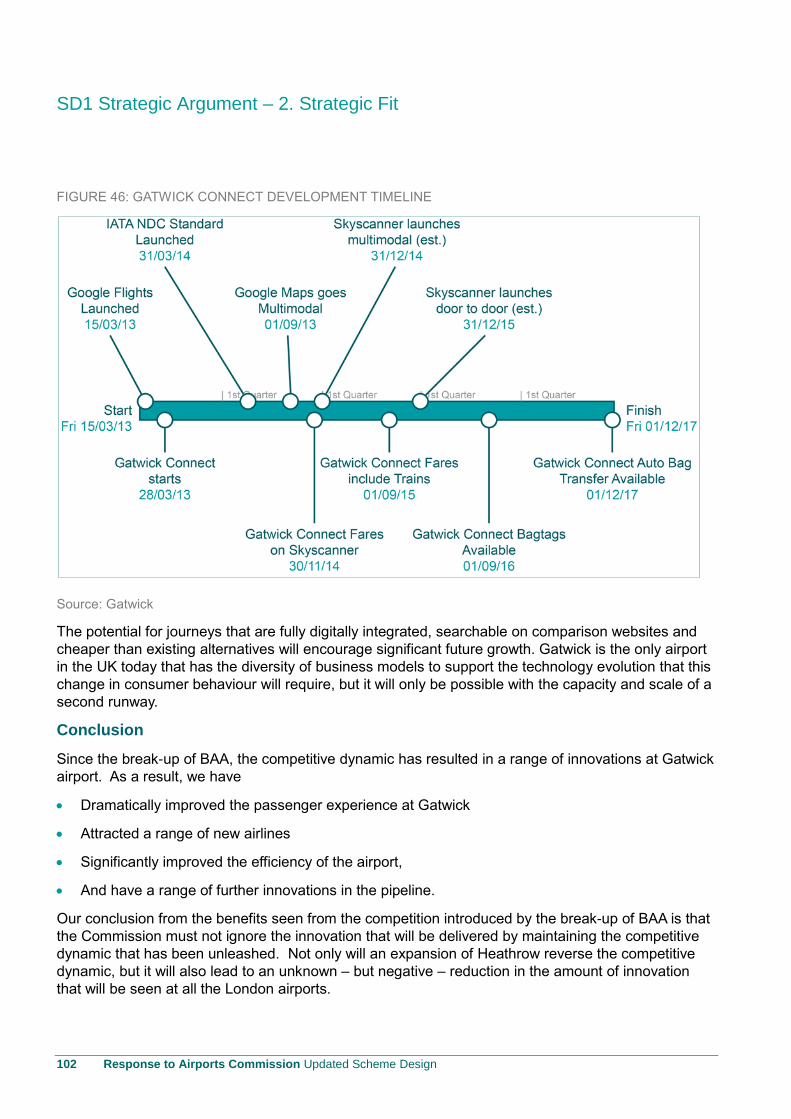
SD1 Strategic Argument – 2. Strategic Fit
102 Response to Airports Commission Updated Scheme Design
FIGURE 46: GATWICK CONNECT DEVELOPMENT TIMELINE
Source: Gatwick
The potential for journeys that are fully digitally integrated, searchable on comparison websites and
cheaper than existing alternatives will encourage significant future growth. Gatwick is the only airport
in the UK today that has the diversity of business models to support the technology evolution that this
change in consumer behaviour will require, but it will only be possible with the capacity and scale of a
second runway.
Conclusion
Since the break-up of BAA, the competitive dynamic has resulted in a range of innovations at Gatwick
airport. As a result, we have
Dramatically improved the passenger experience at Gatwick
Attracted a range of new airlines
Significantly improved the efficiency of the airport,
And have a range of further innovations in the pipeline.
Our conclusion from the benefits seen from the competition introduced by the break-up of BAA is that
the Commission must not ignore the innovation that will be delivered by maintaining the competitive
dynamic that has been unleashed. Not only will an expansion of Heathrow reverse the competitive
dynamic, but it will also lead to an unknown – but negative – reduction in the amount of innovation
that will be seen at all the London airports.
SD1 Strategic Argument – 2.Strategic Fit
Response to Airports Commission Updated Scheme Design 103
Objective: “To maximise the benefits of competition to aviation users and the broad economy”
2.10 Competition and Air Fares for Passengers
Key findings: Gatwick expansion will generate substantial additional competition and this will
intensify over time as more routes are contested between London’s two main airports by the most
competitive airline business models. In contrast, Heathrow expansion would increase its already
significant market power and lead to relatively high air fares, less innovation and less choice.
Only 2+2 would enhance London’s leading European aviation hub status. The reduced competition
and high costs of 3+1 would inevitably see London reduced to more of a niche role, serving a
narrower range of airlines, passengers and destinations.
Oxera has estimated:
A direct competition benefit from expanding Gatwick relative to Heathrow of between £10bn and
£14bn in PV terms as a result of the reductions in fares resulting from greater intensity of
competition between airlines;
An indirect competition effect, as a result of the greater intensity of competition from Gatwick
which could be as much as the direct effect ie. an additional £10-14bn
Context
Market liberalisation has been implemented with the objectives of reductions in fares through greater
competition and encouraging more efficient airlines through removing barriers to entry and enabling
more economies of scale. Reduction in fares also stimulates the market, leading to higher traffic
volumes.
A study of the EU single aviation market found that liberalisation has greatly increased competition on
many routes, has resulted in many more new routes operating, and has led to a 34% decline in fares
in real terms12.
Over the last decade, competition in the provision of air services has intensified across the London
airport system. There are more routes contested between different airlines and also different airports.
The BAA Heathrow monopoly of the three largest London airports has been broken up, which has
stimulated a greater level of competition between airports. This was discussed earlier in this
document.
Enhanced competition has led to lower fares, better service and airline and airport innovation.
Empirical evidence (see below) shows that fares are reduced when competition intensifies. Fare
reductions are particularly marked when competition exists between airlines operating different
business models and from different airports.
Full service airlines have adapted and now offer lower fares and simpler pricing structures in
response to competition from low cost carriers. Low cost airlines are increasingly tailoring their offer to
appeal to business passengers to compete with full service airlines.
12 European Experience of Air Transport Liberalisation”, Joint Presentation by the European Union and the European Civil
Aviation Conference to the 5th Worldwide Air Transport Conference (ICAO), 24-29th March 2003.
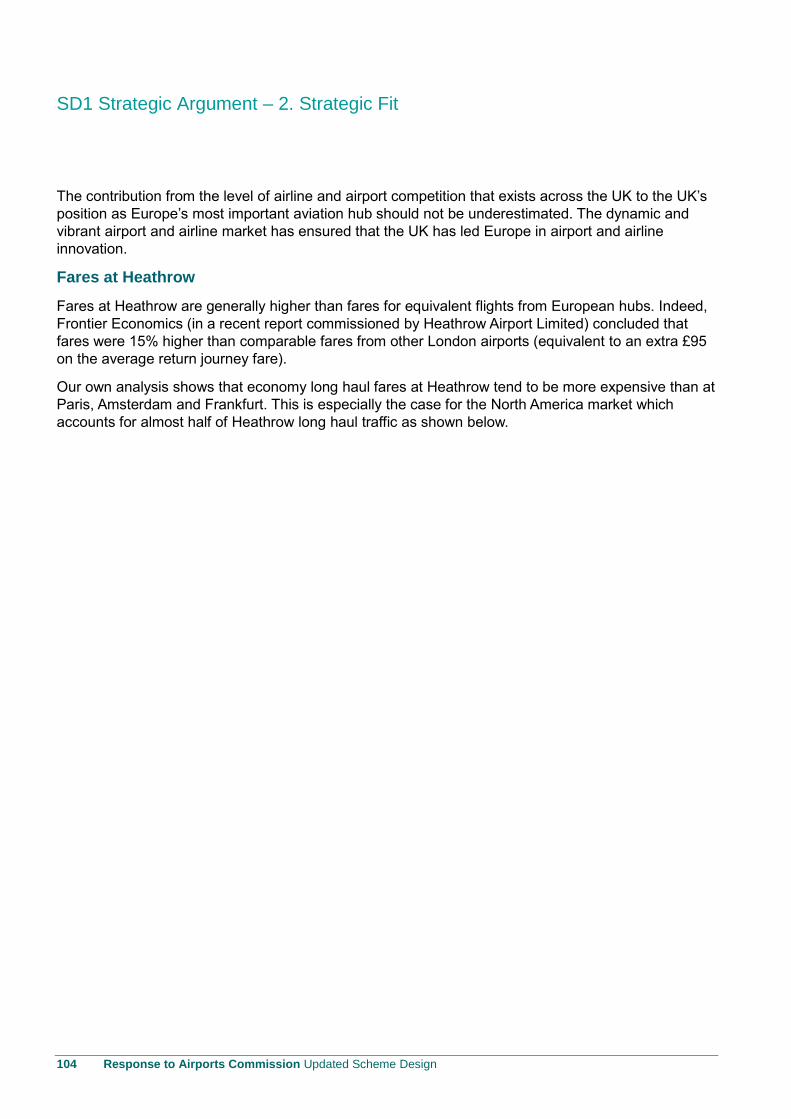
SD1 Strategic Argument – 2. Strategic Fit
104 Response to Airports Commission Updated Scheme Design
The contribution from the level of airline and airport competition that exists across the UK to the UK’s
position as Europe’s most important aviation hub should not be underestimated. The dynamic and
vibrant airport and airline market has ensured that the UK has led Europe in airport and airline
innovation.
Fares at Heathrow
Fares at Heathrow are generally higher than fares for equivalent flights from European hubs. Indeed,
Frontier Economics (in a recent report commissioned by Heathrow Airport Limited) concluded that
fares were 15% higher than comparable fares from other London airports (equivalent to an extra £95
on the average return journey fare).
Our own analysis shows that economy long haul fares at Heathrow tend to be more expensive than at
Paris, Amsterdam and Frankfurt. This is especially the case for the North America market which
accounts for almost half of Heathrow long haul traffic as shown below.
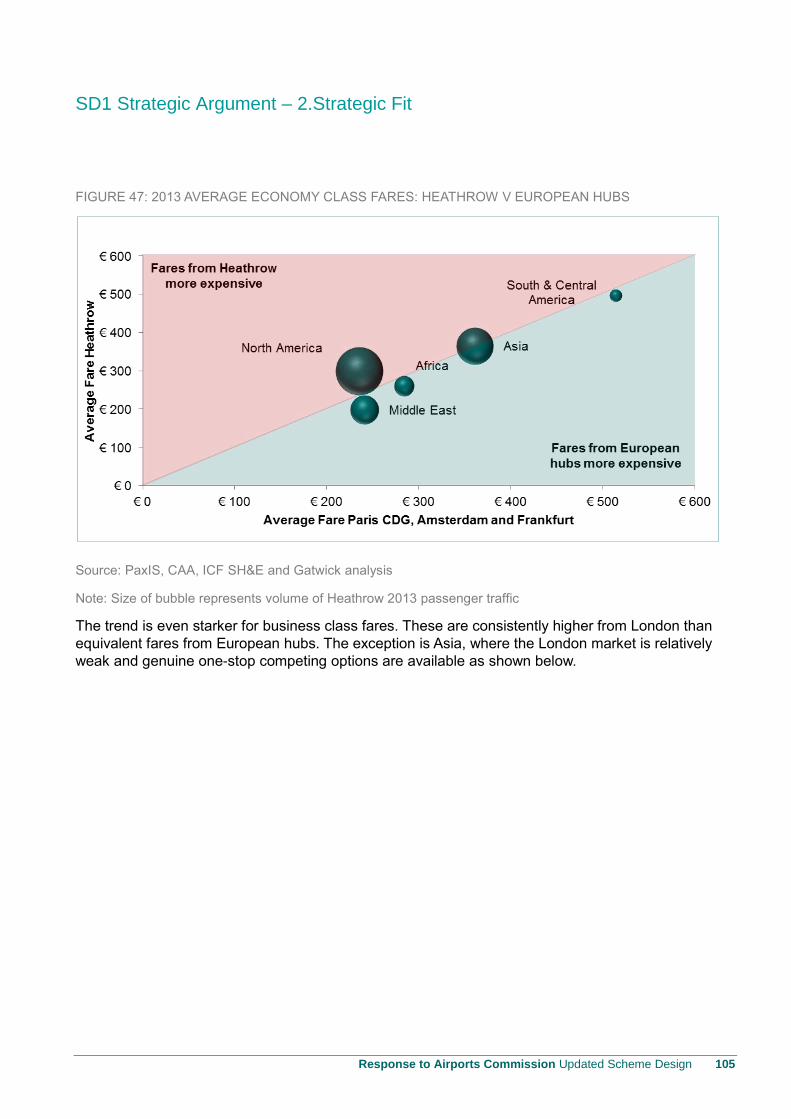
SD1 Strategic Argument – 2.Strategic Fit
Response to Airports Commission Updated Scheme Design 105
FIGURE 47: 2013 AVERAGE ECONOMY CLASS FARES: HEATHROW V EUROPEAN HUBS
Source: PaxIS, CAA, ICF SH&E and Gatwick analysis
Note: Size of bubble represents volume of Heathrow 2013 passenger traffic
The trend is even starker for business class fares. These are consistently higher from London than
equivalent fares from European hubs. The exception is Asia, where the London market is relatively
weak and genuine one-stop competing options are available as shown below.
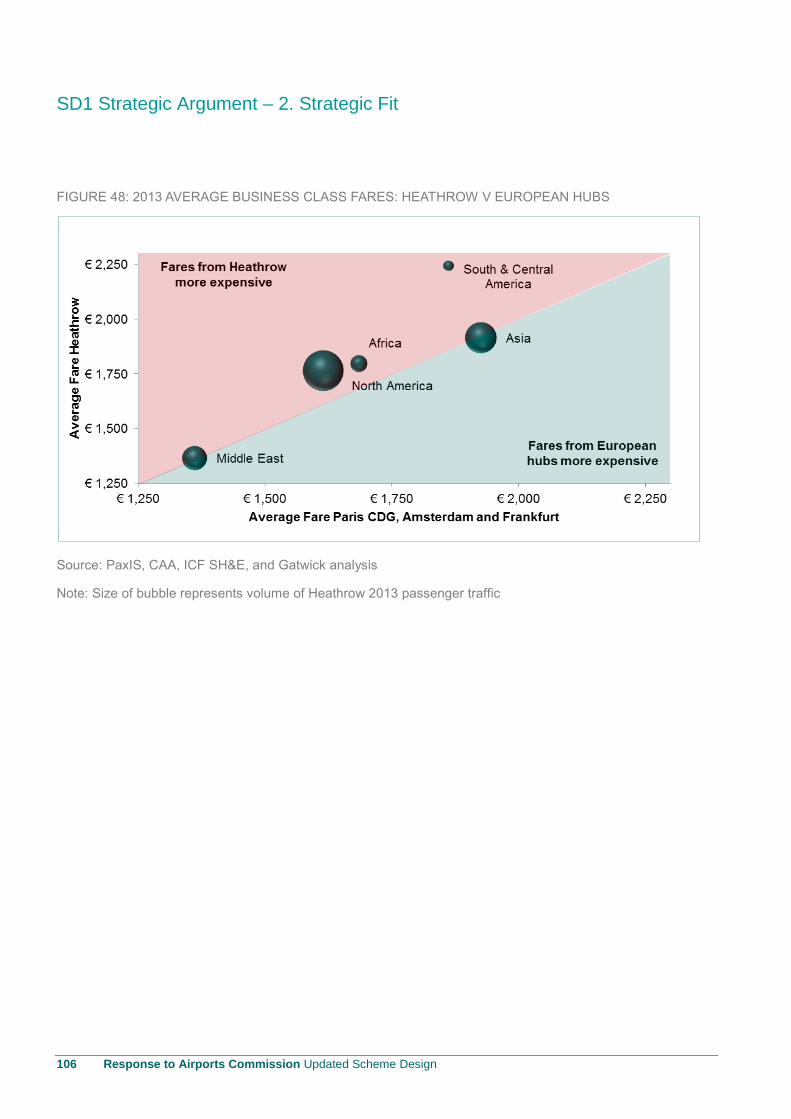
SD1 Strategic Argument – 2. Strategic Fit
106 Response to Airports Commission Updated Scheme Design
FIGURE 48: 2013 AVERAGE BUSINESS CLASS FARES: HEATHROW V EUROPEAN HUBS
Source: PaxIS, CAA, ICF SH&E, and Gatwick analysis
Note: Size of bubble represents volume of Heathrow 2013 passenger traffic

SD1 Strategic Argument – 2.Strategic Fit
Response to Airports Commission Updated Scheme Design 107
Full service airlines v low cost carrier air fares
There is a significant difference in average air fares between the low cost carrier and full service
airline business models.
FIGURE 49:
SD1 Strategic Argument – 2. Strategic Fit
108 Response to Airports Commission Updated Scheme Design
Route Level Competition under 2+2 and 3+1
The 2+2 option would secure a balanced and competitive UK aviation market for the future, with more
competition than currently exists. In contrast, 3+1 would reverse recent gains, resulting in diminishing
competition that would put at risk the UK’s leading position as a global aviation centre and stifle the
need for creativity and innovation.
A two runway Gatwick would continue to face strong competition in the full service segment from
Heathrow and equally strong competition in the low cost carrier segment from Stansted, Luton and
Southend. However, a three runway Heathrow would become fortress Heathrow, with little viable
competition from other airports in the full service segment. Furthermore, under 3+1, the capacity
would not exist for low cost carriers to grow and compete with Heathrow airlines from other London
airports.
The high cost of operating at Heathrow would reduce the incentives for airlines there to compete on
price in the 3+1 option. Lack of spare capacity at Gatwick would reduce motivation for incumbent
Gatwick airlines to offer the lowest possible fares.
The 2+2 London airport system would also result in more contested routes between airports, and
more contested routes between different airline types. Under 2+2, there will be circa 24% more
contested flights by 2050 across the London Airport System compared to 3+1 as shown below.
FIGURE 50: 2050 NUMBER OF WEEKLY FLIGHTS FROM LONDON
Source: ICF SH&E, Gatwick Analysis
Note: Strongly Contested Flights are flights where at least 2 London airports serve the same destination city with minimum
frequency of 5 per week (long haul) and 10 per week (short haul)
Only 2+2 would enhance London’s leading European aviation hub status. The reduced competition
and high costs of 3+1 would inevitably see London reduced to more of a niche role, serving a
narrower range of airlines, passengers and destinations.
SD1 Strategic Argument – 2.Strategic Fit
Response to Airports Commission Updated Scheme Design 109
Research on Competition and Air Fares
Relative fares are influenced by three factors:
Direct competition between airlines on a city pair route;
Indirect competition between airlines (wider impact of across a range of markets);
The business model of airlines operating on a city pair and more generally.
The third factor is not a pure competition factor. The presence of low cost carriers on a route (or in the
market more generally) will exert downward competitive pressure on fares of other operators in the
same market. However, beyond this competitive impact, it will also lead to reduced average fares
simply by virtue of it offering lower fares than incumbent operators.
InterVISTAS has undertaken research on behalf of Gatwick into “The Importance of Airport
Competition on Air Fares Paid by Consumers”. This has been based on a review of 30 year literature
on the impact of market structure (i.e. competition) on air fares.
InterVISTAS found that “the presence or not of low cost carriers is the single most important factor in
determining fares paid by consumers and the level of traffic”. Clearly, for the future London airport
system to maximise connectivity, it is vital that low cost carriers have the ability to serve the demand
that exists for their products.
The InterVISTAS research also produced some interesting insights on airport competition. It found
that the competitive impacts between airlines were greater when they were operating from different
airports in the same system.
For example, the competition effects would be stronger on London-Rome if 2 carriers were competing
from different London airports (or indeed, different Rome airports) compared to competing from within
the same airport.
This impact has been identified by comparing airlines of the same type operating at different airports
i.e. this is in addition to competitive impacts derived from airlines of different business models
competing with each other.
Conclusions from InterVISTAS Report
In the current debate regarding airport capacity in the London market, consideration should be given
to where that capacity will produce fare benefits for consumers. Connectivity at high fares is of much
less benefit than connectivity at affordable, competitive fares. A capacity decision that only adds
capacity at the primary airport used by network carriers will have two detrimental effects from a fares
point of view. First, by curtailing the growth of LCCs at Gatwick and eventually Stansted, local
passengers and visitors will pay higher fares in the future at all airports. Second, by inducing network
carriers to serve only one airport, local passengers and visitors will forego fare competition benefits
that we observe when network carrier service is available at two airports.
SD1 Strategic Argument – 2. Strategic Fit
110 Response to Airports Commission Updated Scheme Design
Airport Competition within the London Airport System
Improving competition within the London airport system was the driver behind the recent breakup of
BAA resulting in the disposal of Gatwick and Stansted airports. However, even with the break-up, the
Competition Commission recognised that Heathrow would still have substantial market power, noting:
“At Heathrow, the UK’s only hub airport, BAA [now Heathrow Airport Limited] will continue to have
substantial market power even after it no longer owns either Gatwick or Stansted.13”
“Heathrow’s position as the only significant hub airport in the South East, and indeed the UK, is
itself a feature that restricts competition between airports14.”
The CAA also recognises the importance of airport competition, for example in its awards of traffic
rights to Tel Aviv and Moscow to easyJet:
“… the CAA considers that Gatwick and Heathrow can be considered to be in the same market,
and therefore that there will be competition between services from the two airports. The CAA
recognised the validity of comparisons between the Moscow route and Tel Aviv where there was
evidence that a service operated from another London airport had posed a competitive constraint
on a BA Heathrow service15.”
InterVISTAS has also explicitly considered airport competition within the London airport system. Key
conclusions from this analysis are set out below.
Conclusions from InterVISTAS Report
The break-up of the BAA monopoly by the Competition Commission (CC) was designed to increase
airport competition. This has already brought about substantial benefits for passenger and carriers.
Adding additional capacity at Heathrow will strengthen Heathrow’s market dominance and weaken the
competitive constraints on the airport. It will ensure that Heathrow can continue to exploit its role as
the UK’s only hub airport and bring a halt to the opening up of competition that the CC has started.
In conclusion, the Airports Commission should give considerable weight to options which enhance the
competitive dynamics of the UK aviation market – this competition will ensure route development best
meets the needs of the market and foster competitive pricing due to airport and airline competition.
13 Competition Commission News Release: BAA Ordered to Sell Three Airports, 19 March 2009, page 2.
14 Competition Commission News Release: BAA Ordered to Sell Three Airports, 19 March 2009, page 4.
15 UK CAA, “Decision on Scarce Capacity Allocation Certificates, SCAC1/12”, October 2012.
SD1 Strategic Argument – 2.Strategic Fit
Response to Airports Commission Updated Scheme Design 111
Economic Evaluation
Gatwick has commissioned Oxera to investigate the competition impacts of 2+2 and 3+1 versus the
Do Minimum case. Specifically, Oxera has sought to quantify the respective impacts of competition in
financial terms.
The focus of this work has been the pro-competition impacts (as opposed to more generalised
benefits from greater presence of low cost carriers leading to greater availability of lower fares).
The research undertaken by Oxera (in cooperation with ICF SH&E and InterVISTAS) looked at the
scale and nature of competition on a route by route basis. Under the three scenarios, the intensity16 of
competition on each route served from London was estimated and analysed. The nature of
competition – whether it was within a single airport (intra-airport) or across airports (inter-airport) was
also evaluated.
In summary, Oxera estimated the direct competition PV benefit of expanding Gatwick as opposed to
expanding Heathrow of £10bn to £14bn and an indirect benefit of an additional £10bn to £14bn. The
total competition benefit could therefore be in the range of up to £30bn.
Conclusions from Oxera Report
Oxera’s analysis indicates that:
An additional runway at Gatwick (relative to any other scheme shortlisted by the Airports
Commission) would lead airports to compete more vigorously for airlines, and airports and airlines
to compete more vigorously for passengers.
It would therefore be associated with lower costs for airlines, and lower fares for passengers. The
scheme would also be likely to deliver wider market participation than additional capacity at
Heathrow - i.e. a 2+2 solution provides for a wider range of airline business models to be satisfied
than 3+1, and thus both greater passenger numbers and a wider distribution of the benefits of the
increased capacity.
Oxera has estimated:
A direct competition benefit from expanding Gatwick relative to Heathrow of between £10bn and
£14bn in PV terms as a result of the reductions in fares resulting from greater intensity of
competition between airlines;
An indirect competition effect, as a result of the greater intensity of competition from Gatwick
versus Heathrow expansion, which could be as much as the direct effect ie. an additional
£10-14bn17.
16 Number of carriers on a route and level of frequency operated.
17 Economic impact assessment figures are presented in 2010 prices
SD1 Strategic Argument – 2. Strategic Fit
112 Response to Airports Commission Updated Scheme Design
2.11 Freight
Key findings: Gatwick can provide the land, the infrastructure and the excellent surface access
networks needed to promote the expansion of freight operations at a price that will foster real
competition and growth. This will contrast with the position at Heathrow where there are high costs,
poor efficiency and where there is already a shortage of space resulting in freight forward agencies
being scattered around the area.
Context
The importance of freight and the interests of its users have been recognised by the Airports
Commission. The key components of the 2+2 solution apply equally to freight as to passengers.
With a second runway, the expansion of long haul services at Gatwick, especially to emerging
markets, will support significant growth in cargo throughput. This is forecast to reach 1.07m tonnes by
2050. While Heathrow is the largest freight airport today, the growth of Gatwick will provide the
opportunity for competition and choice within the air freight market.
Gatwick’s Master Plan provides space for 65,000m2 of state of the art cargo buildings, which,
importantly, will be located directly on the airside boundary. These can be tailored to the specific
needs of future operators, e.g. provision for the handling of perishable goods. Flexible leases can be
offered at much lower costs than at Heathrow where there is a shortage of space. This has resulted in
freight forward agencies being scattered around the Heathrow area. Gatwick can provide the land, the
infrastructure and the excellent surface access networks needed to promote the expansion of freight
operations at a price that will foster real competition and growth.
In this section, we analyse the major issues impacting the freight sector and outline how 2+2 will meet
the needs of this sector as well as the wider needs of the UK.
Background
Heathrow is the largest freight airport in the UK. In 2013, it handled 1.4m tonnes of freight. The vast
majority of freight was carried in the bellyhold of passenger aircraft, with only 70,000 tonnes
transported by dedicated freighter aircraft.
Currently, Heathrow is the dominant airport in the UK for long haul passenger aircraft operations. This
in turn gives it a dominant position in air freight.
Long haul aircraft have large cargo carrying capacity (in some cases up to 30 metric tonnes on
the B777-300).
This belly capacity is utilised by shippers as most freighters land in Europe and use surface
transportation to the UK.
UK Government Traffic Distribution Rules (TDRs) heavily restrict the use of dedicated freighter aircraft
at both Heathrow and Gatwick to carriers with grandfather rights.
As a result, Stansted is now the main London airport for freighter aircraft, with 210,000 tonnes
recorded in 2013. Stansted has negligible freight carried on passenger aircraft due to the nature of the
passenger airlines operating at Stansted, and is not a preferred location by airlines or logistics
companies.
SD1 Strategic Argument – 2.Strategic Fit
Response to Airports Commission Updated Scheme Design 113
Gatwick freight throughput in 2013 was 100,000 tonnes, carried almost entirely on passenger aircraft.
Gatwick has carried much greater freight volumes in the past when there was a greater prevalence of
long haul flights. For example, Gatwick freight reached 320,000 tonnes in 2000. This demonstrates
that with the right flight network, Gatwick has potential for much greater freight volumes than currently
being achieved. Gatwick has all the required agriculture, customs and related services in place.
Elsewhere in the UK, East Midlands Airport is the main express hub, home to DHL and Royal Mail
operations. It benefits from its central location in the UK (integrated into the motorway network), 24-
hour operations, agriculture and customs facilities, and dedicated cargo handling facilities.
Market Position
While Heathrow is the major UK airport for freight, it is not a classic transfer hub. Very little freight
undergoes air-air transhipment. Instead, freight is transferred from air to bonded off-airport facilities
and then via truck to its final destination.
Freight forwarders are consolidated within the vicinity of Heathrow. This allows forwarders to build up
or break down consignments for air services in controlled forwarder off-airport facilities close to the
airport. The primary reason for this is the way cargo is consolidated under a master document (e.g.
aircraft pallet).
However, there are no underlying reasons for freight forwarders or logistics customers to use
Heathrow beyond historical reasons and the concentration of cargo capacity in passenger aircraft. In
many ways, Heathrow and its vicinity is an unattractive place to operate from.
The airport is operationally inefficient, leading to high operating cost;
This takes the form of direct costs (e.g. poor aircraft utilisation, extra fuel) and indirect costs (poor
punctuality, leading to unreliable delivery of time sensitive goods);
Landing charges are high;
Warehouse rentals at and around Heathrow are very expensive and facilities are often out dated;
Surface access congestion is a significant issue.
Assessment of Need for Users
The primary focus of freight forwarders and other air freight users is on reliable service and
competitive prices. It is common practice to truck air freight long distances to an airport where cargo
capacity is less expensive than the local airport.
For example, large volumes of freight from Asia are flown into Amsterdam and Paris on freighters and
then trucked overnight to London as opposed to flying direct to Heathrow. This is due to reasons of
cost as the cost saving from 2 hours less flying (by terminating an Asian flight in Europe versus the
UK) is considerable.
Other issues include slot and traffic rights, while warehousing at Heathrow is more expensive than at
European airports.
While price premiums exist for direct air services versus transhipment itineraries, there is no material
premium that can be charged in relation to airport preferences.
SD1 Strategic Argument – 2. Strategic Fit
114 Response to Airports Commission Updated Scheme Design
Gatwick Potential
Gatwick, with a critical mass of cargo capacity (via long haul operation), would be an attractive
alternative for air freight customers.
The 43 miles between Heathrow and Gatwick is almost negligible compared to the long distances
air freight is trucked across Europe after arrival or before departure at the airport.
With more substantial cargo capacity at Gatwick than exists today, forwarders would develop a
greater presence in the Gatwick area.
Clean industries such as distribution facilities and e-commerce providers would follow.
Airfreight customers could choose which handler to use based on the availability of services at
each airport.
Vision for Freight at Gatwick
The ICF SH&E forecasts for Gatwick indicate strong growth in long haul passenger operations after
the opening of a second runway.
These services are expected to be focussed on emerging markets (especially Asia), and largely
from foreign airlines.
Freight is a key part of the business model for emerging market airlines, with fleet orders for larger
aircraft reflecting the importance of freight.
Heathrow, meanwhile, is expected to retain its strong position serving North America and the Indian
sub-continent, and to remain the main hub for UK network airlines.
By 2050, the traffic forecasts envisage passenger throughput of 95mppa, accompanied by 1.07m
tonnes of freight.
These forecasts do not assume any relaxation of the current Traffic Distribution Rules restricting
freighter operations at Gatwick. This uplift in freight is based on a major increase in cargo capacity on
long haul passenger aircraft.
However, Gatwick could better serve the needs of the UK freight industry (and its many customers) by
being able to offer some dedicated freighter flights.
For reasons of cost and efficiency, airlines prefer to operate to one airport for both passenger aircraft
and freighter aircraft. The relaxation of freighter aircraft restrictions, following capacity increase at
Gatwick, would make this possible thereby offering an economic benefit to UK industries and the
ultimate spin off of more employment and economic benefit to the region.
Dedicated freighter flights at Gatwick would not need to have any implications for night flights.
Demand will predominantly be from Asia, arriving in Gatwick during the morning. It is not suggested
that European integrator flights (which require overnight operations) should be accommodated.
A two runway Gatwick has some structural advantages versus a three runway Heathrow.
Airlines will benefit from competitive airport charges and efficient infrastructure.
Freight operators at Gatwick can offer certainty to customers, and ensure operating costs are
competitive compared to services from other European airports.
SD1 Strategic Argument – 2.Strategic Fit
Response to Airports Commission Updated Scheme Design 115
In contrast, Heathrow’s current operational issues and high costs will only worsen with a third runway.
Gatwick would also pursue the development of warehouse and logistics facilities on and around the
airport. The immediate vicinity of the airport is much less space constrained than Heathrow, and
facilities could be developed adjoining the existing airport boundary. Such industries are
environmentally friendly compared to most alternatives.
The strong growth in e-commerce has led to a need for dedicated, modern and specialised facilities in
the South East close to a major airport.
This is again a clean industry which generates local jobs. The space to develop these facilities is not
available around Heathrow and even if it was, it would not be cost competitive.
The cost of labour for warehousing and distribution jobs is likely to be lower in the Gatwick region than
in the Heathrow vicinity, offering an added incentive to logistics companies.
Gatwick would also develop a perishable goods handling centre, available for use by all airlines.
Heathrow currently has a facility owned and operated by British Airways, which is restrictive (it is not
available for other airlines). Given the more reasonable costs of land, the rentals would be more
competitive for users than around Heathrow.
Finally, Gatwick also has the advantage that the road network around the airport is less congested
than that around Heathrow, making operations more efficient for forwarders, allowing greater
efficiency and later cut off times for flights, a great incentive for airlines.
Conclusion
Given the price and time sensitive nature of air freight, the London airport system will better serve the
needs of the industry and the UK with a second runway at Gatwick.
Heathrow will remain an important freight airport, but a two runway Gatwick would give customers
genuine choices. The lower costs, better facilities and reliability of operating from Gatwick will be a
compelling proposition for air freight users.
It is likely that logistic facilities would develop around Gatwick to complement existing facilities near
Heathrow. Customers would choose which airline and airport based on flight availability, reliability
and cost.
In contrast, a third runway at Heathrow would not solve the key issues with airfreight at the airport. In
fact, a third runway would only increase congestion in the local area, and drive up costs for labour and
facilities.
Due to high costs and poor reliability, it is likely that with 3+1, increasing volumes of freight would be
trucked to European airports for onward flight in this scenario. This would have negative implications
for the UK economy as well as adverse environmental impacts.
SD1 Strategic Argument – 2. Strategic Fit
116 Response to Airports Commission Updated Scheme Design
Objective: “To maximise benefits in line with relevant long term strategies for economics and spatial
development”
Key findings: Expansion of Gatwick will support each of the three long term economic and spatial
development strategies relevant to Gatwick and help each become a reality. More generally it will aid
economic growth across London and the South East.
The expansion of Gatwick will contribute to the spatial rebalancing of London’s economy, providing
linkages and connectivity to areas that have been earmarked for regeneration or have capacity for
growth. This growth has the potential to address the historic and emerging imbalances in the London
and South East economy. Growth at Gatwick will deliver benefits for the local catchment area and
boost businesses within the Gatwick Diamond generating important benefits for those in the local
area.
2.12 Economic and Spatial Development
There are three long term economic and spatial development strategies of particular relevance to the
expansion of Gatwick:
1. The London Plan18;
2. The Gatwick Diamond strategic statement19;
3. The Coast to Capital Local Enterprise Partnership strategy for growth20.
Despite being located outside Greater London, Gatwick has long been recognised as an important
contributor to the London economy. Consequently, the development of Gatwick is very relevant to the
London Plan: the spatial development strategy for London.
Surface Access Linkage Benefits
Surface access linkages are an intrinsic part of converting the benefits of connectivity by air into
actual economic flows to and from London, with the associated benefits of employment and wealth.
The £6.5bn Thameslink upgrade programme lies at the heart of Gatwick’s transport improvements
that will facilitate flows of benefits to key growth areas North and South of the airport. This programme
will transform the speed with which passengers can get from the airport into London, and vice versa.
In addition, the significant increase in economic activity in London’s key Regeneration and
Opportunity areas will be supported by excellent surface transport links to and from an expanded
Gatwick. The economic and physical flows arising from an expanded Gatwick to these areas will be
fast, frequent and reliable thereby maximising regeneration benefits and catalytic effects e.g.
increased employment, trade and foreign direct investment.
18 Mayor of London (2011), ‘The London Plan: spatial development strategy for Greater London’, July 2011
19 Crawley Borough Council, Horsham District Council, Mid-Sussex District Council, Mole Valley District Council, Reigate &
Banstead Borough Council, Surrey County Council and West Sussex County Council (undated), Gatwick Diamond Local
Strategic Statement 20
Coast to Capital Local Enterprise Partnership (2012), Our Strategy for Growth, July 2012
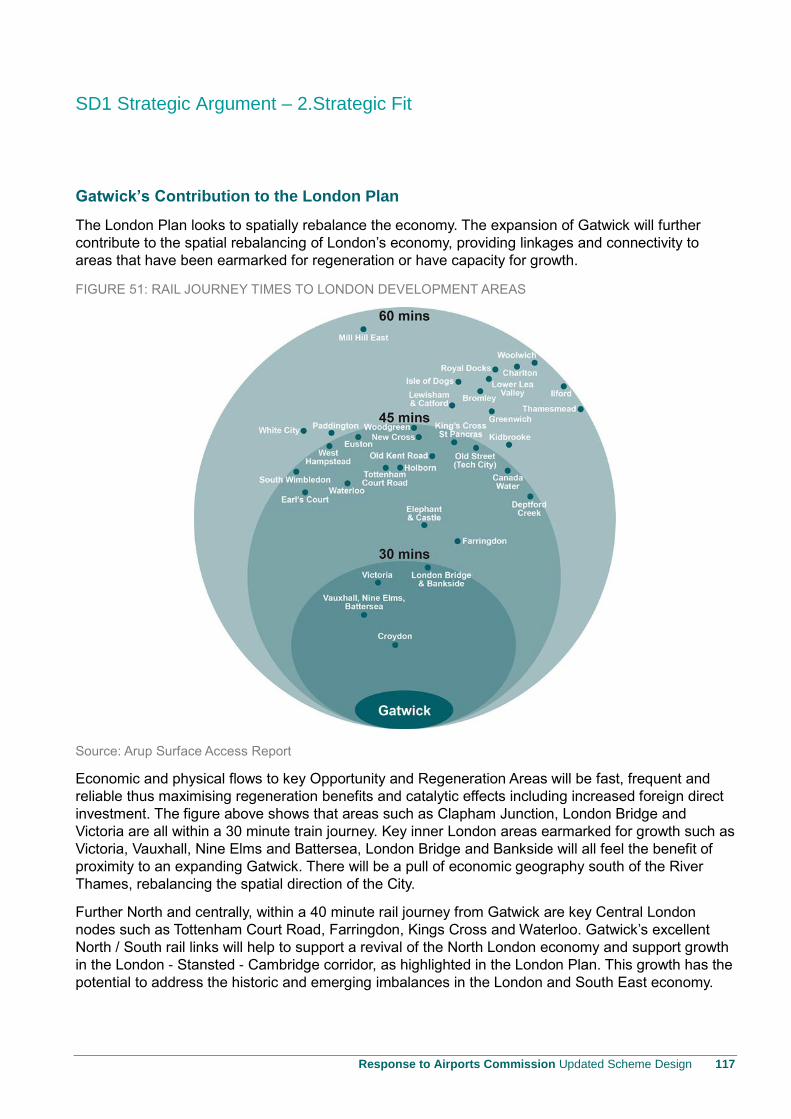
SD1 Strategic Argument – 2.Strategic Fit
Response to Airports Commission Updated Scheme Design 117
Gatwick’s Contribution to the London Plan
The London Plan looks to spatially rebalance the economy. The expansion of Gatwick will further
contribute to the spatial rebalancing of London’s economy, providing linkages and connectivity to
areas that have been earmarked for regeneration or have capacity for growth.
FIGURE 51: RAIL JOURNEY TIMES TO LONDON DEVELOPMENT AREAS
Source: Arup Surface Access Report
Economic and physical flows to key Opportunity and Regeneration Areas will be fast, frequent and
reliable thus maximising regeneration benefits and catalytic effects including increased foreign direct
investment. The figure above shows that areas such as Clapham Junction, London Bridge and
Victoria are all within a 30 minute train journey. Key inner London areas earmarked for growth such as
Victoria, Vauxhall, Nine Elms and Battersea, London Bridge and Bankside will all feel the benefit of
proximity to an expanding Gatwick. There will be a pull of economic geography south of the River
Thames, rebalancing the spatial direction of the City.
Further North and centrally, within a 40 minute rail journey from Gatwick are key Central London
nodes such as Tottenham Court Road, Farringdon, Kings Cross and Waterloo. Gatwick’s excellent
North / South rail links will help to support a revival of the North London economy and support growth
in the London - Stansted - Cambridge corridor, as highlighted in the London Plan. This growth has the
potential to address the historic and emerging imbalances in the London and South East economy.
SD1 Strategic Argument – 2. Strategic Fit
118 Response to Airports Commission Updated Scheme Design
Closer in, the transport links to Gatwick will help bring forward growth in Tottenham and Finsbury
Park, which arguably are close to a tipping point, to receive high levels of investment with their
connections to many parts of the capital and both Stansted and Gatwick airports.
To the South of London, places like Croydon, Sutton and the Wandle Valley will see increasing wealth
and employment opportunities pulled South of the river, supporting their development as business
destinations. These parts of South London have ambitious plans to deliver on jobs and growth and
see deprivation decrease. Expansion of Gatwick will accelerate both their development as
destinations and provide a source of workforce for the expanded airport. Gatwick’s employment
strategy will help to ensure that the benefits of an expanded airport are spread directly to these areas.
Gatwick’s contribution to local economic development
At a more local level, with Gatwick at its core, the informal boundary of the ‘Gatwick Diamond’
stretches from the southern edge of London to the northern boundaries of Brighton and Hove.
Proximity to Gatwick, good surface access and connectivity has helped create the conditions that
have enabled the Diamond to grow as a national and international business location. This transport-
led growth will also be felt by communities along the South Coast: jobs created (both directly and
indirectly) by Gatwick during the LGW R2 build and operate phases will provide huge opportunities for
many of these communities
Growth at Gatwick will deliver benefits for the local catchment area and boost businesses within the
Gatwick Diamond. This growth will assist in delivering the vision in key economic development and
planning documentation such as the Gatwick Diamond Strategic Statement and the Coast to Capital
LEP Strategy for Growth.
The first objective of the Gatwick Diamond group is the “development of a flourishing and competitive
knowledge based economy with high levels of entrepreneurship, providing sustainable employment
and operating in an environment which enables the Diamond to be recognised, nationally and
internationally, as one of the top locations for businesses.”21
Although the Diamond is performing strongly relative to the South East and the UK as a whole, in a
number of areas, including the ratio of jobs to people, there are also signs of current weakness. For
example, since 1999, productivity growth (as measured by gross value added per worker) has been
below the South East average, and the transport sector of the regional economy is declining in
employment terms.22 Expansion at Gatwick would be instrumental in reversing these trends, putting
the Diamond back on route to achieve its vision of strong economic growth.
Economic growth is also central to the Coast to Capital LEP’s main aim, of achieving net private
sector employment growth of 100,000 jobs over the 25 years to 2035.23
21 Gatwick Diamond ‘Local Strategic Statement’, 2011, p4
22 Gatwick Diamond ‘Local Strategic Statement’, 2011, p5
23 Coast to Capital LEP, ‘Our Strategy for Growth’, July 2012, p3
SD1 Strategic Argument – 2.Strategic Fit
Response to Airports Commission Updated Scheme Design 119
One of the two pre-requisites that the Coast to Capital LEP recognise as being essential to achieving
their aspirations for jobs is business internationalization. The boost that a second runway at Gatwick,
and in particular the development of the airport as a destination for long-haul flights, would provide to
this aspiration is clear. Similarly, a secondary aim of the Diamond group is the development of a
“sustainable transport system which gives good access to Gatwick Airport, the main centres of
employment and the larger town centres.”24
The expansion of the airport, and the infrastructure development which would accompany this, would
in itself boost progress towards this objective, as well as increasing the incentive for further expansion
of the transport network in the Diamond area generally. The same can be said of a number of the
Diamond group’s longer term aspirations. One idea is the development of a modern, flagship, science
and technology park25, which, where developed elsewhere in the country, have proved particularly
attractive to international investors. The case for ambitious projects such as these, which could
provide a real boost to both the local and national economy, would be substantially strengthened were
Gatwick to expand.
Overall, a second runway at Gatwick would significantly enhance the prospect of meeting the visions
of both the Coast to Capital LEP and the Gatwick Diamond group, and in doing so, will generate
important benefits for those in the local area.
Minimising impact on other airports
Gatwick with two runways will result in a better served London airports market than a Heathrow with
three runways as confirmed through modelling by ICF SH&E26. Given the significant levels of
business clustering already around Heathrow, expansion at Gatwick is not expected to have a
significant adverse effect on the area around Heathrow. Rather, the growth of air travel and
associated catalytic employment will benefit both localities.
24 Ibid, p10
25 Ibid, p13
26 ICF SH&E, Market Trends, Forecasts, and Implications for Airport Capacity.
SD1 Strategic Argument – 3. Economy Impacts
120 Response to Airports Commission Updated Scheme Design
3. Economy Impacts
Objective: “To maximise economic benefits and support the competitiveness of the UK economy”
3.1 Impact on UK Economy and Competitiveness27
Key findings: Gatwick will deliver around £40bn more benefit to the UK economy than Heathrow.
The present value (PV) of Gatwick R2 is £79bn plus £10bn to £14bn of indirect competition benefit,
providing a total benefit–cost ratio (BCR) of 4.9 (excluding wider economic impacts and using total
resource costs as the denominator). The PV of the Heathrow NW scheme is £51bn, providing a BCR
of 1.5 (excluding WEIs). This analysis shows that LGW R2 is the preferred option for providing the
additional runway capacity required to meet the UK’s need for additional aviation connectivity, by
providing a solution that would have lower costs, greater competition, superior economic benefits and
lower environmental costs than the alternative of an additional runway at Heathrow.
Introduction
Expanding Gatwick is expected to benefit the economy through a number of mechanisms:
The impact on passengers and users of freight services;
The impact on airports and airlines;
The effect on the wider economy.
When considering the benefits of expansion at Gatwick, it is important to consider different types of
passenger benefit. In keeping with most previous work in this area, Gatwick has considered the
impacts on business and leisure passengers separately and has further segmented the market by
domestic, short and long haul passengers.
Assessment base case
Gatwick appointed Oxera and PA Consulting to independently assess the economic impacts of
expansion relative to a base case (or Do Minimum). Given the (understandable) lack of information
from the Airports Commission in this area at this juncture, Gatwick has developed its own base case
where there is no increase in runway capacity in the South East of England.
Even in the base case, there is forecast to be an increase in passenger numbers using the London
airport system from approximately 159m in 2020 to approximately 203m in 2050 through more
efficient utilisation of available capacity and slowly increasing average plane size as illustrated in the
chart below.
The chart also shows that expansion at Gatwick is forecast to result in an increase in passengers
using the London system to 243m in 2050, while expansion at Heathrow is expected to result in an
increase in passengers to approximately 232m.
27 Economic impact assessment figures are presented in 2010 prices.

SD1 Strategic Argument – 3. Economy Impacts
Response to Airports Commission Updated Scheme Design 121
FIGURE 52: LONDON AIRPORT SYSTEM PASSENGER FORECAST BY SCHEME
Source: ICF SH&E
The use of a common base case enables the benefits of expansion at Gatwick to be compared to
those at Heathrow, which is provided below. Full details are set out in Oxera’s Economic Impact
Assessment report.
Key Conclusions
FIGURE 53: ECONOMIC BENEFITS COMPARED
(£ billion, 2010 prices) Gatwick R2 Heathrow NW Environment (noise and air quality) -0.2 -1.3 Greenhouse gases -13.4 -9.1 Economic efficiency (inc direct competition) 50.5 28.6 Public accounts (tax receipts, less subsidy) 14.8 11.3 PV of benefits (subtotal) 51.7 29.5 Wider economic benefits (secondary benefits for economy) 27.7 21.4 PV of benefits 79.4 50.8 Indirect competition benefits 10 to 14 -
PV of benefits (inc. indirect competition benefits) c.90 c.50

SD1 Strategic Argument – 3. Economy Impacts
122 Response to Airports Commission Updated Scheme Design
This table above shows that a new runway at Gatwick would deliver:
£79bn28, of economic benefits to the UK in aggregate over 60 year in present value terms, plus a
further £10bn to 14bn of indirect competition benefits;
£10bn to 14bn of benefits from direct competition resulting in lower fares, wider participation in the
aviation industry, and greater levels of innovation from both airports and airlines.
The wider cost of environmental impact (excluding greenhouse gases) which is significantly lower
for Gatwick (£0.2bn), compared with Heathrow (£1.3bn). Expansion at Heathrow would result in
approximately 190,000 people being affected by noise (an increase of approximately 50,000 from
the Do Minimum), while expansion at Gatwick would affect only c.14, 000 (an increase of
approximately 11,000 from the Do Minimum case).
The impact of extra traffic at Gatwick which increases greenhouse gases and their monetised
impacts (£13.4bn at Gatwick, while the Heathrow figure is £9.1bn).
The revenue generated for the Exchequer, is expected to be £15bn of additional direct and
indirect tax revenue at Gatwick, compared with £11bn for a new runway at Heathrow, when the
Heathrow £4bn to £6bn Government subsidy is taken into account. Subsidy is not required
at Gatwick.
£28bn of wider economic benefits (i.e. those that are additional to the benefits to users and
providers of aviation services) to the UK economy compared with £21bn for a third runway at
Heathrow. This value is considerably lower than some other benefits that have been attributed to
the expansion of airport capacity by some other studies29, principally because we have sought to
avoid double counting any of the costs or benefits of additional airport capacity.
In addition, the benefits from increased competition are likely to disperse throughout the London
airport system, benefiting all passengers, even on routes where there is no direct competition.
Indirect competition effect, as a result of the greater intensity of competition from Gatwick versus
Heathrow expansion, could be as much as £10 billion to £14 billion, effectively doubling the direct
competitive impact.
Overall this drives the benefits from Gatwick to be around £40bn higher than Heathrow’s benefits.
28 All monetary values are in net present value (NPV) over a 60-year appraisal period from 2021 to 2080, discounted to 2010
prices at the social discount rate of 3.5% for the first 30 years and 3.0% afterwards. 29
See, for example, Frontier Economics (2012), ‘One hub or none: the case for a single UK hub airport’, November 2012.
SD1 Strategic Argument – 4. Local Economy Impacts
Response to Airports Commission Updated Scheme Design 123
4. Local Economy Impacts
Objective: “To promote employment and economic growth in the local area and surrounding region”
Key findings: A second runway at Gatwick is estimated to create an extra 22,000 airport related jobs
by 2050. Between 16,000 to 18,000 of these jobs will be filled by people who live in the local area;
thus contributing £1.73bn per year to the local economy. A second runway at Gatwick is expected to
have further catalytic impacts on the local economy by attracting new business. A second runway at
Gatwick can support economic regeneration objectives within the wider area around Gatwick,
especially in some of the relatively deprived parts of London and the South East including parts of
South East London, Essex, Kent Thames Gateway sub-regions and the Sussex coastal towns
especially around Brighton where economic regeneration is targeted.
4.1 Direct Employment and Economic Effects
Employment at Gatwick is expected to grow based on an expanded volume of passenger traffic.
Continuing with a single runway, with approximately 50mppa, independent estimates by RPS suggest
that by 2050, Gatwick would employ a total of 37,700. With a second runway, the throughput of
passengers is forecast to grow to 95mppa leading to a total projected employment of 59,700. This will
result in an additional 22,000 jobs based on a low level of productivity improvements.
After allowing for the recruitment of local residents, the remaining jobs are expected either to be filled
by non-local workers or to replace other jobs which would have been created in the area. The net
increase in local workers is expected to create a requirement for 9,300 additional houses.
The increase from airport related employment is expected to be accommodated within the Gatwick
sub-region as capacity for an additional 115,000 dwellings has been identified based on local
authority assessments of their strategic housing land supply. The planned average annual
development rates amount to just over an additional 5,500 dwellings per year.
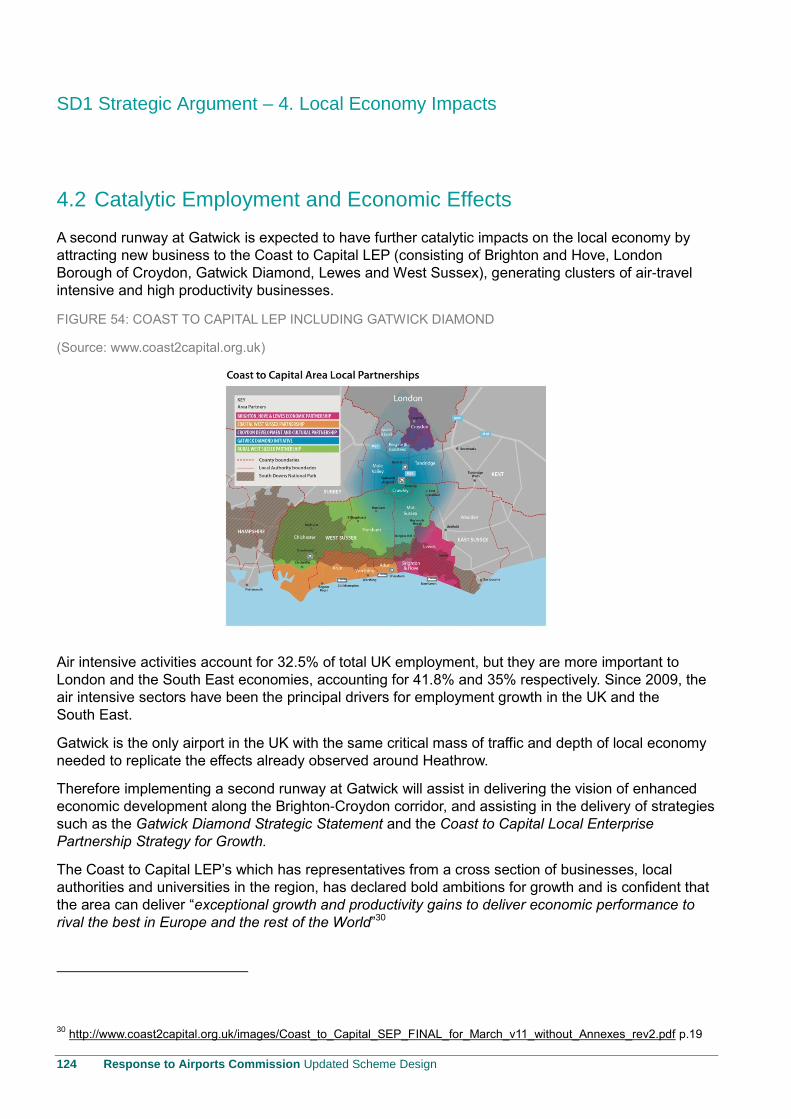
SD1 Strategic Argument – 4. Local Economy Impacts
124 Response to Airports Commission Updated Scheme Design
4.2 Catalytic Employment and Economic Effects
A second runway at Gatwick is expected to have further catalytic impacts on the local economy by
attracting new business to the Coast to Capital LEP (consisting of Brighton and Hove, London
Borough of Croydon, Gatwick Diamond, Lewes and West Sussex), generating clusters of air-travel
intensive and high productivity businesses.
FIGURE 54: COAST TO CAPITAL LEP INCLUDING GATWICK DIAMOND
(Source: www.coast2capital.org.uk)
Air intensive activities account for 32.5% of total UK employment, but they are more important to
London and the South East economies, accounting for 41.8% and 35% respectively. Since 2009, the
air intensive sectors have been the principal drivers for employment growth in the UK and the
South East.
Gatwick is the only airport in the UK with the same critical mass of traffic and depth of local economy
needed to replicate the effects already observed around Heathrow.
Therefore implementing a second runway at Gatwick will assist in delivering the vision of enhanced
economic development along the Brighton-Croydon corridor, and assisting in the delivery of strategies
such as the Gatwick Diamond Strategic Statement and the Coast to Capital Local Enterprise
Partnership Strategy for Growth.
The Coast to Capital LEP’s which has representatives from a cross section of businesses, local
authorities and universities in the region, has declared bold ambitions for growth and is confident that
the area can deliver “exceptional growth and productivity gains to deliver economic performance to
rival the best in Europe and the rest of the World”30
30 http://www.coast2capital.org.uk/images/Coast_to_Capital_SEP_FINAL_for_March_v11_without_Annexes_rev2.pdf p.19
SD1 Strategic Argument – 4. Local Economy Impacts
Response to Airports Commission Updated Scheme Design 125
By 2035, the Coast to Capital LEP’s priority sectors for growth and inward investment have been
identified as health and life sciences; creative digital and information technology; advanced
engineering; financial and business services; and environmental technologies. The majority of these
sectors will benefit from the increased connectivity that an expanded Gatwick will provide.
Air intensive businesses have the potential to create an extra 100,000 jobs in London and the greater
South East region which, if it follows the pattern of present employment will distribute these jobs
between London and the rest of the greater South East region. (54,000 in London and 46,000 in the
rest of the South East).
Supporting economic growth in Areas of Need
A second runway at Gatwick can support economic regeneration objectives within the wider area
around Gatwick, especially in some of the relatively deprived parts of London and the South East
including parts of South East London (such as Croydon, Lewisham, Lambeth, Bexley), Essex, Kent
Thames Gateway sub-regions and the Sussex coastal towns especially around Brighton where
economic regeneration is targeted.
There is already a strong drive to aid regeneration and economic growth in the London-Gatwick-South
Coast corridor as demonstrated by the work carried out by both the Gatwick Diamond Initiative and
the Coast to Capital LEP. Expansion at Gatwick will have a very important role to play in making extra
jobs available to those in the less advantaged areas to the north and south of the airport.
The local authorities of Adur, Arun, Bromley and Croydon contain areas which are relatively deprived
and are designated as Areas of Need. The areas of Adur, Arun and Croydon currently supply at least
1% of the current Gatwick workforce and Bromley is just below 1%. These areas are already
important sources of labour for Gatwick, and are well placed to gain from employment growth at the
airport. Of the other Areas of Need, all are within 45 minutes of the airport, with Croydon and Bromley
within 30 minutes of the Airport.
Of the 20 most deprived authorities in London and the South East:
Fifteen are currently within a one hour travel time of Gatwick, with eleven within 45 minutes of
the Airport;
Three authorities (Brighton and Hove, Eastbourne and Worthing) cover areas which are already
supplying at least 1% of the Gatwick workforce.
Hence, there is considerable scope for the majority of the most deprived areas in London and the
South East to benefit from the employment opportunities offered by the expansion of Gatwick.
SD1 Strategic Argument – 4. Local Economy Impacts
126 Response to Airports Commission Updated Scheme Design
Providing commitments to ensure benefits are achieved by those that need them most
Gatwick currently operates apprenticeship schemes in engineering (with the Central Sussex College
in Crawley) and security services. It also undertakes work awareness visits for students engaged on
travel/ tourism courses at Hastings College; participation in Careers Fairs and Customer Services.
Gatwick has however recognised that the scale of the second runway development means these
activities can be considerably enhanced. Gatwick therefore proposes development of an employment
strategy to target job opportunities at deprived communities. The employment strategy is likely to be
underpinned by the following three key themes:
Attracting employment at the airport;
Developing the wider economic benefits of the airport;
Promoting accessibility to the airport.
Gatwick will implement a range of employment initiatives including apprenticeships and training
through a Life Long Employability Programme and local supply chain initiatives, in cooperation with
our stakeholder partners. Gatwick currently holds Meet the Buyer events and will continue to do so in
support of LGW R2. Gatwick will continue to work with local authority study group and partner
authorities on regeneration schemes including developing benefits to the Gatwick Diamond, South
London and the South Coast.
SD1 Strategic Argument – 4. Local Economy Impacts
Response to Airports Commission Updated Scheme Design 127
Objective: “To produce positive outcomes for local communities and the local economy from any
surface access that may be required to support the proposal”
Key findings: Local connectivity is already being supported by approved surface access schemes,
which will provide sufficient surface access capacity for much of the growth at Gatwick. In addition to
this, Gatwick will ensure that sufficient upgrades are made to form a new state-of-the-art regional
transport hub – the Gatwick Gateway; double the capacity of key road junctions to access the airport;
and increase the number of bus and coach services.
4.3 Surface Access Impacts
Gatwick has developed a comprehensive Airport Surface Access Strategy (ASAS). A key part of this
vision is to support positive outcomes for local communities and the local economy is a key part of
this vision.
This strategy has been robustly tested against the worst case scenarios (busiest airport day against
busiest commuter hour in the busiest month) to validate their viability.
Local connectivity is already being supported by approved surface access schemes, which will
provide sufficient surface access capacity for much of the growth at Gatwick. The key such
scheme is:
Near tripling the capacity of the rail system between 2012 and 2035 through near doubling the
frequency of trains, with longer trains and extending the reach of the rail network to serve over
1000 stations while air passengers in the commuting peak period will constitute only 5-6% of total
passengers;
In addition to this, as part of the Gatwick expansion project, Gatwick will ensure that the following is
provided:
Airport quality public transport: new trains, longer trains, better stations and a new state-of-the-art
regional transport hub – the Gatwick Gateway;
Doubling the capacity of key road junctions to access the airport;
Increasing the number of new bus and coach services serving more destinations and more
frequently;
Delivering seamless interchange between the airport and surface access in the Gatwick Gateway.
SD1 Strategic Argument – 4. Local Economy Impacts
128 Response to Airports Commission Updated Scheme Design
Providing additional local benefits
The local community uses Gatwick to connect their journeys by all modes of transport to access jobs,
services and leisure activities across the South East. These plans will enhance this benefit further and
help drive direct, indirect and induced economic growth, improve quality of life and support
sustainable travel.
Gatwick rail station is already used by 1 million local passengers a year and the Gatwick Gateway
transport interchange will deliver a range of new travel options for people across the region.
Local bus services have proven popular with staff, commuters and the community alike and the longer
hours, better information and more frequent services are already much appreciated. The further
extension of the Fastway programme of high quality bus services by Gatwick will take this further still,
roughly doubling the 400 local bus services of today. This will benefit from the newly introduced low
floor and inclusive bus fleet equipped with free 4G WiFi. The local community will therefore gain from
improved access, from more services that operate for longer hours, more frequently and go to more
destinations. In this way the plan for more coach and bus services will meet the needs of airport
users, the region and local residents.
The realignment of the A23 will deliver a dedicated cycle-way. This and other road changes that will
be made will reduce congestion, improved resilience and provide a better, simpler road system for
local car users. Cycling and walking upgrades will create 9km more and better cycle routes, and will
benefit airport users, local commuters and leisure users.
Promoting accessibility to support economic growth
The airport currently operates an Airport Wide Staff Travel Plan (ATP)31 which requires the production
of an action plan to facilitate and promote sustainable travel to/from work. This action plan includes
elements on business travel, car sharing, public transport options, and cycling and walking, securing
the active participation of other airport companies in the promotion of the ATP to their employees; and
carrying out regular monitoring to determine the effectiveness of the various initiatives that comprise
the ATP, including periodic staff surveys at intervals no greater than every five years.
The ATP will be developed alongside plans for an expanded airport to continue the successful
initiatives which benefit airport employees. As a real incentive to existing staff, and to assist with the
attraction of new staff, we will continue with the Airport Employee Travel Scheme whereby transport
operators offer discounted fares to airport staff.
31 Para 7.31 RPS
SD1 Strategic Argument – 5.Surface Access Provision
Response to Airports Commission Updated Scheme Design 129
5. Surface Access Provision
In this section we address the following objectives from the Appraisal Framework:
“To maximise number of passengers and workforce accessing the airport via sustainable modes of
transport”
“To accommodate needs of other users of transport networks, such as commuters, intercity travellers
and freight”
“To enable access to the airport from a wide catchment area”
5.1 Gatwick Surface Access Proposition
Key findings: Gatwick will achieve the highest use of sustainable modes of transport: it will achieve a
60% public transport mode share for customers (45m by 2050) and a 50% sustainable mode share
for staff.
Gatwick’s plans will accommodate the needs of other transport users: in 2040 and 2050 there will be
enough road and rail capacity to serve the airport, background users and the economic growth
generated. Both Network Rail and the Highways Agency support this analysis.
Gatwick’s plans will provide access from the widest catchment area: 3.2m people live within 30
minutes, 10.8m within 45 minutes and 14.8m people within 60 minutes – better than any other
UK airport.
Context
Gatwick’s expansion will be supported by a number of already committed and planned projects.
These innclude;
Almost tripling the capacity of the rail system between 2012 and 2035 through near doubling
the frequency of trains, with longer trains and extending the reach of the rail network to serve
over 1,000 stations;
Airport quality public transport: new trains, longer trains and better stations; and
Additional, committed, lane capacity improvements on the M25 and M23 by the Highways
Agency.
Our Airport Surface Access Strategy, endorsed by our stakeholder groups builds on these
developments and will be achieved by:-
Doubling the capacity of key road junctions to access the airport;
A new state of the art regional transport hub - the Gatwick Gateway;
Increasing the number of new bus and coach services serving more destinations and more
frequently, with a new bus and coach station at the Gatwick Gateway;
Facilitating seamless journeys with integrated rail / air tickets as part of our expanded Gatwick
Connect product;
Delivering a single, seamless interchange between the airport and surface access;
SD1 Strategic Argument – 5.Surface Access Provision
130 Response to Airports Commission Updated Scheme Design
Further innovations in passenger experience, customer service and information;
Sustainable staff travel and 24/7 access all hours public transport services for passengers and
staff; and
Reconnecting local communities and improving their transport.
Gatwick will meet the needs of all types of carriers and passengers: first, business and leisure.
However, Gatwick will not only meet the key Commission objectives, it will also deliver a much
broader range of benefits, which have been described elsewhere in this document:
The Airport Surface Access Strategy supports the priorities of sustainable development through
more sustainable transport modes.
Gatwick will create up to 22,000 new jobs; and the excellent rail links will connect some of the
most deprived boroughs and towns in England to those jobs, whilst also stimulating economic
growth in those locations. Around 1 million people, within the 20% most deprived communities in
England, live within 25 miles of Gatwick.
Gatwick with a second runway, rather than a third runway at Heathrow, will disperse passengers
over a much wider and extensive range of roads and railways. This results in less congestion,
more reliable and more comfortable journeys.
Gatwick 2+2 means that total time spent travelling to and from an airport to fly to and from a
foreign or UK destination will be less than the concentrated 3+1 scheme - all passengers gain and
on average some 80m passengers per annum will save 15 minutes each.
It will add value with more passengers using the railways: benefiting the taxpayer by generating
£3bn in revenue by utilising off-peak and contra-peak direction trains for 20 hours a day;
Help generate a balanced North / South economic growth corridor and meet the needs of the
London Plan;
Gatwick will fully fund the M23 Junction 9 capacity upgrade, the A23 relocation and the Local
Highway Development Fund, with no Government funding. These are new projects that would be
specifically required if the Gatwick expansion goes ahead. Gatwick will therefore fund these
projects itself without public sector support. All other required surface access infrastructure is
already committed.
Our Airport Surface Access Strategy is low risk, deliverable and will have minimal adverse impact on
our local communities both during construction and operation.
SD1 Strategic Argument – 5.Surface Access Provision
Response to Airports Commission Updated Scheme Design 131
Objective: “To maximise the number of passengers and workforce accessing the airport via
sustainable modes of transport”
5.2 Access by Public Transport
Gatwick starts from a very strong position
We have nearly 45% current public transport mode share: this has been increasing year on year even
as the airport has grown, aligned with our surface access strategy. Our integrated runway
development strategy will ensure we increase public transport use to 60% for air passengers and 50%
for staff by 2040 – comparable with the best globally and significantly better than any other major
UK airport.
The new Gatwick Gateway – a single, simple, swift and coherent transport interchange
Much of the forecast growth will come from the transformational railway upgrades already underway,
allied to the new Gatwick Gateway integrated transport hub – a single, simple, swift and coherent
transport interchange serving the whole airport. The Gateway to terminal journey will be direct, simple
and immediate: 7 minutes or less at all three terminals. This hub fully integrates all modes of transport
including rail, coach, bus, car, cycle and walk and serves the needs of passengers, staff and the wider
region alike.
Excellent access to wider London and UK catchment by road and rail
The dominant factor in achieving this level of sustainable public transport use is the extensive road
and rail network serving Gatwick. Unlike Heathrow, Gatwick is not a served by stub roads or stub
railway lines. Gatwick is connected North, South, East and West giving it a huge population
penetration with 3.2m people within 30 minutes, 10.8m within 45 minutes and 14.8m able to reach
Gatwick by rail in under an hour compared to Heathrow’s 11.7m.
The progressive expansion of Gatwick with a second runway, and its rail links, will give consumers a
much wider choice of both destinations and their home airport to travel to and from. This added
convenience will save on average 80m passengers per year some 15 minutes travel time to their
airport of choice.
Connectivity is already a key strength of Gatwick: rail already serves a larger number of rail stations
than Heathrow by an order of magnitude: 129 for Gatwick compared to 6 stations for Heathrow. By
2019, Gatwick will be connected directly to 175 rail stations, and to over 1,000 stations with a single
change of platform making public transport highly attractive and convenient to the majority of
passengers and staff alike. Heathrow will only be able to boast direct connection to 36 rail stations.
Gatwick’s catchment area is not just London and the South East. By 2020, with completion of the
£6.5bn Thameslink programme, many Northern towns and cities will be a short trip to Gatwick by rail:
Cambridge 90mins, York 150mins and Leeds less than 180 minutes. Gatwick is an airport connected
to and serving the whole nation.
SD1 Strategic Argument – 5.Surface Access Provision
132 Response to Airports Commission Updated Scheme Design
Average journey times to Gatwick will take around 60 minutes compared to Heathrow’s 70 minutes.
Not only is rail convenient, it is swift. Trains to London will leave Gatwick every 2½ minutes with a
travel time of only 30 minutes to both the City of Westminster and the City of London, just as fast as
from Heathrow.
Four of these 24 trains per hour will be non-stop Gatwick Express services to Victoria. These will be
new high capacity 12 carriage trains that are likely to operate from Gatwick for 24 hours a day, rather
than the current 22 hours per day. This increases operational resilience as well as providing superb
customer service.
Rail from Gatwick directly serves most of the big London interchanges: Victoria, London Bridge,
Blackfriars and Farringdon – with King’s Cross / St Pancras just 40 minutes away. Canary Wharf, via
London Bridge and the Jubilee Line, is only 40 minutes and Waterloo 36 minutes. Trains to London
Bridge will leave Gatwick every 6 minutes with the overall journey time into the centre of London’s
business district faster than Heathrow, even after Crossrail is in operation.

SD1 Strategic Argument – 5.Surface Access Provision
Response to Airports Commission Updated Scheme Design 133
FIGURE 55: GATWICK’S RAIL NETWORK
Source: Farrells
The improved rail networks mean that Gatwick is within 1 change of all the main UK rail lines. This includes Great Western (Bristol, Wales and the South West), West Coast Mainline (Birmingham, Manchester, Glasgow), Midland Mainline (Sheffield, Nottingham, Derby), East Coast Mainline (Leeds, Newcastle, Edinburgh) and SouthEastern services for the continent. It will also connect to Crossrail at Farringdon and probably Crossrail2 at Clapham Junction. Connections to HS2 services would be via Old Oak Common.
This extensive network connectivity will deliver sustainable travel and support major regeneration initiatives. Gatwick’s rail network means that the 22,000 new jobs created by the airport will be accessible from along the South Coast, up the North / South corridor and on into South and North London. This will aid some of the most deprived towns and boroughs in the South and significantly improve quality of life.
SD1 Strategic Argument – 5.Surface Access Provision
134 Response to Airports Commission Updated Scheme Design
Bus and Coach Service Improvements
Gatwick has excellent direct motorway and national and local road network access. This will be
significantly enhanced with committed and planned improvements outlined later in this document.
Our excellent road access and overall transport strategy is designed to encourage more passengers
and staff to travel by bus and coach as well as rail. An average of over 500 coaches arrive and depart
from Gatwick each day along with eight different local bus services calling over 400 times a day, direct
to our terminals. Current mode shares for bus and coach are 8% for air passengers and 12% for
airport staff: our immediate goal is to achieve 10% of passengers using bus and coach.
Key to our future success will be continued collaborative working with our local bus operator
Metrobus, and National Express for many of the longer distance coach services. Gatwick and
National Express have committed to work together on developing a range of new routes for air
passengers.
Gatwick Gateway provision for buses and coaches means simpler journeys and better connections,
with comfortable modern waiting areas.
Staff Travel Benefits
Staff travel is an important element of our strategy with our goal to achieve 50% of staff travelling
sustainably. Key features in this programme include:
24hr access by rail;
More fast bus routes matched to shift patterns;
Discounted bus, coach and rail travel for staff with smart and mobile ticketing;
More promotion of sustainable travel to all on-airport staff through Gatwick Commuter, our
sustainable travel brand;
Enhanced car sharing schemes;
Further enhanced walking and cycle facilities and programmes;
Promotion of electric and low emission vehicle.
SD1 Strategic Argument – 5.Surface Access Provision
Response to Airports Commission Updated Scheme Design 135
Objective: “To accommodate the needs of other users of transport networks, such as commuters,
intercity travellers and freight”
5.3 Impact on Non Airport Users
Gatwick will have sufficient rail and road capacity to meet 2050 demand
The 2040 road and rail networks serving Gatwick, after current and planned upgrades, will have
sufficient capacity to meet the needs of all users, including commuters and freight.
Network Rail and the Highways Agency agree, having endorsed our transport models, their outputs
and, crucially, the conclusion that there is sufficient capacity on the road and rail networks to support
a second Gatwick runway in both 2040 and 2050. We have taken a very robust approach to analysis
and have stress tested using the worst case scenario – the busiest hour, on the busiest airport day, in
the busiest month. This confirms that there is sufficient capacity in both 2040 and 2050.
This capacity reflects the massive upgrades already underway on the rail and road networks.
Rail Capacity Improvements
For the rail system, the £6.5bn Thameslink programme and other planned upgrades will be
transformational:
Almost tripling the overall capacity of the Gatwick to London and beyond rail system between
2012 and 2030, can accommodate the needs of the region and a 2 runway Gatwick:
An increase from 14 trains in the peak hour from Gatwick to London, increasing to 18 trains per
hour by 2018, and up to 24 trains an hour by 2030.
Train lengthening (8 to 12 car trains), almost all trains leaving Gatwick will be made up of 12
carriages.
The airport and the morning commuting peak periods do not coincide. Today air passengers
account for only around 4% of total rail passengers between Gatwick and London. Even with
two runways, air passengers will only account for 5-6% of rail users.
Consequently the already committed and planned rail schemes can accommodate the
additional demands of a second runway.
Rail capacity will be built up by 2030 as a result of more trains, new timetables, operational efficiency
and infrastructure changes. Full details are included in our Surface Access strategy documents.
Capacity from Thameslink and other route enhancements to be delivered before 2024 is built up over
time as the figure below shows. Capacity always outstrips demand on rail even before the further
capacity delivered by the new ERTMS (European Rail Traffic Management System) signalling to be
installed in the 2030s.
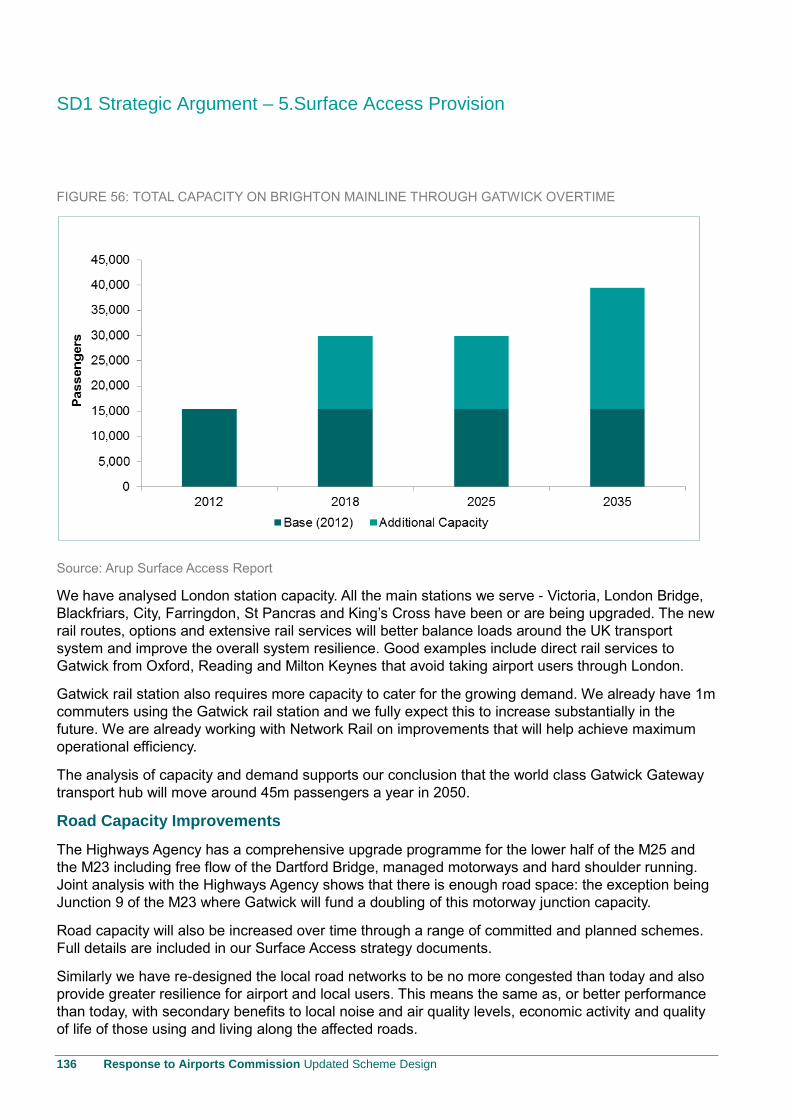
SD1 Strategic Argument – 5.Surface Access Provision
136 Response to Airports Commission Updated Scheme Design
FIGURE 56: TOTAL CAPACITY ON BRIGHTON MAINLINE THROUGH GATWICK OVERTIME
Source: Arup Surface Access Report
We have analysed London station capacity. All the main stations we serve - Victoria, London Bridge,
Blackfriars, City, Farringdon, St Pancras and King’s Cross have been or are being upgraded. The new
rail routes, options and extensive rail services will better balance loads around the UK transport
system and improve the overall system resilience. Good examples include direct rail services to
Gatwick from Oxford, Reading and Milton Keynes that avoid taking airport users through London.
Gatwick rail station also requires more capacity to cater for the growing demand. We already have 1m
commuters using the Gatwick rail station and we fully expect this to increase substantially in the
future. We are already working with Network Rail on improvements that will help achieve maximum
operational efficiency.
The analysis of capacity and demand supports our conclusion that the world class Gatwick Gateway
transport hub will move around 45m passengers a year in 2050.
Road Capacity Improvements
The Highways Agency has a comprehensive upgrade programme for the lower half of the M25 and
the M23 including free flow of the Dartford Bridge, managed motorways and hard shoulder running.
Joint analysis with the Highways Agency shows that there is enough road space: the exception being
Junction 9 of the M23 where Gatwick will fund a doubling of this motorway junction capacity.
Road capacity will also be increased over time through a range of committed and planned schemes.
Full details are included in our Surface Access strategy documents.
Similarly we have re-designed the local road networks to be no more congested than today and also
provide greater resilience for airport and local users. This means the same as, or better performance
than today, with secondary benefits to local noise and air quality levels, economic activity and quality
of life of those using and living along the affected roads.
SD1 Strategic Argument – 5.Surface Access Provision
Response to Airports Commission Updated Scheme Design 137
Our local support extends further afield, where we have committed to create a £10m Local Highway
Development Fund to help communities address junction improvements where Gatwick is a minor
component of traffic demand.
Freight to support the airport’s operations is already generally consolidated at source and then
delivered to Gatwick’s own logistics centre. The logistics centre then further consolidates the material
and distributes it to airport end-users, cutting significantly airport vehicle movements.
The motorway system and airport roads will readily meet the future needs of air freight. Air freight is
forecast to reach some 1.1m tonnes by 2050. Delivery or collection of this airfreight will be to the new
freight centre to the North West of the airport that will be accessed directly from Junction 9 of the
M23. It is predicted that there will be some 35 lorry loads to or from the freight centre in the peak hour:
this is negligible in the context of the lane capacities provided.

SD1 Strategic Argument – 5.Surface Access Provision
138 Response to Airports Commission Updated Scheme Design
Objective: “To enable access to the airport from a wide catchment area”
5.4 Access to Gatwick from Wider Catchment
Making the best even better
Gatwick already has, and will continue have the highest access by public transport of any major UK
airport, higher than Heathrow and comparable with the best in the world. The connectivity, time saving
and convenience of its public transport are unrivalled. This is provided by existing capacity unlike
Heathrow which is partly dependent on new future rail lines that may or may not occur.
Gatwick is therefore the most convenient and time-efficient UK airport for the majority of airport users.
This is the most critical factor in attracting more users to public transport to access the airport and
achieve our targets of 60% air passenger public transport mode share and 50% staff by sustainable
modes.
The established logic pattern of minimizing total generalized cost for users supports the strategy of
Gatwick continuing to increase its public transport mode share to achieve its targets:
1. Rail is regarded by passengers as a more reliable, certain and less stressful way of getting to and
from the airport than using a car or taxi.
2. 175 mainline stations directly served by rail, up from 129 today, together with over 1,000 stations
with one change means rail is increasingly convenient, time saving and attractive: many more
people will have a local station connection to Gatwick This effect is even more pronounced where
feeder bus services are extensive and frequent e.g. at Clapham Junction.
3. The frequency of train services is increasing significantly along with more direct routes that avoid
dead legs e.g. the new Oxford and Cambridge direct services to Gatwick will be much quicker that
having to go in and out of London or change trains many times. A comfortable air-conditioned train
service to Victoria or London Bridge every 4 minutes will be highly attractive for users.
4. Gateway will be adjacent to the terminals with all terminals accessible within 7 minutes.
5. Gatwick will provide innovative customer-centric travel offerings to speed passengers through the
terminals including airline through ticketing, easy check-in and enhanced customer service.

SD1 Strategic Argument – 5.Surface Access Provision
Response to Airports Commission Updated Scheme Design 139
FIGURE 57: A WIDE CATCHMENT AND EASY CONNECTIONS FOR TRIPS TO GATWICK SAVE TIME
Source: Farrells
Best Solution for London and the UK
The 2+2 runway solution generates the best connectivity and shortest journey times for London and
the South East as a whole. More destinations and the greatest contestability of services driven by
lower air fares will generate real choice with Gatwick providing the shortest average travel times for
passengers to any London airport. This also sustainably spreads the total passenger load over a
more extensive public transport network. In that sense Gatwick is a win-win-win: the best destination
connectivity, the best surface access connectivity for the largest number of passengers and the least
overall crowding on the rail and road networks.
SD1 Strategic Argument – 5.Surface Access Provision
140 Response to Airports Commission Updated Scheme Design
Best for Staff Travel
Good connectivity to public transport is also important for staff and access to the new employment
opportunities. Gatwick will achieve this through:
A comprehensive Travel Plan covering both construction and operational staff.
Offering 24 hour rail services: Gatwick is only airport doing this - crucial for shift workers.
Fast and frequent 24 hour bus networks, also geared to early shifts.
Discounted travel on all public transport modes.
Dedicated car sharing systems.
Good rail and road connections also mean regeneration benefits (jobs and housing) will extend to key
areas of deprivation along the South Coast, as well as to some of the most deprived boroughs
in London.
During the construction of LGW R2, we will have an employment and skills package that supports
youth employment, apprenticeships and developing a more effective and skilled workforce: excellent
public transport will be used to get the workforce to these opportunities.
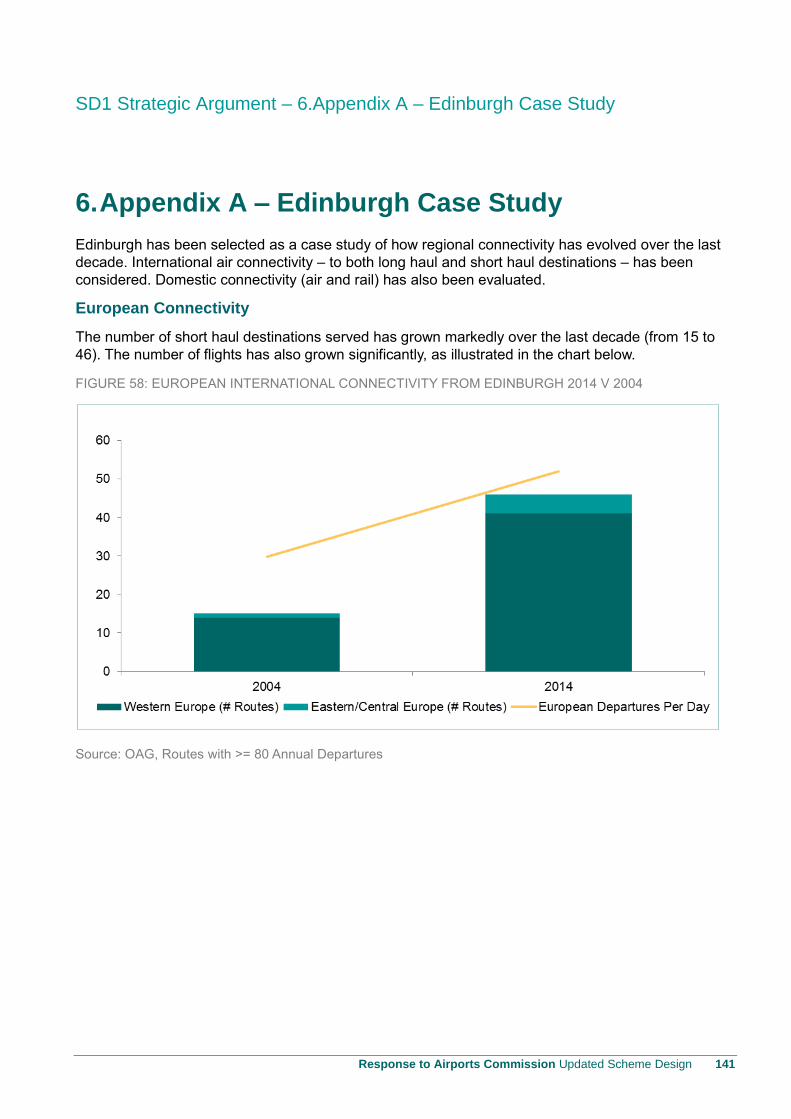
SD1 Strategic Argument – 6.Appendix A – Edinburgh Case Study
Response to Airports Commission Updated Scheme Design 141
6. Appendix A – Edinburgh Case Study
Edinburgh has been selected as a case study of how regional connectivity has evolved over the last
decade. International air connectivity – to both long haul and short haul destinations – has been
considered. Domestic connectivity (air and rail) has also been evaluated.
European Connectivity
The number of short haul destinations served has grown markedly over the last decade (from 15 to
46). The number of flights has also grown significantly, as illustrated in the chart below.
FIGURE 58: EUROPEAN INTERNATIONAL CONNECTIVITY FROM EDINBURGH 2014 V 2004
Source: OAG, Routes with >= 80 Annual Departures

SD1 Strategic Argument – 6.Appendix A – Edinburgh Case Study
142 Response to Airports Commission Updated Scheme Design
The growth in destinations added can easily be seen by comparing the scheduled network from
Edinburgh in 2004 with the network in 2014.
FIGURE 59: 2004 AIR SERVICE NETWORK: EDINBURGH – EUROPEAN INTERNATIONAL DESTINATIONS
Source: OAG
FIGURE 60: 2014 AIR SERVICE NETWORK: EDINBURGH – EUROPEAN INTERNATIONAL DESTINATIONS
Source: OAG
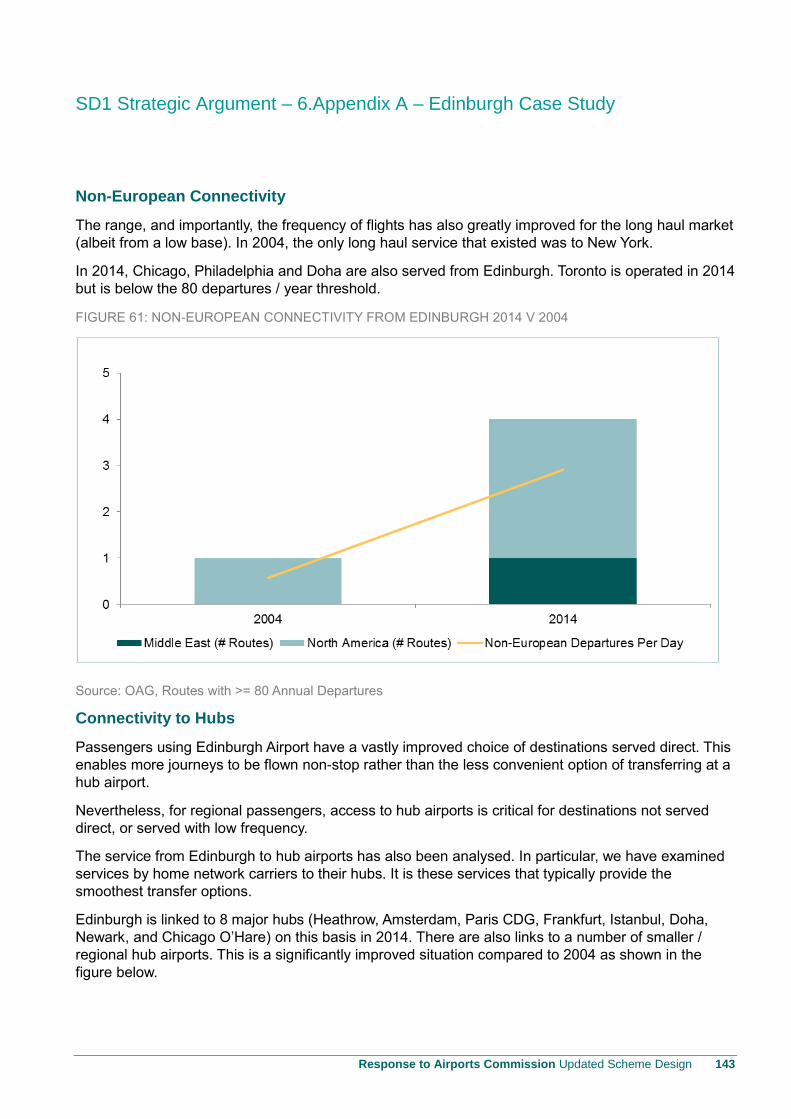
SD1 Strategic Argument – 6.Appendix A – Edinburgh Case Study
Response to Airports Commission Updated Scheme Design 143
Non-European Connectivity
The range, and importantly, the frequency of flights has also greatly improved for the long haul market
(albeit from a low base). In 2004, the only long haul service that existed was to New York.
In 2014, Chicago, Philadelphia and Doha are also served from Edinburgh. Toronto is operated in 2014
but is below the 80 departures / year threshold.
FIGURE 61: NON-EUROPEAN CONNECTIVITY FROM EDINBURGH 2014 V 2004
Source: OAG, Routes with >= 80 Annual Departures
Connectivity to Hubs
Passengers using Edinburgh Airport have a vastly improved choice of destinations served direct. This
enables more journeys to be flown non-stop rather than the less convenient option of transferring at a
hub airport.
Nevertheless, for regional passengers, access to hub airports is critical for destinations not served
direct, or served with low frequency.
The service from Edinburgh to hub airports has also been analysed. In particular, we have examined
services by home network carriers to their hubs. It is these services that typically provide the
smoothest transfer options.
Edinburgh is linked to 8 major hubs (Heathrow, Amsterdam, Paris CDG, Frankfurt, Istanbul, Doha,
Newark, and Chicago O’Hare) on this basis in 2014. There are also links to a number of smaller /
regional hub airports. This is a significantly improved situation compared to 2004 as shown in the
figure below.
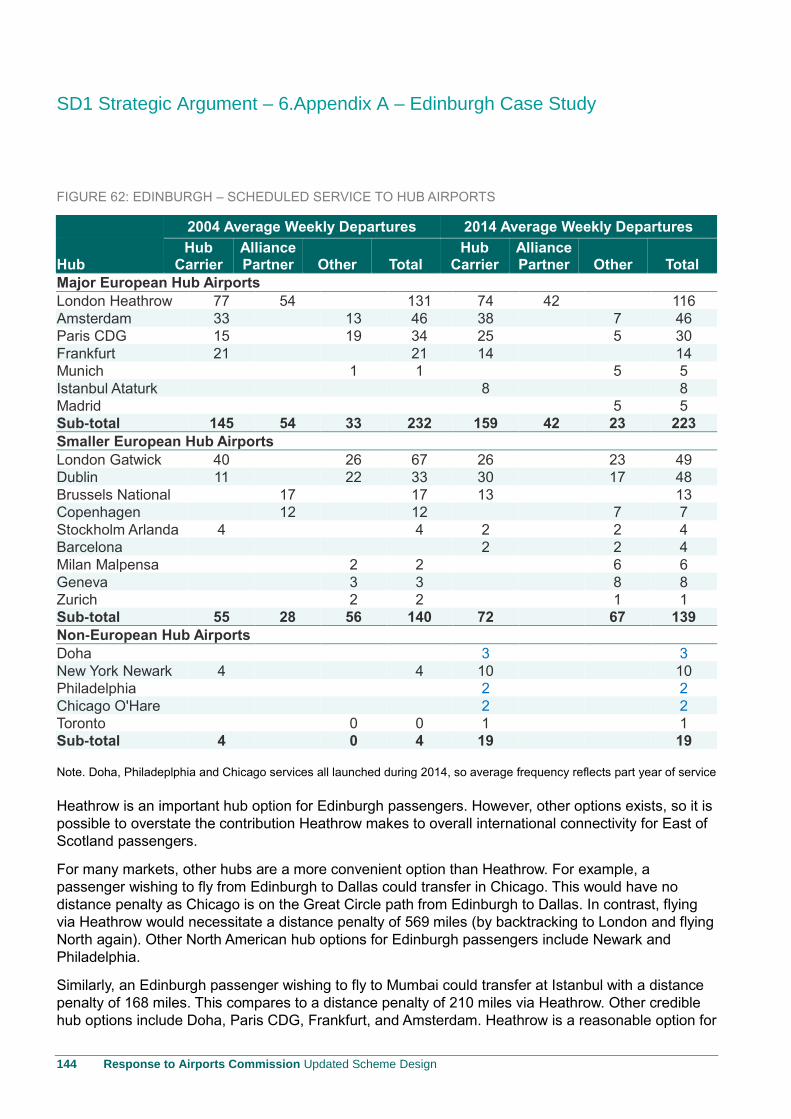
SD1 Strategic Argument – 6.Appendix A – Edinburgh Case Study
144 Response to Airports Commission Updated Scheme Design
FIGURE 62: EDINBURGH – SCHEDULED SERVICE TO HUB AIRPORTS
2004 Average Weekly Departures 2014 Average Weekly Departures
Hub Hub
Carrier Alliance Partner Other Total
Hub Carrier
Alliance Partner Other Total
Major European Hub Airports
London Heathrow 77 54
131 74 42
116
Amsterdam 33
13 46 38
7 46
Paris CDG 15
19 34 25
5 30
Frankfurt 21
21 14
14
Munich
1 1
5 5
Istanbul Ataturk
8
8
Madrid
5 5
Sub-total 145 54 33 232 159 42 23 223
Smaller European Hub Airports
London Gatwick 40
26 67 26
23 49
Dublin 11
22 33 30
17 48
Brussels National
17
17 13
13
Copenhagen
12
12
7 7
Stockholm Arlanda 4
4 2
2 4
Barcelona
2
2 4
Milan Malpensa
2 2
6 6
Geneva
3 3
8 8
Zurich
2 2
1 1
Sub-total 55 28 56 140 72
67 139
Non-European Hub Airports
Doha
3
3
New York Newark 4
4 10
10
Philadelphia
2
2
Chicago O'Hare
2
2
Toronto
0 0 1
1
Sub-total 4
0 4 19
19
Note. Doha, Philadeplphia and Chicago services all launched during 2014, so average frequency reflects part year of service
Heathrow is an important hub option for Edinburgh passengers. However, other options exists, so it is
possible to overstate the contribution Heathrow makes to overall international connectivity for East of
Scotland passengers.
For many markets, other hubs are a more convenient option than Heathrow. For example, a
passenger wishing to fly from Edinburgh to Dallas could transfer in Chicago. This would have no
distance penalty as Chicago is on the Great Circle path from Edinburgh to Dallas. In contrast, flying
via Heathrow would necessitate a distance penalty of 569 miles (by backtracking to London and flying
North again). Other North American hub options for Edinburgh passengers include Newark and
Philadelphia.
Similarly, an Edinburgh passenger wishing to fly to Mumbai could transfer at Istanbul with a distance
penalty of 168 miles. This compares to a distance penalty of 210 miles via Heathrow. Other credible
hub options include Doha, Paris CDG, Frankfurt, and Amsterdam. Heathrow is a reasonable option for
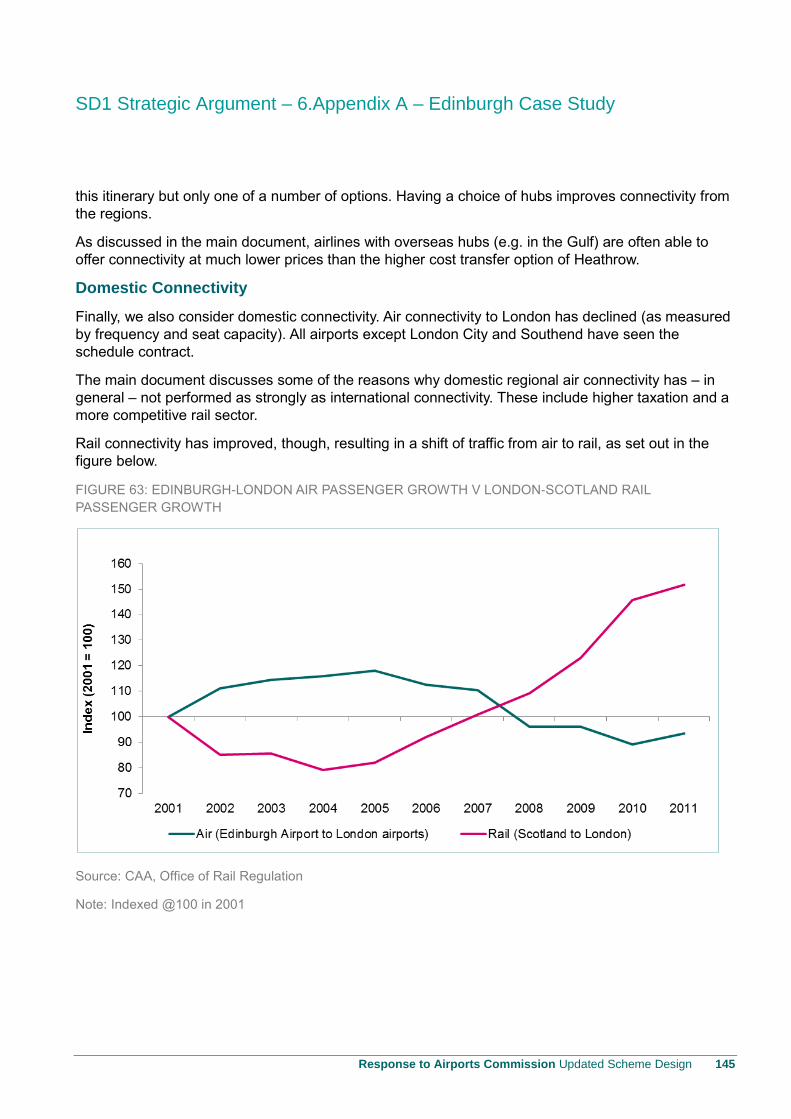
SD1 Strategic Argument – 6.Appendix A – Edinburgh Case Study
Response to Airports Commission Updated Scheme Design 145
this itinerary but only one of a number of options. Having a choice of hubs improves connectivity from
the regions.
As discussed in the main document, airlines with overseas hubs (e.g. in the Gulf) are often able to
offer connectivity at much lower prices than the higher cost transfer option of Heathrow.
Domestic Connectivity
Finally, we also consider domestic connectivity. Air connectivity to London has declined (as measured
by frequency and seat capacity). All airports except London City and Southend have seen the
schedule contract.
The main document discusses some of the reasons why domestic regional air connectivity has – in
general – not performed as strongly as international connectivity. These include higher taxation and a
more competitive rail sector.
Rail connectivity has improved, though, resulting in a shift of traffic from air to rail, as set out in the
figure below.
FIGURE 63: EDINBURGH-LONDON AIR PASSENGER GROWTH V LONDON-SCOTLAND RAIL
PASSENGER GROWTH
Source: CAA, Office of Rail Regulation
Note: Indexed @100 in 2001