second quarter 2018 conference call
TRANSCRIPT

Second Quarter 2018 Conference Call
Note: Numerical figures included in this presentation have been subject to rounding adjustments. Accordingly, numericalfigures shown as totals or percentages in various tables may not be arithmetic aggregations of the figures that precede them
resulting in immaterial differences in calculated fields.


Q2 2018 Results Highlights
RevenuesQTD
$(M
illio
ns)
2017 2018
$194.5 $190.8
Adjusted EBITDAQTD
$(M
illio
ns)
2017 2018
$73.3 $67.3
Revenues lower by 1.9%
• Decrease predominantly driven byrate reduction imposed by regulatorsin India impacting our numberportability services
Adjusted EBITDA lower by 8.2%
• Revenue impact of India ratereduction
• Higher SG&A as a result of afavorable tax ruling benefiting Q22017
• Adjusted EBITDA margin 37.7% and35.2% in 2017 and 2018, respectively
Free Cash FlowYTD
$(M
illio
ns)
2017 2018
$5.7$11.2
Free Cash Flow higher by $5.5million
• Lower working capital usage andlower payments related to severanceand contract terminations costs,partially offset by higher cash interest
• Lower capital expenditures in 2018

Q2 2018 Service Offering Revenues
Mobile Transaction Services
Enterprise & Intelligence Solutions
Revenues by Service OfferingsQTD
$(M
illio
ns)
2017 2018
$156.3 $145.6
$38.2$194.5
$45.2
$190.8
Revenues decreased 1.9%
• MTS revenue decreased 6.8%
• Decline in our GSM and CDMA portfolios aswell as a decrease in P2P messagingservices and a decrease in number portabilityservices due to an unexpected rate reductionin India effective 2/1/2018
• Partially offset by revenue growth in MTSstrategic products, primarily our LTE portfolioand policy and charging solutions
• EIS revenue increased 18.1%
• $7.2 million revenue growth in Enterprise A2Pmessaging services from volume growth inour enterprise and OTT customers
• Regional revenues:
• North America - 61%
• EMEA - 17%
• Asia Pacific - 15%
• CALA - 7%

Q2 2018 Total Adjusted Costs
Adjusted Cost of Operations
Adjusted SG&A Costs
Total Adjusted CostsQTD
$(M
illio
ns)
2017 2018
$87.0 $85.3
$34.2
$121.2
$38.2
$123.5
Total Adjusted Costs increased $2.3million or 1.9%
• Adjusted Cost of Operations decreased$1.7 million
• Lower headcount related costs,network costs, data processing, andhosting and support costs as well aslower data center facility costs
• Partially offset by higher variablecosts associated with growth in ourenterprise messaging services
• Adjusted gross margin of 55.3% forQ2 2018 and Q2 2017
• Adjusted SG&A increased $4.0 million
• The favorable outcome of an indirecttax examination in 2017 of $3.8million
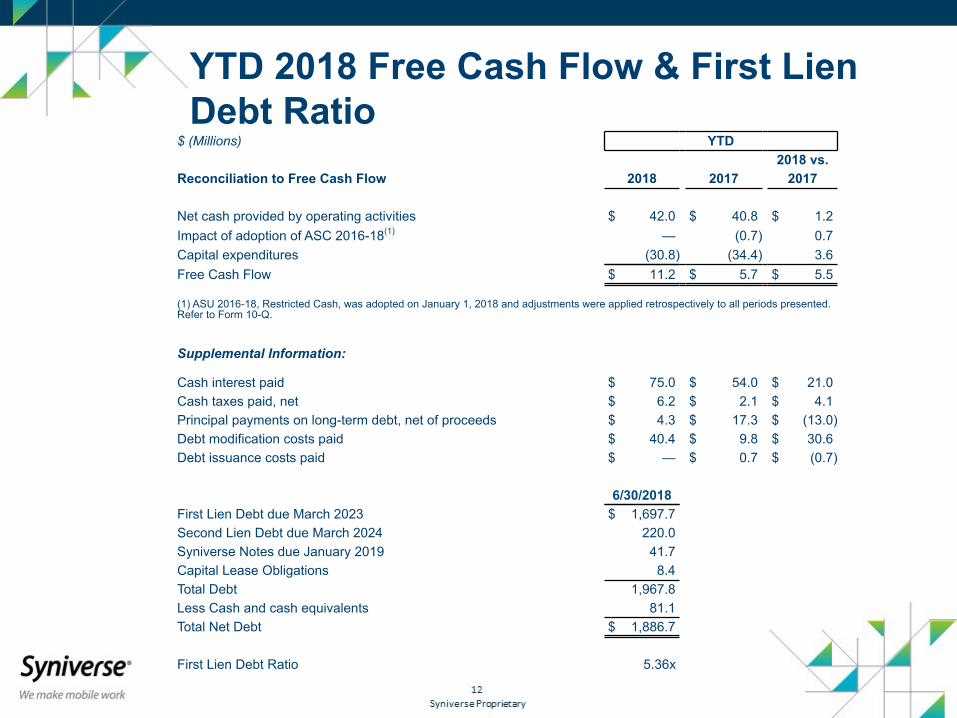
YTD 2018 Free Cash Flow & First LienDebt Ratio
$ (Millions) YTD2018 vs.
Reconciliation to Free Cash Flow 2018 2017 2017
Net cash provided by operating activities $ 42.0 $ 40.8 $ 1.2Impact of adoption of ASC 2016-18(1) — (0.7) 0.7Capital expenditures (30.8) (34.4) 3.6Free Cash Flow $ 11.2 $ 5.7 $ 5.5
(1) ASU 2016-18, Restricted Cash, was adopted on January 1, 2018 and adjustments were applied retrospectively to all periods presented.Refer to Form 10-Q.
Supplemental Information:
Cash interest paid $ 75.0 $ 54.0 $ 21.0Cash taxes paid, net $ 6.2 $ 2.1 $ 4.1Principal payments on long-term debt, net of proceeds $ 4.3 $ 17.3 $ (13.0)Debt modification costs paid $ 40.4 $ 9.8 $ 30.6Debt issuance costs paid $ — $ 0.7 $ (0.7)
6/30/2018First Lien Debt due March 2023 $ 1,697.7Second Lien Debt due March 2024 220.0Syniverse Notes due January 2019 41.7Capital Lease Obligations 8.4Total Debt 1,967.8Less Cash and cash equivalents 81.1Total Net Debt $ 1,886.7
First Lien Debt Ratio 5.36x

$ (Millions) QTD2018 2017
Reconciliation to Adjusted EBITDANet loss $ (20.8) $ (15.7)Other expense, net 37.5 31.5Provision for (benefit from) income taxes 3.4 (0.5)Depreciation and amortization 38.0 48.0Employee termination benefits 1.0 0.1Restructuring 0.1 2.9Non-cash stock-based compensation 4.0 4.5Business development, integration and other expenses 3.3 1.7Consulting fee and related expenses 0.8 0.8 Adjusted EBITDA $ 67.3 $ 73.3
Reconciliation of Net Loss to AdjustedEBITDA
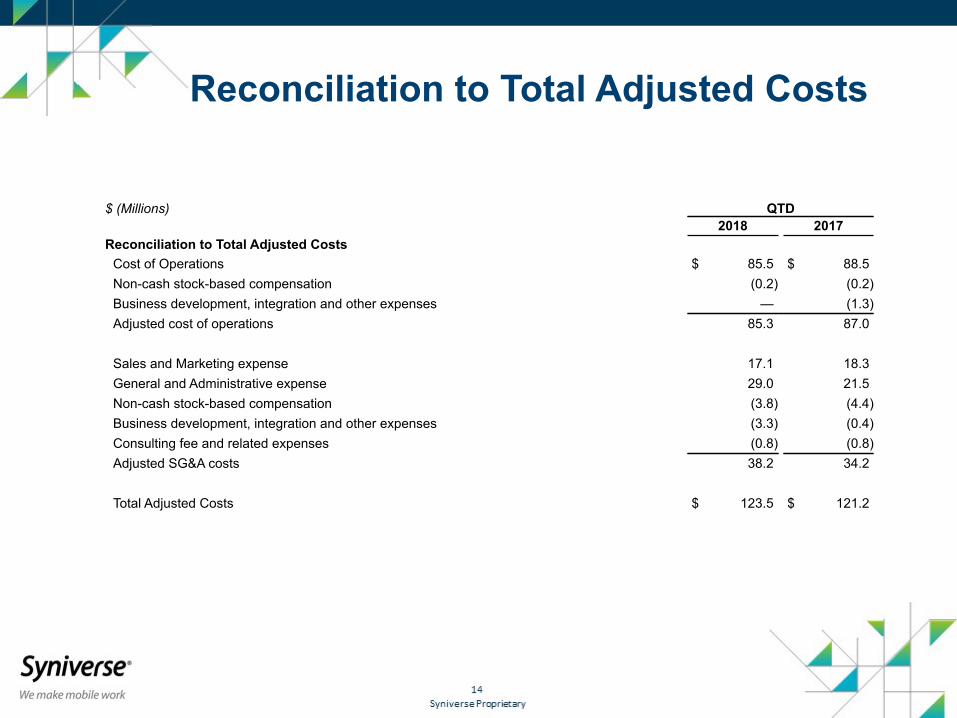
Reconciliation to Total Adjusted Costs
$ (Millions) QTD2018 2017
Reconciliation to Total Adjusted CostsCost of Operations $ 85.5 $ 88.5Non-cash stock-based compensation (0.2) (0.2)Business development, integration and other expenses — (1.3)Adjusted cost of operations 85.3 87.0
Sales and Marketing expense 17.1 18.3General and Administrative expense 29.0 21.5Non-cash stock-based compensation (3.8) (4.4)Business development, integration and other expenses (3.3) (0.4)Consulting fee and related expenses (0.8) (0.8)Adjusted SG&A costs 38.2 34.2
Total Adjusted Costs $ 123.5 $ 121.2
