second quarter report q - aluminium metal and aluminium · pdf file ·...
TRANSCRIPT
Second quarter report – 2012
Q 2012
Contents
Financial review 3
Overview 3
Market developments and outlook 5
Additional factors impacting Hydro 7
Underlying EBIT 7
Finance 12
Tax 12
Items excluded from underlying EBIT and net income 13
Interim financial statements 15
Condensed consolidated statements of income (unaudited) 15
Condensed consolidated statements of comprehensive income (unaudited) 16
Condensed consolidated balance sheets (unaudited) 17
Condensed consolidated statements of cash flows (unaudited) 18
Condensed consolidated statements of changes in equity (unaudited) 19
Notes to the condensed consolidated financial statements 19
Responsibility statement 23
Additional information 24
Financial calendar 2012 24
About our reporting - Underlying EBIT To provide a better understanding of Hydro's underlying performance, the following discussion of operating performance excludes certain items from EBIT (earnings before financial items and tax) and net income. See "Items excluded from underlying EBIT and net income" later in this report for more information on these items.
page SECOND QUARTERContents2
pageSECOND QUARTER3
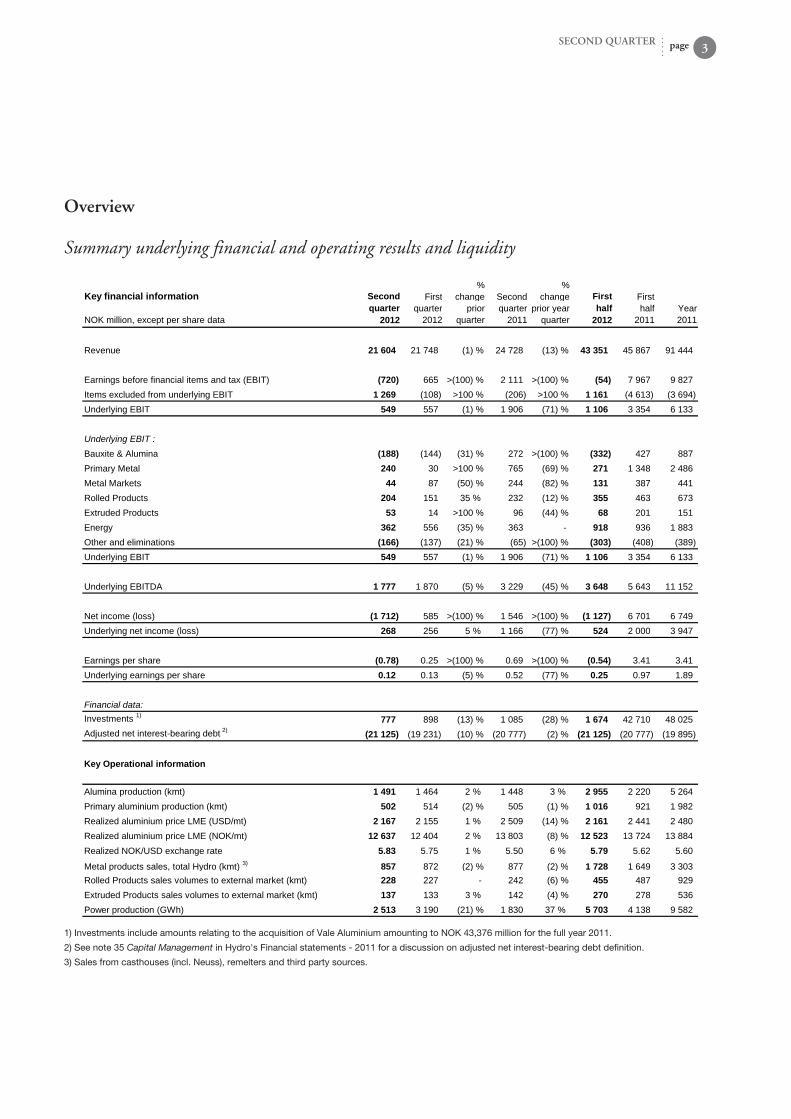
Overview
Summary underlying financial and operating results and liquidity
Key financial information
NOK million, except per share data
Secondquarter
2012
Firstquarter
2012
%change
priorquarter
Secondquarter
2011
%change
prior yearquarter
Firsthalf
2012
Firsthalf
2011Year2011
Revenue 21 604 21 748 (1) % 24 728 (13) % 43 351 45 867 91 444
Earnings before financial items and tax (EBIT) (720) 665 >(100) % 2 111 >(100) % (54) 7 967 9 827Items excluded from underlying EBIT 1 269 (108) >100 % (206) >100 % 1 161 (4 613) (3 694)Underlying EBIT 549 557 (1) % 1 906 (71) % 1 106 3 354 6 133
Underlying EBIT :Bauxite & Alumina (188) (144) (31) % 272 >(100) % (332) 427 887Primary Metal 240 30 >100 % 765 (69) % 271 1 348 2 486Metal Markets 44 87 (50) % 244 (82) % 131 387 441Rolled Products 204 151 35 % 232 (12) % 355 463 673Extruded Products 53 14 >100 % 96 (44) % 68 201 151Energy 362 556 (35) % 363 918 936 1 883Other and eliminations (166) (137) (21) % (65) >(100) % (303) (408) (389)Underlying EBIT 549 557 (1) % 1 906 (71) % 1 106 3 354 6 133
Underlying EBITDA 1 777 1 870 (5) % 3 229 (45) % 3 648 5 643 11 152
Net income (loss) (1 712) 585 >(100) % 1 546 >(100) % (1 127) 6 701 6 749Underlying net income (loss) 268 256 5 % 1 166 (77) % 524 2 000 3 947
Earnings per share (0.78) 0.25 >(100) % 0.69 >(100) % (0.54) 3.41 3.41Underlying earnings per share 0.12 0.13 (5) % 0.52 (77) % 0.25 0.97 1.89
Financial data:Investments 1) 777 898 (13) % 1 085 (28) % 1 674 42 710 48 025Adjusted net interestbearing debt 2) (21 125) (19 231) (10) % (20 777) (2) % (21 125) (20 777) (19 895)
Key Operational information
Alumina production (kmt) 1 491 1 464 2 % 1 448 3 % 2 955 2 220 5 264Primary aluminium production (kmt) 502 514 (2) % 505 (1) % 1 016 921 1 982Realized aluminium price LME (USD/mt) 2 167 2 155 1 % 2 509 (14) % 2 161 2 441 2 480Realized aluminium price LME (NOK/mt) 12 637 12 404 2 % 13 803 (8) % 12 523 13 724 13 884Realized NOK/USD exchange rate 5.83 5.75 1 % 5.50 6 % 5.79 5.62 5.60
Metal products sales, total Hydro (kmt) 3) 857 872 (2) % 877 (2) % 1 728 1 649 3 303Rolled Products sales volumes to external market (kmt) 228 227 242 (6) % 455 487 929Extruded Products sales volumes to external market (kmt) 137 133 3 % 142 (4) % 270 278 536Power production (GWh) 2 513 3 190 (21) % 1 830 37 % 5 703 4 138 9 582
1) Investments include amounts relating to the acquisition of Vale Aluminium amounting to NOK 43,376 million for the full year 2011.
2) See note 35 Capital Management in Hydro's Financial statements - 2011 for a discussion on adjusted net interest-bearing debt definition.
3) Sales from casthouses (incl. Neuss), remelters and third party sources.
Hydro's underlying earnings before financial items and tax amounted to NOK 549 million in the second quarter, largely unchanged from NOK 557 million in the previous quarter. Bauxite & Alumina continued to deliver a weak underlying result for the quarter due to low LME prices, pricing of long-term contracts and increasing energy costs. Underlying EBIT for Primary Metal increased compared to the first quarter mainly due to somewhat higher aluminium prices and lower operating costs. Underlying results for Qatalum were higher, mainly due to the final insurance settlement relating to the power outage in 2010. Hydro's mid-stream operations delivered lower underlying results compared to the previous quarter due to negative currency effects. Excluding currency effects, underlying EBIT was stable between the quarters. Underlying EBIT improved for Hydro's downstream businesses from the first quarter due to seasonally higher volumes for Extruded Products and lower operating costs in general. However, results for the quarter continued to be impacted by the challenging economic situation in Europe. Energy delivered lower underlying EBIT in the second quarter compared to the previous quarter due to lower production and lower prices. Operating cash flow amounted to NOK 0.8 billion for the quarter. Net cash used for investment activities amounted to NOK 0.8 billion. Dividends paid in the quarter amounted to NOK 1.7 billion. Hydro's net debt position was NOK 0.4 billion at the end of the second quarter.
page SECOND QUARTEROverview4
Reported EBIT and net incomeHydro incurred a reported loss before financial items and tax of NOK 720 million in the second quarter including net unrealized derivative gains of NOK 300 million, rationalization and closure costs of NOK 408 million, impairment charges amounting to NOK 1,175 million and positive metal effects of NOK 9 million. In June Hydro decided to close the remaining production at its Kurri Kurri Aluminium plant in Australia following the curtailment of one production line in January. Reported EBIT for the second quarter included NOK 1,154 million of impairment charges and NOK 322 million of rationalization and closure costs relating to the closure. Rationalization and restructuring initiatives in Extruded Products, involving Building Systems and Extrusion Eurasia, resulted in impairment charges and rationalization costs of NOK 106 million. In the previous quarter, reported EBIT for Hydro amounted to NOK 665 million including net unrealized derivative gains of NOK 307 million, negative metal effects of NOK 60 million and rationalization and closure costs of NOK 132 million. Amounts relating to other items of a special or infrequent nature were not significant for the first quarter. Hydro incurred a reported net loss amounting to NOK 1,712 million in the second quarter including net foreign exchange losses of NOK 883 million. In the previous quarter, Hydro had reported net income of NOK 585 million including net foreign exchange gains of NOK 410 million.
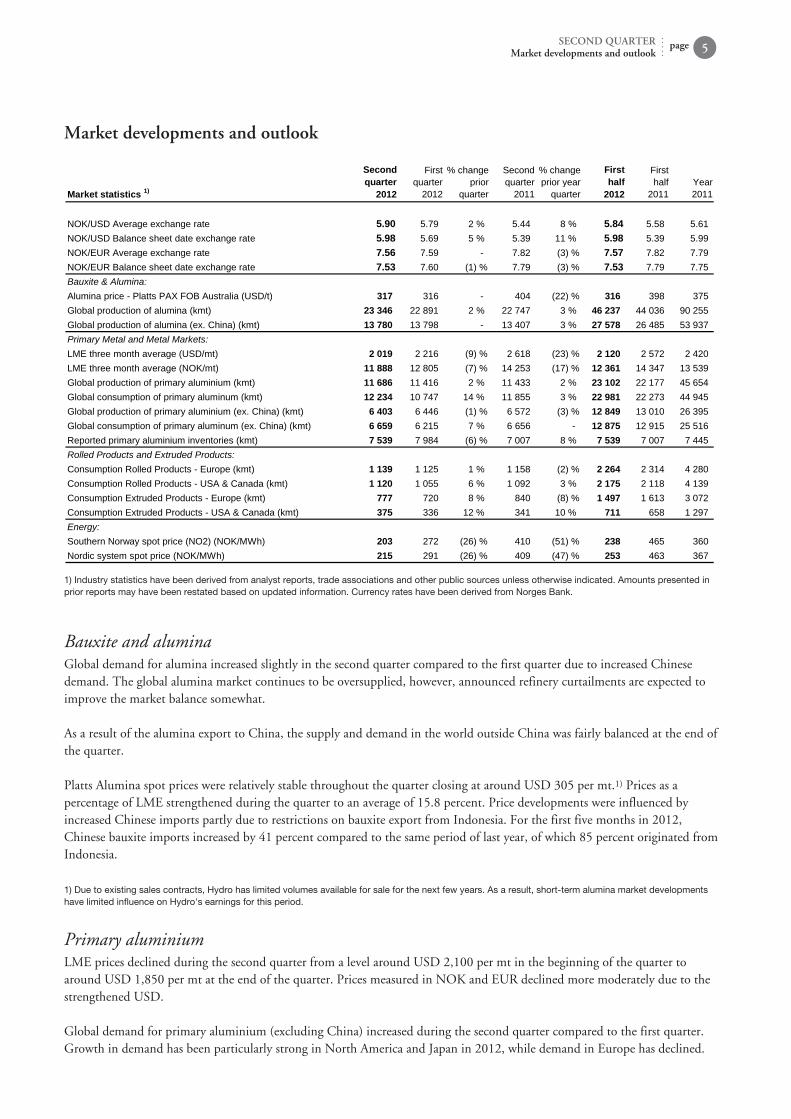
Market developments and outlook
Market statistics 1)
Secondquarter
2012
Firstquarter
2012
% changeprior
quarter
Secondquarter
2011
% changeprior year
quarter
Firsthalf
2012
Firsthalf
2011Year2011
NOK/USD Average exchange rate 5.90 5.79 2 % 5.44 8 % 5.84 5.58 5.61NOK/USD Balance sheet date exchange rate 5.98 5.69 5 % 5.39 11 % 5.98 5.39 5.99NOK/EUR Average exchange rate 7.56 7.59 7.82 (3) % 7.57 7.82 7.79NOK/EUR Balance sheet date exchange rate 7.53 7.60 (1) % 7.79 (3) % 7.53 7.79 7.75Bauxite & Alumina:Alumina price Platts PAX FOB Australia (USD/t) 317 316 404 (22) % 316 398 375Global production of alumina (kmt) 23 346 22 891 2 % 22 747 3 % 46 237 44 036 90 255Global production of alumina (ex. China) (kmt) 13 780 13 798 13 407 3 % 27 578 26 485 53 937Primary Metal and Metal Markets:LME three month average (USD/mt) 2 019 2 216 (9) % 2 618 (23) % 2 120 2 572 2 420LME three month average (NOK/mt) 11 888 12 805 (7) % 14 253 (17) % 12 361 14 347 13 539Global production of primary aluminium (kmt) 11 686 11 416 2 % 11 433 2 % 23 102 22 177 45 654Global consumption of primary aluminum (kmt) 12 234 10 747 14 % 11 855 3 % 22 981 22 273 44 945Global production of primary aluminium (ex. China) (kmt) 6 403 6 446 (1) % 6 572 (3) % 12 849 13 010 26 395Global consumption of primary aluminum (ex. China) (kmt) 6 659 6 215 7 % 6 656 12 875 12 915 25 516Reported primary aluminium inventories (kmt) 7 539 7 984 (6) % 7 007 8 % 7 539 7 007 7 445Rolled Products and Extruded Products:Consumption Rolled Products Europe (kmt) 1 139 1 125 1 % 1 158 (2) % 2 264 2 314 4 280Consumption Rolled Products USA & Canada (kmt) 1 120 1 055 6 % 1 092 3 % 2 175 2 118 4 139Consumption Extruded Products Europe (kmt) 777 720 8 % 840 (8) % 1 497 1 613 3 072Consumption Extruded Products USA & Canada (kmt) 375 336 12 % 341 10 % 711 658 1 297Energy:Southern Norway spot price (NO2) (NOK/MWh) 203 272 (26) % 410 (51) % 238 465 360Nordic system spot price (NOK/MWh) 215 291 (26) % 409 (47) % 253 463 367
1) Industry statistics have been derived from analyst reports, trade associations and other public sources unless otherwise indicated. Amounts presented in prior reports may have been restated based on updated information. Currency rates have been derived from Norges Bank.
pageSECOND QUARTERMarket developments and outlook 5
Bauxite and aluminaGlobal demand for alumina increased slightly in the second quarter compared to the first quarter due to increased Chinese demand. The global alumina market continues to be oversupplied, however, announced refinery curtailments are expected to improve the market balance somewhat. As a result of the alumina export to China, the supply and demand in the world outside China was fairly balanced at the end of the quarter. Platts Alumina spot prices were relatively stable throughout the quarter closing at around USD 305 per mt.1) Prices as a percentage of LME strengthened during the quarter to an average of 15.8 percent. Price developments were influenced by increased Chinese imports partly due to restrictions on bauxite export from Indonesia. For the first five months in 2012, Chinese bauxite imports increased by 41 percent compared to the same period of last year, of which 85 percent originated from Indonesia. 1) Due to existing sales contracts, Hydro has limited volumes available for sale for the next few years. As a result, short-term alumina market developments have limited influence on Hydro's earnings for this period.
Primary aluminiumLME prices declined during the second quarter from a level around USD 2,100 per mt in the beginning of the quarter to around USD 1,850 per mt at the end of the quarter. Prices measured in NOK and EUR declined more moderately due to the strengthened USD. Global demand for primary aluminium (excluding China) increased during the second quarter compared to the first quarter. Growth in demand has been particularly strong in North America and Japan in 2012, while demand in Europe has declined.
Annualized consumption amounted to 26.7 million mt. Corresponding supply declined in the second quarter as a result of capacity curtailments with annualized production amounting to 25.7 million mt. The relatively strong growth in North America and Japan is expected to continue. However, continued economic uncertainty is expected to have a negative influence on market developments in Europe. Overall, global demand (excluding China) is expected to grow by around 2 percent in 2012 within a relatively balanced market. In China, aluminium consumption was higher in the second quarter compared to the first quarter amounting to 22.4 million mt on an annualized basis. Production increased slightly compared to the first quarter. Market supply and demand in China is expected to grow by about 8 percent in 2012. LME stocks have declined slightly to 4.8 million mt at the end of the second quarter compared with 5.0 million mt in the previous quarter. A large portion of the metal in warehouses continues to be owned by several large financial investors. European demand for extrusion ingot and foundry alloys was weaker in the second quarter of 2012 compared to the second quarter of 2011, primarily due to lower demand in Southern Europe. European demand for sheet ingot remained healthy in the second quarter and demand for wire rod remained strong.
page SECOND QUARTERMarket developments and outlook6
Rolled productsEuropean demand for flat rolled products increased slightly compared to the first quarter of 2012 and declined somewhat compared to the second quarter of 2011. Demand in the automotive segment declined slightly compared to the previous quarter due to reduced car production. This was mitigated somewhat due to a relatively stronger market for premium models with higher aluminium content. The foil market was stable compared with the previous quarter. However, price competition and high volumes of imported products put pressure on the market. Consumption in the beverage can segment increased. Demand in the general engineering segment was unchanged at relatively low levels and margins remained under pressure. European demand for flat rolled products is expected to decline in the third quarter due to seasonality and a weaker outlook for general engineering and the can beverage market segment.
Extruded productsEuropean demand for extruded aluminium products was seasonally higher in the second quarter compared to the first quarter, but declined compared to the same quarter of 2011. Demand remained weak within the building and construction market sector and in Southern Europe in particular. Margins continued to be under pressure in Europe in general. Demand for extruded aluminium products in North America was seasonally higher compared with the first quarter, and also higher than the second quarter of 2011. Demand improved in the transport and automotive segments and also for general engineering. Demand in South America was stable compared to the previous quarter and the second quarter of last year. Demand in the precision tubing market segment was influenced by reduced automotive production in Europe and South America. However, North American automotive production and demand for premium cars in general remained strong in the quarter, leaving total demand for precision tubing stable. In the third quarter of 2012 market demand is expected to continue softening and the European extrusion and building systems markets are expected to remain weak. In North America, the growth in demand for aluminium extrusions is expected to slow.
EnergyNordic spot prices were influenced by weather and hydrological developments during the second quarter which resulted in seasonally low prices. Nordic spot prices are expected to weaken further during summer, mainly due to the expectation of higher reservoir inflows from melting snow. The Nordic hydrological balance at the end of the second quarter was 7 TWh lower than at the end of the first quarter but 4 TWh above normal. Water levels in Norway were about 68 percent of full capacity at the end of the quarter, which is 2 percentage points above normal.
Additional factors impacting HydroHydro has sold forward around 80 percent of its expected primary aluminium production for the third quarter of 2012 at a price level of around USD 2,050 per mt. This excludes volumes from Qatalum. In June 2012 Hydro decided to close the remaining 120,000 mt of production at its Kurri Kurri aluminium smelter in Australia following the curtailment of 60,000 mt in January. In March, 2012 a fire occurred in a cooling tower at the Qatalum power plant. There were no injuries and production of primary aluminium has not been affected. However, additional operating costs were incurred in the second quarter and are expected to continue in the next quarter. Hydro's total snow and water reservoir levels declined during second quarter due to high production, but remained above normal at the end of the quarter. There continues to be significant uncertainty regarding global economic developments impacting the aluminium industry in general. Market developments in Southern Europe in particular are expected to remain weak. The current low LME price and high raw material cost levels are expected to have a significant negative effect on underlying results for Bauxite & Alumina in the next quarter.
pageSECOND QUARTERAdditional factors impacting Hydro 7
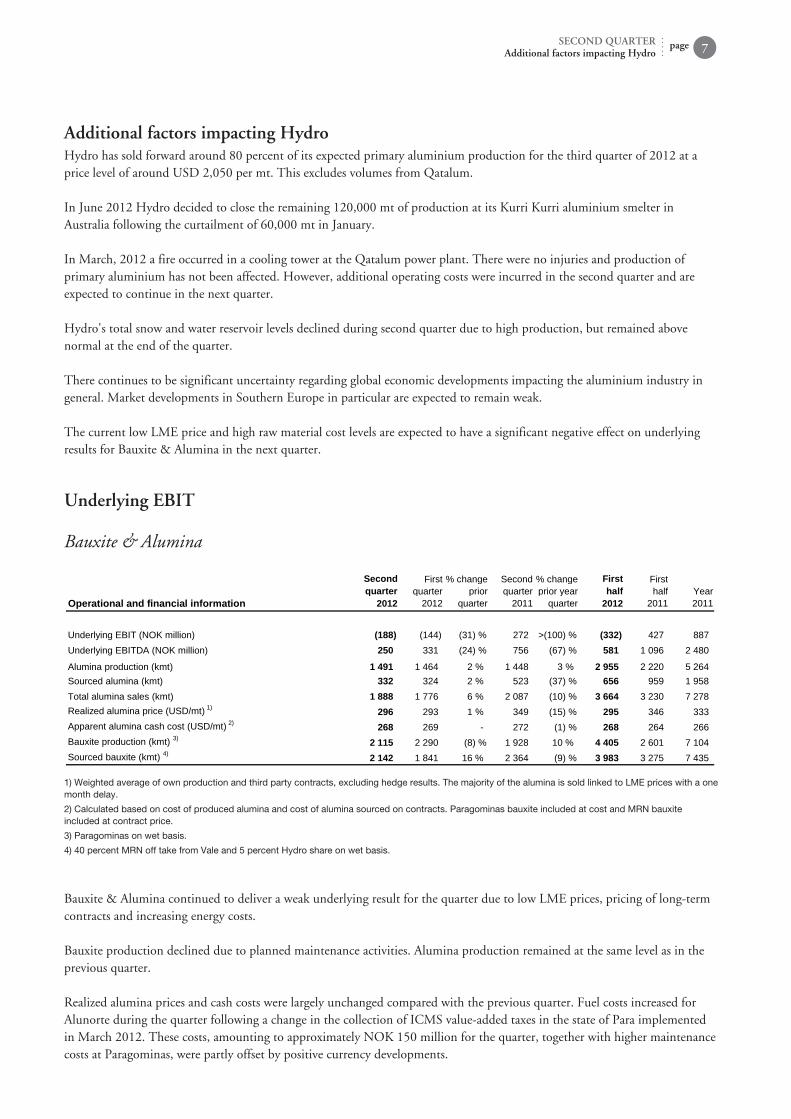
Underlying EBIT
Bauxite & Alumina
Operational and financial information
Secondquarter
2012
Firstquarter
2012
% changeprior
quarter
Secondquarter
2011
% changeprior year
quarter
Firsthalf
2012
Firsthalf
2011Year2011
Underlying EBIT (NOK million) (188) (144) (31) % 272 >(100) % (332) 427 887Underlying EBITDA (NOK million) 250 331 (24) % 756 (67) % 581 1 096 2 480
Alumina production (kmt) 1 491 1 464 2 % 1 448 3 % 2 955 2 220 5 264Sourced alumina (kmt) 332 324 2 % 523 (37) % 656 959 1 958Total alumina sales (kmt) 1 888 1 776 6 % 2 087 (10) % 3 664 3 230 7 278Realized alumina price (USD/mt) 1) 296 293 1 % 349 (15) % 295 346 333Apparent alumina cash cost (USD/mt) 2) 268 269 272 (1) % 268 264 266Bauxite production (kmt) 3) 2 115 2 290 (8) % 1 928 10 % 4 405 2 601 7 104Sourced bauxite (kmt) 4) 2 142 1 841 16 % 2 364 (9) % 3 983 3 275 7 435
1) Weighted average of own production and third party contracts, excluding hedge results. The majority of the alumina is sold linked to LME prices with a one month delay.
2) Calculated based on cost of produced alumina and cost of alumina sourced on contracts. Paragominas bauxite included at cost and MRN bauxite included at contract price.
3) Paragominas on wet basis.
4) 40 percent MRN off take from Vale and 5 percent Hydro share on wet basis.
Bauxite & Alumina continued to deliver a weak underlying result for the quarter due to low LME prices, pricing of long-term contracts and increasing energy costs. Bauxite production declined due to planned maintenance activities. Alumina production remained at the same level as in the previous quarter. Realized alumina prices and cash costs were largely unchanged compared with the previous quarter. Fuel costs increased for Alunorte during the quarter following a change in the collection of ICMS value-added taxes in the state of Para implemented in March 2012. These costs, amounting to approximately NOK 150 million for the quarter, together with higher maintenance costs at Paragominas, were partly offset by positive currency developments.
Underlying EBIT decreased substantially compared to the second quarter of 2011, mainly due to lower alumina prices. For the first half of 2012, underlying EBIT declined significantly compared to the corresponding period in 2011 primarily due to lower alumina prices.
page SECOND QUARTERUnderlying EBIT8
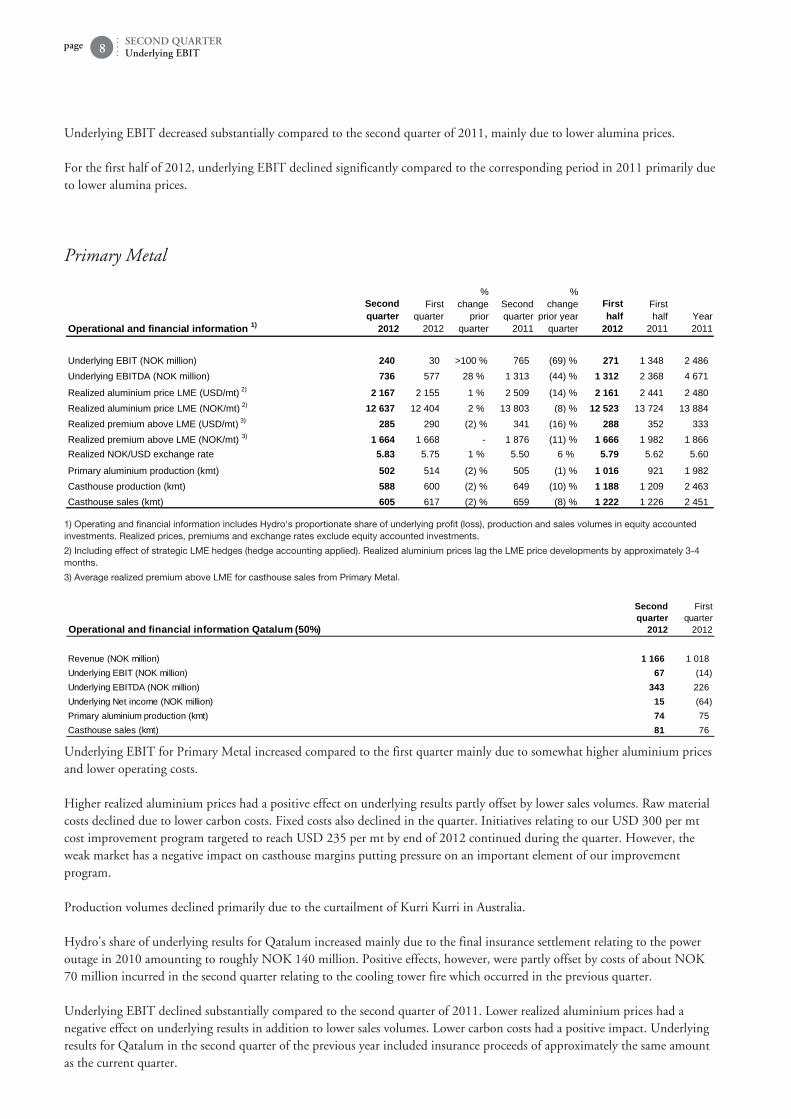
Primary Metal
Operational and financial information 1)
Secondquarter
2012
Firstquarter
2012
%change
priorquarter
Secondquarter
2011
%change
prior yearquarter
Firsthalf
2012
Firsthalf
2011Year2011
Underlying EBIT (NOK million) 240 30 >100 % 765 (69) % 271 1 348 2 486Underlying EBITDA (NOK million) 736 577 28 % 1 313 (44) % 1 312 2 368 4 671
Realized aluminium price LME (USD/mt) 2) 2 167 2 155 1 % 2 509 (14) % 2 161 2 441 2 480Realized aluminium price LME (NOK/mt) 2) 12 637 12 404 2 % 13 803 (8) % 12 523 13 724 13 884Realized premium above LME (USD/mt) 3) 285 290 (2) % 341 (16) % 288 352 333Realized premium above LME (NOK/mt) 3) 1 664 1 668 1 876 (11) % 1 666 1 982 1 866Realized NOK/USD exchange rate 5.83 5.75 1 % 5.50 6 % 5.79 5.62 5.60
Primary aluminium production (kmt) 502 514 (2) % 505 (1) % 1 016 921 1 982Casthouse production (kmt) 588 600 (2) % 649 (10) % 1 188 1 209 2 463Casthouse sales (kmt) 605 617 (2) % 659 (8) % 1 222 1 226 2 451
1) Operating and financial information includes Hydro's proportionate share of underlying profit (loss), production and sales volumes in equity accounted investments. Realized prices, premiums and exchange rates exclude equity accounted investments.
2) Including effect of strategic LME hedges (hedge accounting applied). Realized aluminium prices lag the LME price developments by approximately 3-4 months.
3) Average realized premium above LME for casthouse sales from Primary Metal.
Operational and financial information Qatalum (50%)
Secondquarter
2012
Firstquarter
2012
Revenue (NOK million) 1 166 1 018Underlying EBIT (NOK million) 67 (14)Underlying EBITDA (NOK million) 343 226Underlying Net income (NOK million) 15 (64)Primary aluminium production (kmt) 74 75Casthouse sales (kmt) 81 76
Underlying EBIT for Primary Metal increased compared to the first quarter mainly due to somewhat higher aluminium prices and lower operating costs. Higher realized aluminium prices had a positive effect on underlying results partly offset by lower sales volumes. Raw material costs declined due to lower carbon costs. Fixed costs also declined in the quarter. Initiatives relating to our USD 300 per mt cost improvement program targeted to reach USD 235 per mt by end of 2012 continued during the quarter. However, the weak market has a negative impact on casthouse margins putting pressure on an important element of our improvement program. Production volumes declined primarily due to the curtailment of Kurri Kurri in Australia. Hydro's share of underlying results for Qatalum increased mainly due to the final insurance settlement relating to the power outage in 2010 amounting to roughly NOK 140 million. Positive effects, however, were partly offset by costs of about NOK 70 million incurred in the second quarter relating to the cooling tower fire which occurred in the previous quarter. Underlying EBIT declined substantially compared to the second quarter of 2011. Lower realized aluminium prices had a negative effect on underlying results in addition to lower sales volumes. Lower carbon costs had a positive impact. Underlying results for Qatalum in the second quarter of the previous year included insurance proceeds of approximately the same amount as the current quarter.
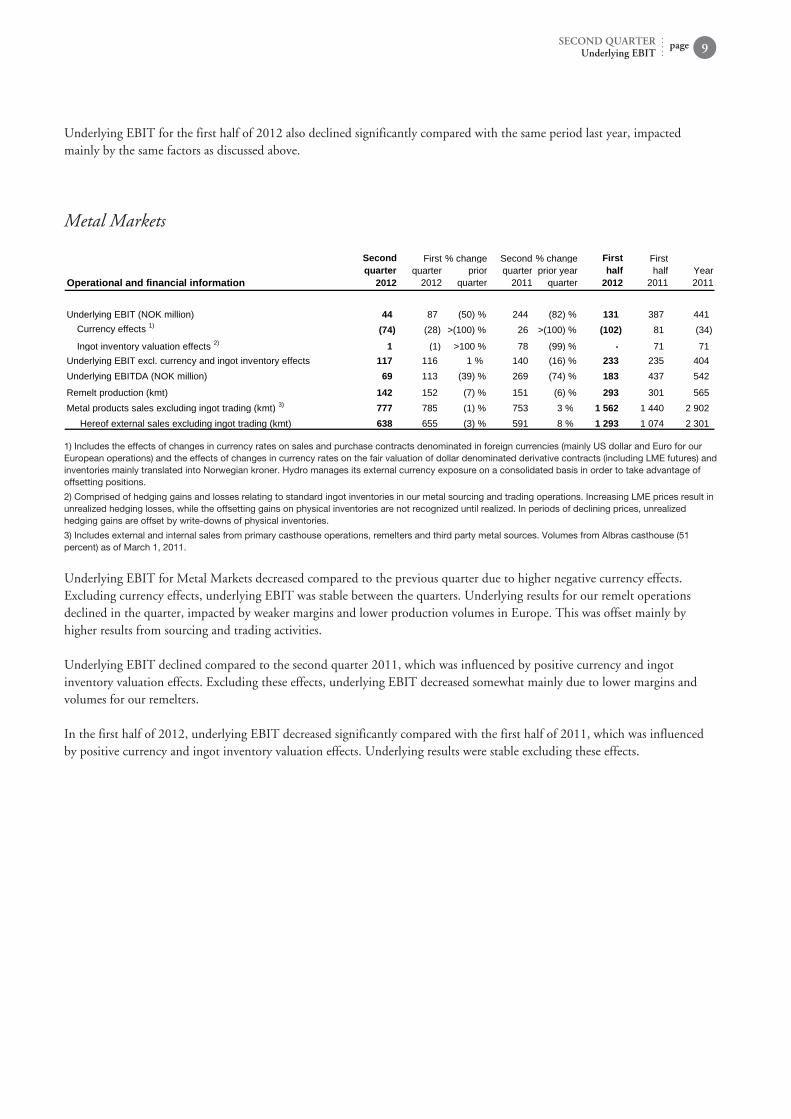
Underlying EBIT for the first half of 2012 also declined significantly compared with the same period last year, impacted mainly by the same factors as discussed above.
pageSECOND QUARTERUnderlying EBIT 9
Metal Markets
Operational and financial information
Secondquarter
2012
Firstquarter
2012
% changeprior
quarter
Secondquarter
2011
% changeprior year
quarter
Firsthalf
2012
Firsthalf
2011Year2011
Underlying EBIT (NOK million) 44 87 (50) % 244 (82) % 131 387 441Currency effects 1) (74) (28) >(100) % 26 >(100) % (102) 81 (34)
Ingot inventory valuation effects 2) 1 (1) >100 % 78 (99) % 71 71Underlying EBIT excl. currency and ingot inventory effects 117 116 1 % 140 (16) % 233 235 404Underlying EBITDA (NOK million) 69 113 (39) % 269 (74) % 183 437 542
Remelt production (kmt) 142 152 (7) % 151 (6) % 293 301 565Metal products sales excluding ingot trading (kmt) 3) 777 785 (1) % 753 3 % 1 562 1 440 2 902 Hereof external sales excluding ingot trading (kmt) 638 655 (3) % 591 8 % 1 293 1 074 2 301
1) Includes the effects of changes in currency rates on sales and purchase contracts denominated in foreign currencies (mainly US dollar and Euro for our European operations) and the effects of changes in currency rates on the fair valuation of dollar denominated derivative contracts (including LME futures) and inventories mainly translated into Norwegian kroner. Hydro manages its external currency exposure on a consolidated basis in order to take advantage of offsetting positions.
2) Comprised of hedging gains and losses relating to standard ingot inventories in our metal sourcing and trading operations. Increasing LME prices result in unrealized hedging losses, while the offsetting gains on physical inventories are not recognized until realized. In periods of declining prices, unrealized hedging gains are offset by write-downs of physical inventories.
3) Includes external and internal sales from primary casthouse operations, remelters and third party metal sources. Volumes from Albras casthouse (51 percent) as of March 1, 2011.
Underlying EBIT for Metal Markets decreased compared to the previous quarter due to higher negative currency effects. Excluding currency effects, underlying EBIT was stable between the quarters. Underlying results for our remelt operations declined in the quarter, impacted by weaker margins and lower production volumes in Europe. This was offset mainly by higher results from sourcing and trading activities. Underlying EBIT declined compared to the second quarter 2011, which was influenced by positive currency and ingot inventory valuation effects. Excluding these effects, underlying EBIT decreased somewhat mainly due to lower margins and volumes for our remelters. In the first half of 2012, underlying EBIT decreased significantly compared with the first half of 2011, which was influenced by positive currency and ingot inventory valuation effects. Underlying results were stable excluding these effects.
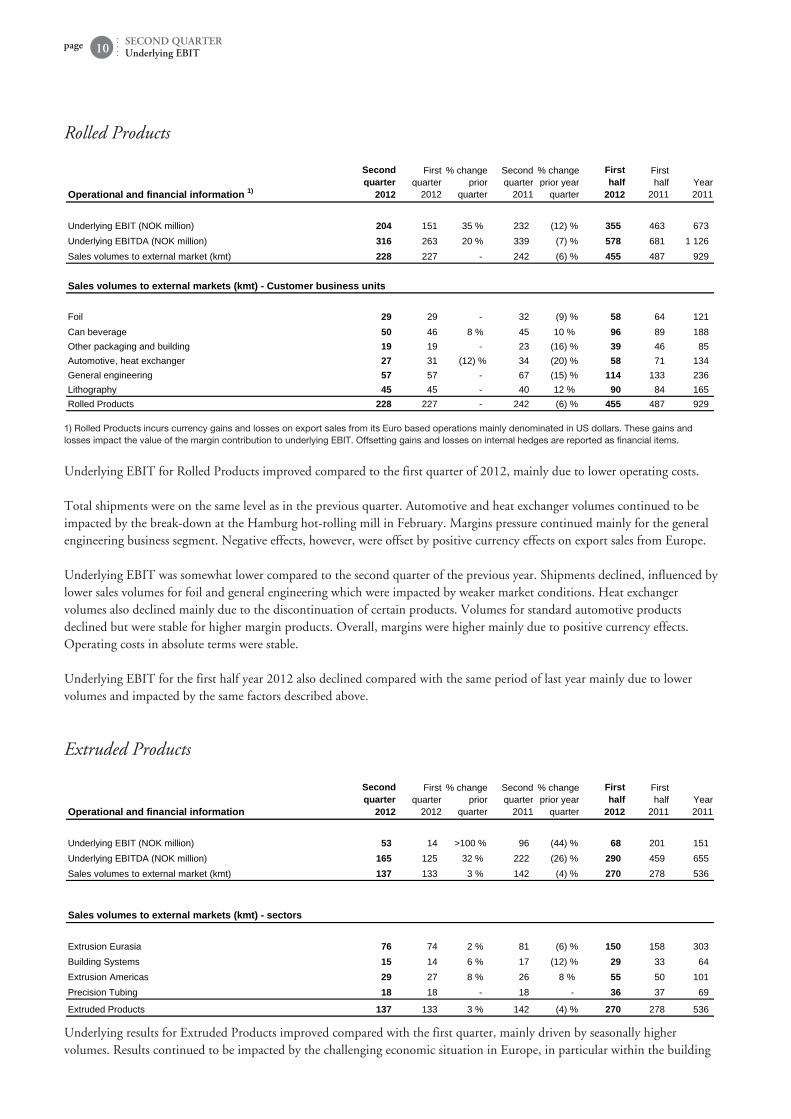
Rolled Products
Operational and financial information 1)
Secondquarter
2012
Firstquarter
2012
% changeprior
quarter
Secondquarter
2011
% changeprior year
quarter
Firsthalf
2012
Firsthalf
2011Year2011
Underlying EBIT (NOK million) 204 151 35 % 232 (12) % 355 463 673Underlying EBITDA (NOK million) 316 263 20 % 339 (7) % 578 681 1 126Sales volumes to external market (kmt) 228 227 242 (6) % 455 487 929
Sales volumes to external markets (kmt) Customer business units
Foil 29 29 32 (9) % 58 64 121Can beverage 50 46 8 % 45 10 % 96 89 188Other packaging and building 19 19 23 (16) % 39 46 85Automotive, heat exchanger 27 31 (12) % 34 (20) % 58 71 134General engineering 57 57 67 (15) % 114 133 236Lithography 45 45 40 12 % 90 84 165Rolled Products 228 227 242 (6) % 455 487 929
1) Rolled Products incurs currency gains and losses on export sales from its Euro based operations mainly denominated in US dollars. These gains and losses impact the value of the margin contribution to underlying EBIT. Offsetting gains and losses on internal hedges are reported as financial items.
Underlying EBIT for Rolled Products improved compared to the first quarter of 2012, mainly due to lower operating costs. Total shipments were on the same level as in the previous quarter. Automotive and heat exchanger volumes continued to be impacted by the break-down at the Hamburg hot-rolling mill in February. Margins pressure continued mainly for the general engineering business segment. Negative effects, however, were offset by positive currency effects on export sales from Europe. Underlying EBIT was somewhat lower compared to the second quarter of the previous year. Shipments declined, influenced by lower sales volumes for foil and general engineering which were impacted by weaker market conditions. Heat exchanger volumes also declined mainly due to the discontinuation of certain products. Volumes for standard automotive products declined but were stable for higher margin products. Overall, margins were higher mainly due to positive currency effects. Operating costs in absolute terms were stable. Underlying EBIT for the first half year 2012 also declined compared with the same period of last year mainly due to lower volumes and impacted by the same factors described above.
page SECOND QUARTERUnderlying EBIT10
Extruded Products
Operational and financial information
Secondquarter
2012
Firstquarter
2012
% changeprior
quarter
Secondquarter
2011
% changeprior year
quarter
Firsthalf
2012
Firsthalf
2011Year2011
Underlying EBIT (NOK million) 53 14 >100 % 96 (44) % 68 201 151Underlying EBITDA (NOK million) 165 125 32 % 222 (26) % 290 459 655Sales volumes to external market (kmt) 137 133 3 % 142 (4) % 270 278 536
Sales volumes to external markets (kmt) sectors
Extrusion Eurasia 76 74 2 % 81 (6) % 150 158 303Building Systems 15 14 6 % 17 (12) % 29 33 64Extrusion Americas 29 27 8 % 26 8 % 55 50 101Precision Tubing 18 18 18 36 37 69
Extruded Products 137 133 3 % 142 (4) % 270 278 536
Underlying results for Extruded Products improved compared with the first quarter, mainly driven by seasonally higher volumes. Results continued to be impacted by the challenging economic situation in Europe, in particular within the building
systems market. However, rationalization and restructuring initiatives are on track and operating costs declined compared with the previous quarter despite higher sales volumes. The seasonal increase in volumes for our European extrusion and building systems operations was lower than normal due to a further weakening of market sentiment. Volumes for higher value added products, in particular for the solar market segment, also fell in Europe. Volumes improved and were relatively strong in North America and stable in South America. Precision tubing volumes were stable with weaker demand in Europe offset by higher volumes in North America. Product margins were stable, however, total margins declined due to lower sales volumes of higher value added products. An improved cost position in our Building Systems business and increased productivity for our general extrusion operations contributed to reduced cost per mt compared to the previous quarter. Compared to the second quarter of 2011, underlying EBIT was substantially lower, impacted by lower volumes for our European operations, partly offset by lower operating costs. Underlying EBIT for the first half of 2012 also declined impacted by the same factors discussed above.
pageSECOND QUARTERUnderlying EBIT 11
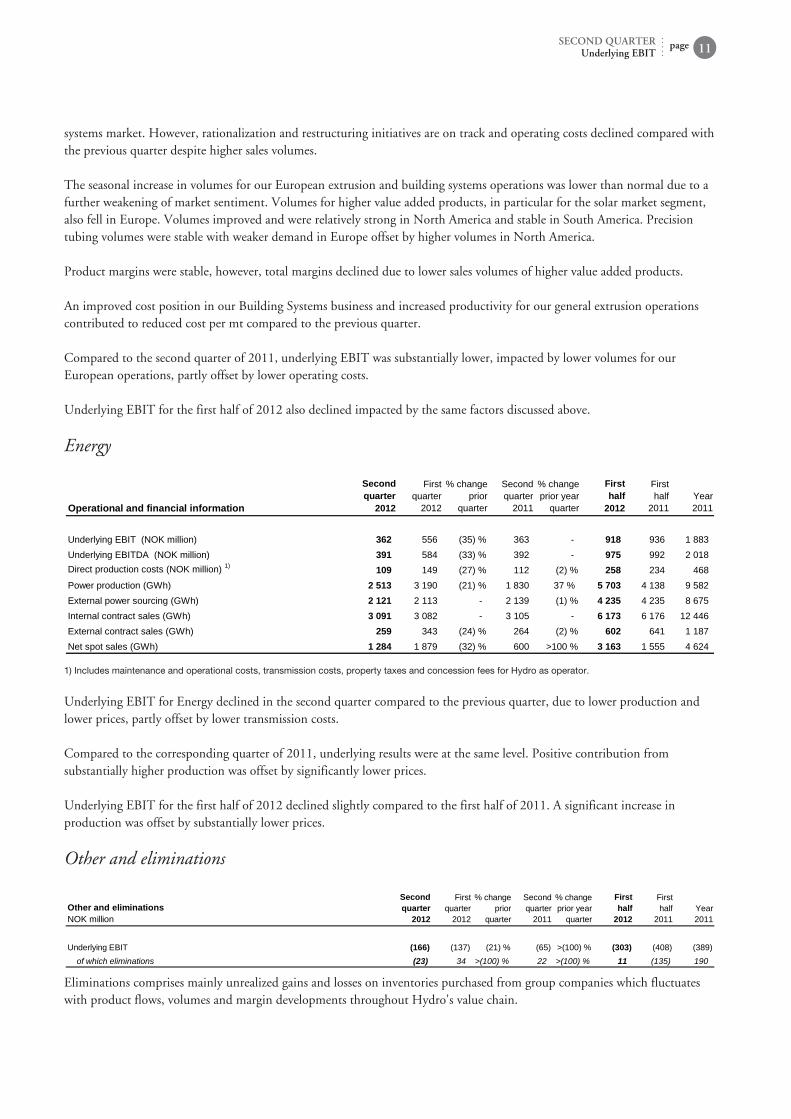
Energy
Operational and financial information
Secondquarter
2012
Firstquarter
2012
% changeprior
quarter
Secondquarter
2011
% changeprior year
quarter
Firsthalf
2012
Firsthalf
2011Year2011
Underlying EBIT (NOK million) 362 556 (35) % 363 918 936 1 883Underlying EBITDA (NOK million) 391 584 (33) % 392 975 992 2 018Direct production costs (NOK million) 1) 109 149 (27) % 112 (2) % 258 234 468Power production (GWh) 2 513 3 190 (21) % 1 830 37 % 5 703 4 138 9 582External power sourcing (GWh) 2 121 2 113 2 139 (1) % 4 235 4 235 8 675Internal contract sales (GWh) 3 091 3 082 3 105 6 173 6 176 12 446External contract sales (GWh) 259 343 (24) % 264 (2) % 602 641 1 187Net spot sales (GWh) 1 284 1 879 (32) % 600 >100 % 3 163 1 555 4 624
1) Includes maintenance and operational costs, transmission costs, property taxes and concession fees for Hydro as operator.
Underlying EBIT for Energy declined in the second quarter compared to the previous quarter, due to lower production and lower prices, partly offset by lower transmission costs. Compared to the corresponding quarter of 2011, underlying results were at the same level. Positive contribution from substantially higher production was offset by significantly lower prices. Underlying EBIT for the first half of 2012 declined slightly compared to the first half of 2011. A significant increase in production was offset by substantially lower prices.
Other and eliminations
Other and eliminationsNOK million
Secondquarter
2012
Firstquarter
2012
% changeprior
quarter
Secondquarter
2011
% changeprior year
quarter
Firsthalf
2012
Firsthalf
2011Year2011
Underlying EBIT (166) (137) (21) % (65) >(100) % (303) (408) (389)of which eliminations (23) 34 >(100) % 22 >(100) % 11 (135) 190
Eliminations comprises mainly unrealized gains and losses on inventories purchased from group companies which fluctuates with product flows, volumes and margin developments throughout Hydro's value chain.
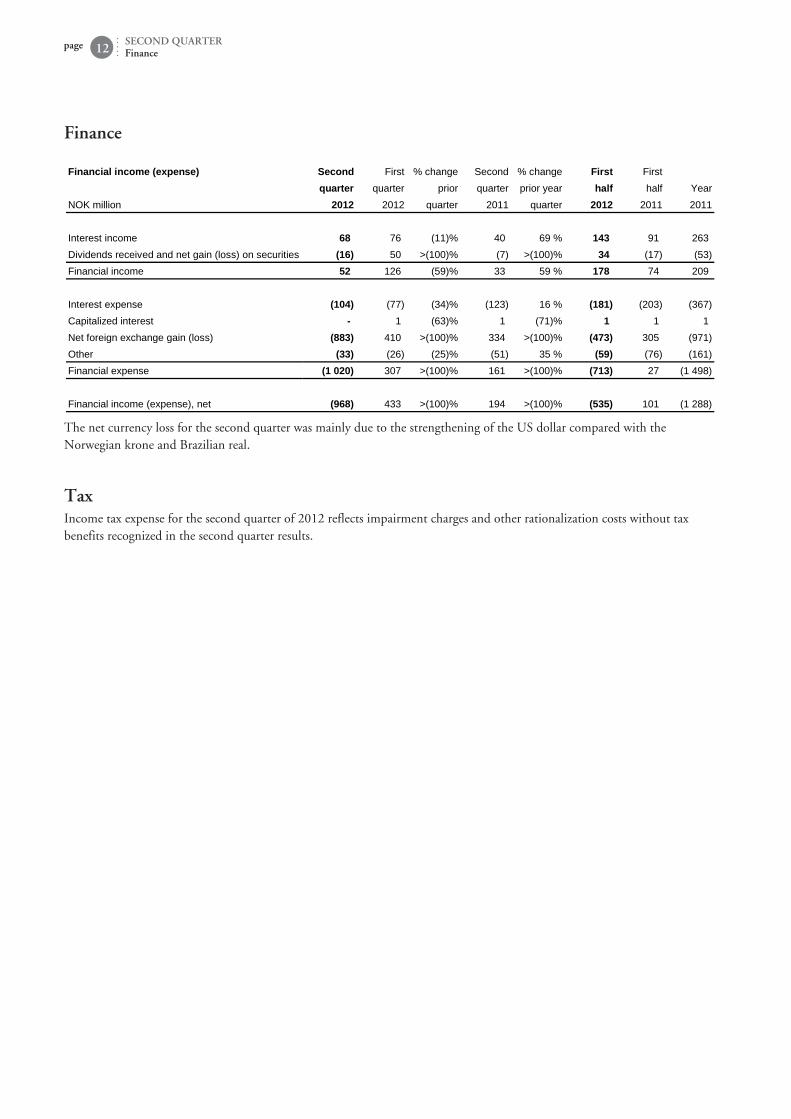
Finance Financial income (expense) Second First % change Second % change First First
quarter quarter prior quarter prior year half half YearNOK million 2012 2012 quarter 2011 quarter 2012 2011 2011
Interest income 68 76 (11)% 40 69 % 143 91 263Dividends received and net gain (loss) on securities (16) 50 >(100)% (7) >(100)% 34 (17) (53)Financial income 52 126 (59)% 33 59 % 178 74 209
Interest expense (104) (77) (34)% (123) 16 % (181) (203) (367)Capitalized interest 1 (63)% 1 (71)% 1 1 1Net foreign exchange gain (loss) (883) 410 >(100)% 334 >(100)% (473) 305 (971)Other (33) (26) (25)% (51) 35 % (59) (76) (161)Financial expense (1 020) 307 >(100)% 161 >(100)% (713) 27 (1 498)
Financial income (expense), net (968) 433 >(100)% 194 >(100)% (535) 101 (1 288)
The net currency loss for the second quarter was mainly due to the strengthening of the US dollar compared with the Norwegian krone and Brazilian real.
page SECOND QUARTERFinance12
TaxIncome tax expense for the second quarter of 2012 reflects impairment charges and other rationalization costs without tax benefits recognized in the second quarter results.
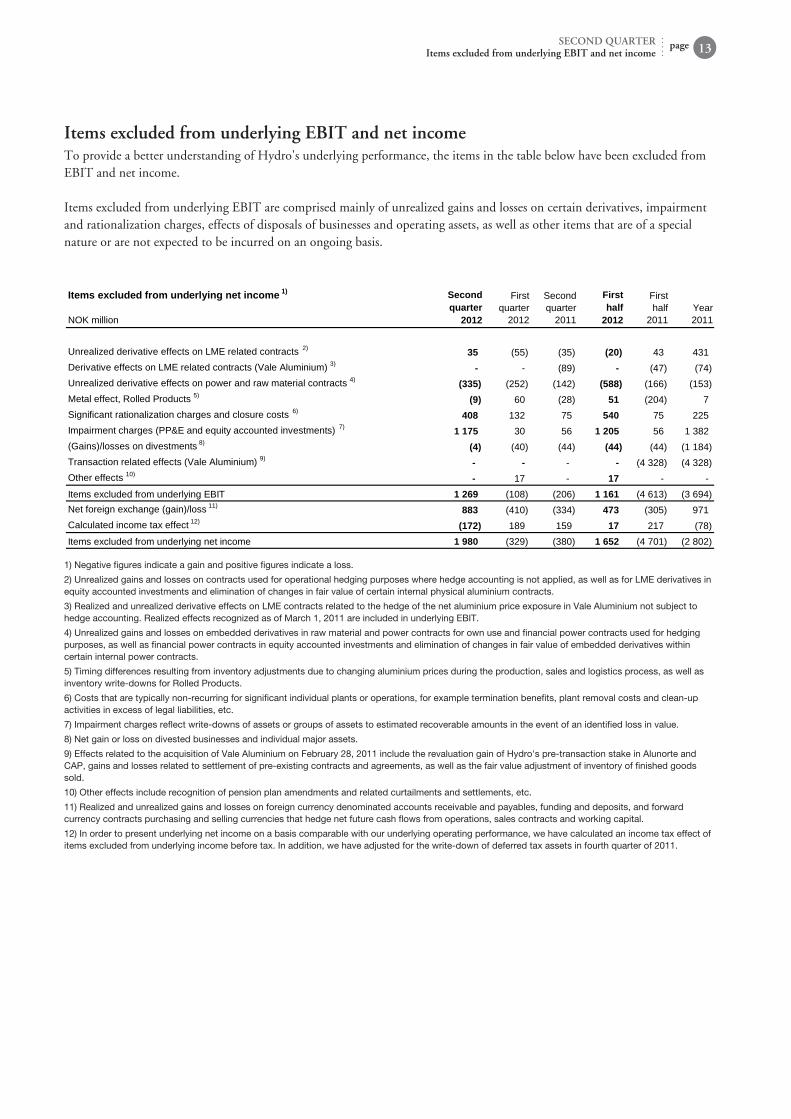
Items excluded from underlying EBIT and net incomeTo provide a better understanding of Hydro's underlying performance, the items in the table below have been excluded from EBIT and net income. Items excluded from underlying EBIT are comprised mainly of unrealized gains and losses on certain derivatives, impairment and rationalization charges, effects of disposals of businesses and operating assets, as well as other items that are of a special nature or are not expected to be incurred on an ongoing basis. Items excluded from underlying net income 1)
NOK million
Secondquarter
2012
Firstquarter
2012
Secondquarter
2011
Firsthalf
2012
Firsthalf
2011Year2011
Unrealized derivative effects on LME related contracts 2) 35 (55) (35) (20) 43 431Derivative effects on LME related contracts (Vale Aluminium) 3) (89) (47) (74)Unrealized derivative effects on power and raw material contracts 4) (335) (252) (142) (588) (166) (153)Metal effect, Rolled Products 5) (9) 60 (28) 51 (204) 7Significant rationalization charges and closure costs 6) 408 132 75 540 75 225Impairment charges (PP&E and equity accounted investments) 7) 1 175 30 56 1 205 56 1 382(Gains)/losses on divestments 8) (4) (40) (44) (44) (44) (1 184)Transaction related effects (Vale Aluminium) 9) (4 328) (4 328)Other effects 10) 17 17 Items excluded from underlying EBIT 1 269 (108) (206) 1 161 (4 613) (3 694)Net foreign exchange (gain)/loss 11) 883 (410) (334) 473 (305) 971Calculated income tax effect 12) (172) 189 159 17 217 (78)Items excluded from underlying net income 1 980 (329) (380) 1 652 (4 701) (2 802)
1) Negative figures indicate a gain and positive figures indicate a loss.
2) Unrealized gains and losses on contracts used for operational hedging purposes where hedge accounting is not applied, as well as for LME derivatives in equity accounted investments and elimination of changes in fair value of certain internal physical aluminium contracts.
3) Realized and unrealized derivative effects on LME contracts related to the hedge of the net aluminium price exposure in Vale Aluminium not subject to hedge accounting. Realized effects recognized as of March 1, 2011 are included in underlying EBIT.
4) Unrealized gains and losses on embedded derivatives in raw material and power contracts for own use and financial power contracts used for hedging purposes, as well as financial power contracts in equity accounted investments and elimination of changes in fair value of embedded derivatives within certain internal power contracts.
5) Timing differences resulting from inventory adjustments due to changing aluminium prices during the production, sales and logistics process, as well as inventory write-downs for Rolled Products.
6) Costs that are typically non-recurring for significant individual plants or operations, for example termination benefits, plant removal costs and clean-up activities in excess of legal liabilities, etc.
7) Impairment charges reflect write-downs of assets or groups of assets to estimated recoverable amounts in the event of an identified loss in value.
8) Net gain or loss on divested businesses and individual major assets.
9) Effects related to the acquisition of Vale Aluminium on February 28, 2011 include the revaluation gain of Hydro's pre-transaction stake in Alunorte and CAP, gains and losses related to settlement of pre-existing contracts and agreements, as well as the fair value adjustment of inventory of finished goods sold.
10) Other effects include recognition of pension plan amendments and related curtailments and settlements, etc.
11) Realized and unrealized gains and losses on foreign currency denominated accounts receivable and payables, funding and deposits, and forward currency contracts purchasing and selling currencies that hedge net future cash flows from operations, sales contracts and working capital.
12) In order to present underlying net income on a basis comparable with our underlying operating performance, we have calculated an income tax effect of items excluded from underlying income before tax. In addition, we have adjusted for the write-down of deferred tax assets in fourth quarter of 2011.
pageSECOND QUARTERItems excluded from underlying EBIT and net income 13
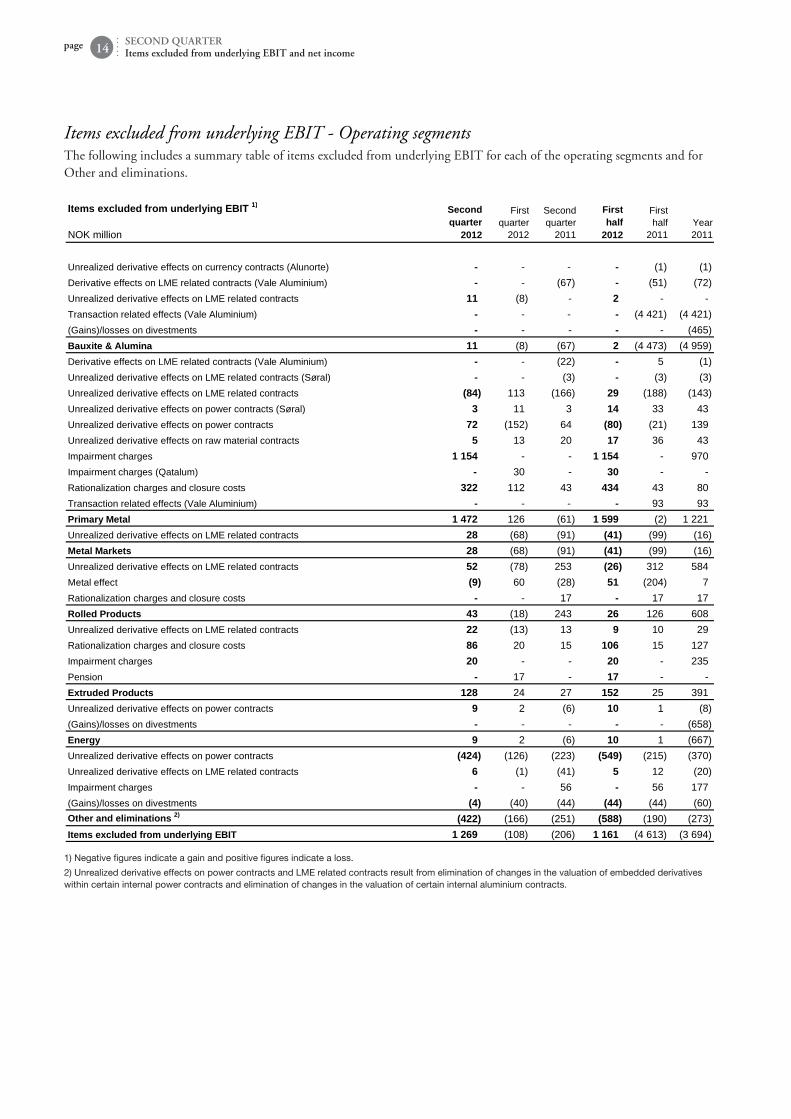
Items excluded from underlying EBIT - Operating segmentsThe following includes a summary table of items excluded from underlying EBIT for each of the operating segments and for Other and eliminations. Items excluded from underlying EBIT 1)
NOK million
Secondquarter
2012
Firstquarter
2012
Secondquarter
2011
Firsthalf
2012
Firsthalf
2011Year2011
Unrealized derivative effects on currency contracts (Alunorte) (1) (1)Derivative effects on LME related contracts (Vale Aluminium) (67) (51) (72)Unrealized derivative effects on LME related contracts 11 (8) 2 Transaction related effects (Vale Aluminium) (4 421) (4 421)(Gains)/losses on divestments (465)Bauxite & Alumina 11 (8) (67) 2 (4 473) (4 959)Derivative effects on LME related contracts (Vale Aluminium) (22) 5 (1)Unrealized derivative effects on LME related contracts (Søral) (3) (3) (3)Unrealized derivative effects on LME related contracts (84) 113 (166) 29 (188) (143)Unrealized derivative effects on power contracts (Søral) 3 11 3 14 33 43Unrealized derivative effects on power contracts 72 (152) 64 (80) (21) 139Unrealized derivative effects on raw material contracts 5 13 20 17 36 43Impairment charges 1 154 1 154 970Impairment charges (Qatalum) 30 30 Rationalization charges and closure costs 322 112 43 434 43 80Transaction related effects (Vale Aluminium) 93 93Primary Metal 1 472 126 (61) 1 599 (2) 1 221Unrealized derivative effects on LME related contracts 28 (68) (91) (41) (99) (16)Metal Markets 28 (68) (91) (41) (99) (16)Unrealized derivative effects on LME related contracts 52 (78) 253 (26) 312 584Metal effect (9) 60 (28) 51 (204) 7Rationalization charges and closure costs 17 17 17Rolled Products 43 (18) 243 26 126 608Unrealized derivative effects on LME related contracts 22 (13) 13 9 10 29Rationalization charges and closure costs 86 20 15 106 15 127Impairment charges 20 20 235Pension 17 17 Extruded Products 128 24 27 152 25 391Unrealized derivative effects on power contracts 9 2 (6) 10 1 (8)(Gains)/losses on divestments (658)Energy 9 2 (6) 10 1 (667)Unrealized derivative effects on power contracts (424) (126) (223) (549) (215) (370)Unrealized derivative effects on LME related contracts 6 (1) (41) 5 12 (20)Impairment charges 56 56 177(Gains)/losses on divestments (4) (40) (44) (44) (44) (60)Other and eliminations 2) (422) (166) (251) (588) (190) (273)Items excluded from underlying EBIT 1 269 (108) (206) 1 161 (4 613) (3 694)
1) Negative figures indicate a gain and positive figures indicate a loss.
2) Unrealized derivative effects on power contracts and LME related contracts result from elimination of changes in the valuation of embedded derivatives within certain internal power contracts and elimination of changes in the valuation of certain internal aluminium contracts.
page SECOND QUARTERItems excluded from underlying EBIT and net income14
Interim financial statements
pageSECOND QUARTERInterim financial statements 15
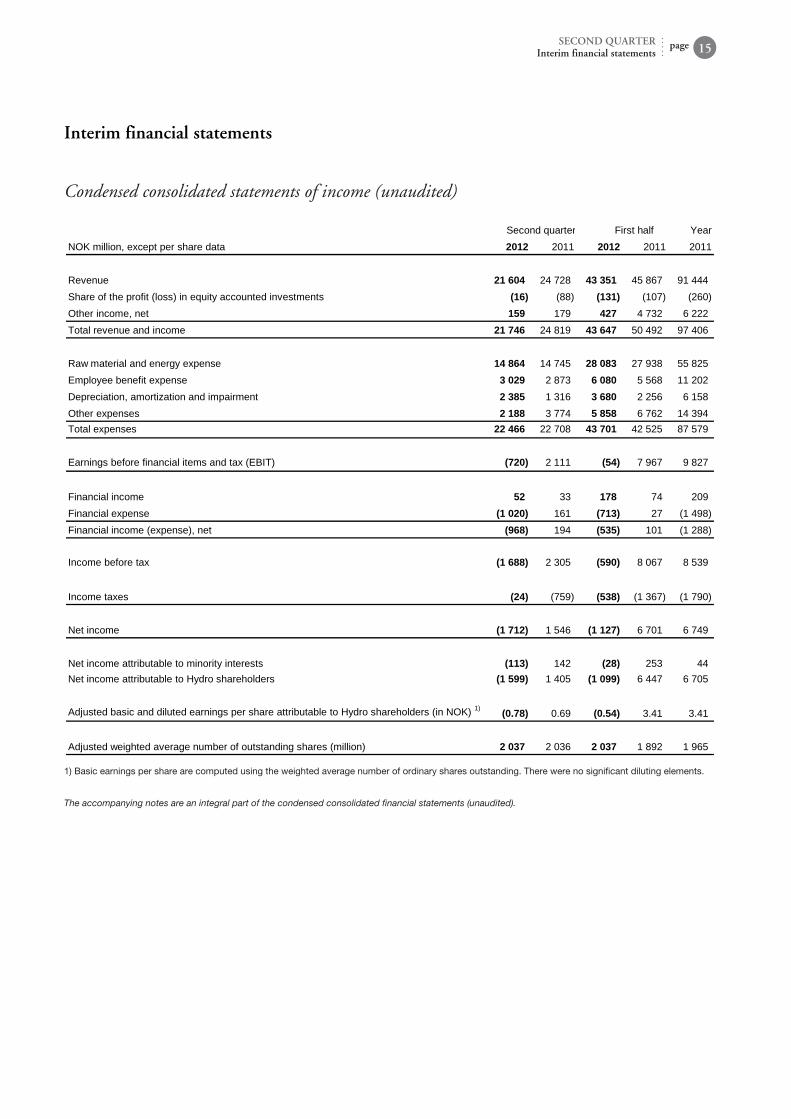
Condensed consolidated statements of income (unaudited)
Second quarter First half YearNOK million, except per share data 2012 2011 2012 2011 2011
Revenue 21 604 24 728 43 351 45 867 91 444Share of the profit (loss) in equity accounted investments (16) (88) (131) (107) (260)Other income, net 159 179 427 4 732 6 222Total revenue and income 21 746 24 819 43 647 50 492 97 406
Raw material and energy expense 14 864 14 745 28 083 27 938 55 825Employee benefit expense 3 029 2 873 6 080 5 568 11 202Depreciation, amortization and impairment 2 385 1 316 3 680 2 256 6 158Other expenses 2 188 3 774 5 858 6 762 14 394Total expenses 22 466 22 708 43 701 42 525 87 579
Earnings before financial items and tax (EBIT) (720) 2 111 (54) 7 967 9 827
Financial income 52 33 178 74 209Financial expense (1 020) 161 (713) 27 (1 498)Financial income (expense), net (968) 194 (535) 101 (1 288)
Income before tax (1 688) 2 305 (590) 8 067 8 539
Income taxes (24) (759) (538) (1 367) (1 790)
Net income (1 712) 1 546 (1 127) 6 701 6 749
Net income attributable to minority interests (113) 142 (28) 253 44Net income attributable to Hydro shareholders (1 599) 1 405 (1 099) 6 447 6 705
Adjusted basic and diluted earnings per share attributable to Hydro shareholders (in NOK) 1) (0.78) 0.69 (0.54) 3.41 3.41
Adjusted weighted average number of outstanding shares (million) 2 037 2 036 2 037 1 892 1 965
1) Basic earnings per share are computed using the weighted average number of ordinary shares outstanding. There were no significant diluting elements.
The accompanying notes are an integral part of the condensed consolidated financial statements (unaudited).
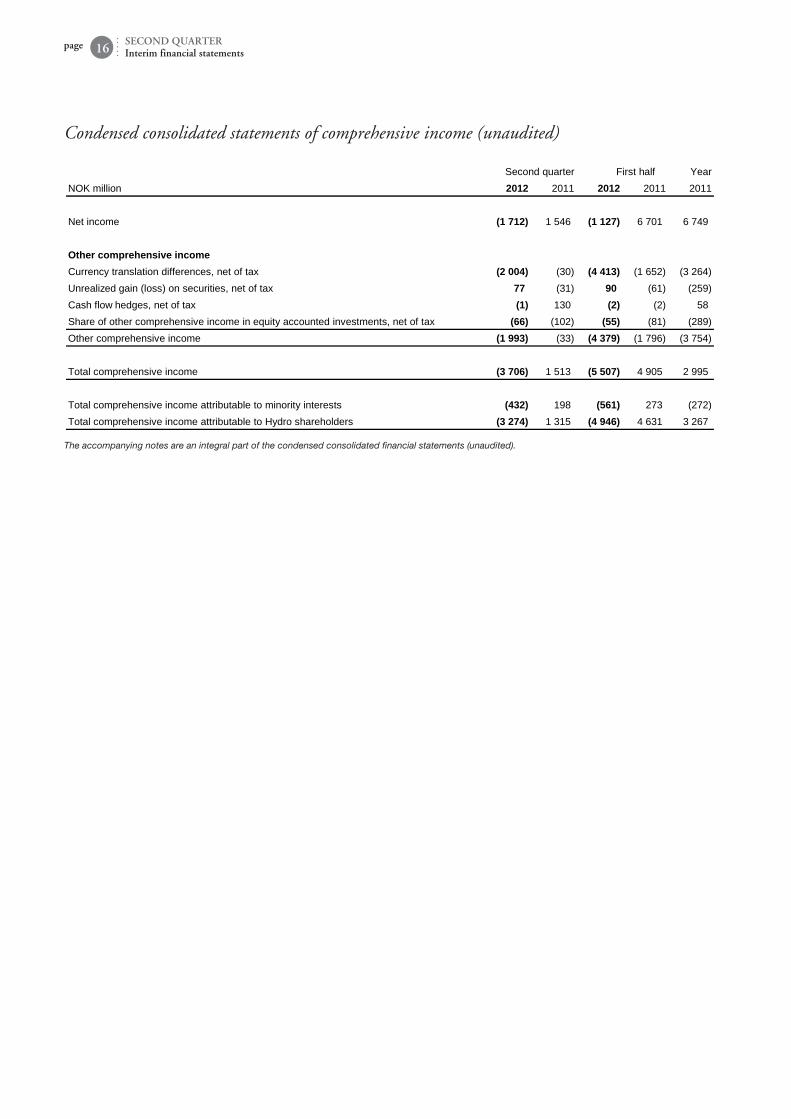
Condensed consolidated statements of comprehensive income (unaudited)
Second quarter First half YearNOK million 2012 2011 2012 2011 2011
Net income (1 712) 1 546 (1 127) 6 701 6 749
Other comprehensive incomeCurrency translation differences, net of tax (2 004) (30) (4 413) (1 652) (3 264)Unrealized gain (loss) on securities, net of tax 77 (31) 90 (61) (259)Cash flow hedges, net of tax (1) 130 (2) (2) 58Share of other comprehensive income in equity accounted investments, net of tax (66) (102) (55) (81) (289)Other comprehensive income (1 993) (33) (4 379) (1 796) (3 754)
Total comprehensive income (3 706) 1 513 (5 507) 4 905 2 995
Total comprehensive income attributable to minority interests (432) 198 (561) 273 (272)Total comprehensive income attributable to Hydro shareholders (3 274) 1 315 (4 946) 4 631 3 267
The accompanying notes are an integral part of the condensed consolidated financial statements (unaudited).
page SECOND QUARTERInterim financial statements16
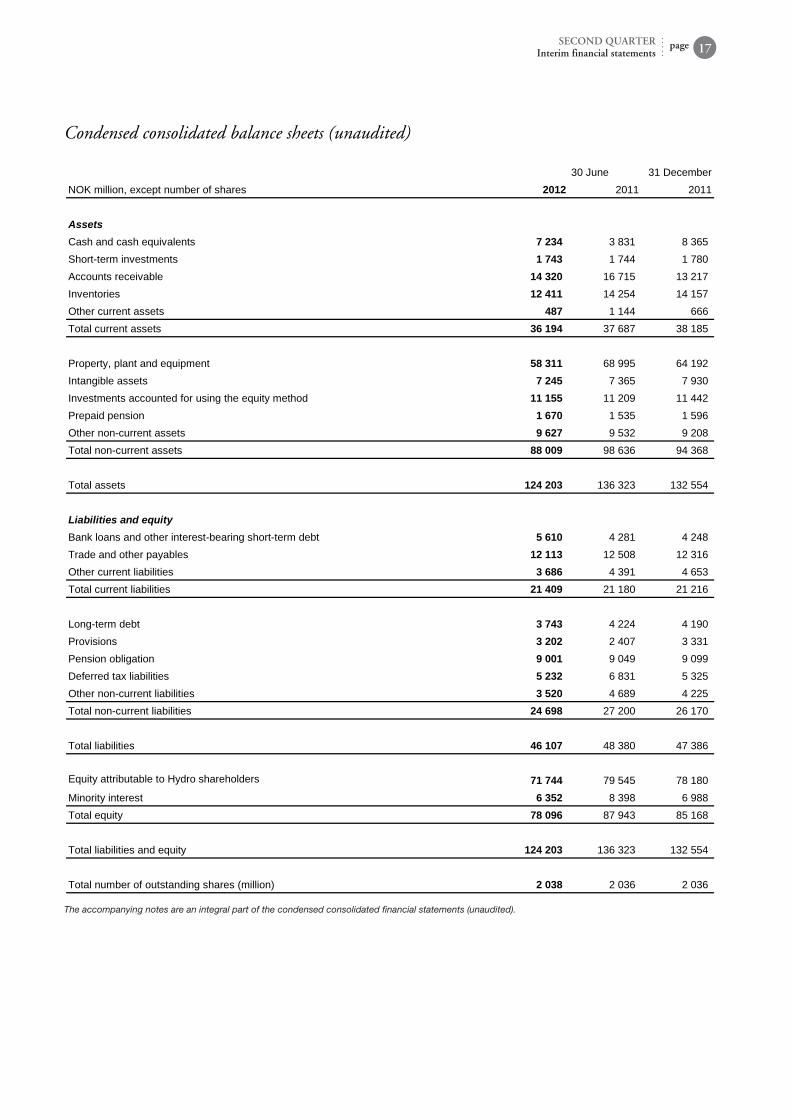
Condensed consolidated balance sheets (unaudited)
30 June 31 DecemberNOK million, except number of shares 2012 2011 2011
AssetsCash and cash equivalents 7 234 3 831 8 365Shortterm investments 1 743 1 744 1 780Accounts receivable 14 320 16 715 13 217Inventories 12 411 14 254 14 157Other current assets 487 1 144 666Total current assets 36 194 37 687 38 185
Property, plant and equipment 58 311 68 995 64 192Intangible assets 7 245 7 365 7 930Investments accounted for using the equity method 11 155 11 209 11 442Prepaid pension 1 670 1 535 1 596Other noncurrent assets 9 627 9 532 9 208Total noncurrent assets 88 009 98 636 94 368
Total assets 124 203 136 323 132 554
Liabilities and equityBank loans and other interestbearing shortterm debt 5 610 4 281 4 248Trade and other payables 12 113 12 508 12 316Other current liabilities 3 686 4 391 4 653Total current liabilities 21 409 21 180 21 216
Longterm debt 3 743 4 224 4 190Provisions 3 202 2 407 3 331Pension obligation 9 001 9 049 9 099Deferred tax liabilities 5 232 6 831 5 325Other noncurrent liabilities 3 520 4 689 4 225Total noncurrent liabilities 24 698 27 200 26 170
Total liabilities 46 107 48 380 47 386
Equity attributable to Hydro shareholders 71 744 79 545 78 180Minority interest 6 352 8 398 6 988Total equity 78 096 87 943 85 168
Total liabilities and equity 124 203 136 323 132 554
Total number of outstanding shares (million) 2 038 2 036 2 036
The accompanying notes are an integral part of the condensed consolidated financial statements (unaudited).
pageSECOND QUARTERInterim financial statements 17
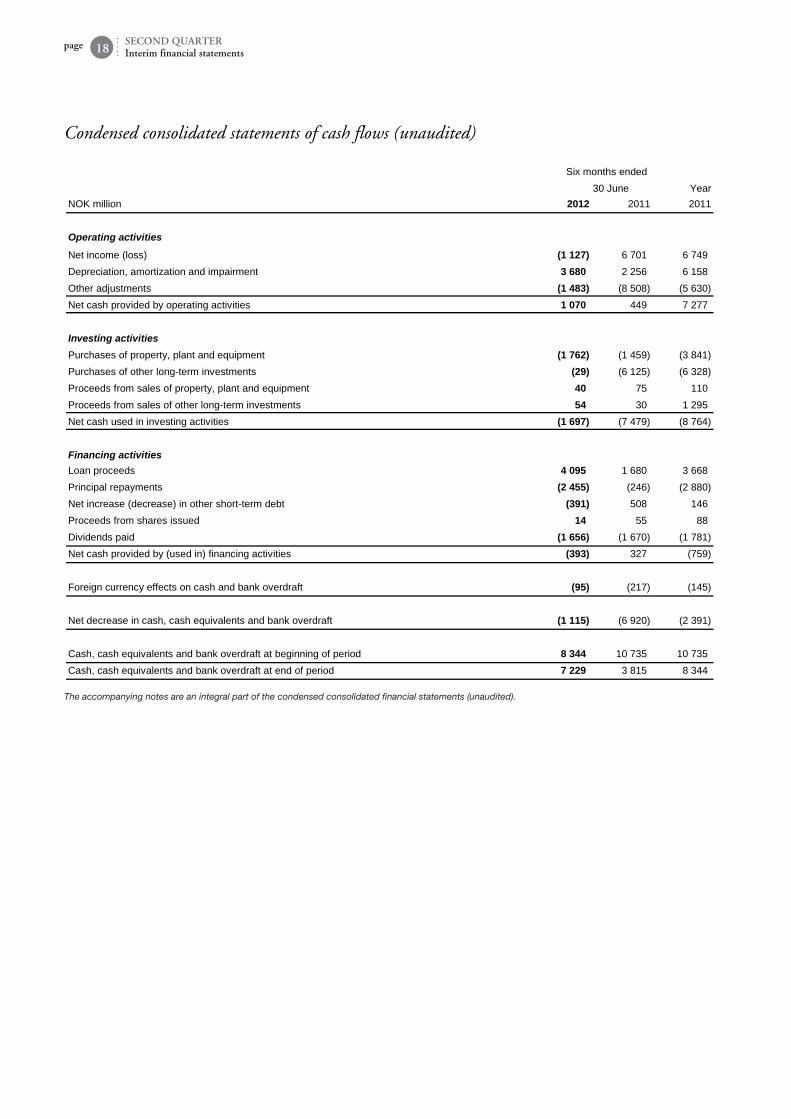
Condensed consolidated statements of cash flows (unaudited)
Six months ended 30 June Year
NOK million 2012 2011 2011
Operating activities
Net income (loss) (1 127) 6 701 6 749Depreciation, amortization and impairment 3 680 2 256 6 158Other adjustments (1 483) (8 508) (5 630)Net cash provided by operating activities 1 070 449 7 277
Investing activitiesPurchases of property, plant and equipment (1 762) (1 459) (3 841)Purchases of other longterm investments (29) (6 125) (6 328)Proceeds from sales of property, plant and equipment 40 75 110Proceeds from sales of other longterm investments 54 30 1 295Net cash used in investing activities (1 697) (7 479) (8 764)
Financing activitiesLoan proceeds 4 095 1 680 3 668Principal repayments (2 455) (246) (2 880)Net increase (decrease) in other shortterm debt (391) 508 146Proceeds from shares issued 14 55 88Dividends paid (1 656) (1 670) (1 781)Net cash provided by (used in) financing activities (393) 327 (759)
Foreign currency effects on cash and bank overdraft (95) (217) (145)
Net decrease in cash, cash equivalents and bank overdraft (1 115) (6 920) (2 391)
Cash, cash equivalents and bank overdraft at beginning of period 8 344 10 735 10 735Cash, cash equivalents and bank overdraft at end of period 7 229 3 815 8 344
The accompanying notes are an integral part of the condensed consolidated financial statements (unaudited).
page SECOND QUARTERInterim financial statements18
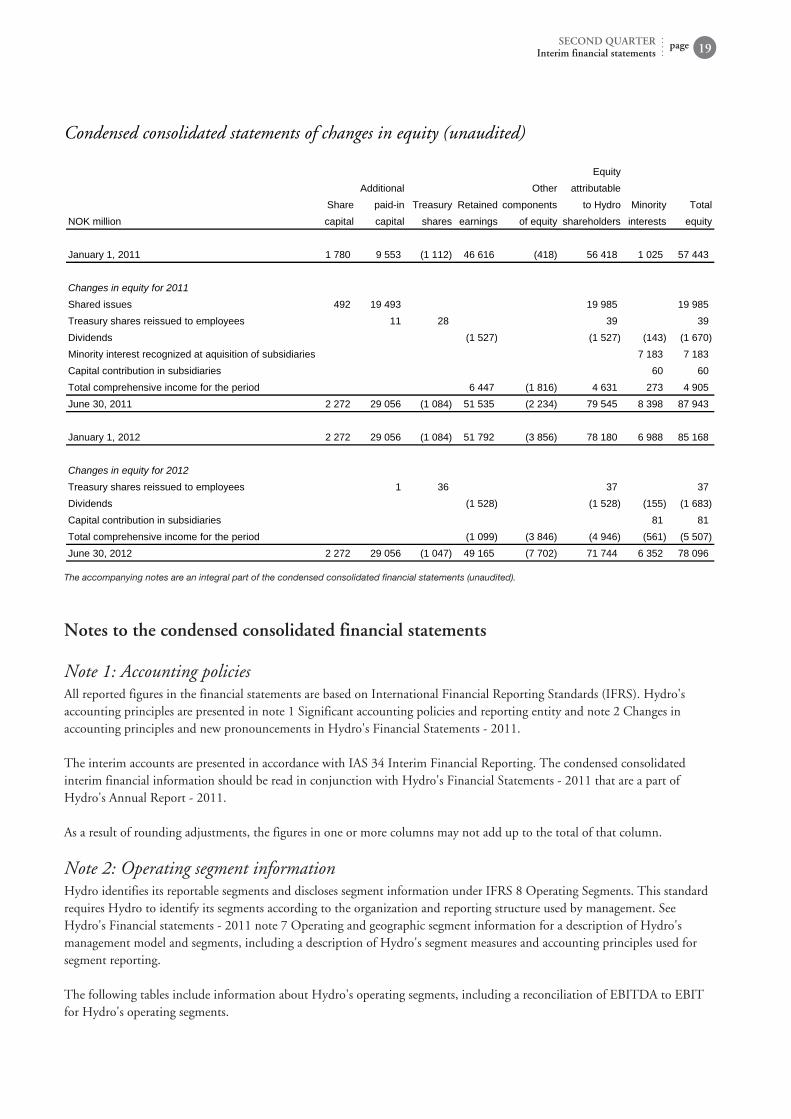
Condensed consolidated statements of changes in equity (unaudited)
EquityAdditional Other attributable
Share paidin Treasury Retained components to Hydro Minority TotalNOK million capital capital shares earnings of equity shareholders interests equity
January 1, 2011 1 780 9 553 (1 112) 46 616 (418) 56 418 1 025 57 443
Changes in equity for 2011Shared issues 492 19 493 19 985 19 985Treasury shares reissued to employees 11 28 39 39Dividends (1 527) (1 527) (143) (1 670)Minority interest recognized at aquisition of subsidiaries 7 183 7 183Capital contribution in subsidiaries 60 60Total comprehensive income for the period 6 447 (1 816) 4 631 273 4 905June 30, 2011 2 272 29 056 (1 084) 51 535 (2 234) 79 545 8 398 87 943
January 1, 2012 2 272 29 056 (1 084) 51 792 (3 856) 78 180 6 988 85 168
Changes in equity for 2012Treasury shares reissued to employees 1 36 37 37Dividends (1 528) (1 528) (155) (1 683)Capital contribution in subsidiaries 81 81Total comprehensive income for the period (1 099) (3 846) (4 946) (561) (5 507)June 30, 2012 2 272 29 056 (1 047) 49 165 (7 702) 71 744 6 352 78 096
The accompanying notes are an integral part of the condensed consolidated financial statements (unaudited).
pageSECOND QUARTERInterim financial statements 19
Notes to the condensed consolidated financial statements
Note 1: Accounting policiesAll reported figures in the financial statements are based on International Financial Reporting Standards (IFRS). Hydro's accounting principles are presented in note 1 Significant accounting policies and reporting entity and note 2 Changes in accounting principles and new pronouncements in Hydro's Financial Statements - 2011. The interim accounts are presented in accordance with IAS 34 Interim Financial Reporting. The condensed consolidated interim financial information should be read in conjunction with Hydro's Financial Statements - 2011 that are a part of Hydro's Annual Report - 2011. As a result of rounding adjustments, the figures in one or more columns may not add up to the total of that column.
Note 2: Operating segment informationHydro identifies its reportable segments and discloses segment information under IFRS 8 Operating Segments. This standard requires Hydro to identify its segments according to the organization and reporting structure used by management. See Hydro's Financial statements - 2011 note 7 Operating and geographic segment information for a description of Hydro's management model and segments, including a description of Hydro's segment measures and accounting principles used for segment reporting. The following tables include information about Hydro's operating segments, including a reconciliation of EBITDA to EBIT for Hydro's operating segments.
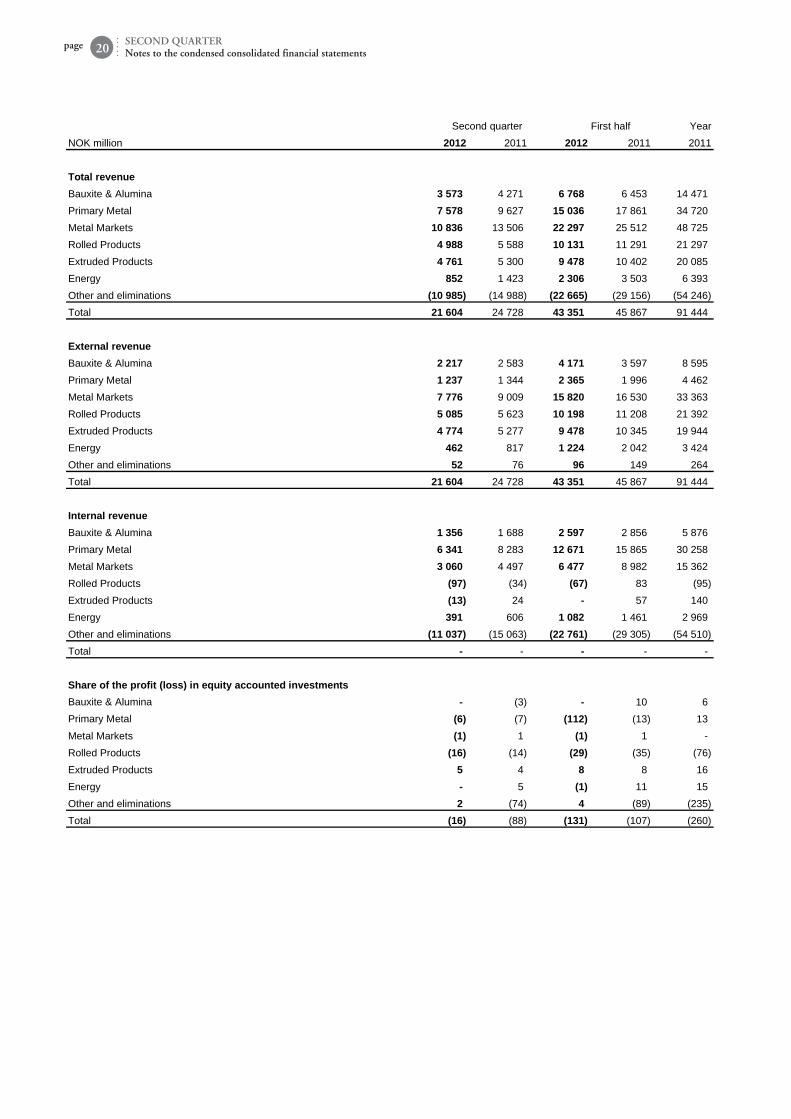
Second quarter First half YearNOK million 2012 2011 2012 2011 2011
Total revenueBauxite & Alumina 3 573 4 271 6 768 6 453 14 471Primary Metal 7 578 9 627 15 036 17 861 34 720Metal Markets 10 836 13 506 22 297 25 512 48 725Rolled Products 4 988 5 588 10 131 11 291 21 297Extruded Products 4 761 5 300 9 478 10 402 20 085Energy 852 1 423 2 306 3 503 6 393Other and eliminations (10 985) (14 988) (22 665) (29 156) (54 246)Total 21 604 24 728 43 351 45 867 91 444
External revenueBauxite & Alumina 2 217 2 583 4 171 3 597 8 595Primary Metal 1 237 1 344 2 365 1 996 4 462Metal Markets 7 776 9 009 15 820 16 530 33 363Rolled Products 5 085 5 623 10 198 11 208 21 392Extruded Products 4 774 5 277 9 478 10 345 19 944Energy 462 817 1 224 2 042 3 424Other and eliminations 52 76 96 149 264Total 21 604 24 728 43 351 45 867 91 444
Internal revenueBauxite & Alumina 1 356 1 688 2 597 2 856 5 876Primary Metal 6 341 8 283 12 671 15 865 30 258Metal Markets 3 060 4 497 6 477 8 982 15 362Rolled Products (97) (34) (67) 83 (95)Extruded Products (13) 24 57 140Energy 391 606 1 082 1 461 2 969Other and eliminations (11 037) (15 063) (22 761) (29 305) (54 510)Total
Share of the profit (loss) in equity accounted investmentsBauxite & Alumina (3) 10 6Primary Metal (6) (7) (112) (13) 13Metal Markets (1) 1 (1) 1 Rolled Products (16) (14) (29) (35) (76)Extruded Products 5 4 8 8 16Energy 5 (1) 11 15Other and eliminations 2 (74) 4 (89) (235)Total (16) (88) (131) (107) (260)
page SECOND QUARTERNotes to the condensed consolidated financial statements20
Second quarter First half YearNOK million 2012 2011 2012 2011 2011
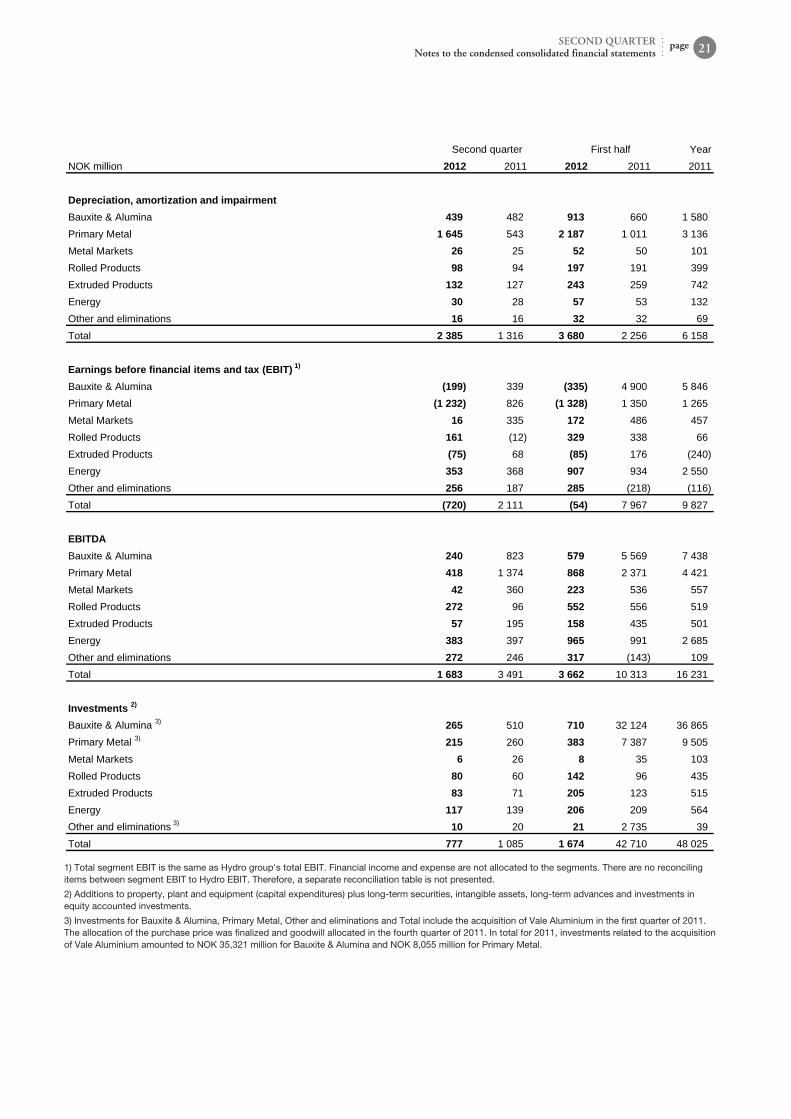
Depreciation, amortization and impairmentBauxite & Alumina 439 482 913 660 1 580Primary Metal 1 645 543 2 187 1 011 3 136Metal Markets 26 25 52 50 101Rolled Products 98 94 197 191 399Extruded Products 132 127 243 259 742Energy 30 28 57 53 132Other and eliminations 16 16 32 32 69Total 2 385 1 316 3 680 2 256 6 158
Earnings before financial items and tax (EBIT) 1)
Bauxite & Alumina (199) 339 (335) 4 900 5 846Primary Metal (1 232) 826 (1 328) 1 350 1 265Metal Markets 16 335 172 486 457Rolled Products 161 (12) 329 338 66Extruded Products (75) 68 (85) 176 (240)Energy 353 368 907 934 2 550Other and eliminations 256 187 285 (218) (116)Total (720) 2 111 (54) 7 967 9 827
EBITDABauxite & Alumina 240 823 579 5 569 7 438Primary Metal 418 1 374 868 2 371 4 421Metal Markets 42 360 223 536 557Rolled Products 272 96 552 556 519Extruded Products 57 195 158 435 501Energy 383 397 965 991 2 685Other and eliminations 272 246 317 (143) 109Total 1 683 3 491 3 662 10 313 16 231
Investments 2)
Bauxite & Alumina 3) 265 510 710 32 124 36 865Primary Metal 3) 215 260 383 7 387 9 505Metal Markets 6 26 8 35 103Rolled Products 80 60 142 96 435Extruded Products 83 71 205 123 515Energy 117 139 206 209 564Other and eliminations 3) 10 20 21 2 735 39Total 777 1 085 1 674 42 710 48 025
1) Total segment EBIT is the same as Hydro group's total EBIT. Financial income and expense are not allocated to the segments. There are no reconciling items between segment EBIT to Hydro EBIT. Therefore, a separate reconciliation table is not presented.
2) Additions to property, plant and equipment (capital expenditures) plus long-term securities, intangible assets, long-term advances and investments in equity accounted investments.
3) Investments for Bauxite & Alumina, Primary Metal, Other and eliminations and Total include the acquisition of Vale Aluminium in the first quarter of 2011. The allocation of the purchase price was finalized and goodwill allocated in the fourth quarter of 2011. In total for 2011, investments related to the acquisition of Vale Aluminium amounted to NOK 35,321 million for Bauxite & Alumina and NOK 8,055 million for Primary Metal.
pageSECOND QUARTERNotes to the condensed consolidated financial statements 21
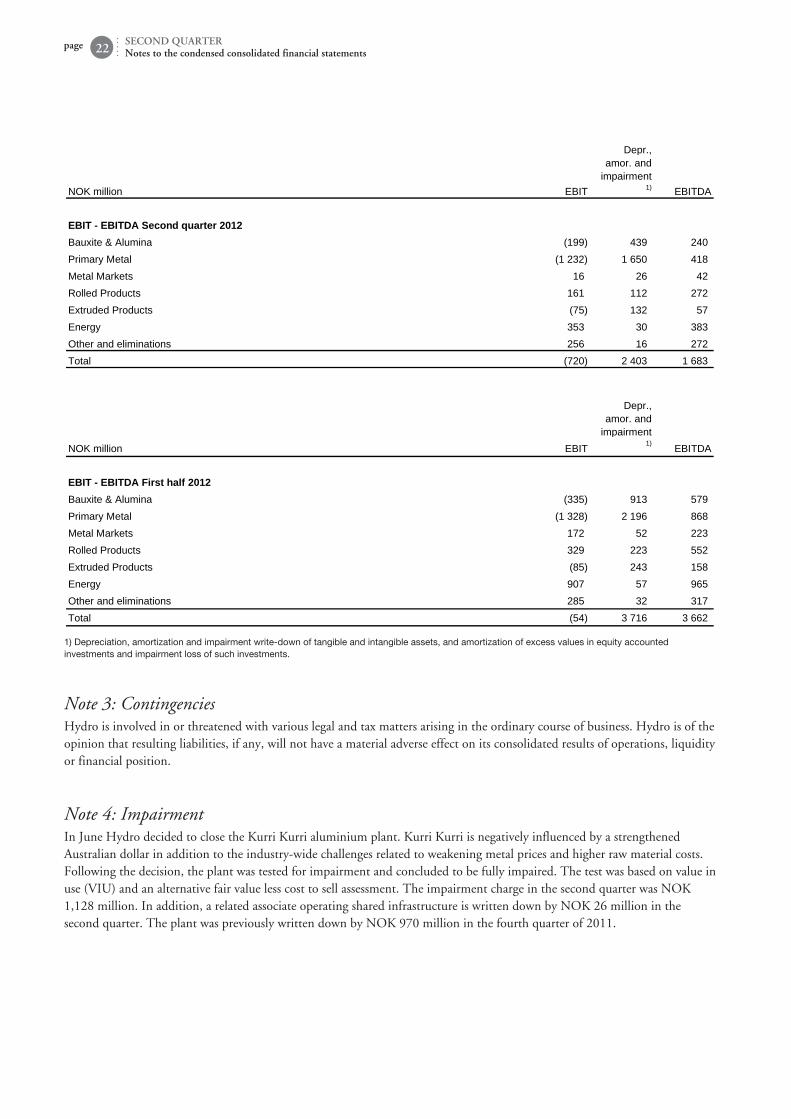
NOK million EBIT
Depr.,amor. and
impairment1) EBITDA
EBIT EBITDA Second quarter 2012Bauxite & Alumina (199) 439 240Primary Metal (1 232) 1 650 418Metal Markets 16 26 42Rolled Products 161 112 272Extruded Products (75) 132 57Energy 353 30 383Other and eliminations 256 16 272Total (720) 2 403 1 683
NOK million EBIT
Depr.,amor. and
impairment1) EBITDA
EBIT EBITDA First half 2012Bauxite & Alumina (335) 913 579Primary Metal (1 328) 2 196 868Metal Markets 172 52 223Rolled Products 329 223 552Extruded Products (85) 243 158Energy 907 57 965Other and eliminations 285 32 317Total (54) 3 716 3 662
1) Depreciation, amortization and impairment write-down of tangible and intangible assets, and amortization of excess values in equity accounted investments and impairment loss of such investments.
page SECOND QUARTERNotes to the condensed consolidated financial statements22
Note 3: ContingenciesHydro is involved in or threatened with various legal and tax matters arising in the ordinary course of business. Hydro is of the opinion that resulting liabilities, if any, will not have a material adverse effect on its consolidated results of operations, liquidity or financial position.
Note 4: ImpairmentIn June Hydro decided to close the Kurri Kurri aluminium plant. Kurri Kurri is negatively influenced by a strengthened Australian dollar in addition to the industry-wide challenges related to weakening metal prices and higher raw material costs. Following the decision, the plant was tested for impairment and concluded to be fully impaired. The test was based on value in use (VIU) and an alternative fair value less cost to sell assessment. The impairment charge in the second quarter was NOK 1,128 million. In addition, a related associate operating shared infrastructure is written down by NOK 26 million in the second quarter. The plant was previously written down by NOK 970 million in the fourth quarter of 2011.
Responsibility statementWe confirm to the best of our knowledge that the condensed set of financial statements for the period January 1 to June 30, 2012 has been prepared in accordance with IAS 34 - Interim Financial Reporting, and gives a true and fair view of the Hydro Group's assets, liabilities, financial position and result for the period. We also confirm to the best of our knowledge that the financial review includes a fair review of important events that have occurred during the first six months of the financial year and their impact on the financial statements, any major related parties transactions, and a description of the principal risks and uncertainties for the remaining six months of the financial year. Oslo, July 23, 2012
Terje Vareberg Chair
Finn JebsenBoard member
Sten Roar Martinsen Board member
Tito Martins Board member
Bente Rathe Deputy chair
Inge K. Hansen Board member
Liv Monica Bargem Stubholt Board member
Dag Mejdell Board member
Billy FredagsvikBoard member
Ove Ellefsen Board member
Eva PerssonBoard member
Svein Richard BrandtzægPresident and CEO
pageSECOND QUARTERResponsibility statement 23
Additional information
page SECOND QUARTERAdditional information24
Financial calendar 2012
23 October Third quarter results
29 November Capital Markets Day
Hydro reserves the right to revise these dates.
Cautionary note Certain statements included within this announcement contain forward-looking information, including, without limitation, those relating to (a) forecasts, projections and estimates, (b) statements of management's plans, objectives and strategies for Hydro, such as planned expansions, investments or other projects, (c) targeted production volumes and costs, capacities or rates, start-up costs, cost reductions and profit objectives, (d) various expectations about future developments in Hydro's markets, particularly prices, supply and demand and competition, (e) results of operations, (f) margins, (g) growth rates, (h) risk management, as well as (i) statements preceded by "expected", "scheduled", "targeted", "planned", "proposed", "intended" or similar statements.
Although we believe that the expectations reflected in such forward-looking statements are reasonable, these forward-looking statements are based on a number of assumptions and forecasts that, by their nature, involve risk and uncertainty. Various factors could cause our actual results to differ materially from those projected in a forward-looking statement or affect the extent to which a particular projection is realized. Factors that could cause these differences include, but are not limited to: our continued ability to reposition and restructure our upstream and downstream aluminium business; changes in availability and cost of energy and raw materials; global supply and demand for aluminium and aluminium products; world economic growth, including rates of inflation and industrial production; changes in the relative value of currencies and the value of commodity contracts; trends in Hydro's key markets and competition; and legislative, regulatory and political factors.
No assurance can be given that such expectations will prove to have been correct. Hydro disclaims any obligation to update or revise any forward-looking statements, whether as a result of new information, future events or otherwise.

Hydro is a global supplier of aluminium with activities throughout the value chain, from bauxite extraction to the production of rolled and extruded aluminium products and building systems. Based in Norway, the company employs 22,000 people in more than 40 countries. Rooted in a century of experience in renewable energy production, technology development and progressive partnerships, Hydro is committed to strengthening the viability of the customers and communities we serve.
Norsk Hydro ASANO-0240 Oslo Norway
Tel: +47 22 53 81 00 Fax: +47 22 53 85 53 www.hydro.com
Production: HydroPrint: Printbox© Hydro 2012