secondary school strategy managers november 26 th & 29 th 2007
TRANSCRIPT

Secondary School Strategy Managers
November 26th & 29th 2007
Objectives
• To review 2007 KS3 and GCSE results • To know the English, mathematics,
science and ICT priorities up to end of March 08
• Improving teaching and learning • Intervention • Inclusion Development Programme• To outline the 2008-2009 Standards
Fund
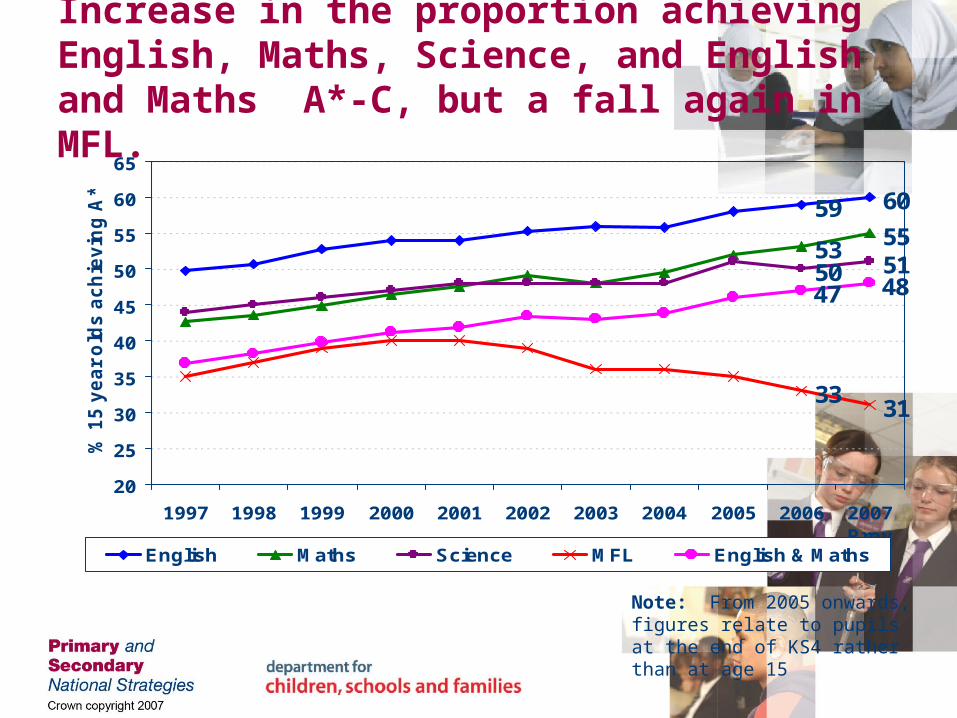
Increase in the proportion achieving English, Maths, Science, and English and Maths A*-C, but a fall again in MFL.
6059
53555150
3133
4847
20
25
30
35
40
45
50
55
60
65
1997 1998 1999 2000 2001 2002 2003 2004 2005 2006 2007Prov
% 1
5 y
ea
r o
lds
ac
hie
vin
g A
*-C
English Maths Science MFL English & Maths
Note: From 2005 onwards, figures relate to pupils at the end of KS4 rather than at age 15
45.146.3
47.949.2 50.0
51.652.9 53.7
56.3
45.7
60.058.5
60.3
45.344.3
42.641.942.140.740.0
38.637.0
35.6
34
38
42
46
50
54
58
62
1997 1998 1999 2000 2001 2002 2003 2004 2005 2006 2007 2008
% 1
5 ye
ar o
lds
ach
ievi
ng
5+
A*-
C
5+ A*-C 5+ A*-C incl Eng & Maths
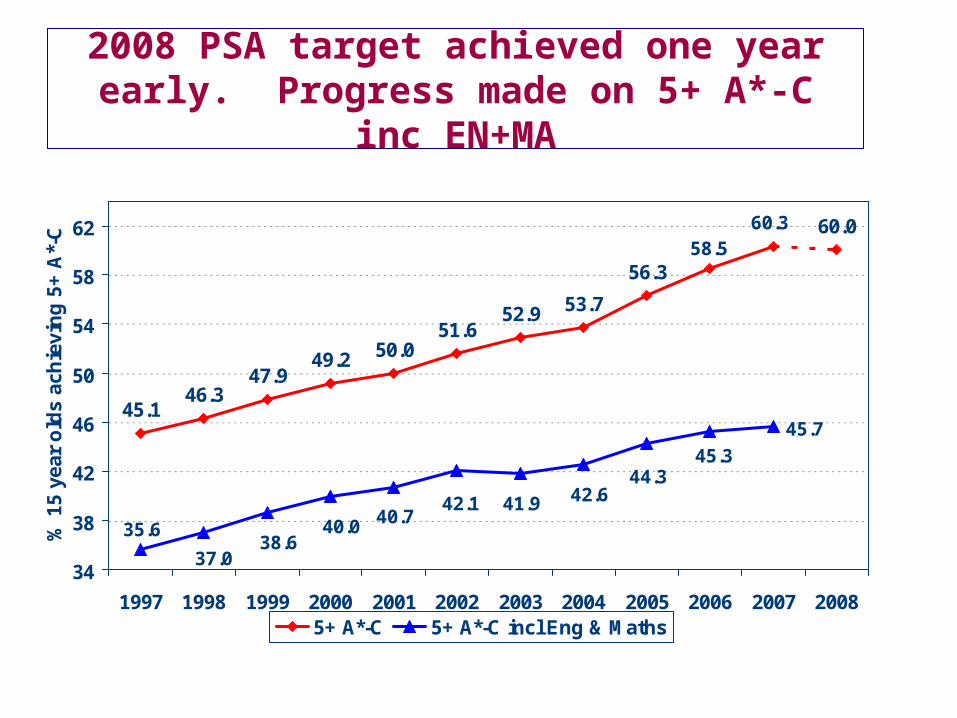
2008 PSA target achieved one year early. Progress made on 5+ A*-C inc
EN+MA
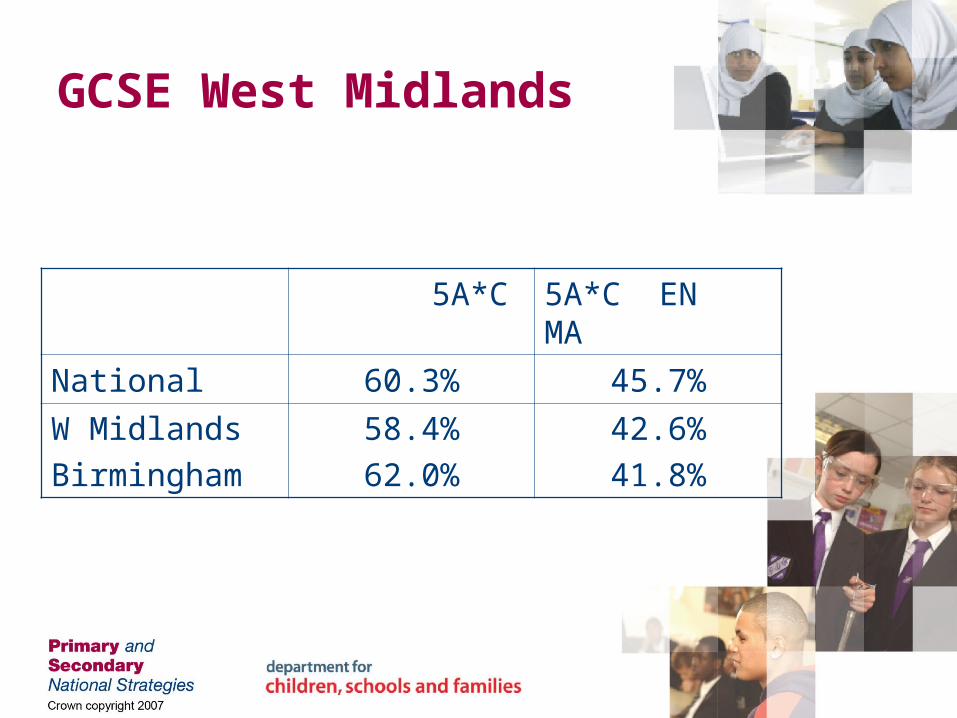
GCSE West Midlands
5A*C 5A*C EN MA
National 60.3% 45.7%
W MidlandsBirmingham
58.4%62.0%
42.6%41.8%
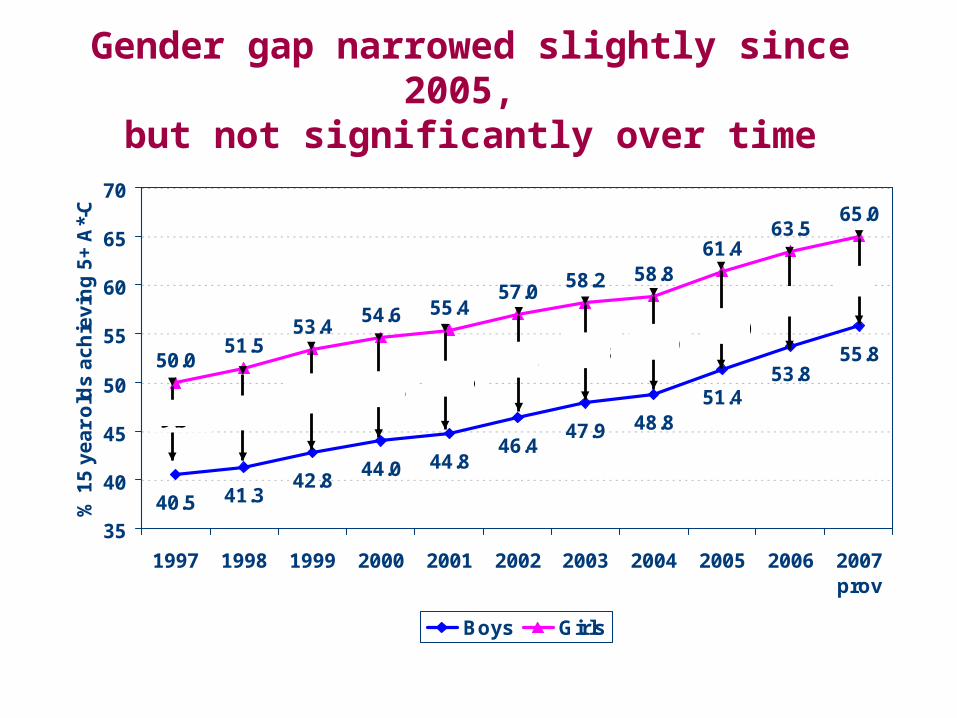
40.5 41.342.8
44.0 44.846.4
47.9
51.453.8
55.850.051.5
53.454.6 55.4
57.058.2 58.8
61.463.5
48.8
65.0
35
40
45
50
55
60
65
70
1997 1998 1999 2000 2001 2002 2003 2004 2005 2006 2007prov
% 1
5 y
ea
r o
lds
ac
hie
vin
g 5
+ A
*-C
Boys Girls
9.5 10.210.6 10.6 10.6
10.6 10.3 10.010.0
9.79.2
Gender gap narrowed slightly since 2005,
but not significantly over time

32.233.4
35.036.3 36.7
38.3 38.040.2 41.0 41.2
39.240.7
42.543.8
44.846.0 45.9 46.8
48.649.8
38.7
50.3
25
30
35
40
45
50
55
1997 1998 1999 2000 2001 2002 2003 2004 2005 2006 2007prov
% 1
5 ye
ar o
lds
achi
evin
g 5+
A*-
C in
clud
ing
Eng
lish
and
mat
hs
Boys Girls
7.07.3
7.57.5 8.1
7.7 7.98.1
8.40
8.8 9.1
Signs of the gender gap widening for 5+ A*-C including English and
mathematics
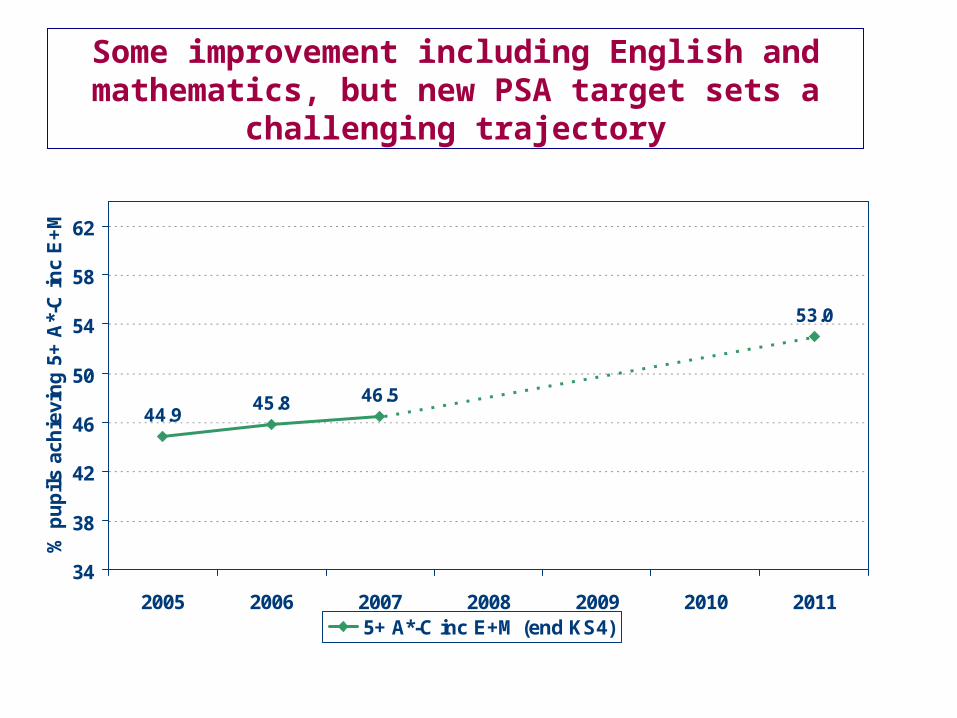
44.945.8 46.5
53.0
34
38
42
46
50
54
58
62
2005 2006 2007 2008 2009 2010 2011
% p
up
ils
ach
ievi
ng
5+
A*-
C i
nc
E+
M
5+ A*-C inc E+M (end KS4)
Some improvement including English and mathematics, but new PSA target sets a
challenging trajectory
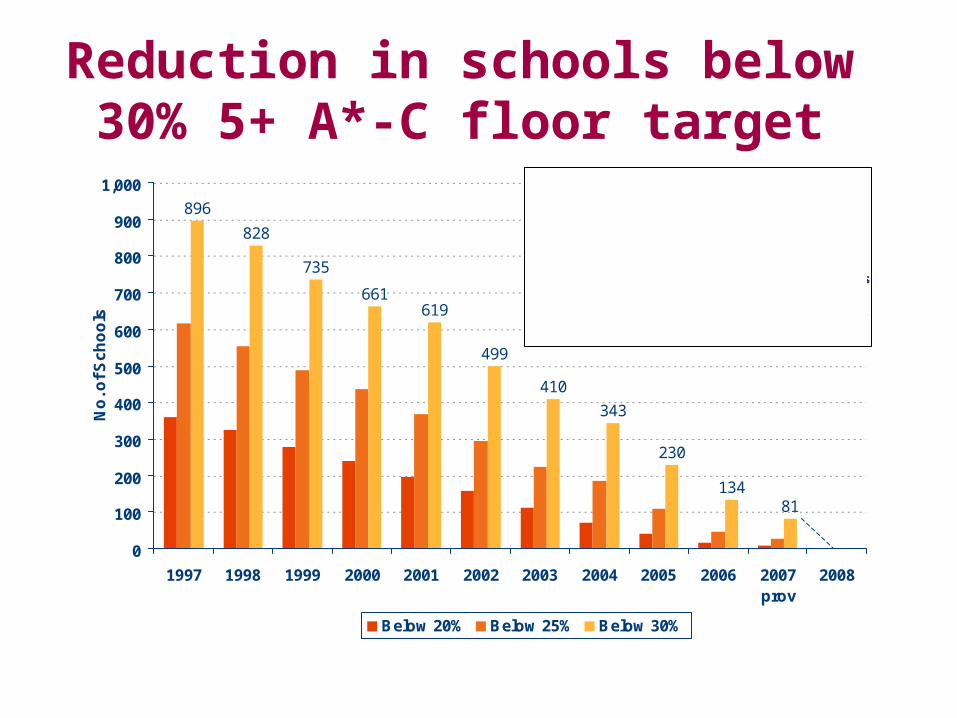
Reduction in schools below30% 5+ A*-C floor target
896
828
735
661619
499
410
343
230
13481
0
100
200
300
400
500
600
700
800
900
1,000
1997 1998 1999 2000 2001 2002 2003 2004 2005 2006 2007prov
2008
No
. of
Sc
ho
ols
Below 20% Below 25% Below 30%
2007<30% 81<25% 26<20% 8
We expect these numbers to fall further when schools have checked their data and revised figures are
published in the Achievement and Attainment Tables in January 2008
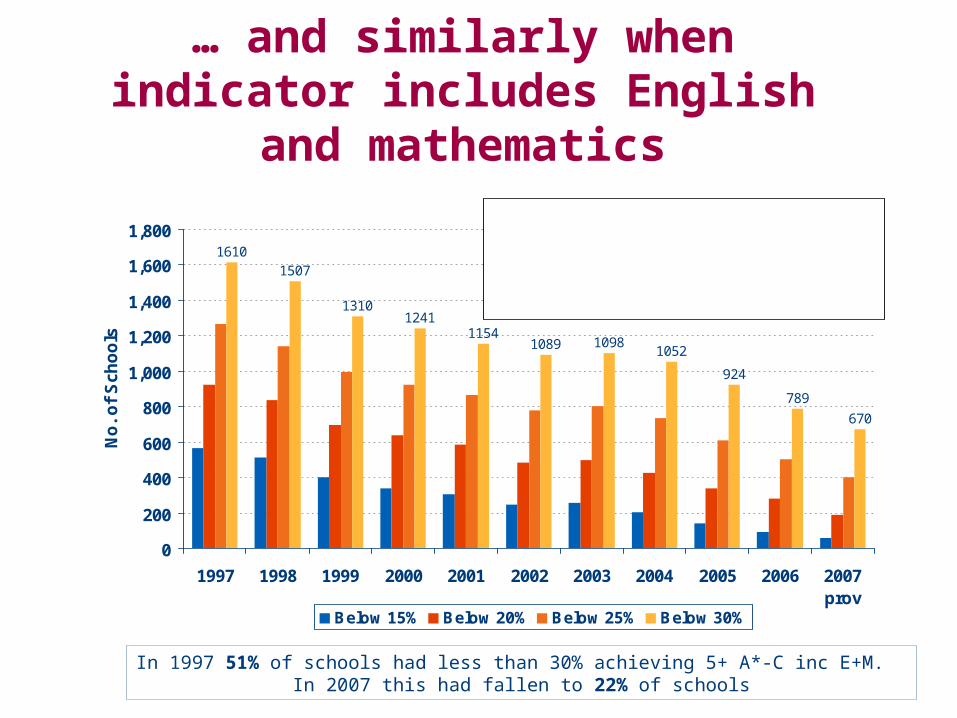
… and similarly when indicator includes English and
mathematics
16101507
13101241
11541089 1098
1052
924
789
670
0
200
400
600
800
1,000
1,200
1,400
1,600
1,800
1997 1998 1999 2000 2001 2002 2003 2004 2005 2006 2007prov
No
. o
f S
cho
ols
Below 15% Below 20% Below 25% Below 30%
2007<30% 670<25% 402<20% 187<15% 58
We expect numbers to fall further when schools have checked their data and revised figures are published in AAT in January 2008
In 1997 51% of schools had less than 30% achieving 5+ A*-C inc E+M. In 2007 this had fallen to 22% of schools
71
.6%
61
.9%
56
.4%
49
.9%
46
.8%
44
.1%
46
.7%
72
.3%
63
.6%
58
.5%
52
.4%
49
.7%
45
.7%
49
.2%
30%
40%
50%
60%
70%
80%
<=5% 5-9% 9-13% 13-21% 21-35% 35-50% 50%+
School FSM Band
Pro
p o
f P
up
ils A
ch
iev
ing
5+
A*-
C
2006 2007
Low deprivation High deprivation
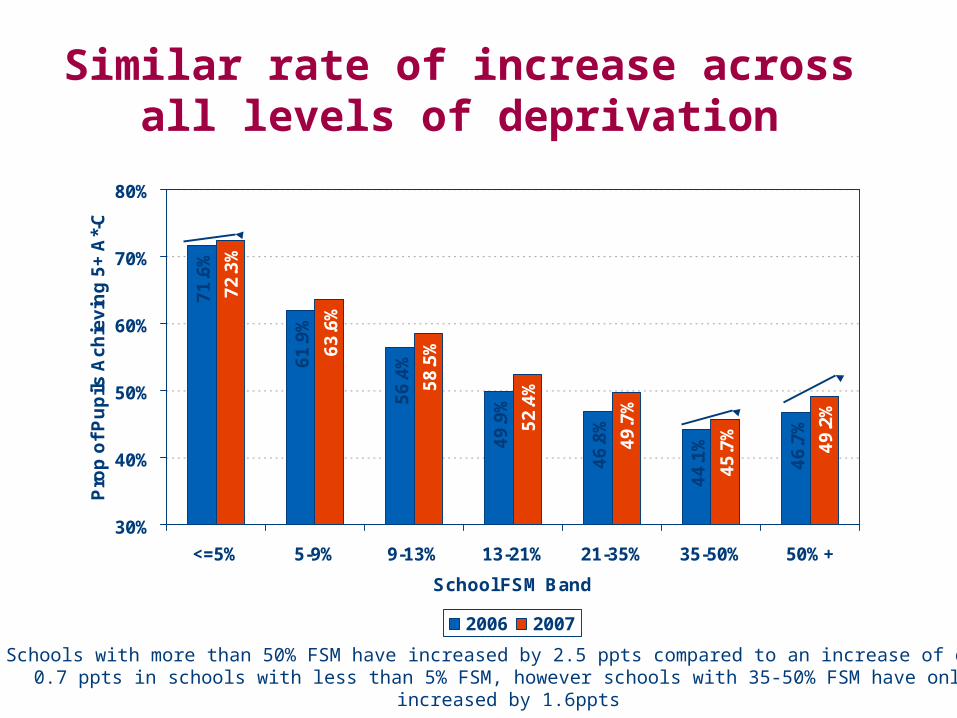
Similar rate of increase across all levels of deprivation
Schools with more than 50% FSM have increased by 2.5 ppts compared to an increase of only 0.7 ppts in schools with less than 5% FSM, however schools with 35-50% FSM have only
increased by 1.6ppts
60
.1%
49
.4%
42
.4%
35
.0%
30
.4%
25
.3%
27
.6%
61
.4%
50
.8%
43
.9%
36
.6%
32
.0%
26
.8%
29
.0%
20%
25%
30%
35%
40%
45%
50%
55%
60%
65%
70%
<=5% 5-9% 9-13% 13-21% 21-35% 35-50% 50%+
School FSM Band
Pro
p o
f P
up
ils A
ch
iev
ing
5+
A*-
C in
c
E+
M
2006 2007
Low deprivation High deprivation
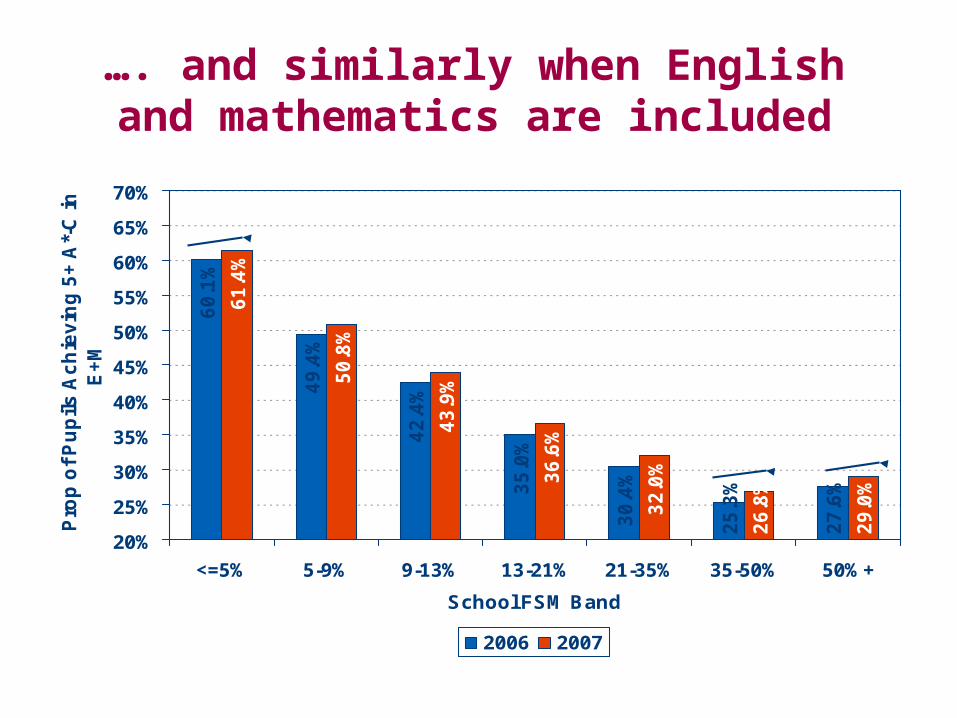
…. and similarly when English and mathematics are included
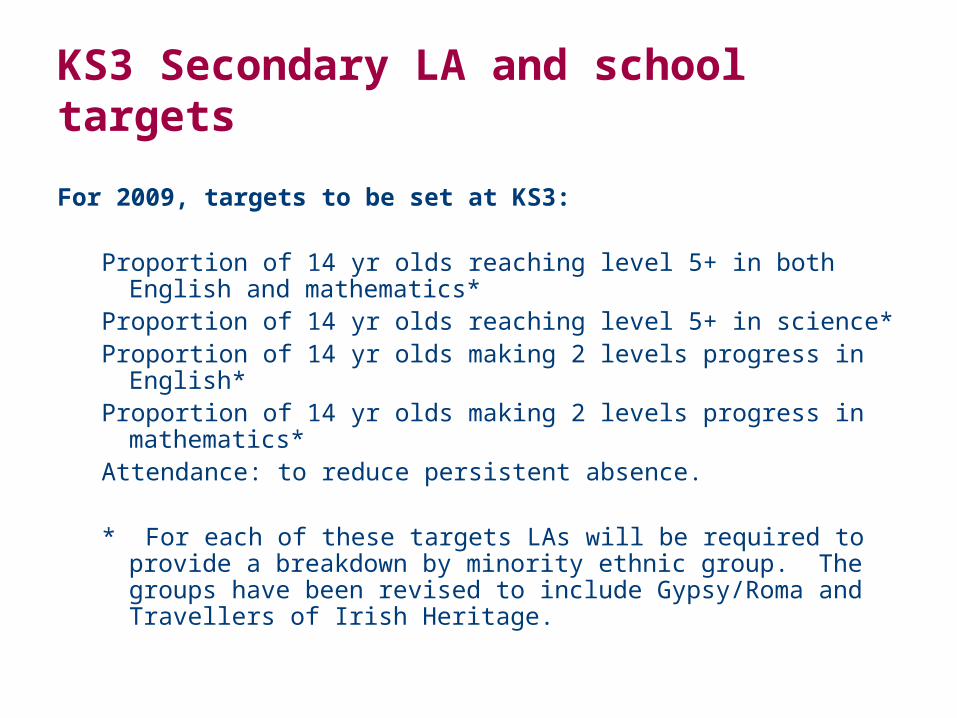
KS3 Secondary LA and school targets
For 2009, targets to be set at KS3:
Proportion of 14 yr olds reaching level 5+ in both English and mathematics*
Proportion of 14 yr olds reaching level 5+ in science*Proportion of 14 yr olds making 2 levels progress in English* Proportion of 14 yr olds making 2 levels progress in
mathematics*Attendance: to reduce persistent absence.
* For each of these targets LAs will be required to provide a breakdown by minority ethnic group. The groups have been revised to include Gypsy/Roma and Travellers of Irish Heritage.
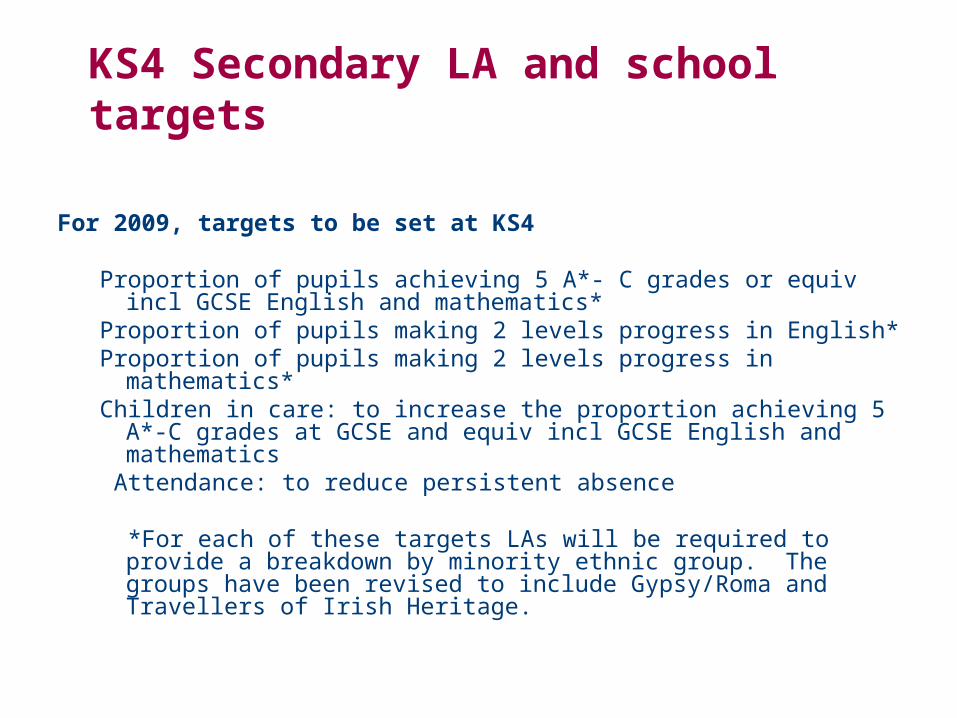
KS4 Secondary LA and school targets
For 2009, targets to be set at KS4
Proportion of pupils achieving 5 A*- C grades or equiv incl GCSE English and mathematics*
Proportion of pupils making 2 levels progress in English* Proportion of pupils making 2 levels progress in
mathematics*Children in care: to increase the proportion achieving 5 A*-C
grades at GCSE and equiv incl GCSE English and mathematics
Attendance: to reduce persistent absence
*For each of these targets LAs will be required to provide a breakdown by minority ethnic group. The groups have been revised to include Gypsy/Roma and Travellers of Irish Heritage.
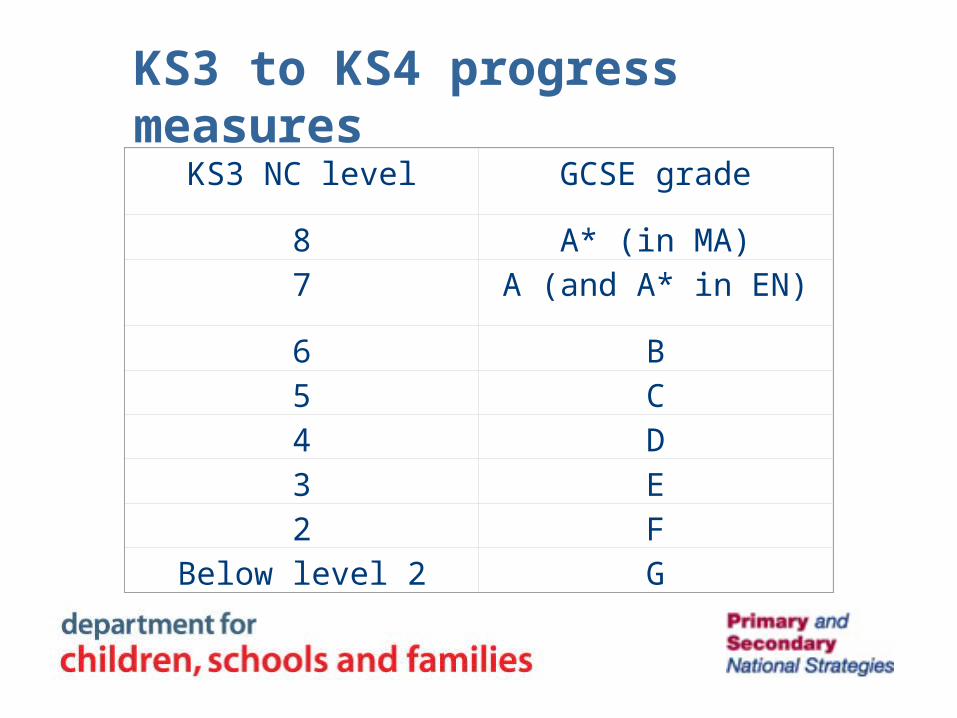
KS3 to KS4 progress measures
KS3 NC level GCSE grade
8 A* (in MA)7 A (and A* in EN)
6 B5 C4 D3 E2 F
Below level 2 G
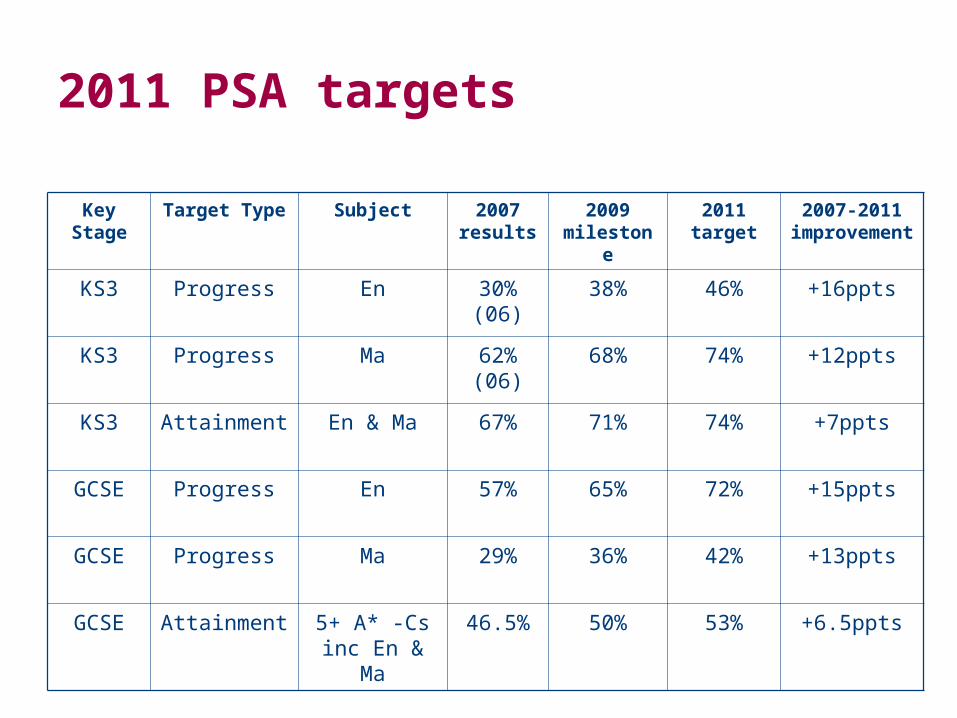
2011 PSA targets
Key Stage
Target Type Subject 2007 results
2009mileston
e
2011 target
2007-2011 improveme
nt
KS3 Progress En 30% (06)
38% 46% +16ppts
KS3 Progress Ma 62% (06)
68% 74% +12ppts
KS3 Attainment En & Ma 67% 71% 74% +7ppts
GCSE Progress En 57% 65% 72% +15ppts
GCSE Progress Ma 29% 36% 42% +13ppts
GCSE Attainment 5+ A* -Cs inc En & Ma
46.5% 50% 53% +6.5ppts
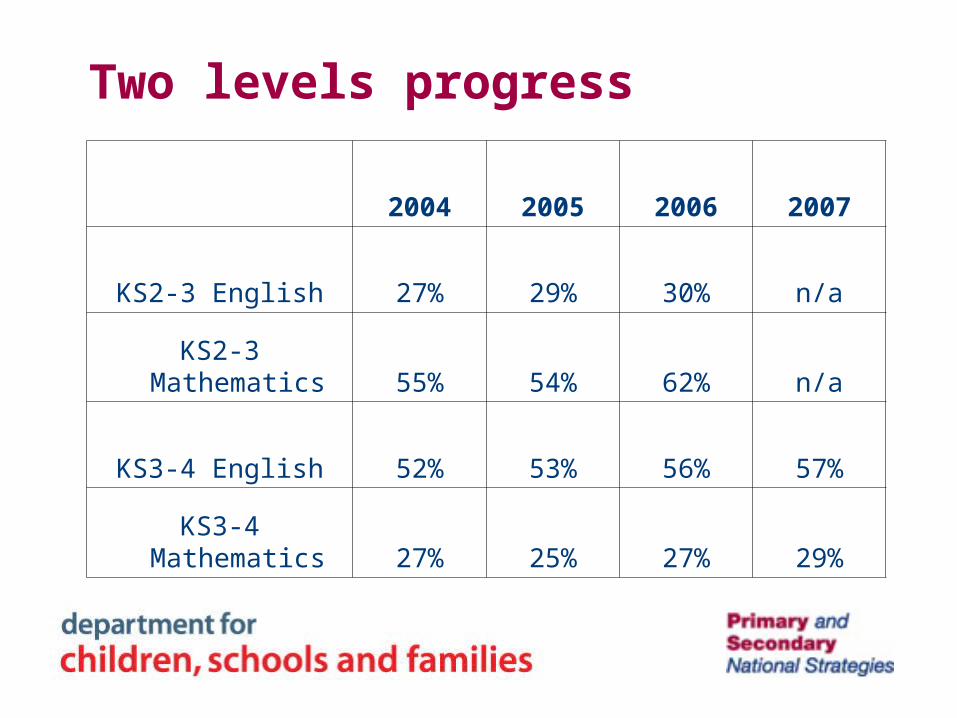
Two levels progress
2004 2005 2006 2007
KS2-3 English 27% 29% 30% n/a
KS2-3 Mathematics 55% 54% 62% n/a
KS3-4 English 52% 53% 56% 57%
KS3-4 Mathematics 27% 25% 27% 29%
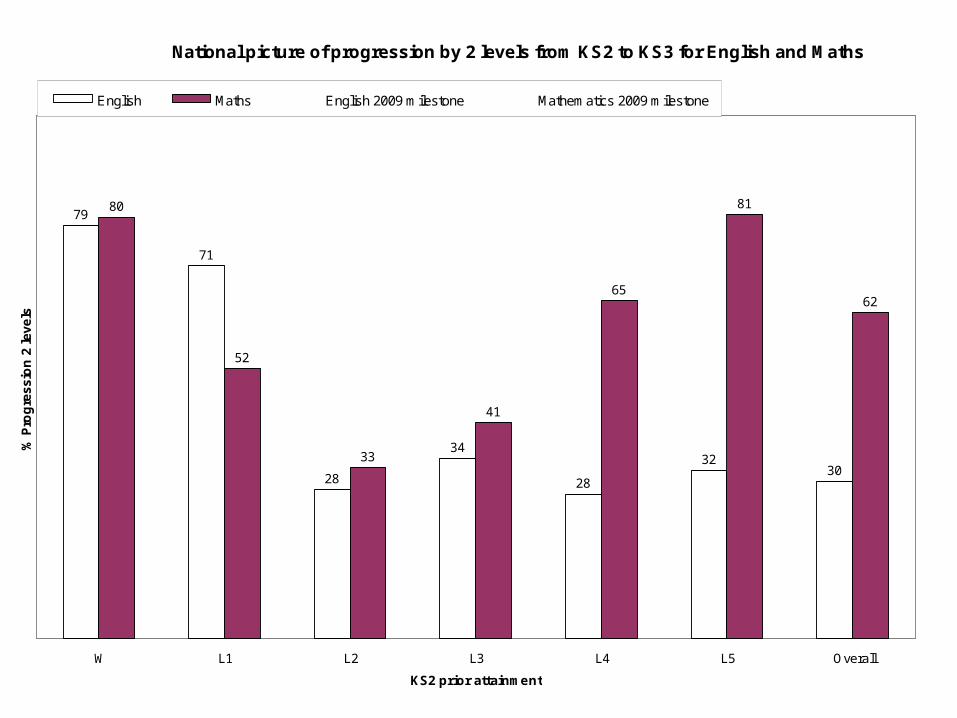
National picture of progression by 2 levels from KS2 to KS3 for English and Maths
79
71
28
34
28
3230
80
52
33
41
65
81
62
W L1 L2 L3 L4 L5 Overall
KS2 prior attainment
% P
rog
res
sio
n 2
le
ve
ls
English Maths English 2009 milestone Mathematics 2009 milestone
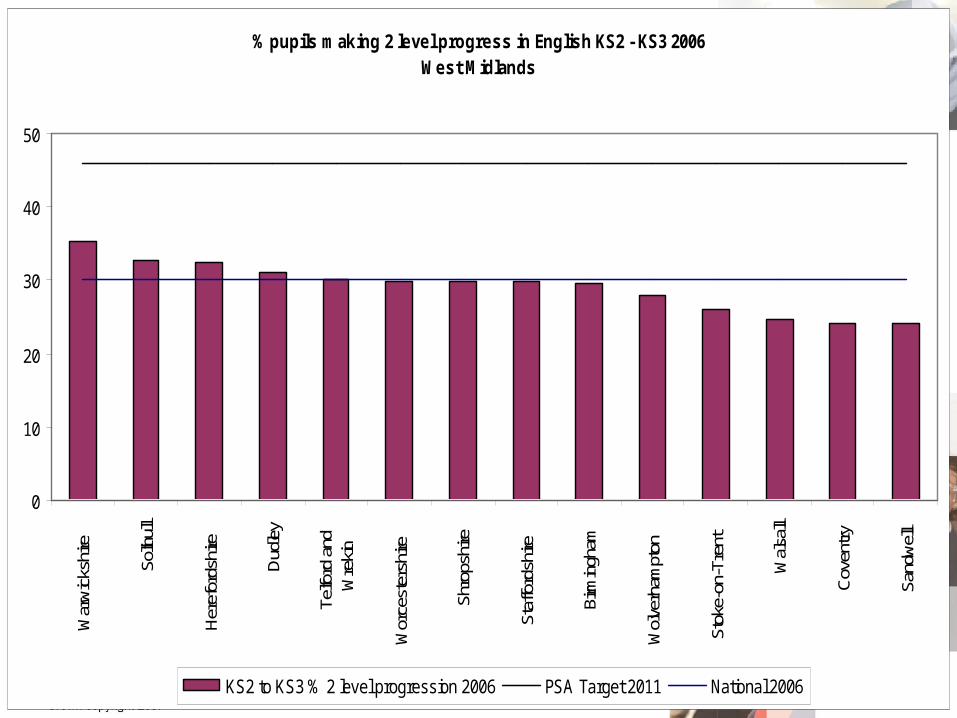
% pupils making 2 level progress in English KS2 - KS3 2006West Midlands
0
10
20
30
40
50
War
wic
kshi
re
Solih
ull
Her
efor
dshi
re
Dud
ley
Telfo
rd a
ndW
reki
n
Wor
cest
ersh
ire
Shro
pshi
re
Staf
ford
shire
Birm
ingh
am
Wol
verh
ampt
on
Stok
e-on
-Tre
nt
Wal
sall
Cov
entry
Sand
wel
l
KS2 to KS3 % 2 level progression 2006 PSA Target 2011 National 2006

% pupils making 2 level progress in Maths KS2 - KS3 2006West Midlands
0
10
20
30
40
50
60
70
80
War
wic
kshi
re
Sol
ihul
l
Her
efor
dshi
re
Dud
ley
Tel
ford
and
Wre
kin
Wor
cest
ersh
ire
Shr
opsh
ire
Sta
fford
shire
Birm
ingh
am
Wol
verh
ampt
on
Sto
ke-o
n-T
rent
Wal
sall
Cov
entr
y
San
dwel
l
KS2 to KS3 % 2 level progression 2006 PSA Target 2011 National 2006

National Picture of progression by 2 levels from KS3 to KS4 for English and Maths
3438
46
58
6770
0
58
30
24
1517
24
28
39
56
28
42
Below L2 L2 L3 L4 L5 L6 L7 L8 Overall
KS3 prior attainment
% P
rog
res
sio
n 2
lev
els
English Maths English 2009 milestone Mathematics 2009 milestone

% pupils making 2 level progress in English KS3 - KS4 2006West Midlands
0
10
20
30
40
50
60
70
80
Sol
ihul
l
War
wic
kshi
re
Wor
cest
ersh
ire
Shr
opsh
ire
Sta
fford
shire
Her
efor
dshi
re
Birm
ingh
am
Dud
ley
Cov
entr
y
Wol
verh
ampt
on
Tel
ford
and
Wre
kin
Wal
sall
San
dwel
l
Sto
ke-o
n-T
rent
KS2 to KS3 % 2 level progressoin 2006 PSA Target 2011 National 2007
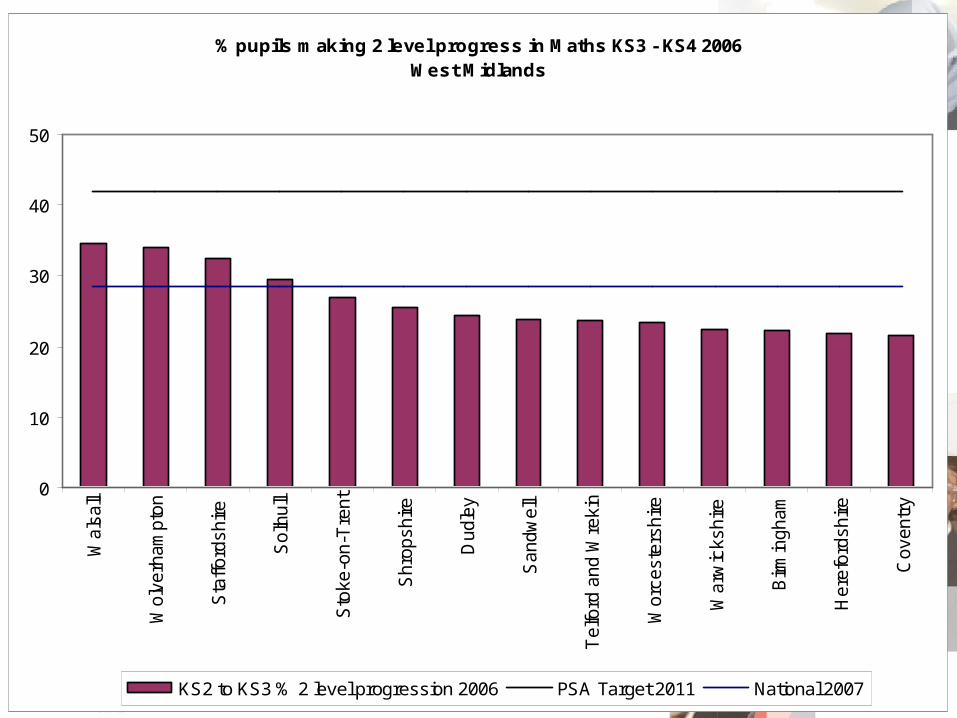
% pupils making 2 level progress in Maths KS3 - KS4 2006West Midlands
0
10
20
30
40
50
Wals
all
Wolv
erh
am
pto
n
Sta
fford
shire
Solih
ull
Sto
ke-o
n-T
rent
Shro
pshire
Dudle
y
Sandw
ell
Telfo
rd a
nd W
rekin
Worc
este
rshire
Warw
ickshire
Birm
ingham
Here
ford
shire
Coventr
y
KS2 to KS3 % 2 level progression 2006 PSA Target 2011 National 2007
English, mathematics, ICT and science priorities
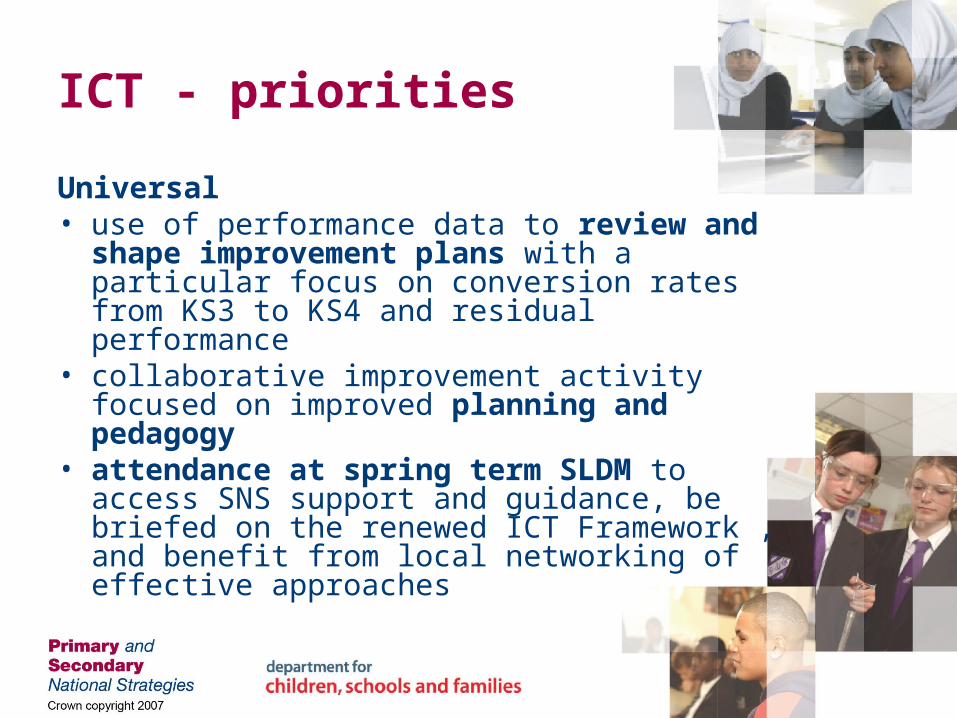
ICT - priorities
Universal• use of performance data to review and
shape improvement plans with a particular focus on conversion rates from KS3 to KS4 and residual performance
• collaborative improvement activity focused on improved planning and pedagogy
• attendance at spring term SLDM to access SNS support and guidance, be briefed on the renewed ICT Framework , and benefit from local networking of effective approaches
ICT - priorities
TARGETED:• sharply focused, regularly evaluated
consultant support agreements• Training and support for functional
skills pilot centres• Improved schemes of work, teaching,
learning and coursework for new key stage 4 qualifications
Science quiz
• What do these terms mean? • SIIF • STEM • HSW • Triple science • Level 6+ entitlement
• What counts for reporting 2 GCSE sciences?
Science priorities – universal
1. Supporting appropriate wave 1, 2 & 3 intervention through:
• use of data (including using RAISEonline and test analysis ) and AfL strategies to target underperforming groups throughout year 7 – 11;
• use of data to devise curriculum targets which are used in teaching;
• explicit teaching of scientific enquiry/How Science Works to improve progression between KS3 and 4.
2. Attendance at spring term SLDM to access SNS support and guidance, be briefed on the renewed Science Framework, to enable effective dissemination of key messages to science staff.
Science priorities – targeted
Use data analysis and consultancy support to make appropriate targeted intervention in schools to:
• improve teachers’ use of the teaching and learning approaches to address the weakness and misconceptions shown in the 2007 national test and GCSEs;
• strengthen subject leader skills in monitoring and planning for intervention of underperforming groups.

SIIF priorities – targeted
• For pilot LAs to increase level 6+ attainment and GCSE A*-B by trialling and evaluating materials in schools on: • improving teachers’ knowledge and use of
progression strategies through and between KS3 and KS4;
• improving teachers’ knowledge and use of effective interactive teaching including practical work.
• LAs contributing to collection of case studies of effective practice to support progression to post 16 sciences

Supporting Intervention
The Inclusion Development Programme
National Strategies SEN Plan 2007-8
To improve the progress and attainmentof pupils at risk of underperforming.
Common priorities for all cross phase inclusion programmes:
• Mainstreaming
• LA alignment
• Focus on school improvement and capacity building
• Leading practice – leading teachers
• Three waves of intervention
Key Aims of IDP
• Improve outcomes for pupils and narrow gaps
• Promote early recognition and intervention
• Increase the confidence of all practitioners
• Support schools and settings to become more effective at strategic approaches to support and intervention

IDP: areas of focus
• Speech, Language and CommunicationDyslexia
• Autistic Spectrum Disorders (ASD)
• Behavioural, Emotional and Social Difficulties (BESD)
Specific aims of the initial focus of the IDP
• Brief teachers and others in the workforce about early signs of:
DyslexiaOther Specific Learning Difficulties (SpLD)Speech Language and Communication Needs (SLCN)
• Provide information on teaching and learning strategies and approaches known to be effective

The Audience
• Mainstream practitioners in EYFS / schools and settings
• Mainstream primary teachers and TAs
• Mainstream secondary teachers and TAs
• Head Teachers and senior leadership teams
Resources
• Via web and interactive DVD • Resources for Primary and Secondary
are on the same DVD• Resources for ITT in March 2007
Regional support
• Network meetings
• Hub meetings

Standards Fund
• Improving delivery in core subjects• AfL• Targeted schools• Languages• SEAL (joint with primary phase)