security analysis coal india ltd
TRANSCRIPT

DEPARTMENT OF COMMERCE AND MANAGEMENT STUDIES
UNIVERSITY OF CALICUT
SECURITY ANALYSIS AND PORTFOLIO MANAGEMENT
ASSIGNMENT
ON
INVESTMENT MANAGEMENT
Submitted to Submitted
byDr. K .P Muraleedharan AKSHARA CV
Professor DHANYA KP
Department Of Commerce and Management Studies 3rd Sem M Com
University Of Calicut

INTRODUCTION
A method of evaluating a security that entails attempting to measure its intrinsic value
by examining related economic, financial and other qualitative and quantitative factors.
Fundamental analysts attempt to study everything that can affect the security's value,
including macroeconomic factors (like the overall economy and industry conditions) and
company-specific factors (like financial condition and management).
The end goal of performing fundamental analysis is to produce a value that an
investor can compare with the security's current price, with the aim of figuring out what sort
of position to take with that security (underpriced = buy, overpriced = sell or short).
Fundamental analysis is about using real data to evaluate a security's value. Although
most analysts use fundamental analysis to value stocks, this method of valuation can be used
for just about any type of security. Fundamental analysts believe that a firm's
(1) competitive advantage,
(2) earnings growth,
(3) sales revenue growth,
(4) market share,
(5) financial reserves, and
(6) quality of management all reflected in its financial statements and
together called 'fundamental information' are the true indicators of its earning potential
and future value of its securities. In contrast, proponents of technical analysis focus on the
past and present movements in the market price of a security to estimate its future value.
Security analysis is the analysis of tradable financial instruments called securities. These can
be classified into debt securities, equities, or some hybrid of the two. More broadly, futures
contracts and tradable credit derivatives are sometimes included. Security analysis is typically
divided into fundamental, which relies upon the examination of fundamental business factors
such as financial statements, and technical analysis, which focuses upon price trends and
momentum. Quantitative analysis may use indicators from both areas.
SECURITY ANALYSIS
The analysis of various tradable financial instruments is called security analys is.
Security analysis helps a financial expert or a security analyst to determine the value of assets
in a portfolio. It is a method which helps to calculate the value of various assets and also find
out the effect of various market fluctuations on the value of tradable financial instruments (also
called securities).. Security analysis is the basis for rational investment decisions.
If a security’s estimated value is above its market price, the security analyst will
recommend buying the stock. If the estimated value is below the market price, the security
should be sold before its price drops. However, the values of the securities are continuous ly
changing as news about the securities becomes known. The search for the security pricing
involves the use of fundamental analysis.
CLASSIFICATION OF SECURITY ANALYSIS
Security Analysis is broadly classified into three categories:
1. Fundamental Analysis
2. Technical Analysis
3. Quantitative Analysis
FUNDAMENTAL ANALYSIS
Fundamental Analysis refers to the evaluation of securities with the help of certain
fundamental business factors such as financial statements, current interest rates as well as
competitor’s products and financial market.
Under fundamental analysis, the security analysts studies the fundamental facts
affecting a stock’s values, such as company’s earnings, their management, the economic
outlook, the firm’s competition, market conditions etc. Fundamental analysis is primarily
concerned with determining the intrinsic value or the true value of a security. For determining
the security’s intrinsic value the details of all major factors (GNP, industry sales, firm sales and
expense etc) is collected or an estimates of earnings per share may be multiplied by a justified
or normal prices earnings ratio. After making this determination, the intrinsic value is compared
with the security’s current market price. If the market price is substantially greater than the
intrinsic value the security is said to be overpriced. If the market price is substantia lly less than

the intrinsic value, the security is said to be under priced. However, fundamental analysis
comprises:
1. Economic Analysis
2. Industry Analysis
3. Company Analysis
FUNDAMENTAL ANALYSIS
ECONOMIC ANALYSIS INDUSTRY ANALYSIS COMPANY ANALYSIS
ECONOMIC ANALYSIS
For the security analyst or investor, the anticipated economic environment, and
therefore the economic forecast, is important for making decisions concerning both the timings
of an investment and the relative investment desirability among the various industries in the
economy. The key for the analyst is that overall economic activities manifest itself in the
behaviour of the stocks in general. That is, the success of the economy will ultimately include
the success of the overall market. For studying the Economic Analysis, the Macro Economic
Factors and the Forecasting Techniques are studied in following paragraphs.
Mining in India is a major economic activity which contributes significantly to the
economy of India. The GDP contribution of the mining industry varies from 2.2% to 2.5%
only but going by the GDP of the total industrial sector it contributes around 10% to 11%.
Coal with a proven reserve of 860 billion tonnes is mined the most in the world. At the same
time, the demand curve for this sector is always on the rising side. The major reasons are the
soaring power demand in India and China, the growing worldwide steel production, and
lastly, the increasingly stringent environment regulations.
As a prospering economy, India faces energy security as a growing challenge and the
coal production is expected to grow at a CAGR of around 7% during 2011-12 to 2013-14.
The Indian coal market is set to witness great boost in near future because of the rising
government initiatives. Recently, allocation of coal blocks and stake sales in PSU are some of

the major steps that were taken by the government to boost the production and investment in
the coal industry.
However, the upward pressure would definitely widen the demand supply mismatch
in the coming years. To address these concerns, Indian conglomerates are making efforts in
overseas acquisitions as well. In addition, it is also exploring un-conventional alternatives
such as Coal Gasification for supply of energy. Varied coal gasificat ion technologies are
revolving over the globe to replace the conventional power generation methods.
MACRO ECONOMIC FACTORS
The macro economy is the study of all the firms operates in economic environment.
The key variables to describe the state of economy are explained as below:
Growth rate of Gross Domestic Product (GDP), Savings and investment, Industry Growth rate,
The tax structure, Balance of payment, forex reserves and exchange rate…
ECONOMIC FORECASTING TECHNIQUES
To estimate the stock price changes, an analyst has to analyze the macro economic
environment. All the economic activities affect the corporate profits, investor’s attitudes and
share price. For the purpose of economic analysis and in order to decide the right time to invest
in securities some techniques are used. These are:
Anticipatory Surveys, Barometric or Indicator approach, Leading series, Diffusion Indexes,
Money and Stock Prices, Econometric Model Building, Opportunistic Model Building.
INDUSTRY ANALYSIS
The mediocre firm in the growth industry usually out performs the best stocks in a
stagnant industry. Therefore, it is worthwhile for a security analyst to pinpoint growth industry,
which has good investment prospects. The past performance of an industry is not a good
predictor of the future- if one look very far into the future. Therefore, it is important to study
industry analysis. For an industry analyst- industry life cycle analysis, characteristics and
classification of industry is important.
Indian Mining Industry
India is endowed with significant mineral resources. India produces 89 minerals out
of which 4 are fuel minerals, 11 metallic, 52 non-metallic and 22 minor minerals. In India, 80%
of mining is in coal and the balance 20% is in various metals and other raw materials such as
gold, copper, iron, lead, bauxite, zinc and uranium. India with diverse and significant minera l
resources is the leading producer of some of the minerals.
The total value of mineral production was Rs. 568070 million in 2000-2001, of which
the value of minerals other than petroleum and natural gas was Rs. 306751 million. The
metallic production is accounted for by iron-ore, copper-ore, chromite and/or zinc concentrates,
gold, manganese ore, bauxite, lead concentrates. Amongst the non-metallic minerals, more than
90 percent of the aggregate value is shared by limestone, magnesite, dolomite, barytes, kaolin,
gypsum, apatite & phosphorite, steatite and fluorite.
India is the world's largest producer of mica blocks and mica splittings. With the recent
spurt in world demand for chromite, India has stepped up its production to reach the third rank
among the chromite producers of the world. Besides, India ranks 3rd in production of coal &
lignite and barytes, 4th in iron ore, 6th in bauxite and manganese ore, 10 in aluminium and
11 th in crude steel in the World.
Over 1.1 million people are employed in the Indian mining industry. With over 2,326
private and 292 public operating mines in the country, minerals form 16 percent of India's
exports.
Coal Mining
The majority of the energy requirement in India is met by coal, largely mined in the
eastern and the central regions of the country. In 2004-05, the total coal production in the
country was around 350 million MT and majority of it catered to the core sectors of power,
steel and cement. Inspite of various policy initiatives to diversify the fuel mix, it is becoming
increasingly evident that coal will continue to play the major role in sustaining the growth
momentum of India. Based on estimates, the consumption of coal is projected to rise by nearly
40 percent over the next five years and almost to double by 2020. However, in the recent past,
the coal sector in the country has come under pressure over its inability to meet demand (both
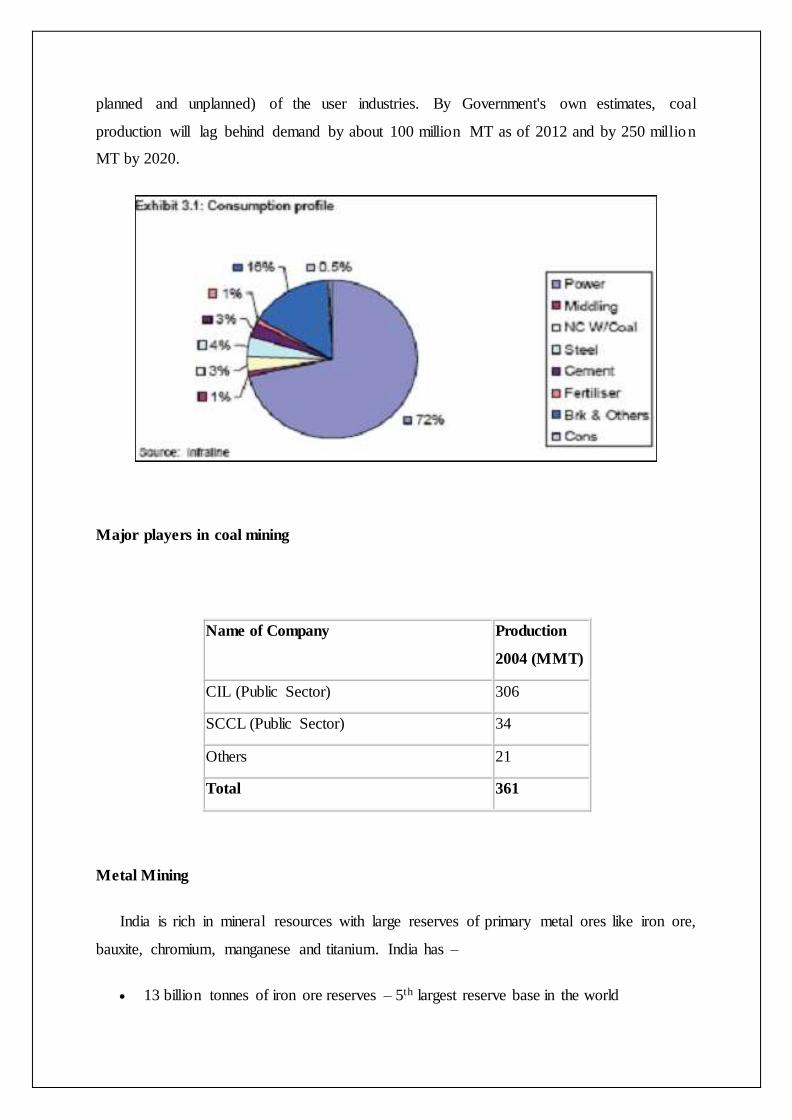
planned and unplanned) of the user industries. By Government's own estimates, coal
production will lag behind demand by about 100 million MT as of 2012 and by 250 million
MT by 2020.
Major players in coal mining
Name of Company Production
2004 (MMT)
CIL (Public Sector) 306
SCCL (Public Sector) 34
Others 21
Total 361
Metal Mining
India is rich in mineral resources with large reserves of primary metal ores like iron ore,
bauxite, chromium, manganese and titanium. India has –
13 billion tonnes of iron ore reserves – 5th largest reserve base in the world

2.3 billion tonnes of bauxite reserves – 4th largest reserve base in the world
160 million tonnes of manganese reserves – 2nd largest reserve base in the world
57 million tonnes of chromium reserves – 3rd largest reserve base in the world
Indian deposits of bauxite and iron ore are among the best in the world in terms of quality
and mineability
CONTRIBUTION OF THE PUBLIC SECTOR
The public sector contributes over 85 percent of the total value of minera l
production. However, it is the avowed policy of the Government to withdraw from the non-
strategic sectors and accordingly the public sector undertakings are being privatised in a phased
manner.
Public sector enterprises like the National Mineral Development Corporation,
Kudremukh Iron Ore company, Steel Authority of India Limited and Orissa Mining
Corporation dominate the iron ore sector.
National Aluminium Company contributes about 35% bauxite mining and aluminium
production. Hindustan Copper Limited predominates the copper ore mining sector.
After cessation of economic operations in Bharat Gold Mines Limited since 2000,
Hutti Gold Mines Limited (a Government of Karnataka undertaking), is the only undertaking
engaged in the mining of gold. Rajasthan State Mines and Minerals Limited and Andhra
Pradesh Mining Development Corporation predominate the mining of rock phosphate and
barytes respectively.
Coal Mining is predominantly a public sector activity - Coal India Ltd. (CIL) accounts
for 85% of total coal production
Role of the Government
The Mines and Minerals (Development and Regulation) Act, 1957, (MMDR) and the
Mines Act, 1952, together with the rules and regulations under them constitute the basic laws
governing the mining sector. Further, the Government has formulated the National Mineral
Policy, which was revised in 1994 to permit private investment in exploration and exploitat ion
of 13 specified minerals.
In 1999, the foreign investment policy has been further liberalized to promote Foreign
Direct Investment (FDI) in the mining sector:
* For exploration and mining of diamonds and precious stones, FDI upto 74 percent is
permitted under automatic route.
* For exploration and mining of gold and silver and minerals other than diamonds and
precious stones, FDI is allowed upto 100 percent under automatic route.
* For metallurgy and processing, FDI is permitted upto 100 percent under automatic route.
* Private Indian Companies setting up/operating power projects as well as coal and lignite
mines for captive consumption are allowed FDI upto 100 percent.
* 100 percent FDI is allowed for setting up coal processing plants subject to the condition
that the company shall not do coal mining and shall not sell washed coal or sized coal from
its coal processing plants in the open market and shall supply the washed or sized coal to
those parties who are supplying raw coal to coal processing plants for washing or sizing.
* For FDI proposals not meeting the above mentioned guidelines, approval will be given by
the Foreign Investment Promotion Board keeping in mind parameters such as project size,
commitment of external resources for funding project costs, the company's mining track
record and financial strength, level of technology and the India's Partner Equity holding
SWOT Analysis of Indian Mining Industry
Strengths:
* The government offers a wide range of concessions to investors in India, engaged in mining
activity. The main concessions include, inter alia:
* Mining in specified backward districts is eligible for a complete tax holiday for a period of
5 years from commencement of production and a 30 percent tax holiday for 5 years
thereafter.

* Environment protection equipment, pollution control equipment, energy saving equipment
and certain other equipment eligible for 100 percent depreciation.
* One tenth of the expenditure on prospecting or extracting or production of certain minerals
during five years ending with the first year of commercial production is allowed as a
deduction from the total income.
* Export profits from specified minerals and ores are eligible for certain concessions under
the Income tax Act.
* Minerals in their finished form exempt from excise duty.
* Low customs duty on capital equipment used for minerals; on nickel, tin, pig iron,
unwrought aluminium.
* Capital goods imported for mining under EPCG scheme qualify for concessional customs
duty subject to certain export obligation.
2. World's largest producer of mica; third largest producer of coal and lignite & barytes; ranks
among the top producers of iron ore, bauxite, manganese ore and aluminium.
3. Labours easily available
4. Low labour and conversion cost.
5. Large quantity of high quality reserves
6. Exports iron-ore to China and Japan on a large scale
7. Strategic location : Proximity to the developed European markets and fast-developing
Asian markets for export of Steel, Aluminium.

Weakness:
Coal mining in India is associated with poor employee productivity. The output per
miner per annum in India varies from 150 to 2,650 tonnes compared to an average of
around 12,000 tonnes in the U.S. and Australia; and
Historically, opencast mining has been favored over underground mining. This has led
to land degradation, environmental pollution and reduced quality of coal as it tends to
get mixed with other matter;
India has still not been able to develop a comprehensive solution to deal with the fly
ash generated at coal power stations through use of Indian coal. Clean coal
technologies, such as Integrated Gasification Combined Cycle, where the coal is
converted to gas, are available, but these are expensive and need modification to suit
Indian coal specifications.
Poor infrastructure facilities
Mining technology is outdated
Low innovation capabilities
Labor force is highly un-skilled and inexperienced
High rate of accidents
Lack of R&D programs and training and development
Most of the Indian mining companies do not have access to Indian capital market
There is a lack of respect for the mining industry and it suffers from the incorrect
perception that ore deposits are depleted.
There is limited access to capital, and mines are increasingly more costly to find,
acquire, develop and produce.
There are long lead times on production decisions.
The Indian mining industry suffers from an out-dated, unattractive approach to mining
education that is partly to blame for insufficient human resources.
Improvement in operational efficiency of the mining companies - Mining
companies are in need of an organizational transformation to gradually align its
operating costs to international standards. Mining costs of Indian companies are at least
35 percent higher than those of leading coal exporting countries such as Australia,
Indonesia, and South Africa. To match productivity, they will need to invest in ne w
technologies, improve processes in planning and execution of projects, and
institutionalize a comprehensive risk management framework.

Mining operations are not environment friendly. Least importance is given to
environment concerns.
High rate of illegal mining
The Opportunities
India has an estimated 85 billion tonnes of mineral reserves remaining to be exploited.
Besides coal, oil and gas reserves, the mineral inventory in India includes 13,000 deposits/
prospects of 61 non-fuel minerals. Expenditure outlay on mining is a meager sum when
compared to other competing emerging mining markets and the investment gap is most likely
to be covered by the private sector. India welcomes joint ventures between foreign and
domestic partners to mobilise finances and technology and secure access to global markets.
Potential areas for exploration ventures include gold, diamond, copper, lead, zinc,
nickel, cobalt, molybdenum, lithium, tin, tungsten, silver, platinum group of metals and
other rare metals, chromite and manganese ore, and fertiliser minerals.
The main opportunities in the mining sector (excluding coal and industrial minera ls)
are in the development and production of surplus commodities such as iron ore and
bauxite, mica, potash, few low-grade ores, mining of small gold deposits, development
of placer gold resources located on the frontal belt of the Himalayas, mining known
deposits of economic and marginal categories such as base metals in Bihar and
Rajasthan and exploitation of laterite for nickels in Orissa, molybdenum in Tamil Nadu
and tin in Haryana.
Considerable potential exists for setting up manufacturing units for value added
products.
There exists considerable opportunities for future discoveries of sub-surface deposits
with the application of modern techniques.
Current economic mining practices are generally limited to depths of 300 meters and
25 percent of the reserves of the country are beyond this depth
Strengthening of logistics in coal distribution - In India, the logistics infrastruc ture
such as ports and railways are overburdened and costly and act as bottlenecks in
development of free market. Privatization of ports may bring the needed efficienc ies
and capacities. In addition, capacity addition by the Indian Railways is necessary to
increase freight capacity from the coal producing regions to demand centers in the

northern and central parts of the country. On the Indian rail network, freight trains get
a lower priority than passenger trains, a problem that promotes delays and inefficiency.
Special freight corridors would raise speeds, cut costs, and increase the system's
reliability.
Focusing on technology for future - India's numerous technology research institutes
are working on energy related R&D. However, there is a possibility that they are
operating in a fragmented fashion. The Government may get improved recoveries on
its investment by concentrating on few important technology areas. To start with focus
may be applied for tighter emission standards and development of inexpensive clean-
coal technologies viz. extraction of methane from coal deposits.
Estimated 82 billion tonnes of reserves of various metals yet to be tapped
While India has 7.5% of the world's total bauxite deposits, aluminium production
capacity is only 3% of world capacity, indicating the scope and need for new capacities
Threats:
Foreign Investment in the Mining Sector: During 1999, the Government had cleared
7 more proposals of leading international mining companies for prospecting and
exploration in the mineral sector to the tune of US$ 62.5 million. 65 licenses have been
issued till date for prospecting an area of around 90,142 sqkms in the states of
Rajasthan, Maharashtra, Gujarat, Bihar, Haryana and Madhya Pradesh. Prospecting
licenses have been granted in favour of Indian subsidiaries of well-known mining
companies. These include BHP Minerals, CRA Exploration supported by Rio Tinto
(RTZ-CRA), Phelps Dodge of USA, Metmin Finance and Holding supported by
Metdist Group of Companies UK, Meridien Minerals of Canada, RBW Mineral
Industries supported by White Tiger Resources of Australia, etc.
Large integrated international metal manufacturers including POSCO, Mittal Steel and
Alcan have announced plans for expansion in India
Mining companies and equipment suppliers are under the constant threat of being taken
over by foreign companies.
A heavy tax burden discourages further investment.
Politicians undervalue the industry's contributions to the economy.

COMPANY PROFILE-Coal India Limited
Founded in 1973, Coal India Ltd. (“CIL” or the “Company”), is a Government of
India (GOI) enterprise and the largest coal producer in the world based on raw coal
production and coal reserves. CIL’s total coal resources and reserves amount to 64.2 billion
tonnes and 18.9 billion tonnes respectively. The Company currently operates 471 mines in 21
major coalfields across 8 states in India, of which 163 are open cast mines, 273 are
underground mines and 35 are mixed mines.
Capital Structure Period Instrument CAPITAL (Rs.
cr)
P A I D U P
From To Authorised Issued Shares
(nos)
Face
Value
Capital
2012 2013 Equity Share 8000 6316.36 6316364400 10 6316.36
2011 2012 Equity Share 8000 6316.36 6316364400 10 6316.36
2010 2011 Equity Share 8000 6316.36 6316364400 10 6316.36
2009 2010 Equity Share 8000 6316.36 6316364400 10 6316.36
2008 2009 Equity Share 8000 6316.36 6316364400 10 6316.36
2007 2008 Equity Share 8000 6316.36 63163644 1000 6316.36
2006 2007 Equity Share 8000 6316.36 63163644 1000 6316.36
The Company carries out its coal production through eight subsidiaries - Eastern
Coalfields Ltd. (ECL), Bharat Coking Coal Ltd. (BCCL), Central Coalfields Ltd. (CCL),
Northern Coalfields Ltd. (NCL), Western Coalfields Ltd. (WCL), South Eastern Coalfields
Ltd. (SECL), Mahanadi Coalfields Ltd. (MCL), and North Eastern Coalfields (NEC).
For FY 2014, the Company’s total income from operations grew by 0.74 % to Rs.
68,810.02 Cr. as against Rs. 68,302.74 Cr. in FY 2013. For the same period, net profit went
down by 12.86 % to Rs. 15,111.63 Cr. as against Rs. 17,342.64 Cr. in FY 2013.I n order to
provide for a higher growth in coal sector to meet the growing energy needs of the country,
the Government in 1973, nationalized the coal mines by enacting the Coal Nationalization
Act. Pursuant to the nationalization of coal mines, our Company was incorporated as a
private limited company with the name of ‘Coal Mines Authority Limited’, under the
Companies Act on June 14, 1973, and in terms of notification no. G.S.R. 345(F) dated July 9,
1973, issued pursuant to the provisions of Section 5 of the Coal Nationalization Act certain
nationalized coal mines were vested in our Company by the Central Government. Thereafter
in 1975, Department of Coal, Ministry of Energy, GoI, with a view to integrate and
streamline the structural set up in a manner which could be conducive to a more efficient
administration, issued letter no. 38011/1/1/74-CAF dated September 27, 1975, providing for
the re-organisation of ‘Coal Mines Authority Limited’ as ‘Coal India Limited’, which was to
be responsible for the entire coal mining sector owned and controlled by the Central
Government. Further, to the above direction from the Ministry of Energy, Department of
Coal, the following steps were undertaken to re-organize our Company: (a) BCCL was made
a Subsidiary of our Company. (b) ‘National Coal Development Corporation’ was renamed as
‘Central Coalfields Limited’ and made a Subsidiary of our Company. Further, the central
division of our Company was transferred to CCL.
(c) CMPDIL was incorporated as a private limited company and made Subsidiary of our
Company. Further, the mine planning division of our Company was transferred to CMPDIL.
(d) ECL was incorporated as a private limited company and made a Subsidiary of our
Company. Further, the eastern division of our Company was transferred to ECL.
(e) WCL was incorporated as a private limited company and made a Subsidiary of our
Company. Further, the western division of our Company was transferred to WCL.
In compliance with the above direction from the Ministry of Energy, Department of Coal, and
pursuant to a resolution of our shareholders dated October 15, 1975 and approval of the
Ministry of Law, Justice and Company Affairs (letter no. RD/T/5226) dated October 21,
1975, the name of our Company was changed to ‘Coal India Limited’ and we received a fresh
certificate of incorporation dated October 21, 1975 from the RoC, consequent upon such
change of name. Pursuant to the nationalization of coal mines and during the period upto
1991, our Company was able to enhance the growth rate of coal production from a CAGR of
2.18% at the time of nationalisation in Fiscal 1974 to a CAGR of 5.63% by Fiscal 1991.
However during this period, due to certain macro-economic and socio economic factors, our
Company continued to operate certain legacy mines inherited pursuant to the nationalization
and to operate certain new projects irrespective of financial viability. Further, on account of
certain internal reasons and policy issues, our Company’s accumulated losses in Fiscal 1991
and overdue liabilities to the Government in Fiscal 1993, reached Rs. 24,989.80 million and

Rs. 23,113.10 million respectively. Thereafter, post 1991 upon our Company achieving
certain milestones and certain policy changes initiated by the Government our Company
endeavoured to consolidate its financial position.
MISSION OF COAL INDIA LTD
To produce and market the planned quantity of coal and coal products efficiently and
economically in an eco-friendly manner with due regard to safety, conservation and quality.
Care for the environment
One of the inherent tendencies of coal mining is degradation of the land and
environment. CIL constantly addresses the impact of mining activities across environmental
and social issues. Eco-friendly mining systems have been put in place in all of its mining
areas. To make environmental mitigation measures more transparent, CIL introduced state-
of-the-art Satellite Surveillance to monitor land reclamation and restoration for all opencast
projects.
Coal India has made afforestation over an area of around 32,000 Hectares while the
total forest area degraded due to mining operation is around 12,800 Hectares, which means,
for every hectare of forest land degraded, CIL has made plantation in 2.5 Hectares of land.
Committed to minimize the adverse impact of coal mining on environment through
well structured Environment Management Plans and sustainable development activities.
As a part of 'Clean & Green' programme, massive plantation has been taken up by
CIL wherever land is available. CIL has till date planted over 73 million trees.
A positive result of this effort towards improvement of environment through massive
plantation undertaken in Singrauli Coalfields since 1985, is such that the analysis for the
period 1985-1995 and 1996-2002 carried out by Conservator of Forest indicates that
the annual average maximum temperature in Singrauli has decreased by 0.4oC while the
annual average rainy days increased by 11.2 days and average annual rainfall has increased
by 105.6 mm.

CIL has started integration of Environment Management System (ISO:14001) with
Quality Management System (ISO:9001) and till date have successfully achieved certification
of 53 of its projects. This integration is being extended to all mines in phases.
COMPANY ANALYSIS
In the company analysis the investor assimilates the several bits of information related to
the company and evaluates the present and future values of the stock. Company analysis
divided into two
1) Financial analysis of the company
2) Non - Financial analysis of the company
FINANCIAL ANALYSIS OF THE COMPANY
Financial analysis is a best source of financial information of the company is its own
Financial statements. The financial statement analysis is the study of a company’s
financial statement from various viewpoints. The two main statements used in the
analysis are:
Balance sheet
Profit and loss account
Balance Sheet of Coal India
(in Rs. Cr)
Mar '14 Mar '13 Mar '12 Mar '11 Mar '10
12 mths 12 mths 12 mths 12 mths 12 mths
Sources Of Funds
Total Share Capital 6,316.36 6,316.36 6,316.36 6,316.36 6,316.36
Equity Share Capital 6,316.36 6,316.36 6,316.36 6,316.36 6,316.36
Share Application Money 0.00 0.00 0.00 0.00 0.00
Preference Share Capital 0.00 0.00 0.00 0.00 0.00
Reserves 10,128.88 14,199.80 13,248.39 11,499.65 10,744.36
Revaluation Reserves 0.00 0.00 0.00 0.00 0.00
Networth 16,445.24 20,516.16 19,564.75 17,816.01 17,060.72
Secured Loans 0.00 0.00 0.00 0.00 0.00
Unsecured Loans 0.00 914.39 1,173.54 1,187.98 1,464.30

Total Debt 0.00 914.39 1,173.54 1,187.98 1,464.30
Total Liabilities 16,445.24 21,430.55 20,738.29 19,003.99 18,525.02
Application Of Funds
Gross Block 360.78 356.66 356.07 347.23 376.63
Less: Accum. Depreciation 264.53 260.03 255.17 248.52 283.23
Net Block 96.25 96.63 100.90 98.71 93.40
Capital Work in Progress 203.73 121.89 73.41 55.72 17.84
Investments 9,648.94 9,026.07 6,541.19 6,319.17 6,316.57
Inventories 39.87 15.66 18.51 35.69 26.59
Sundry Debtors 15.11 1.48 0.01 0.00 0.00
Cash and Bank Balance 9,817.84 18,104.28 15,302.72 11,659.52 217.27
Total Current Assets 9,872.82 18,121.42 15,321.24 11,695.21 243.86
Loans and Advances 5,219.85 6,671.11 8,675.46 9,507.17 8,380.19
Fixed Deposits 0.00 0.00 0.00 0.00 8,916.10
Total CA, Loans & Advances 15,092.67 24,792.53 23,996.70 21,202.38 17,540.15
Deffered Credit 0.00 0.00 0.00 0.00 0.00
Current Liabilities 6,712.41 8,273.43 8,529.27 7,593.30 4,763.78
Provisions 1,883.94 4,333.14 1,444.64 1,078.69 679.14
Total CL & Provisions 8,596.35 12,606.57 9,973.91 8,671.99 5,442.92
Net Current Assets 6,496.32 12,185.96 14,022.79 12,530.39 12,097.23
Miscellaneous Expenses 0.00 0.00 0.00 0.00 0.00
Total Assets 16,445.24 21,430.55 20,738.29 19,003.99 18,525.04
Contingent Liabilities 4,319.05 2,112.74 2,306.44 1,790.28 164.74
Book Value (Rs) 26.04 32.48 30.97 28.21 27.01
.
Coal India Ltd Profit & Loss A/c for the year ended 31st Mar2014

Mar '14 Mar '13 Mar '12 Mar '11 Mar '10
Net Sales/Income from
operations 314.25 352.25 415.86 409.46 403.20
Other Operating Income -- -- -- -- --
Total Income From
Operations 314.25 352.25 415.86 409.46 403.20
EXPENDITURE
Consumption of Raw
Materials 12.36 11.61 9.68 10.03 --
Purchase of Traded Goods -- -- -- -- --
Increase/Decrease in Stocks -25.03 2.54 17.06 -8.54 -6.67
Power & Fuel 6.88 6.83 5.45 6.20 5.93
Employees Cost 355.00 334.18 309.04 251.11 243.06
Depreciation 6.41 4.96 6.96 6.08 8.99
Excise Duty -- -- -- -- --
Admin. And Selling Expenses -- -- -- -- --
R & D Expenses -- -- -- -- --
Provisions And Contingencies 40.29 19.74 6.82 80.68 37.36
Exp. Capitalised -- -- -- -- --
Other Expenses 329.18 346.72 197.87 209.18 173.13
P/L Before Other Inc. , Int.,
Excpt. Items & Tax -410.84 -374.33 -137.02 -145.28 -58.60
Other Income 16,089.85 11,088.01 9,101.71 5,072.50 3,946.95
P/L Before Int., Excpt. Items
& Tax 15,679.01 10,713.68 8,964.69 4,927.22 3,888.35
Interest 258.54 375.65 364.74 203.66 17.95
P/L Before Exceptional Items
& Tax 15,420.47 10,338.03 8,599.95 4,723.56 3,870.40
Exceptional Items -- -- -- -0.19 --
P/L Before Tax 15,420.47 10,338.03 8,599.95 4,723.37 3,870.40
Tax 411.93 543.71 534.85 27.27 200.00
P/L After Tax from Ordinary
Activities 15,008.54 9,794.32 8,065.10 4,696.10 3,670.40
Prior Year Adjustments -- -- -- -- 7.13
Extra Ordinary Items -- -- -- -- --
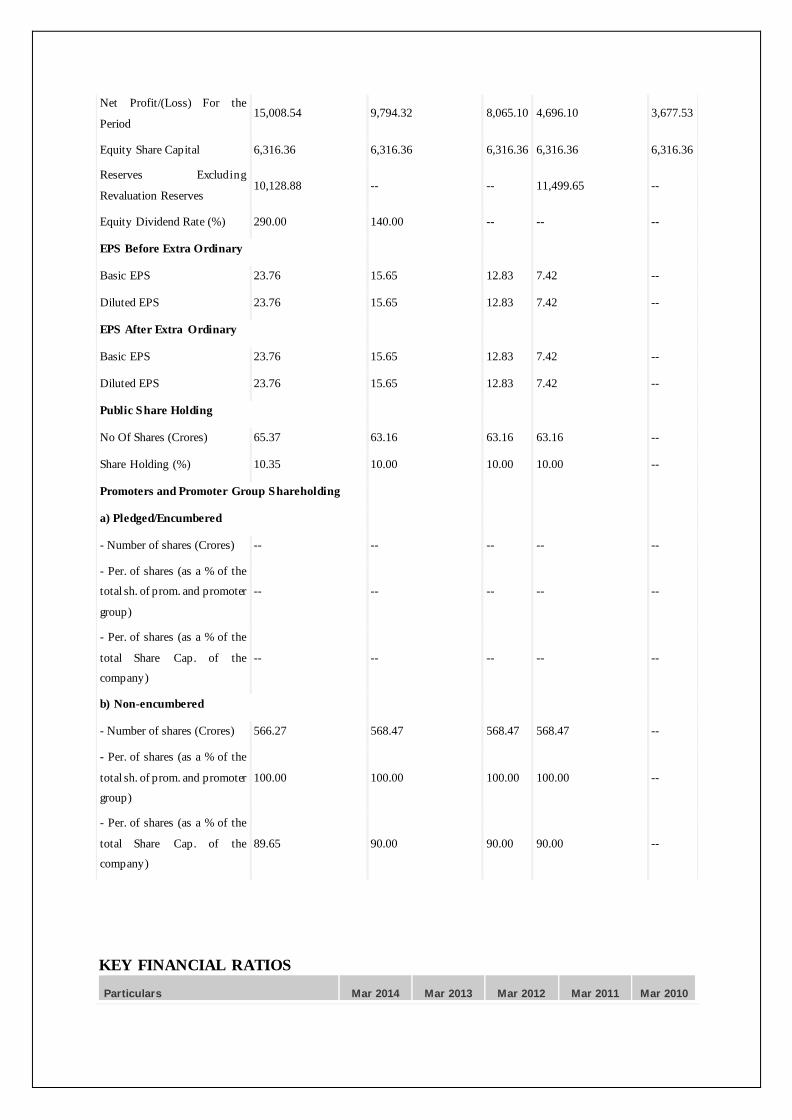
Net Profit/(Loss) For the
Period 15,008.54 9,794.32 8,065.10 4,696.10 3,677.53
Equity Share Capital 6,316.36 6,316.36 6,316.36 6,316.36 6,316.36
Reserves Excluding
Revaluation Reserves 10,128.88 -- -- 11,499.65 --
Equity Dividend Rate (%) 290.00 140.00 -- -- --
EPS Before Extra Ordinary
Basic EPS 23.76 15.65 12.83 7.42 --
Diluted EPS 23.76 15.65 12.83 7.42 --
EPS After Extra Ordinary
Basic EPS 23.76 15.65 12.83 7.42 --
Diluted EPS 23.76 15.65 12.83 7.42 --
Public Share Holding
No Of Shares (Crores) 65.37 63.16 63.16 63.16 --
Share Holding (%) 10.35 10.00 10.00 10.00 --
Promoters and Promoter Group Shareholding
a) Pledged/Encumbered
- Number of shares (Crores) -- -- -- -- --
- Per. of shares (as a % of the
total sh. of prom. and promoter
group)
-- -- -- -- --
- Per. of shares (as a % of the
total Share Cap. of the
company)
-- -- -- -- --
b) Non-encumbered
- Number of shares (Crores) 566.27 568.47 568.47 568.47 --
- Per. of shares (as a % of the
total sh. of prom. and promoter
group)
100.00 100.00 100.00 100.00 --
- Per. of shares (as a % of the
total Share Cap. of the
company)
89.65 90.00 90.00 90.00 --
KEY FINANCIAL RATIOS
Particulars Mar 2014 Mar 2013 Mar 2012 Mar 2011 Mar 2010
Face Value/M Lot :10.00/1
P/E Ratio : 14.86
Market Cap : 223030.83 Cr

Operational & Financial Ratios
Earnings Per Share (Rs) 23.76 15.51 12.77 7.43 5.98
CEPS(Rs) 23.77 15.51 12.78 7.44 6.00
DPS(Rs) 29.00 14.00 10.00 3.90 3.50
Book NAV/Share(Rs) 26.04 32.48 30.97 28.21 27.01
Tax Rate(%) 2.67 5.26 6.22 0.58 2.34
Margin Ratios
Core EBITDA Margin(%) -107.40 -85.82 -27.85 -31.60 -15.64
EBIT Margin(%) 3967.35 2419.46 1848.75 1061.78 930.17
Pre Tax Margin(%) 3898.69 2331.64 1767.50 1017.84 872.10
PAT Margin (%) 3794.54 2209.01 1657.58 1011.96 851.71
Cash Profit Margin (%) 3796.16 2210.13 1659.01 1013.27 853.85
Performance Ratios
ROA(%) 50.81 30.25 27.63 18.19 16.35
ROE(%) 81.21 48.87 43.15 26.93 24.25
ROCE(%) 82.38 50.39 44.85 26.13 23.98
Asset Turnover(x) 0.01 0.01 0.02 0.02 0.02
Sales/Fixed Asset(x) 0.99 1.12 1.24 1.21 1.19
Working Capital/Sales(x) 0.04 0.03 0.04 0.04 0.04
Efficiency Ratios
Fixed Capital/Sales(x) 1.01 0.89 0.81 0.82 0.84
Receivable days 7.65 0.61 0.01 0.00 0.01
Inventory Days 25.62 14.06 20.33 24.49 19.87
Payable days 1.22 1.51 1.87 4.15 7.04
Valuation Parameters
PER(x) 12.12 19.94 26.87 46.69 0.00
PCE(x) 12.11 19.93 26.85 46.63 0.00
Price/Book(x) 11.06 9.52 11.08 12.31 0.00
Yield(%) 10.07 4.53 2.91 1.12 0
EV/Net Sales(x) 461.95 428.60 437.49 454.10 -3.06
EV/Core EBITDA(x) 10.96 16.61 22.52 42.35 -0.33
EV/EBIT(x) 10.96 16.62 22.54 42.41 -0.33
EV/CE(x) 6.87 5.24 6.60 7.55 -0.06
M Cap / Sales 488.31 469.39 467.57 476.47 0.00
Growth Ratio

Net Sales Growth(%) -10.48 -10.24 0.73 3.93 55.47
Core EBITDA Growth(%) 46.27 19.22 82.48 19.23 12.43
EBIT Growth(%) 46.28 19.26 82.56 19.36 12.36
PAT Growth(%) 53.24 21.44 71.74 24.24 14.88
EPS Growth(%) 53.24 21.44 71.74 24.24 -98.85
Financial Stability Ratios
Total Debt/Equity(x) 0.00 0.06 0.07 0.08 0.09
Current Ratio(x) 2.58 2.28 2.68 2.61 3.22
Quick Ratio(x) 2.65 2.32 2.73 2.66 3.22
Interest Cover(x) 57.78 27.55 22.75 24.16 16.02
Total Debt/Mcap(x) 0.00 0.01 0.01 0.01 0
Liquidity and Credit Analysis
Current Ratio
Higher current ratio implies healthier short term liquidity comfort level. A current
ratio below 1 indicates that the company may not be able to meet its obligations in the short
run. However, it is not always a matter of worry if this ratio temporarily falls below 1 as
many times companies squeeze out short term cash sources to achieve a capital intensive plan
with a longer term outlook. Coal India’s average current ratio over the last 5 financial years
has been 2.15 times which indicates that that the Company is comfortably placed to pay for
its short term obligations.
Long Term Debt to Equity Ratio
Companies operating with high debt to equity on their balance sheets are vulnerable
to economic cycles. In times of slowdown in economy, companies with high levels of debt
find it increasingly difficult to service the interest on their borrowings as profit margins
decline. We believe that long term debt to equity ratio higher than 0.6 - 0.8 could affect the
business of a company and its results of operations.
Coal India’s average long term debt to equity ratio over the last 5 financial years has
been 0.05 times which indicates that the Company operates with a low level of debt.

Interest Coverage ratio
Interest coverage ratio indicates the comfort with which the company may be able to
service the interest expense (i.e. finance charges) on its outstanding debt. Higher interest
coverage ratio indicates that the company can easily meet the interest expense pertaining to
its debt obligations. In our view, interest coverage ratio of below 1.5 should raise doubts
about the company’s ability to meet the expenses on its borrowings. Interest coverage ratio
below 1 indicates that the company is just not generating enough to service its debt
obligations.
Coal India’s average interest coverage ratio over the last 5 financial years has been
146.75 times which indicates that the Company has been generating enough for the
shareholders after servicing its debt obligations.
Return on Capital Employed
Return on Capital Employed (ROCE) measures a company’s profitability from its
overall operations by calculating the return generated on the total capital invested in the
business (i.e. equity + debt). Return on Equity (ROE) or Return on Net Worth (RONW)
measures the amount of profit which the company generates on money invested by the equity
shareholders. In short, ROE draws attention to the return generated by the shareholders on
their investment in the business. Together these ratios can be used in comparing the
profitability of the company with other companies in the same industry
Dividend History
Year Rate of dividend (of face
value) Rs. Closing price* Date*
FY 2008 -% - - -
FY 2009 -% - - -
FY 2010 -% - - -
FY 2011 39 % 3.90 385.95 8 September 2011
FY 2012 100 % 10.00 358.10 6 September 2012
FY 2013 140 % 14.00 277.45 6 September 2013
FY 2014 290 % 29.00 272.75 17 January 2014
* Closing Price as on the date of declaration of final (or last) dividend for the Financial Year.

Coal India's share got listed in the Stock Exchanges on 4th November, 2010. The CIL
stock opened at Rs 291 and ended the first day at Rs 342.35 per share making CIL the fourth
most valued company in the country with a market capitalization of Rs. 2.16 lakh crores. On
18th Feb, 2011, the Company announced its first interim dividend at the rate of 35%.
The Company has maintained an average dividend yield of 3.90 % over the last 5 financ ia l
years.
NON-FINANCIAL ANALYSIS
SWOT Analysis of Coal India Limited
STRENGTHS
ancial
performance
WEAKNESSES
OPPORTUNITIES
opportunities for CIL
nd will continue to remain strong,
comparative to alternate energy sources available in India.
quality of domestic coal available in India.

THREATS
reserves are under forest and tribal inhabited areas, increasingly making it
difficult to excavate.
disruptions.
negatively impact CIL's performance.
COMPETITOR ANALYSIS
Name Last Price Market Cap.
(Rs. cr.) Sales
Turnover
Net Profit Total Assets
Coal India 353.80 223,472.97 314.25 15,008.54 16,445.24
Sesa Sterlite 226.70 67,209.51 28,536.53 1,076.09 67,447.13
NMDC 134.40 53,285.78 12,058.20 6,420.08 29,988.30
MOIL 310.55 5,217.24 1,021.28 509.56 3,127.33
Guj Mineral 130.45 4,148.31 1,289.67 439.13 2,862.47
Orissa Minerals 3,115.05 1,869.03 1.02 6.26 818.49
Indian Metals 214.80 557.99 1,317.85 39.12 1,811.11
Ashapura Mine 60.45 525.83 663.64 141.27 -70.19
Maithan Alloys 193.30 281.36 816.25 22.98 328.97
Shirpur Gold 82.40 240.09 1,740.46 5.80 367.42
20 Microns 30.50 103.14 290.45 0.13 210.57
Rohit Ferro Tec 7.75 88.18 2,486.30 -228.60 2,487.31
Hira Ferro 31.85 62.39 212.76 2.71 198.46
Parrys Sugar 21.50 42.92 172.14 -36.04 175.08
Resurgere Mines 1.40 27.84 0.58 -58.84 656.87
Impex FerroTech 2.80 22.85 698.02 -54.86 367.30
Oswal Minerals 27.80 21.55 773.40 2.64 102.11
AML Steel 7.00 5.25 126.48 0.05 137.26
CONCLUSION
The primary motive of buying a share is to sell it subsequently at a higher price, In many cases
dividend are also expected. Thus, dividends and price changes constitute the return from investing in
shares, consequently, an investor would be interested to know the dividend to be paid on the share in
the future as also the future price of the share. This values can only be estimated and not predicted with
certainty, This values are primarily determined by the performance of the company which in turn is
influenced by the performance of the industry to which the company belongs and the general economic
and socio political scenario of the country.