sediment fe:po ratio as a diagnostic and prognostic tool for
TRANSCRIPT
Sediment Fe:PO 4 ratio as a diagnostic and prognostic tool for the restoration of
aquatic biodiversity in fens
Jeroen Geurts, Leon Lamers, Fons Smolders, Jos Verhoeven & Jan Roelofs

Eutrophication and pollution
Eutrophication of Dutch peat lakesDutch peat lakesEutrophicationEutrophication of Dutch peat lakesof Dutch peat lakes

External loads decreased due to P-stripping and decrease of P in Rhine water
However, HCO3
-, SO42- and Cl - still high:
eutrophication of fen waters increased!
In a major part of The Netherlands allochtonous river Rhine water is used to counteract desiccation problems
This leads to strong eutrophication
Eutrophication and pollution
Internal eutrophication:Internal eutrophication:
Eutrophication by Eutrophication by increased mobilization of increased mobilization of nutrients nutrients in the sedimentin the sediment(particularly shallow peat (particularly shallow peat lakes)lakes)
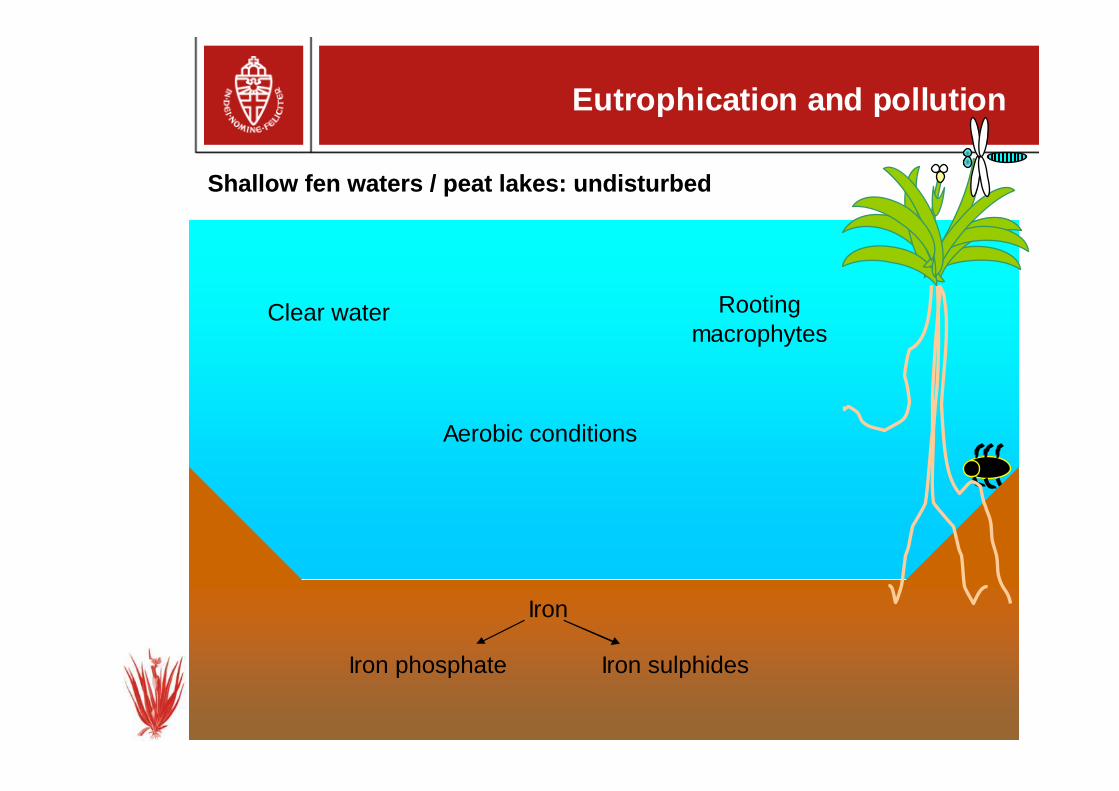
Eutrophication and pollution
Rooting macrophytes
Iron phosphate
Iron
Iron sulphides
Clear water
Aerobic conditions
ShallowShallow fenfen waterswaters / / peatpeat lakeslakes: : undisturbedundisturbed
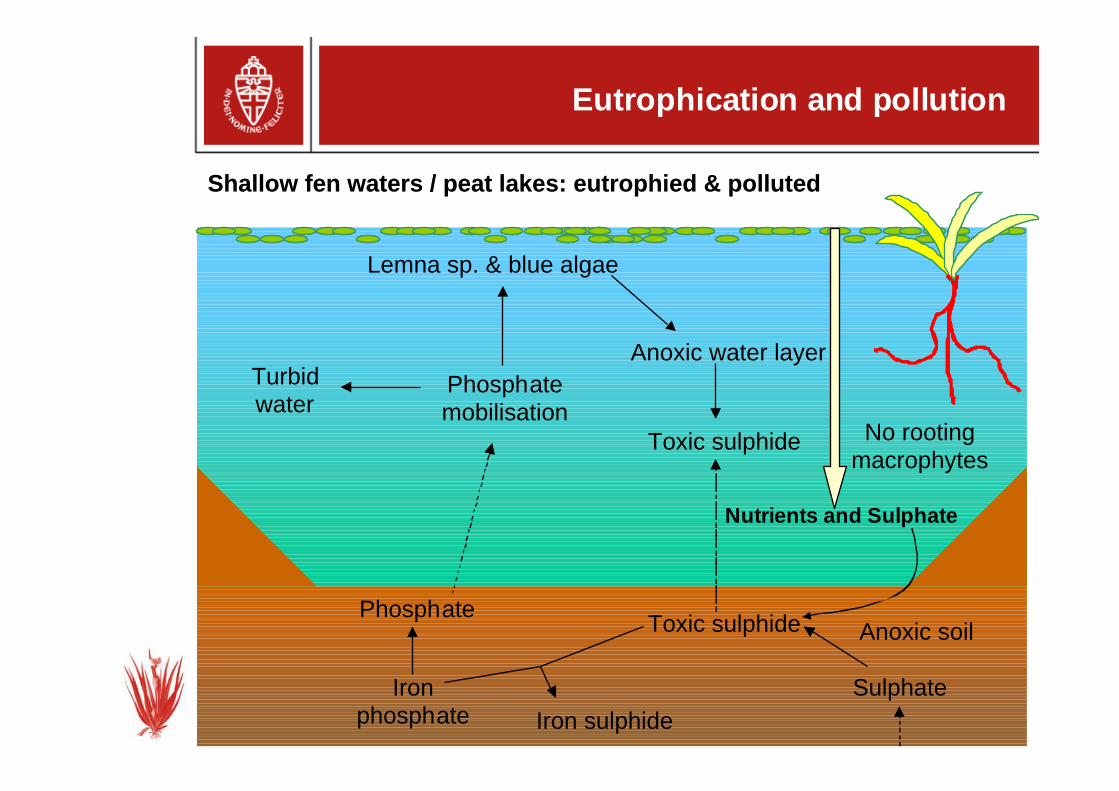
Lemna sp. & blue algae
Toxic sulphide No rootingmacrophytes
Phosphate mobilisation
Phosphate
Iron phosphate
Anoxic water layerTurbid water
Sulphate
Toxic sulphide Anoxic soil
Iron sulphide
Nutrients and Sulphate
Eutrophication and pollution
ShallowShallow fenfen waterswaters / / peatpeat lakeslakes: : eutrophiedeutrophied & & pollutedpolluted

Hypothesis
Sediment (pore water) data� less fluctuating in time – less frequent sampling needed� indicators of biogeochemical processes in the sediment,
especially Fe-S-P interactions (shallow lakes; 1-2 m)
� “early warning system” for future changes in water qualityAND� prognosis of biodiversity response after restoration measures
Water quality data� used for predicting restoration potential of aquatic
macrophyte diversity� strong temporal fluctuations (seasons, growth of plants &
algae)

Methods
145 fen waters in 17 different areas in the Netherlands, Ireland and Poland:
� Surface water and pore water samples� Vegetation relevées � threatened species� Sediment samples from 79 locations� Correlations and other statistical methods
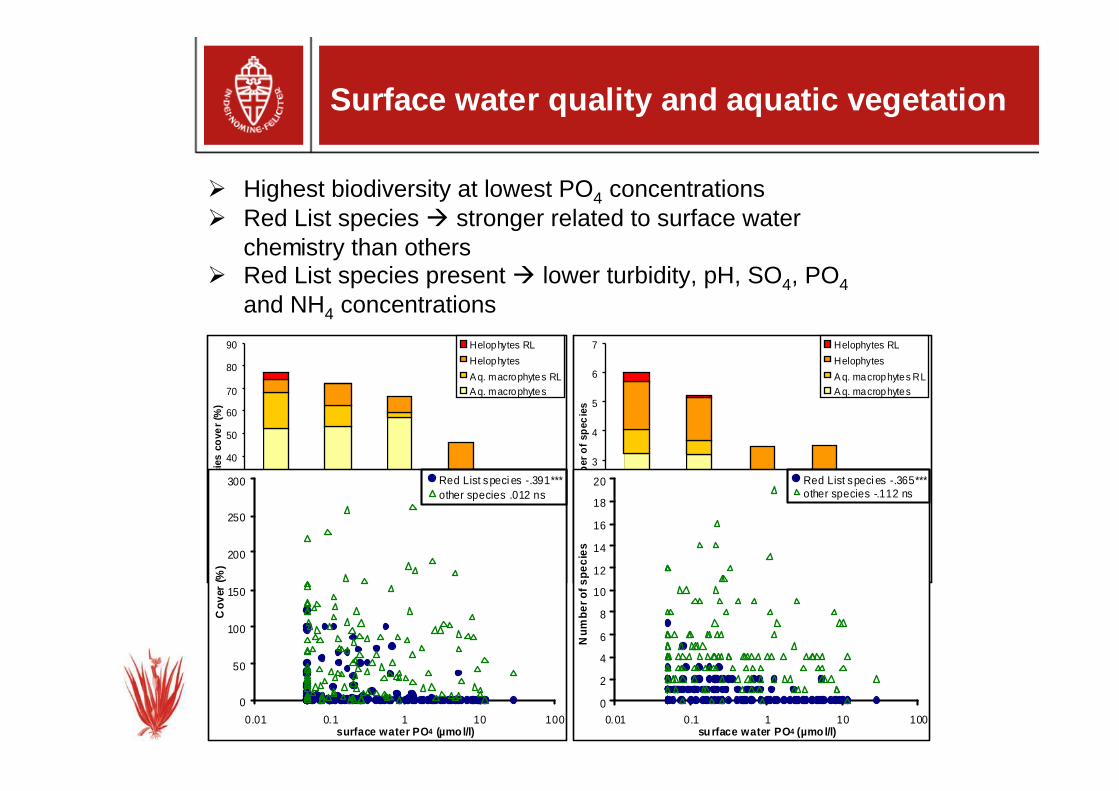
Surface water quality and aquatic vegetation
� Highest biodiversity at lowest PO4 concentrations� Red List species � stronger related to surface water
chemistry than others � Red List species present � lower turbidity, pH, SO4, PO4
and NH4 concentrations
0
10
20
30
40
50
60
70
80
90
≤ 0.5 0 .5 - 2 2 -6 ≥ 6surface wa ter P O 4
spe
cies
cov
er (
%)
Helophytes RL
Helophytes
A q. macrophytes RLA q. macrophytes
0
1
2
3
4
5
6
7
≤ 0 .5 0 .5 - 2 2-6 ≥ 6surface wa te r PO 4
num
ber o
f spe
cies
Helophytes RL
Helophytes
A q. macrophytes RLA q. macrophytes
0
50
100
150
200
250
300
0.01 0.1 1 10 100surface water PO 4 (µmo l/l)
Cov
er (%
)
Red List speci es -.391***other species .012 ns
0
2
4
6
8
10
12
14
16
18
20
0.01 0.1 1 10 100su rface water PO 4 (µmo l/l)
Num
ber o
f spe
cies
Red List speci es -.365***other species -.112 ns

Sediment and surface water quality
� PO4 mobilization trigger at pore water PO4 > 6.5 µmol L-1
� Thresholds for pore water Fe:PO4 < 3.5 mol mol-1 and for total sediment Fe:P < 10 mol mol-1
� Low ratios / PO4 mobilization ↔ SO4 pollution / sulphide production
0
20
40
60
80
100
120
0 10 20 30 40 50t otal sed imen t F e:P (mol:mol)
pore
wat
er P
O4 (µ
mol
/l)
0
5
10
15
20
25
30
35
surf
ace
wat
er P
O4 (
µmol
/l)
pore water -.147 ns surface water -.363**
0
5
10
15
20
25
30
35
0.01 0.1 1 10 100 1000p ore w ater PO 4 (µmol/l)
surf
ace
wat
er P
O4 (µ
mo
l/l)
Fe:PO4 < 3,5Fe:PO4 > 3,5r = .666***
0
20
40
60
80
100
120
0.01 0.1 1 10 100 1000 10000 1E+05po re w ater Fe:PO 4 (mo l:mo l)
pore
wat
er P
O4 (µ
mol
/l)
0
5
10
15
20
25
30
35
surf
ace
wat
er P
O4 (µ
mol
/l)
porewater -.800***surface water -.612***
0
20
40
60
80
100
120
0.01 0.1 1 10 100 1000 10000po re w ater sulph id e (µm ol/l)
pore
wat
er P
O4 (µ
mo
l/l)
pore water .504***Fe:PO 4 < 3,5Fe:PO 4 > 3,5
Smolders et al. 2001
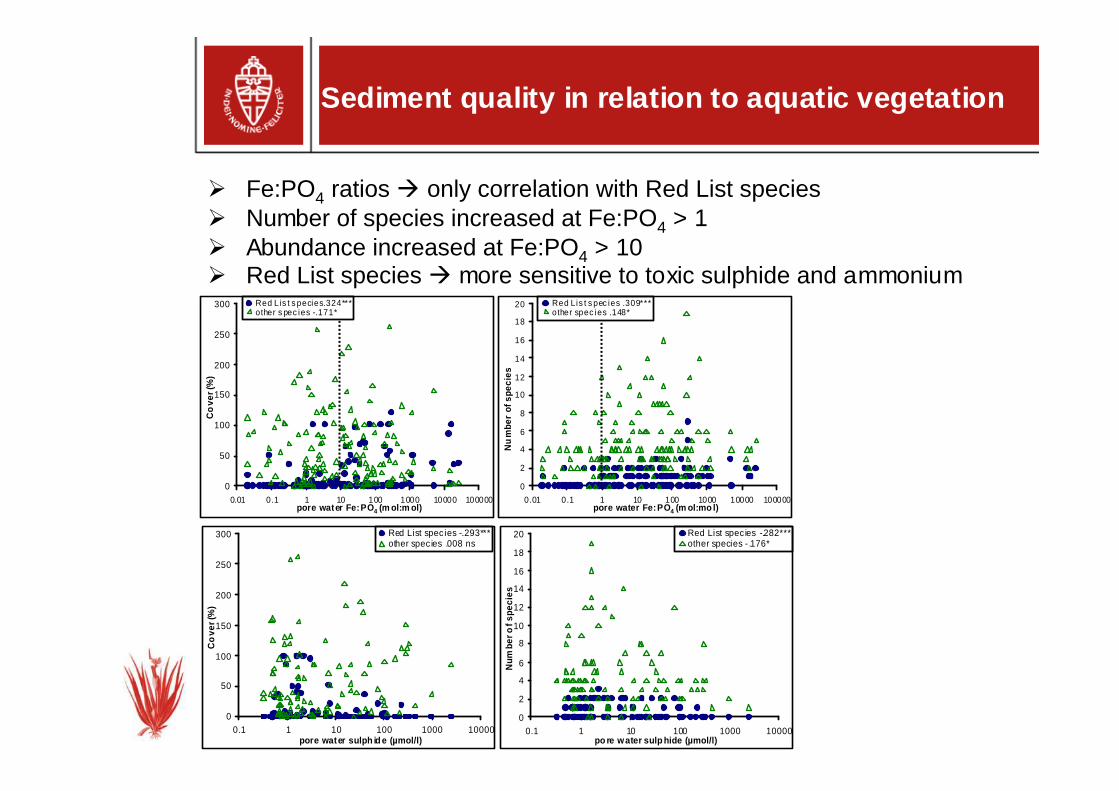
Sediment quality in relation to aquatic vegetation
� Fe:PO4 ratios � only correlation with Red List species� Number of species increased at Fe:PO4 > 1� Abundance increased at Fe:PO4 > 10� Red List species � more sensitive to toxic sulphide and ammonium
0
50
100
150
200
250
300
0.01 0.1 1 10 100 1000 10000 100000pore water Fe:PO 4 (m ol:m ol)
Co
ver (
%)
Red Lis t s pecies.324***other s pec ies -.171*
0
2
4
6
8
10
12
14
16
18
20
0.01 0.1 1 10 100 1000 10000 100000pore water Fe:PO 4 (m ol:mo l)
Nu
mbe
r of
spe
cies
Red Lis t s pec ies .309***other spec ies .148*
0
50
100
150
200
250
300
0.1 1 10 100 1000 10000pore water sulph id e (µmol/l)
Co
ver (
%)
Red List species -.293***other species .008 ns
0
2
4
6
8
10
12
14
16
18
20
0.1 1 10 100 1000 10000po re water sulp hide (µmol/l)
Num
ber o
f spe
cies
Red List species -.282***other species - .176*
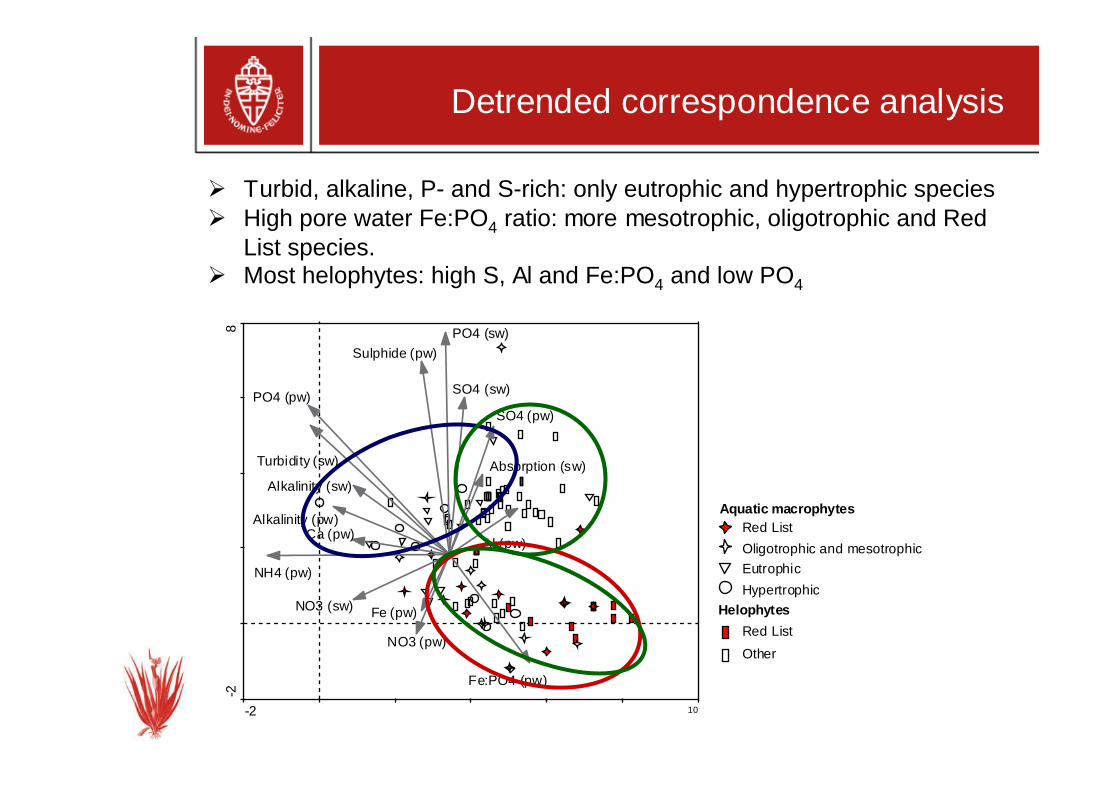
Detrended correspondence analysis
-2 10
-28
Alkalinity (pw)
Sulphide (pw)
Al (pw)
SO4 (pw)
Ca (pw)
Fe (pw)
NO3 (pw)
NH4 (pw)
PO4 (pw)
Fe:PO4 (pw)
Alkalinity (sw)
Absorption (sw)Turbidity (sw)
SO4 (sw)
NO3 (sw)
PO4 (sw)
Aquatic macrophytesRed List
Red List
Oligotrophic and mesotrophic
Eutrophic
Hypertrophic
Other
Helophytes
� Turbid, alkaline, P- and S-rich: only eutrophic and hypertrophic species� High pore water Fe:PO4 ratio: more mesotrophic, oligotrophic and Red
List species. � Most helophytes: high S, Al and Fe:PO4 and low PO4
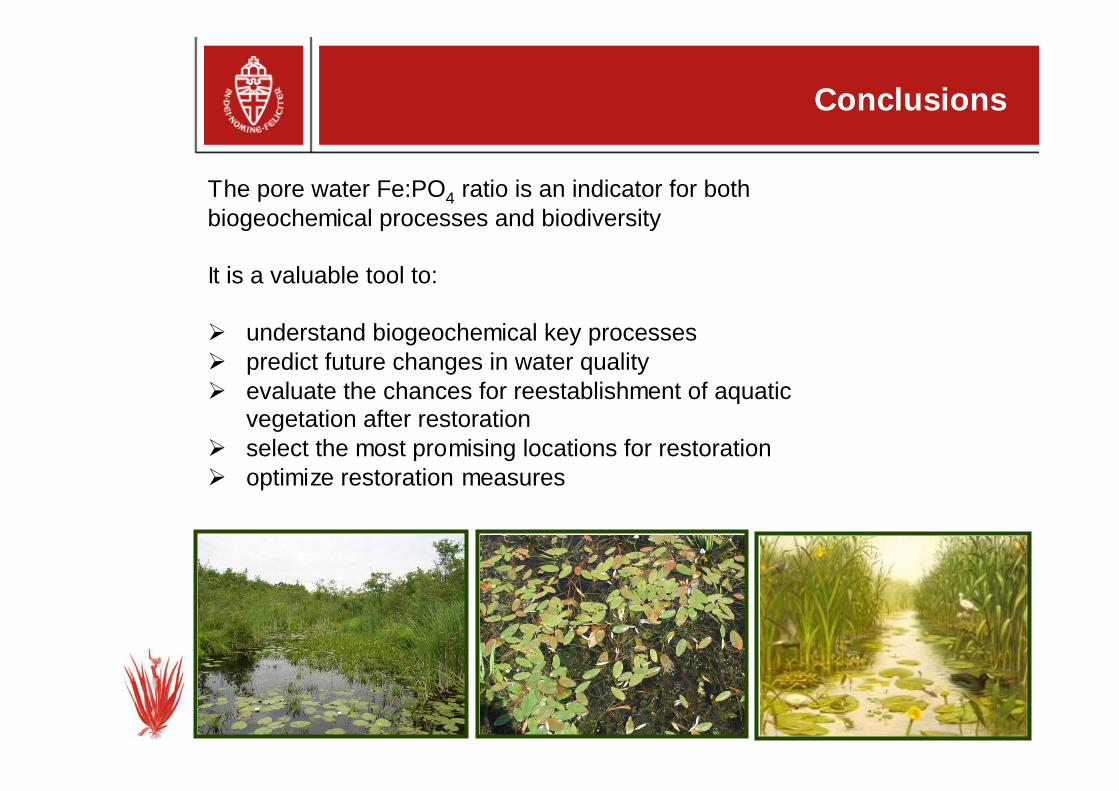
Conclusions
The pore water Fe:PO4 ratio is an indicator for bothbiogeochemical processes and biodiversity
It is a valuable tool to:
� understand biogeochemical key processes � predict future changes in water quality � evaluate the chances for reestablishment of aquatic
vegetation after restoration� select the most promising locations for restoration� optimize restoration measures

� Hein Pijnappel, Judith Sarneel, Babette Bontes, Marjolijn Christianen, Artur Banach, Marlies van derWelle, Bas Bierens, Kim Kobes, Jan van de Graaf, Martin Versteeg, Jelle Eygensteyn, Roy Peters, and Germa Verheggen
� The Dutch Ministry of Agriculture, Nature and Food Quality for funding the research
� All nature managers involved
� You, for listening!
Many thanks to