the evolution of the ventilatory ratio is a prognostic
TRANSCRIPT
Torres et al. Crit Care (2021) 25:331 https://doi.org/10.1186/s13054-021-03727-x
RESEARCH
The evolution of the ventilatory ratio is a prognostic factor in mechanically ventilated COVID-19 ARDS patientsAntoni Torres1,2,53*† , Anna Motos1,2†, Jordi Riera3, Laia Fernández‑Barat1,2†, Adrián Ceccato1†, Raquel Pérez‑Arnal4, Dario García‑Gasulla4, Oscar Peñuelas1,5, José Angel Lorente1,5, Alejandro Rodriguez6, David de Gonzalo‑Calvo1,7, Raquel Almansa8,9, Albert Gabarrús2, Rosario Menéndez10, Jesús F. Bermejo‑Martin8,9, Ricard Ferrer3, Rosario Amaya Villar11, José M. Añón1,12, Carme Barberà13, José Barberán14, Aaron Blandino Ortiz15, Elena Bustamante‑Munguira16, Jesús Caballero17, Cristina Carbajales18, Nieves Carbonell19, Mercedes Catalán‑González20, Cristóbal Galbán21, Víctor D. Gumucio‑Sanguino22,23, Maria del Carmen de la Torre24, Emili Díaz25,26, Ángel Estella27, Elena Gallego28, José Luis García Garmendia29, José Garnacho‑Montero30, José M. Gómez31, Arturo Huerta32, Ruth Noemí Jorge García33, Ana Loza‑Vázquez34, Judith Marin‑Corral35, Amalia Martínez de la Gándara36, Ignacio Martínez Varela37, Juan López Messa38, Guillermo M. Albaiceta1,39,40, Mariana Andrea Novo41, Yhivian Peñasco42, Juan Carlos Pozo‑Laderas43, Pilar Ricart44, Inmaculada Salvador‑Adell45, Angel Sánchez‑Miralles46, Susana Sancho Chinesta47, Lorenzo Socias48, Jordi Solé‑Violan49, Fernando Suares Sipmann50, Luis Tamayo Lomas51, José Trenado52 and Ferran Barbé1,7 on behalf of CIBERESUCICOVID Project (COV20/00110, ISCIII)
Abstract
Background: Mortality due to COVID‑19 is high, especially in patients requiring mechanical ventilation. The purpose of the study is to investigate associations between mortality and variables measured during the first three days of mechanical ventilation in patients with COVID‑19 intubated at ICU admission.
Methods: Multicenter, observational, cohort study includes consecutive patients with COVID‑19 admitted to 44 Spanish ICUs between February 25 and July 31, 2020, who required intubation at ICU admission and mechanical ven‑tilation for more than three days. We collected demographic and clinical data prior to admission; information about clinical evolution at days 1 and 3 of mechanical ventilation; and outcomes.
Results: Of the 2,095 patients with COVID‑19 admitted to the ICU, 1,118 (53.3%) were intubated at day 1 and remained under mechanical ventilation at day three. From days 1 to 3, PaO2/FiO2 increased from 115.6 [80.0–171.2] to 180.0 [135.4–227.9] mmHg and the ventilatory ratio from 1.73 [1.33–2.25] to 1.96 [1.61–2.40]. In‑hospital mortality was
© The Author(s) 2021. Open Access This article is licensed under a Creative Commons Attribution 4.0 International License, which permits use, sharing, adaptation, distribution and reproduction in any medium or format, as long as you give appropriate credit to the original author(s) and the source, provide a link to the Creative Commons licence, and indicate if changes were made. The images or other third party material in this article are included in the article’s Creative Commons licence, unless indicated otherwise in a credit line to the material. If material is not included in the article’s Creative Commons licence and your intended use is not permitted by statutory regulation or exceeds the permitted use, you will need to obtain permission directly from the copyright holder. To view a copy of this licence, visit http:// creat iveco mmons. org/ licen ses/ by/4. 0/. The Creative Commons Public Domain Dedication waiver (http:// creat iveco mmons. org/ publi cdoma in/ zero/1. 0/) applies to the data made available in this article, unless otherwise stated in a credit line to the data.
Open Access
*Correspondence: [email protected]†Antoni Torres and Anna Motos have contributed equally to this work and are considered as co‑first authors; Laia Fernández‑Barat and Adrián Ceccato have also contributed equally to this work and are considered as co‑third authors.1 Centro de Investigación Biomedica En Red – Enfermedades Respiratorias (CIBERES), Barcelona, SpainFull list of author information is available at the end of the article
Page 2 of 13Torres et al. Crit Care (2021) 25:331
BackgroundThe mortality recorded during the COVID-19 pandemic, although variable, is extremely high, especially in patients admitted to the ICU, and even more in those patients that require invasive mechanical ventilation (MV) for ARDS [1]. In a recent meta-analysis including 69 stud-ies, the overall case fatality rate was 45% [2]. When cases were stratified by age, mortality rise to 84.4% in patients older than 80 years. However, the observed heterogene-ity was high (I > 90%) but with a non-significant Egger regression test that suggested no publication bias. The 15 studies included from Europe gave similar results com-pared to other continents [2].
The Eurosurveillance registry in Spain [3] reported epi-demiological data from the first wave of the pandemic in Spain up to April 17, 2020. They reported 8,289 patients admitted to ICUs (4.6% of the total), 4,085 of whom required MV (78% of those admitted to an ICU). The overall mortality of mechanically ventilated patients was 42%. Among the various factors associated with death, age, chronic kidney disease, and a shorter time between symptom onset and ED visit were the most important. The REVA network study [4] recently described 4,643 patients admitted to ICUs in France. On day 1 of admis-sion, 63% of patients were intubated and overall, 80% received MV. The 90-day mortality was associated with age, diabetes, obesity, and severe ARDS.
The majority of investigations dealing with COVID patients admitted to the ICU have attempted to deter-mine prognostic factors using data from the first day of hospital admission or data obtained on day 1 of ICU admission. In ICU patients, these data can be misinter-preted, either because the patients are not “clinically sta-ble” or because they are not relevant as they cannot be modified (e.g., age, obesity, etc.). On the other hand, in many respiratory acute diseases with acute respiratory failure, the patient’s status 72 h after ICU admission gives important clues about prognosis, taking into account what has happened since admission, including adequate or inadequate management [5, 6]. This type of observa-tional research can provide evidence about beneficial medical interventions.
CIBERESUCICOVID (Centro de Investigación Biomé-dica En Red de Enfermedades ReSpiratoria—Factores de riesgo y pronóstico personalizados y seguimiento a un año de los enfermos ingresados en las Unidades de Cui-dados Intensivos españolas infectados por COVID-19) is a multicenter observational study (NCT04457505) that is studying patients admitted to an ICU due to SARS-CoV-2 infection [7]. Patients who required invasive mechanical ventilation during the first day of admission to the ICU and who remained ventilated 3 days later were selected to capture what has happened since admission to 72 h after ICU admission. Our hypothesis was that the differences between day 1 and day 3 in relevant and independently associated variables with in-hospital mortality may help clinicians both to establish corrective measures and to have a better understanding of the prognosis.
MethodsStudy designCIBERESUCICOVID is a multicenter, observational, pro-spective/retrospective cohort study that enrolled patients with COVID-19 infection admitted to the Spanish ICUs (participating centers are listed in the Additional file 1: Table 1). The study was approved by the Institu-tion’s Internal Review Board (Comité Ètic d’Investigació Clínica, registry number HCB/2020/0370), and informed consent was obtained from either patients or their rela-tives. Local researchers were contacted by a member of the study team and participating hospitals obtained local ethics committee approval. Data collection was started in May 2020. Consecutive patients admitted before the start of the study were included retrospectively. Patients admitted after the start of the study were included pro-spectively. De-identified patient data were collected and stored via the REDCap electronic data capture tool, hosted at the Centro de Investigación Biomédica en Red (CIBER), Spain. Data from patients’ medical records were incorporated into a separate database by trained local researchers. Prior to statistical analyses, the data were checked by three independent experienced data collec-tors trained in critical care (PC, AM, CS), and site investi-gators were contacted with any queries. Missing analyses were performed, and site investigators were contacted
38.7%. A higher increase between ICU admission and day 3 in the ventilatory ratio (OR 1.04 [CI 1.01–1.07], p = 0.030) and creatinine levels (OR 1.05 [CI 1.01–1.09], p = 0.005) and a lower increase in platelet counts (OR 0.96 [CI 0.93–1.00], p = 0.037) were independently associated with a higher risk of death. No association between mortality and the PaO2/FiO2 variation was observed (OR 0.99 [CI 0.95 to 1.02], p = 0.47).
Conclusions: Higher ventilatory ratio and its increase at day 3 is associated with mortality in patients with COVID‑19 receiving mechanical ventilation at ICU admission. No association was found in the PaO2/FiO2 variation.
Keywords: Ventilatory ratio, Mechanical ventilation, COVID‑19, SARS‑CoV‑2, Coronavirus
Page 3 of 13Torres et al. Crit Care (2021) 25:331
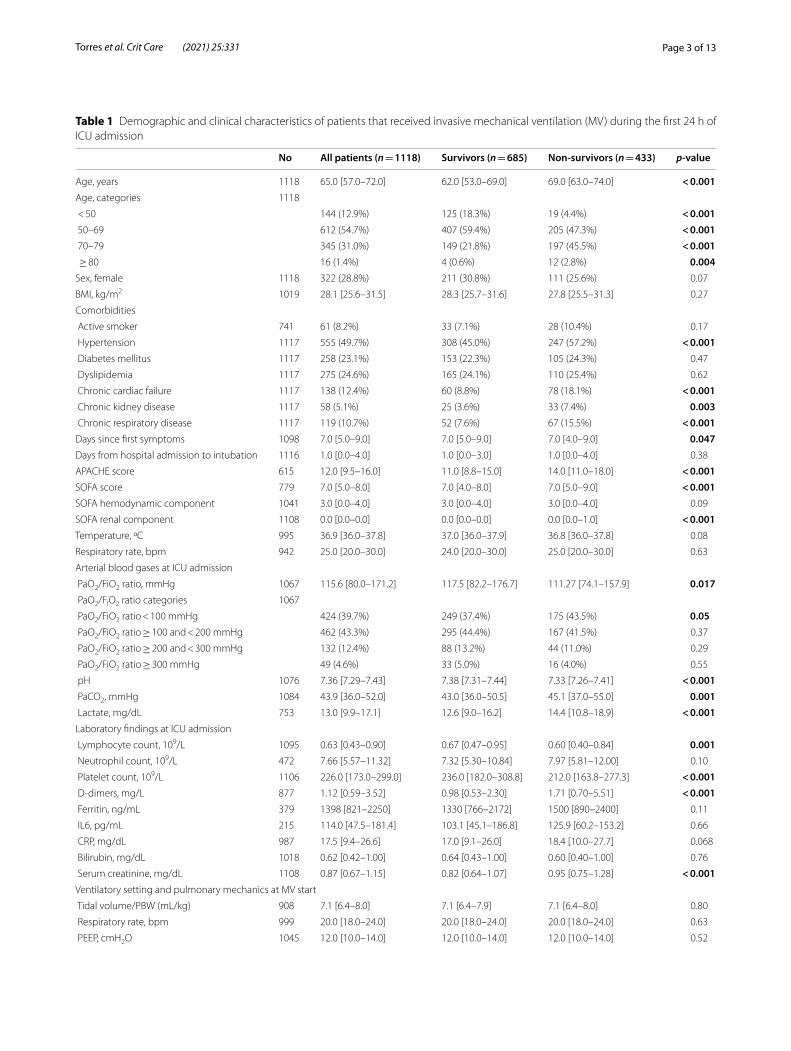
Table 1 Demographic and clinical characteristics of patients that received invasive mechanical ventilation (MV) during the first 24 h of ICU admission
No All patients (n = 1118) Survivors (n = 685) Non-survivors (n = 433) p-value
Age, years 1118 65.0 [57.0–72.0] 62.0 [53.0–69.0] 69.0 [63.0–74.0] < 0.001Age, categories 1118
< 50 144 (12.9%) 125 (18.3%) 19 (4.4%) < 0.001 50–69 612 (54.7%) 407 (59.4%) 205 (47.3%) < 0.001 70–79 345 (31.0%) 149 (21.8%) 197 (45.5%) < 0.001 ≥ 80 16 (1.4%) 4 (0.6%) 12 (2.8%) 0.004Sex, female 1118 322 (28.8%) 211 (30.8%) 111 (25.6%) 0.07
BMI, kg/m2 1019 28.1 [25.6–31.5] 28.3 [25.7–31.6] 27.8 [25.5–31.3] 0.27
Comorbidities
Active smoker 741 61 (8.2%) 33 (7.1%) 28 (10.4%) 0.17
Hypertension 1117 555 (49.7%) 308 (45.0%) 247 (57.2%) < 0.001 Diabetes mellitus 1117 258 (23.1%) 153 (22.3%) 105 (24.3%) 0.47
Dyslipidemia 1117 275 (24.6%) 165 (24.1%) 110 (25.4%) 0.62
Chronic cardiac failure 1117 138 (12.4%) 60 (8.8%) 78 (18.1%) < 0.001 Chronic kidney disease 1117 58 (5.1%) 25 (3.6%) 33 (7.4%) 0.003 Chronic respiratory disease 1117 119 (10.7%) 52 (7.6%) 67 (15.5%) < 0.001Days since first symptoms 1098 7.0 [5.0–9.0] 7.0 [5.0–9.0] 7.0 [4.0–9.0] 0.047Days from hospital admission to intubation 1116 1.0 [0.0–4.0] 1.0 [0.0–3.0] 1.0 [0.0–4.0] 0.38
APACHE score 615 12.0 [9.5–16.0] 11.0 [8.8–15.0] 14.0 [11.0–18.0] < 0.001SOFA score 779 7.0 [5.0–8.0] 7.0 [4.0–8.0] 7.0 [5.0–9.0] < 0.001SOFA hemodynamic component 1041 3.0 [0.0–4.0] 3.0 [0.0–4.0] 3.0 [0.0–4.0] 0.09
SOFA renal component 1108 0.0 [0.0–0.0] 0.0 [0.0–0.0] 0.0 [0.0–1.0] < 0.001Temperature, ºC 995 36.9 [36.0–37.8] 37.0 [36.0–37.9] 36.8 [36.0–37.8] 0.08
Respiratory rate, bpm 942 25.0 [20.0–30.0] 24.0 [20.0–30.0] 25.0 [20.0–30.0] 0.63
Arterial blood gases at ICU admission
PaO2/FiO2 ratio, mmHg 1067 115.6 [80.0–171.2] 117.5 [82.2–176.7] 111.27 [74.1–157.9] 0.017 PaO2/FIO2 ratio categories 1067
PaO2/FiO2 ratio < 100 mmHg 424 (39.7%) 249 (37.4%) 175 (43.5%) 0.05 PaO2/FiO2 ratio ≥ 100 and < 200 mmHg 462 (43.3%) 295 (44.4%) 167 (41.5%) 0.37
PaO2/FiO2 ratio ≥ 200 and < 300 mmHg 132 (12.4%) 88 (13.2%) 44 (11.0%) 0.29
PaO2/FiO2 ratio ≥ 300 mmHg 49 (4.6%) 33 (5.0%) 16 (4.0%) 0.55
pH 1076 7.36 [7.29–7.43] 7.38 [7.31–7.44] 7.33 [7.26–7.41] < 0.001 PaCO2, mmHg 1084 43.9 [36.0–52.0] 43.0 [36.0–50.5] 45.1 [37.0–55.0] 0.001 Lactate, mg/dL 753 13.0 [9.9–17.1] 12.6 [9.0–16.2] 14.4 [10.8–18.9] < 0.001Laboratory findings at ICU admission
Lymphocyte count, 109/L 1095 0.63 [0.43–0.90] 0.67 [0.47–0.95] 0.60 [0.40–0.84] 0.001 Neutrophil count, 109/L 472 7.66 [5.57–11.32] 7.32 [5.30–10.84] 7.97 [5.81–12.00] 0.10
Platelet count, 109/L 1106 226.0 [173.0–299.0] 236.0 [182.0–308.8] 212.0 [163.8–277.3] < 0.001 D‑dimers, mg/L 877 1.12 [0.59–3.52] 0.98 [0.53–2.30] 1.71 [0.70–5.51] < 0.001 Ferritin, ng/mL 379 1398 [821–2250] 1330 [766–2172] 1500 [890–2400] 0.11
IL6, pg/mL 215 114.0 [47.5–181.4] 103.1 [45.1–186.8] 125.9 [60.2–153.2] 0.66
CRP, mg/dL 987 17.5 [9.4–26.6] 17.0 [9.1–26.0] 18.4 [10.0–27.7] 0.068
Bilirubin, mg/dL 1018 0.62 [0.42–1.00] 0.64 [0.43–1.00] 0.60 [0.40–1.00] 0.76
Serum creatinine, mg/dL 1108 0.87 [0.67–1.15] 0.82 [0.64–1.07] 0.95 [0.75–1.28] < 0.001Ventilatory setting and pulmonary mechanics at MV start
Tidal volume/PBW (mL/kg) 908 7.1 [6.4–8.0] 7.1 [6.4–7.9] 7.1 [6.4–8.0] 0.80
Respiratory rate, bpm 999 20.0 [18.0–24.0] 20.0 [18.0–24.0] 20.0 [18.0–24.0] 0.63
PEEP, cmH2O 1045 12.0 [10.0–14.0] 12.0 [10.0–14.0] 12.0 [10.0–14.0] 0.52
Page 4 of 13Torres et al. Crit Care (2021) 25:331
in order to obtain reliable and complete data as much as possible (Additional file 1: Fig. 1). Results were reported in accordance with the Strengthening the Reporting of Observational Studies in Epidemiology (STROBE) guide-lines [8].
Study population and data collectionAll consecutive patients admitted to the ICU at a par-ticipating center from February 25 to July 31, 2020, were enrolled if they fulfilled the following criteria: ≥ 18 years old, admission to ICU, and laboratory confirmed SARS-CoV-2 infection. For this study, we selected those patients who required invasive mechanical ventilation during the first day of admission to the ICU and who remained ven-tilated 3 days later. This selection responded to capture what has happened during first days of ICU admission in a homogenous population. Patients were excluded if they had non-confirmed SARS-CoV-2 infection, no data at baseline or at hospital discharge, or who were admit-ted to an ICU for other reasons. Patients who required ECMO support within this period (i.e., ICU admission—Day 3) were excluded from the analysis to avoid potential bias in blood gases analysis and pulmonary mechanics [9].
After enrollment, prior epidemiological data includ-ing demographics, comorbidities, clinical symptoms, disease chronology, and treatment administered upon hospital admission were collected. The site research-ers subsequently collected data acquired at hospital admission, ICU admission, start of MV, 72–96 h after ICU admission, weaning, ICU discharge and hospi-tal discharge, including vital signs, respiratory support devices (i.e., oxygen mask, high flow nasal cannular, and
noninvasive and invasive mechanical ventilation), the use of adjunctive therapies (i.e., neuromuscular blockade, prone position, and recruitment maneuvers), laboratory findings, arterial blood gases, and mechanical ventila-tion settings if appropriate. Hemodynamic parameters and organ dysfunction were studied with the Sequential Organ Assessment Failure Score (SOFA) at ICU admis-sion. The pharmacological treatments administered upon and during ICU admission until either discharge from the ICU or hospital, or death, were also collected.
Specific data regarding MV since the start of intuba-tion, as well as, at day 3 were analyzed. MV parameters related to ventilation-induced lung injury (VILI) such as tidal volume, respiratory rate, end-inspiratory plateau and peak inspiratory pressures, positive end-expiratory pressure (PEEP), driving pressure, and static compliance of the respiratory system (Crs) were collected. Impair-ment in oxygenation was analyzed using the PaO2/FiO2 ratio and abnormalities of CO2 metabolism were stud-ied using the ventilatory ratio (VR), a surrogate param-eter of Vd/Vt. The worst event values were preferentially recorded.
DefinitionsThe diagnosis of ARDS was based on the Berlin defini-tion [10]. Chronic respiratory disease was defined as any chronic obstructive pulmonary disease, cystic fibrosis, bronchiectasis, and interstitial lung diseases, exclud-ing asthma [11]. Tidal volume was reported in mL/kg of predicted body weight (PBW). Driving pressure was defined as plateau pressure minus PEEP. Crs was calcu-lated as tidal volume/ (plateau pressure − PEEP). Ventila-tory ratio was defined as (minute ventilation x PaCO2)/
Table 1 (continued)
No All patients (n = 1118) Survivors (n = 685) Non-survivors (n = 433) p-value
FiO2, % 1064 75.0 [60.0–100.0] 70.0 [60.0–100.0] 80.0 [60.0–100.0] < 0.001 Peak inspiratory pressure, cmH2O 509 31.0 [27.0–35.0] 30.0 [27.0–34.0] 31.0 [27.5–35.5] 0.08
End‑inspiratory plateau pressure, cmH2O 440 25.0 [22.0–28.0] 25.0 [21.0–28.0] 25.0 [22.0–28.0] 0.10
Driving pressure, cmH2Oa 432 12.0 [9.6–15.0] 12.0 [9.0–14.0] 12.0 [9.8–15.0] 0.25
Compliance, mL/cmH2Ob 413 37.1 [29.3–50.0] 37.1 [30.0–50.0] 35.8 [28.2–50.0] 0.33
Ventilatory ratioc 889 1.73 [1.33–2.25] 1.68 [1.32–2.15] 1.87 [1.41–2.36] 0.001 Position 960
Supine 591 (61.6%) 394 (65.5%) 197 (55.0%) < 0.001 Prone 346 (36.0%) 192 (31.9%) 154 (43.0%) 0.008 Other 23 (2.4%) 16 (2.6%) 7 (2.0%) 0.46
Continuous variables are expressed as median (IQR) and categorical variables as number (percentages). P-values marked in bold indicate numbers that are significant on the 95% confidence limit. CRP C-reactive protein; FiO2 fraction of inspired oxygen; MV mechanical ventilation; PaCO2 arterial partial pressure of carbon dioxide; PaO2 partial pressure of arterial oxygen; PBW predicted body weight; SOFA sequential organ failure assessment scorea Defined as plateau pressure—PEEPb Defined as tidal volume/(Plateau pressure − PEEP)c Defined as (minute ventilation × PaCO2)/(PBW × 100 × 37.5)
Page 5 of 13Torres et al. Crit Care (2021) 25:331
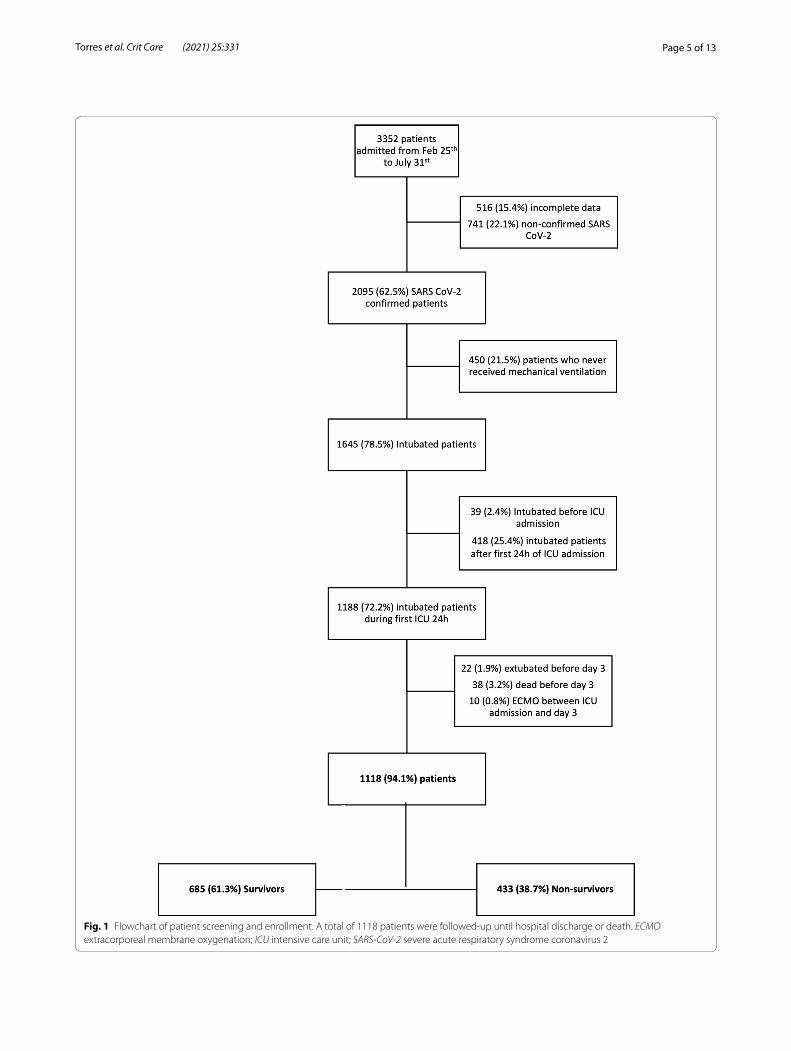
Fig. 1 Flowchart of patient screening and enrollment. A total of 1118 patients were followed‑up until hospital discharge or death. ECMO extracorporeal membrane oxygenation; ICU intensive care unit; SARS-CoV-2 severe acute respiratory syndrome coronavirus 2
Page 6 of 13Torres et al. Crit Care (2021) 25:331
(PBW × 100 × 37.5) (normal value: 1). The delta meas-urements were computed as the difference between the value at day 3 of ICU admission and day 1 of ICU admis-sion. Other definitions were reported in the Online Sup-plementary Data.
OutcomesThe primary outcome was in-hospital mortality. ICU mortality, 28 days mortality, the duration of ventilation, ICU, and hospital length of stay were also collected and reported. The pulmonary (i.e., nosocomial pneumonia, tracheobronchitis, ARDS, pneumothorax, pleural effu-sion, pulmonary embolism) and extrapulmonary compli-cations (including complications that affect hematologic, cardiovascular, renal, gastrointestinal, hepatic, endocrin-ologic, and neurologic systems) during ICU admission were also collected and included at hospital discharge.
Statistical analysisWe report the number and percentage of patients for cat-egorical variables and the median [first quartile − third quartile] for continuous variables. Percentages were cal-culated excluding missing data. Categorical variables were compared using the Chi-squared test or Fisher’s exact test, whereas continuous variables were compared using the nonparametric Mann–Whitney U test.
To explore the risk factors associated with in-hospital death, mixed-effects multivariable models [12, 13] were used, defined by a binomial probability distribution and a logit link function, with centers as a random effect. The following variables were included in the first mul-tivariable model based on clinical relevance only: age, sex, hypertension, chronic respiratory disease, SOFA hemodynamic component, and at ICU admission: PaO2/FiO2 ratio, serum creatinine, lymphocyte count, plate-let count, D-dimer, total bilirubin, and ventilatory ratio. The following variables were included in the second multivariable model based on previous findings and clinical constraints: age, delta PaO2/FiO2 ratio, delta serum creatinine, delta lymphocyte count, delta platelet count, delta total bilirubin, and delta ventilatory ratio. Both models included the relevant ventilatory and oxy-genation variables, laboratory tests, organ support, and demographic characteristics. Odds ratios (ORs) and their 95% confidence intervals were calculated. Single collin-earity was evaluated using the Pearson’s coefficient cor-relation (r). SOFA was excluded because of collinearity (r >|± 0.30|) with creatinine, while PaCO2 and pH were omitted because ventilatory ratio collinearity. Multicol-linearity was examined by means of the variance infla-tion factor (VIF). A rule of thumb is that if VIF > 10, then multicollinearity is high [14]. The linearity of con-tinuous variables was assessed using the Box–Tidwell test
(Additional file 1: Table 2). The linearity assumption for delta measurements was confirmed in a scatter plot of the predictor against the logit because the Box–Tidwell test does not accept negative values (Additional file 1: Fig. 2). Variables not satisfying this criterion were entered as restricted cubic splines in the model. The receiver operat-ing characteristic curve was used to assess the discrimi-natory ability of the model to distinguish dead patients from living patients and is expressed as the area under the receiver operating characteristic curve (AUC), rang-ing from 0.5 (no discriminative ability) to 1.0 (perfect discriminative ability). Calibration was assessed using the Brier score, ranging from 0.0 to 1.0, where a model with perfect skill has a score of 0.0 and the worst has a score of 1.0. The level of significance was set at 0.05 (two-tailed), and all analyses were performed using R version 4.0.3.
ResultsDemographics and clinical characteristics at ICU admissionBetween February 25 and July 31, 2020, 2,095 patients with COVID-19 were admitted to 44 ICUs (Additional file 1: Table 3), 1,645 (78.5%) required MV (Additional file 1: Table 4), and 1,188 (72.2%) needed intubation on the first day of ICU admission (Fig. 1). The majority of this last cohort still received MV support at day three of ICU admission [1,118 (94.1%)], while 38 (3.1%) died and 22 (1.8%) could be extubated during these first three days. Ten patients (0.8%) who required ECMO support during these first three days were excluded.
The characteristics of the study population of patients needing intubation on the first day and still needing MV of the third day are detailed in Table 1. In summary, the mean age was 65.0 [57.0–72.0] years, with the majority (54.7%) being aged between 50 and 69 years. Seventy-one percent (n = 786) were male, the most frequent comorbid-ity was hypertension, which was present in 555 (49.7%), and only 61 (8.2%) were active smokers. On the first day of MV, patients showed a respiratory system compliance of 37.1 [29.3–50.0] mL/cmH2O, with a driving pressure of 12.0 [9.6–15.0] cmH2O, a tidal volume of 7.1 [6.4–8.0] mL/Kg and a ventilatory ratio of 1.7 [1.4–2.3]. The PaO2/FiO2 ratio was 115.6 [80.0–171.2] mmHg, and the ratio was under 200 mmHg in 886 (83.0%) patients and under 100 mmHg in 424 (39.7%); 346 (36.0%) patients needed prone positioning during this first MV day. The measured respiratory rate was 20.0 [18.0–24.0] bpm, with a PaCO2 of 43.9 [36.0–52.0] mmHg and a pH of 7.36 [7.29–7.43]. The level of lactate was 13.0 [9.9–17.1] mg/dL with 704 (67.6%) patients needing vasoactive drugs at this time point. The SOFA score was 7.0 [5.0–8.0], the median level of creatinine was 0.87 [0.67–1.15] mg/dL, and the plate-let count was 226.0 [173.0–299.0] × 109/L. Regarding the COVID-19 laboratory biomarkers, the mean lymphocyte
Page 7 of 13Torres et al. Crit Care (2021) 25:331
count was low (0.63 [0.43–0.90] × 109/L) and the plasma levels of D-dimer, ferritin, and IL-6 were notably elevated with median values of 1.12 [0.59–3.52] mg/L, 1389.0 [821.0–2250.0] ng/mL and 114.0 [47.5–181.4] pg/mL, respectively.
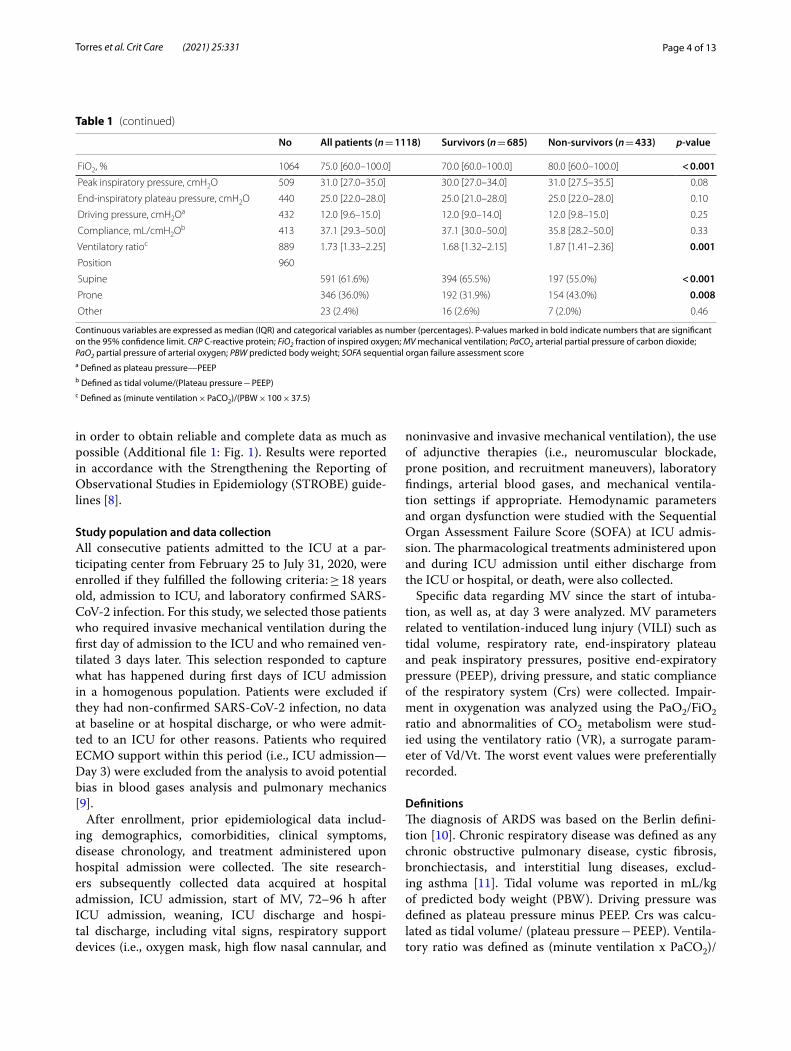
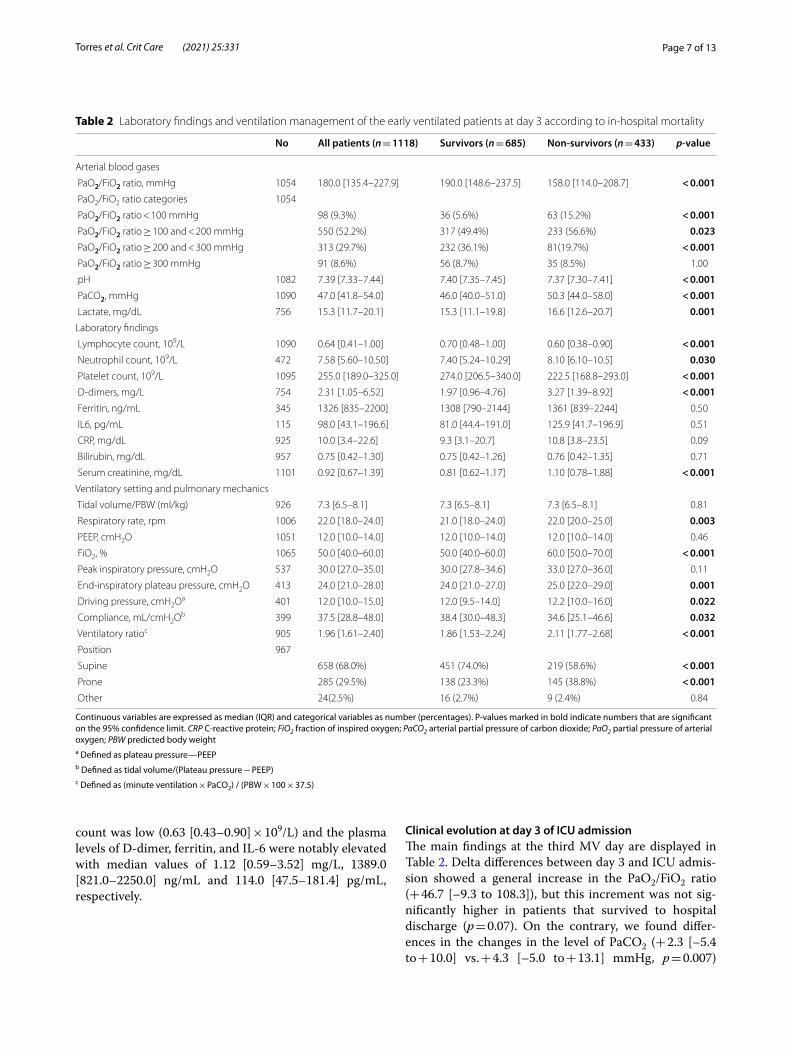
Clinical evolution at day 3 of ICU admissionThe main findings at the third MV day are displayed in Table 2. Delta differences between day 3 and ICU admis-sion showed a general increase in the PaO2/FiO2 ratio (+ 46.7 [–9.3 to 108.3]), but this increment was not sig-nificantly higher in patients that survived to hospital discharge (p = 0.07). On the contrary, we found differ-ences in the changes in the level of PaCO2 (+ 2.3 [–5.4 to + 10.0] vs. + 4.3 [–5.0 to + 13.1] mmHg, p = 0.007)
Table 2 Laboratory findings and ventilation management of the early ventilated patients at day 3 according to in‑hospital mortality
Continuous variables are expressed as median (IQR) and categorical variables as number (percentages). P-values marked in bold indicate numbers that are significant on the 95% confidence limit. CRP C-reactive protein; FiO2 fraction of inspired oxygen; PaCO2 arterial partial pressure of carbon dioxide; PaO2 partial pressure of arterial oxygen; PBW predicted body weighta Defined as plateau pressure—PEEPb Defined as tidal volume/(Plateau pressure − PEEP)c Defined as (minute ventilation × PaCO2) / (PBW × 100 × 37.5)
No All patients (n = 1118) Survivors (n = 685) Non-survivors (n = 433) p-value
Arterial blood gases
PaO2/FiO2 ratio, mmHg 1054 180.0 [135.4–227.9] 190.0 [148.6–237.5] 158.0 [114.0–208.7] < 0.001 PaO2/FiO2 ratio categories 1054
PaO2/FiO2 ratio < 100 mmHg 98 (9.3%) 36 (5.6%) 63 (15.2%) < 0.001 PaO2/FiO2 ratio ≥ 100 and < 200 mmHg 550 (52.2%) 317 (49.4%) 233 (56.6%) 0.023 PaO2/FiO2 ratio ≥ 200 and < 300 mmHg 313 (29.7%) 232 (36.1%) 81(19.7%) < 0.001 PaO2/FiO2 ratio ≥ 300 mmHg 91 (8.6%) 56 (8.7%) 35 (8.5%) 1.00
pH 1082 7.39 [7.33–7.44] 7.40 [7.35–7.45] 7.37 [7.30–7.41] < 0.001 PaCO2, mmHg 1090 47.0 [41.8–54.0] 46.0 [40.0–51.0] 50.3 [44.0–58.0] < 0.001 Lactate, mg/dL 756 15.3 [11.7–20.1] 15.3 [11.1–19.8] 16.6 [12.6–20.7] 0.001Laboratory findings
Lymphocyte count, 109/L 1090 0.64 [0.41–1.00] 0.70 [0.48–1.00] 0.60 [0.38–0.90] < 0.001 Neutrophil count, 109/L 472 7.58 [5.60–10.50] 7.40 [5.24–10.29] 8.10 [6.10–10.5] 0.030 Platelet count, 109/L 1095 255.0 [189.0–325.0] 274.0 [206.5–340.0] 222.5 [168.8–293.0] < 0.001 D‑dimers, mg/L 754 2.31 [1.05–6.52] 1.97 [0.96–4.76] 3.27 [1.39–8.92] < 0.001 Ferritin, ng/mL 345 1326 [835–2200] 1308 [790–2144] 1361 [839–2244] 0.50
IL6, pg/mL 115 98.0 [43.1–196.6] 81.0 [44.4–191.0] 125.9 [41.7–196.9] 0.51
CRP, mg/dL 925 10.0 [3.4–22.6] 9.3 [3.1–20.7] 10.8 [3.8–23.5] 0.09
Bilirubin, mg/dL 957 0.75 [0.42–1.30] 0.75 [0.42–1.26] 0.76 [0.42–1.35] 0.71
Serum creatinine, mg/dL 1101 0.92 [0.67–1.39] 0.81 [0.62–1.17] 1.10 [0.78–1.88] < 0.001Ventilatory setting and pulmonary mechanics
Tidal volume/PBW (ml/kg) 926 7.3 [6.5–8.1] 7.3 [6.5–8.1] 7.3 [6.5–8.1] 0.81
Respiratory rate, rpm 1006 22.0 [18.0–24.0] 21.0 [18.0–24.0] 22.0 [20.0–25.0] 0.003 PEEP, cmH2O 1051 12.0 [10.0–14.0] 12.0 [10.0–14.0] 12.0 [10.0–14.0] 0.46
FiO2, % 1065 50.0 [40.0–60.0] 50.0 [40.0–60.0] 60.0 [50.0–70.0] < 0.001 Peak inspiratory pressure, cmH2O 537 30.0 [27.0–35.0] 30.0 [27.8–34.6] 33.0 [27.0–36.0] 0.11
End‑inspiratory plateau pressure, cmH2O 413 24.0 [21.0–28.0] 24.0 [21.0–27.0] 25.0 [22.0–29.0] 0.001 Driving pressure, cmH2Oa 401 12.0 [10.0–15.0] 12.0 [9.5–14.0] 12.2 [10.0–16.0] 0.022 Compliance, mL/cmH2Ob 399 37.5 [28.8–48.0] 38.4 [30.0–48.3] 34.6 [25.1–46.6] 0.032 Ventilatory ratioc 905 1.96 [1.61–2.40] 1.86 [1.53–2.24] 2.11 [1.77–2.68] < 0.001 Position 967
Supine 658 (68.0%) 451 (74.0%) 219 (58.6%) < 0.001 Prone 285 (29.5%) 138 (23.3%) 145 (38.8%) < 0.001 Other 24(2.5%) 16 (2.7%) 9 (2.4%) 0.84
Page 8 of 13Torres et al. Crit Care (2021) 25:331
and the magnitude of the ventilatory ratio (+ 0.14 [–0.18 to + 0.47] vs. + 0.32 [–0.17 to + 0.75], p < 0.001) between survivors and non-survivors. In this regard, the delta of D-dimer was the only COVID-19 biomarker that dif-fered significantly between survivors and non-survivors
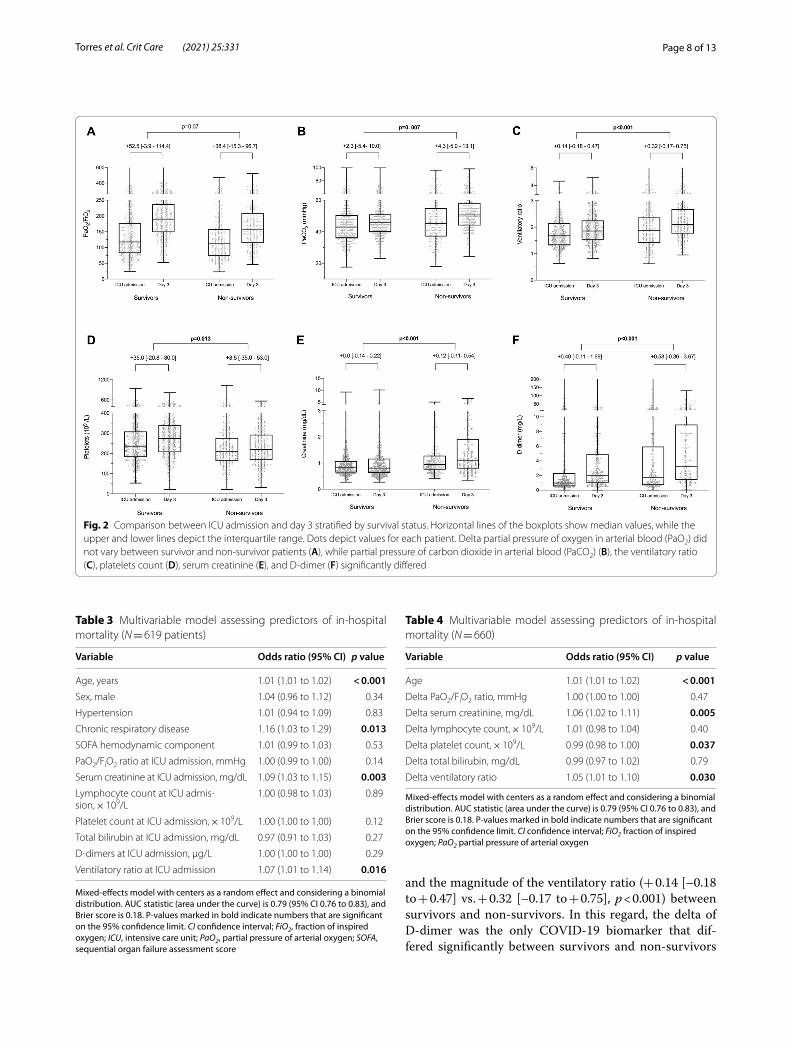
Fig. 2 Comparison between ICU admission and day 3 stratified by survival status. Horizontal lines of the boxplots show median values, while the upper and lower lines depict the interquartile range. Dots depict values for each patient. Delta partial pressure of oxygen in arterial blood (PaO2) did not vary between survivor and non‑survivor patients (A), while partial pressure of carbon dioxide in arterial blood (PaCO2) (B), the ventilatory ratio (C), platelets count (D), serum creatinine (E), and D‑dimer (F) significantly differed
Table 3 Multivariable model assessing predictors of in‑hospital mortality (N = 619 patients)
Mixed-effects model with centers as a random effect and considering a binomial distribution. AUC statistic (area under the curve) is 0.79 (95% CI 0.76 to 0.83), and Brier score is 0.18. P-values marked in bold indicate numbers that are significant on the 95% confidence limit. CI confidence interval; FiO2, fraction of inspired oxygen; ICU, intensive care unit; PaO2, partial pressure of arterial oxygen; SOFA, sequential organ failure assessment score
Variable Odds ratio (95% CI) p value
Age, years 1.01 (1.01 to 1.02) < 0.001Sex, male 1.04 (0.96 to 1.12) 0.34
Hypertension 1.01 (0.94 to 1.09) 0.83
Chronic respiratory disease 1.16 (1.03 to 1.29) 0.013SOFA hemodynamic component 1.01 (0.99 to 1.03) 0.53
PaO2/FiO2 ratio at ICU admission, mmHg 1.00 (0.99 to 1.00) 0.14
Serum creatinine at ICU admission, mg/dL 1.09 (1.03 to 1.15) 0.003Lymphocyte count at ICU admis‑sion, × 109/L
1.00 (0.98 to 1.03) 0.89
Platelet count at ICU admission, × 109/L 1.00 (1.00 to 1.00) 0.12
Total bilirubin at ICU admission, mg/dL 0.97 (0.91 to 1.03) 0.27
D‑dimers at ICU admission, μg/L 1.00 (1.00 to 1.00) 0.29
Ventilatory ratio at ICU admission 1.07 (1.01 to 1.14) 0.016
Table 4 Multivariable model assessing predictors of in‑hospital mortality (N = 660)
Mixed-effects model with centers as a random effect and considering a binomial distribution. AUC statistic (area under the curve) is 0.79 (95% CI 0.76 to 0.83), and Brier score is 0.18. P-values marked in bold indicate numbers that are significant on the 95% confidence limit. CI confidence interval; FiO2 fraction of inspired oxygen; PaO2 partial pressure of arterial oxygen
Variable Odds ratio (95% CI) p value
Age 1.01 (1.01 to 1.02) < 0.001Delta PaO2/FiO2 ratio, mmHg 1.00 (1.00 to 1.00) 0.47
Delta serum creatinine, mg/dL 1.06 (1.02 to 1.11) 0.005Delta lymphocyte count, × 109/L 1.01 (0.98 to 1.04) 0.40
Delta platelet count, × 109/L 0.99 (0.98 to 1.00) 0.037Delta total bilirubin, mg/dL 0.99 (0.97 to 1.02) 0.79
Delta ventilatory ratio 1.05 (1.01 to 1.10) 0.030
Page 9 of 13Torres et al. Crit Care (2021) 25:331
(+ 0.40 [–0.11 to + 1.69] vs. + 0.58 [–0.36 to + 3.67] mg/L, p = 0.001). Regarding other extrapulmonary biomarkers of organ dysfunction, the delta of creatinine levels was higher in non-survivors (+ 0.0 [–0.14 to + 0.22] vs. + 0.12 [–0.11 to + 0.54] mg/dL, p < 0.001), and the platelet count increase was higher in survivors (+ 35.0 [–20.8 to + 80.0] vs. + 8.5 [–35.0 to + 53.0] × 109/L, p = 0.013). Also, we found the variation of bilirubin was significantly higher in non-survivors (+ 0.04 [–0.16 to + 0.4] vs. + 0.05 [–0.16 to + 0.56] mg/dL, p = 0.023). All these variations are detailed in Fig. 2 and Additional file 1: Table 5. There were no correlations between ventilatory ratio and prog-nostic biomarkers, lung mechanics or gas exchange data except weak, yet significant correlations were found between ventilatory ratio and PEEP (r = 0.11, p < 0.001), PaO2/FiO2(r = − 0.19, p < 0.001) and driving pressure (r = 0.15, p = 0.004) at day 3 (Additional file 1: Fig. 3 and Table 6).
Treatments and complications during ICU admissionAmong the 1,118 patients, 986 (88.8%) patients received Hydroxychloroquine and 892 (80.4%) Lopinavir/Rito-navir during their ICU admission. Dexamethasone and methylprednisolone were used in 233 (21.4%) and 572 (52.4%) patients, respectively, while 499 (45.0%) were treated with Tocilizumab. Therapeutic anticoagulation with heparin was administered in 1065 (96.0%) patients. Those that survived to hospital discharge received this treatment more frequently [662 (97.1% of survivors) vs. 403 (94.4% of non-survivors); p = 0.04]. Coagula-tion disorders were present in 290 (26.0%) of the popu-lation, and hemorrhage complications were identified in 103 (9.2%) patients. Vasopressors were needed at any time of ICU admission in 1028 (92.6%) patients. Acute renal failure was identified in 493 (44.1%) patients, and 157 (14.1%) patients needed renal replacement therapy. Neuromuscular blockers were used at some point in 950 (85.9%) patients, and 482 (43.2%) patients needed tra-cheostomy. Recruitment maneuvers were used in 653 (61.8%) patients, prone positioning in 874 (79.0%), and in 20 (1.8%) cases extracorporeal respiratory support was needed. According to the Berlin definition, 76 (6.8%) had mild ARDS, 467 (41.8%) had moderate ARDS, and 575 (51.4%) had severe ARDS.
Although the vast majority of the cohort received antibiotic treatment (1102 patients, 99.2%), bacterial pneumonia was diagnosed in 368 (33.1%) of ventilated patients and bacteremia in 446 (40.0%). Thirty-three per-cent of patients had hepatic dysfunction. Pneumothorax [53(7.7%) vs 55 (12.7%), p = 0.007)] and hemorrhages [49(7.2%) vs 54 (12.7%), p = 0.004)] were more frequent in non-survivor patients. Additional file 1: Table 7 lists
COVID-19 therapies and other treatments, and Addi-tional file 1: Table 8 displays the major complications in this subpopulation of 1,118 patients.
Outcomes and predictors of in-hospital mortalityThe in-hospital mortality of all the COVID-19 patients admitted to an ICU during the study period was 32.6%, and that of patients needing intubation during the first 24 h was 40.2%.
In particular, in the cohort of patients still needing MV at day 3, we found an overall in-hospital mortality of 38.7%. Specifically on this subpopulation, ICU mor-tality was 37.5%, while 28-day mortality was 31.9%. The main causes of death were multiorgan failure (n = 179; 41.7%) and respiratory failure (n = 178; 41.5%). The dura-tion of MV, ICU, and hospital stay was 16.0 [9.0–27.0], 20.0 [11.0–32.0], and 30.0 [19.0–48.0] days, respectively (Additional file 1: Table 9).
After multivariable adjustment including variables at day 1 of ICU admission, older age, the presence of chronic respiratory disease, higher levels of creatinine, and a higher ventilatory ratio were significantly asso-ciated with an increased risk for in-hospital mortality (Table 3). Equivalent results were obtained when died or extubated patients during these first three days were included in the analysis (Additional file 1: Table 10).
Likewise, when we included in the model the change in variables between day 1 and 3 of ICU admission, we found that a higher increase in the ventilatory ratio (OR 1.04 [CI 1.01–1.07]) and the creatinine levels (OR 1.05 [CI 1.01–1.09]) and a lower increase in the platelet count (OR 0.96 [CI 0.93–1.00]) were significantly associated with a higher risk of death. (Table 4). Interestingly, we found that neither the initial PaO2/FiO2 ratio (0.97 [CI 0.94 to 1.01]) nor its variation (OR 0.99 [CI 0.95 to 1.02]) were associated with in-hospital mortality.
DiscussionThe current study focused on a very homogeneous popu-lation of COVID-19 patients that needed intubation and mechanical ventilation at day 1 of ICU admission and continued to be mechanically ventilated at day 3. The in-hospital mortality of these patients in the first wave of the pandemic was 38.7%. We investigated the factors associated with mortality at day 1 and more importantly, any changes between day 1 and day 3. The day 1 model found that age, chronic respiratory disease, increased serum creatinine, and increased ventilatory ratio were independent factors associated with in-hospital mortal-ity while the day 1 vs. day 3 model identified age, higher increase in serum creatinine from day 1 to day 3, lower increase in the number of platelets from day 1 to day 3,
Page 10 of 13Torres et al. Crit Care (2021) 25:331
and higher increase in ventilatory ratio from day 1 to day 3 as predictors of mortality.
The reported percentage mortality of COVID patients admitted to the ICU is very heterogeneous, ranging from 30 to 60%, and mainly due to mixed noninvasively and invasively mechanically ventilated populations, mixed periods of the pandemic and different endpoints. Our multicenter study shows the in-hospital mortal-ity of a very well-defined population that needed MV and remained ventilated 3 days after starting ventilation (38.7%).
At day 1, we found some demographic variables associ-ated with higher mortality such as age and chronic res-piratory diseases. These factors cannot be modified and simply reflect a more vulnerable population in whom COVID-19 has a worse evolution. Other studies con-firm that age and chronic respiratory diseases are poor prognostic factors both in ventilated, mixed ventilated and non-ventilated patients [15, 16]. Among laboratory tests, only higher serum creatinine at ICU admission was associated with in-hospital mortality. Remarkably, oxygenation at day 1 of MV was not a factor associated with higher mortality. The most comparable study to our investigation is that of Botta et al., who studied 533 mechanically ventilated Dutch COVID patients [17]. Like us, they found that age was associated with 28-day mortality, while PaO2/FiO2 was not. In our study, the ventilatory ratio at day 1 was associated with in-hospital mortality. Botta et al. [17] did not measure this surrogate marker of dead space. However, they showed that higher tidal volume and lower compliance were associated with increased 28-day mortality.
In this context, determining prognostic factors is cru-cial to detect those that are amenable to medical inter-vention. In many acute respiratory diseases that need MV, day 3 of evolution is crucial. In both severe commu-nity-acquired pneumonia [18] and ventilator-associated pneumonia [5], the differences between day 1 and day 3 in key physiological parameters are reliable predictors of evolution and prognosis. Therefore, we performed a sec-ond multivariable model comparing day 1 and day 3 of MV. Overall, we found that the deltas (difference day 3 vs. day 1) in platelet counts (lower increase), creatinine levels (higher increase) and ventilatory ratio (higher increase) were significantly associated with in-hospital mortality. Changes in oxygenation were not associated with lower mortality.
In particular, the changes found in serum creatinine levels and platelets counts reflect organ failure in severe COVID patients. Since COVID-19 is a systemic disease that can affect all organs, renal failure can occur due to direct kidney injury [19]. Alterations in coagulation may have a significant impact on the platelet count, which is
well described in severe COVID patients [19, 20]. Out-standingly, we found that increases in ventilatory ratio were associated with in-hospital mortality, while there was no evidence that changes in the degree of hypoxemia worsened the prognosis in our population of COVID-19 pneumonia ARDS patients.
The ventilatory ratio is a recently validated index that is appealing because it is simple to calculate using the minute ventilation and the PaCO2. It compares these two parameters to corresponding ideal and predicted values as a stand-in for Vd/Vt. This index has been vali-dated in controlled modes of MV. The ventilatory ratio depends on CO2 production, and any increase in CO2 production can modify its value. A value approximat-ing 1 would represent normal ventilating lungs [21]. In non-COVID ARDS patients, a high ventilatory ratio is associated with mortality [22, 23].
We have previously reported that the ventilatory ratio is elevated in COVID ARDS patients [24]. In a series of 267 COVID-ARDS patients, Schenck et al. [25] also found higher values in those patients that remained intubated at day 3 and 7. They also found significantly higher values in the 47 deceased patients (median ven-tilatory ratio of 2.26 [1.53–2.50]). In a sample of only 8 patients, Liu et al. [26] found the ventilatory ratio was lower in those patients that received lower tidal vol-umes. None of these three studies performed multivari-able analyses of mortality. Finally, the Provent COVID data [27] including 927 consecutive mechanically ven-tilated patients shows that the quantification of the impairment of ventilation using dead space estimates (dead space fraction, ventilatory ratio, and end-tidal to arterial PCO2 ratio), neither at baseline nor in the fol-lowing days, is not significantly associated with 28 day mortality. The exclusion or not of patients receiving ECMO was not specifically reported [27]. In addition, other important differences between this study and ours are that severity of ARDS was higher in our study ( 51% vs 10%) and that we have included delta differences between day 3 and day 1 which not seems to be the case in the Morales Quintero study [27].
Our multivariable regression models showed that an increase in ventilatory ratio at ICU admission was associ-ated with in-hospital mortality, with each unit increasing risk-of-death by 7% ([1–14], p = 0.015). Delta of ventila-tory ratio at day 3 was also associated with mortality, with each unit-increase rising risk-of-death by 5% ([1–10], p = 0.030). In comparison with previous studies in non-COVID ARDS patients, Sinha et al. found that ventila-tory ratio was independently associated with in-hospital mortality after adjusting for PaO2/FiO2 ratio and driving pressure (OR 1.51 [CI 1.09–2.12), p = 0.015) [22]. It can be argued that our findings on ventilatory ratio could be
Page 11 of 13Torres et al. Crit Care (2021) 25:331
expected after Sinha´s et al. results on non-COVID ARDS [22]. However, we think that they were necessary after all the controversies about ARDS COVID phenotypes. Another important difference compared to Sinha et al. [22] is that we demonstrated not only the prognostic value of ventilatory ratio at day 1 but the prognostic value at day 3 as well, which gives a lot consistency for our data.
Interpretation of the ventilatory ratio is complex, but it can be considered as a surrogate marker of physiologic dead space [22]. Increased dead space in COVID 19 may be due to a combination of hypoperfused alveoli due to microthrombosis of capillary alveoli plus interstitial edema that impairs pulmonary circulation [28]. In rela-tion to the first mechanism (microthrombosis), neither we nor Barbeta et al. [24] found a correlation between the blood levels of D-dimer and the ventilatory ratio. In addition, we did not find significant correlations of VR with platelets, or compliance. We found a weak correla-tion with PaO2/FiO2. Sinha et al. also found a negative correlation between PaO2/FiO2 and ventilatory ratio, suggesting that ventilation–perfusion mismatch conduct to hypercarbia and hypoxemia [22]. Nevertheless, in our study ventilatory ratio exceeds PaO2/FiO2 in predicting in-hospital mortality. In fact, for its association to the extent of poorly aerated lung tissue [29], the physiologic dead space has been suggested as a stronger predictor than oxygenation of the non-COVID ARDS outcomes [30]. Unlike typical ARDS, the profound hypoxemia observed in COVID-19 might be found in patients with relatively preserved lung volumes and respiratory com-pliances [1], thus probably not reflecting the burden of parenchymal disease [31, 32].
Moreover, patients with higher dead space usually need higher minute ventilation to avoid hypercarbia, lead-ing to an increase in lung injury due to higher dynamic mechanical power [33]. Indeed, the potential role of lung distension and ventilator-induced lung injury cannot be negligibly as the weak correlation between driving pres-sure and ventilatory ratio at day 3 might show. It is pos-sible that an increasing ventilatory ratio is a consequence of the progression of disease, but on the other hand it could also be a parameter that we could measure to mon-itor the evolution of the patient when applying specific treatments and ventilatory strategies.
There are several limitations of this study. First, our meas-urements on day 1 and 3 are only snapshots of the dynamic nature of COVID 19 respiratory failure (we chose the worst value). Second, we did not measure volumetric capnogra-phy, and consequently, we were unable to assess the effects of metabolic rate on gas exchange. Metabolic rate can vary during fever and neuromuscular blockade. Third, and due to the observational nature of the study, the ventilation proto-cols were not standardized, but the majority of centers used
protective ventilation strategies. Fourth, it has been shown that the ventilatory ratio is increased when HME filters are used in comparison with the use of heated humidifiers. HME filters were used in most of our patients. Finally, the lack of a control group of ARDS non-COVID-19 patients it is another potential limitation. However, to collect contem-porary solid data of this population was totally impossible due to the very low number of non-COVID patients admit-ted during the study period in the different ICU’s which could have made impossible a solid matching with COVID-19 ARDS patients.
The strengths of this study are its multicenter nature, the inclusion of a reasonably large number of patients with very homogeneous characteristics, and the perfor-mance of multivariable analysis on day 1 of MV and at day 3, allowing us to consider the magnitude of changes that took place between day 1 and 3.
ConclusionsIn conclusion, in a population of COVID 19 ARDS patients intubated at day 1 of ICU admission that remained ventilated after 3 days we found factors inde-pendently associated with in-hospital mortality both at day 1 and most importantly, changes that occurred between day 1 and day 3 that were predictors of out-come. Higher levels of creatinine and ventilatory ratio at day 1 and higher increase in ventilatory ratio and creati-nine levels and lower increase in platelets at day 3 were independently associated with in-hospital mortality. We found that age and chronic respiratory diseases were also independently associated with in-hospital mortality. The PaO2/FiO2 ratio at ICU admission and its worsening or improvement at day 3 was not associated with progno-sis. Further interventional and prospective studies are needed to determine treatments and strategies that could decrease the ventilatory ratio.
AbbreviationsARDS: Acute Respiratory Distress Syndrome; AUC : Area under the receiver operating characteristic curve; CI: Confidence interval; COVID‑19: Coronavirus disease 2019; CRP: C‑reactive protein; Crs: Compliance of the respiratory sys‑tem; ECMO: Extracorporeal membrane oxygenation; FiO2: Fraction of inspired oxygen; ICU: Intensive care unit; MV: Invasive mechanical ventilation; OR: Odds ratio; PaCO2: Partial pressure of carbon dioxide in arterial blood; PaO2: Partial pressure of oxygen in arterial blood; PBW: Predicted body weight; PEEP: Posi‑tive end‑expiratory pressure; SD: Standard deviation; SOFA: Sequential Organ Assessment Failure Score; STROBE: Strengthening the Reporting of Observa‑tional Studies in Epidemiology; VIF: Variance inflation factor; VILI: Ventilation‑induced lung injury; VR: Ventilatory ratio.
Supplementary InformationThe online version contains supplementary material available at https:// doi. org/ 10. 1186/ s13054‑ 021‑ 03727‑x.
Additional file 1. Supplementary tables and figures.
Page 12 of 13Torres et al. Crit Care (2021) 25:331
AcknowledgementsThe authors are indebted to Maria Arguimbau, Raquel Campo, Natalia Jarillo, Javier Muñoz, Elisabeth Sancho, and Manuel Sanchez for their extensive sup‑port in project management and article preparation. The authors also thank Ivan Caviedes from Clinica Alemana de Santiago de Chile for his critical review and insightful comments. CIBERESUCICOVID Collaborators to be included as individual members of the CIBERESUCICOVID group. Berta Adell‑Serrano, Alexander Agrifoglio, María Aguilar Cabello, Luciano Aguilera, Victoria Alcaraz‑Serrano, Cesar Aldecoa, Cynthia Alegre, Sergio Álvarez, Antonjo Álvarez Ruiz, Rut Andrea, José Ángel, Marta Arrieta, J Ignacio Ayestarán, Joan Ramon Badia, Mariona Badía, Orville Báez Pravia, Ana Balan Mariño, Begoña Balsera, Laura Barbena, Enric Barbeta, Tommaso Bardi, Patricia Barral Segade, Marta Barroso, José Ángel Berezo García, Judit Bigas, Rafael Blancas, María Luisa Blasco Cortés, María Boado, María Bodi Saera, Neus Bofill, María Teresa Bouza Vieiro, Leticia Bueno, Juan Bustamante‑Munguira, Lucia Cachafeiro, David Campi Hermoso, Sandra Campos Fernández, Iosune Cano, Maria Luisa Cantón‑Bulnes, Pablo Cardina Fernández, Laura Carrión García, Sula Carvalho, Núria Casacuberta‑Barberà, Manuel Castellà, Andrea Castellví, Pedro Castro, Ramon Cicuendez Ávila, Catia Cillóniz, Luisa Clar, Cristina Climent, Jordi Codina, Pamela Conde, Sofía Contreras, María Cruz Martin, Raul de Pablo Sánchez, Diego De Mendoza, Cecilia del Busto Martínez, Yolanda Díaz, María Digna Rivas Vilas, Cristina Dólera Moreno, Irene Dot, Pedro Enríquez Giraudo, Inés Esmorís Arijón, Teresa Farre Monjo, Javier Fernández, Carlos Fer‑rando, Albert Figueras, Eva Forcadell‑Ferreres, Lorena Forcelledo Espina, Nieves Franco, Àngels Furro, Felipe García, Beatriz García, Emilio García Prieto, Carlos García Redruello, Amaia García Sagastume, Maria Luisa Gascón Castillo, Gemma Gomà, Vanesa Gómez Casal, Silvia Gómez, Carmen Gómez Gonzalez, Jessica González, Federico Gordo, Maria Pilar Gracia, Alba Herraiz, Rubén Herrán‑Monge, Mercedes Ibarz, Silvia Iglesias, Maria Teresa Janer, Gabriel Jiménez, Mar Juan Díaz, Karsa Kiarostami, Juan I Lazo Álvarez, Miguel León, Alexandre López‑Gavín, Ana López Lago, Desire Macias Guerrero, Nuria Mamolar Herrera, Rafael Mañez Mendi‑luce, Cecilia L Mantellini, Gregorio Marco Naya, Pilar Marcos, Enrique Marmol Peis, Paula Martín Vicente, María Martínez, Carmen Eulalia Martínez Fernández, Maria Dolores Martínez Juan, Juan Fernando Masa Jimenez, Joan Ramon Masclans, Emilio Maseda, Eva María Menor Fernández, Mar Miralbés, Josman Monclou, Juan Carlos Montejo‑González, Neus Montserrat, María Mora Aznar, Pedro Moral‑Parras, Dulce Morales, Sara Guadalupe Moreno Cano, David Mosquera Rodríguez, Rosana Muñoz‑Bermúdez, José María Nicolás, Ramon Nogue Bou, Rafaela Nogueras Salinas, Marta Ocón, Ana Ortega, Sergio Ossa, Pablo Pagliarani, Anna Parera Pous, Francisco Parrilla, Leire Pérez Bastida, Purificación Pérez, Gloria Pérez Planelles, Eva Pérez Rubio, David Pestaña Laguna, Àngels Piñol‑Tena, Javier Prados, Andrés Pujol, Núria Ramon Coll, Gloria Renedo Sanchez‑Giron, Ferran Roche‑Campo, Laura Rodriguez, Felipe Rodríguez de Castro, Silvia Rodríguez, Cova‑donga Rodríguez Ruiz, Jorge Rubio, Alberto Rubio López, Miriam Ruiz Miralles, Pablo Ryan Murúa, Eva Saborido Paz, Ana Salazar Degracia, Miguel Sanchez, Ana Sánchez, Bitor Santacoloma, Maria Teresa Sariñena, Marta Segura Pensado, Lidia Serra, Mireia Serra‑Fortuny, Ainhoa Serrano Lázaro, Lluís Servià, Laura Soliva, Carla Speziale, Daniel Tognetti, Adrián Tormos, Mateu Torres, Sandra Trefler, Javier Trujil‑lano, Alejandro Úbeda, Luis Urrelo‑Cerrón, Estela Val, Luis Valdivia Ruiz, Montse Vallverdú, Maria Van der Hofstadt Martin‑Montalvo, Sabela Vara Adrio, Nil Vázquez, Javier Vengoechea, Pablo Vidal Cortes, Clara Vilà‑Vilardel, Judit Vilanova, Tatiana Villada Warrington, Hua Yang, Minlan Yang, Ana Zapatero.
Authors’ contributionsAT, AM, JR, LFB, and AC participated in protocol development, study design, study management, statistical analysis, and data interpretation, and wrote the first draft of the report. RP, DG and AG participated in statistical analysis and data interpretation. OP, JAL, AR, DdG, RM, JB, JM, RF and FB participated in study design, study management and interpretation and critically reviewed the first draft of the report. CiberesUCICOVID consortium participated in data collection. All authors read and approved the final manuscript.
FundingFinancial support was provided by the Instituto Carlos III de Madrid (COV20/00110, ISCIII) and by the Centro de Investigación Biomedica En Red – Enfermedades Respiratorias (CIBERES). DdGC has received financial support from Instituto de Salud Carlos III (Miguel Servet 2020: CP20/00041), co‑funded by European Social Fund (ESF)/”Investing in your future”.
Availability data and materialsThe datasets used and/or analyzed during the current study are available from the corresponding author on reasonable request.
Declarations
Ethics approval and consent to participateThe study was approved by the Institution’s Internal Review Board (Comité Ètic d’Investigació Clínica, registry number HCB/2020/0370) and informed consent was obtained from either patients or their relatives.
Consent for publicationNot applicable.
Competing interestsThe authors have disclosed that they do not have any conflicts of interest.
Author details1 Centro de Investigación Biomedica En Red – Enfermedades Respiratorias (CIBERES), Barcelona, Spain. 2 Institut d’Investigacions August Pi i Sunyer (IDIBAPS), Universitat de Barcelona, Barcelona, Spain. 3 Intensive Care Depart‑ment, Hospital Universitari Vall d’Hebron, Vall d’Hebron Institut de Recerca, Barcelona, Spain. 4 Barcelona Supercomputing Center (BSC), Barcelona, Spain. 5 Hospital Universitario de Getafe, Universidad Europea, Madrid, Spain. 6 Critical Care Department, Hospital Joan XXIII, Tarragona, Spain. 7 Translational Research in Respiratory Medicine, Respiratory Department, Hospital Universitari Aranu de Vilanova and Santa Maria, IRBLleida, Lleida, Spain. 8 Hospital Universitario Río Hortega de Valladolid, Valladolid, Spain. 9 Instituto de Investigación Biomédica de Salamanca (IBSAL), Gerencia Regional de Salud de Castilla y León, Salamanca, Spain. 10 Pulmonary Department, University and Polytechnic Hospital La Fe, Valencia, Spain. 11 Intensive Care Clinical Unit, Hospital Universi‑tario Virgen de Rocío, Sevilla, Spain. 12 Servicio de Medicina Intensiva, Hospital Universitario La Paz, IdiPAZ, Madrid, Spain. 13 Hospital Santa Maria, IRBLleida, Lleida, Spain. 14 Hospital Universitario HM Montepríncipe, Universidad San Pablo‑CEU, Madrid, Spain. 15 Servicio de Medicina Intensiva, Hospital Universi‑tario Ramón y Cajal, Madrid, Spain. 16 Department of Intensive Care Medicine, Hospital Clínico Universitario Valladolid, Valladolid, Spain. 17 Critical Care Department, Hospital Universitari Arnau de Vilanova, IRBLleida, Lleida, Spain. 18 Hospital Álvaro Cunqueiro, Vigo, Spain. 19 Intensive Care Unit, Hospital Clínico y Universitario de Valencia, Valencia, Spain. 20 Department of Intensive Care Medicine, Hospital Universitario, 12 de Octubre, Madrid, Spain. 21 Department of Medicine, CHUS, Complejo Hospitalario Universitario de Santiago, Santiago de Compostela, Spain. 22 Department of Intensive Care, Hospital Universitari de Bellvitge, L’Hospitalet de Llobregat, Barcelona, Spain. 23 Bellvitge Biomedi‑cal Research Institute (IDIBELL), L’Hospitalet de Llobregat, Barcelona, Spain. 24 Hospital de Mataró de Barcelona, Barcelona, Spain. 25 Department of Medi‑cine, Universitat Autònoma de Barcelona (UAB), Barcelona, Spain. 26 Critical Care Department, Corporació Sanitària Parc Taulí, Sabadell, Barcelona, Spain. 27 Departamento Medicina Facultad Medicina, Universidad de Cádiz, Hospital Universitario de Jerez, Jerez de la Frontera, Spain. 28 Unidad de Cuidados Inten‑sivos, Hospital San Pedro de Alcántara, Cáceres, Spain. 29 Intensive Care Unit, Hospital San Juan de Dios del Aljarafe, Sevilla, Spain. 30 Intensive Care Clinical Unit, Hospital Universitario Virgen Macarena, Seville, Spain. 31 Hospital General Universitario Gregorio Marañón, Madrid, Spain. 32 Pulmonary and Critical Care Division, Emergency Department, Clínica Sagrada Família, Barcelona, Spain. 33 Intensive Care Department, Hospital Nuestra Señora de Gracia, Zaragoza, Spain. 34 Unidad de Medicina Intensiva, Hospital Universitario Virgen de Valme, Sevilla, Spain. 35 Critical Care Department, Hospital del Mar‑IMIM, Barcelona, Spain. 36 Department of Intensive Medicine, Hospital Universitario Infanta Leonor, Madrid, Spain. 37 Critical Care Department, Hospital Universitario Lucus Augusti, Lugo, Spain. 38 Complejo Asistencial Universitario de Palencia, Palen‑cia, Spain. 39 Departamento de Biología Funcional, Instituto Universitario de Oncología del Principado de Asturias, Universidad de Oviedo, Oviedo, Spain. 40 Instituto de Investigación Sanitaria del Principado de Asturias, Hospital Central de Asturias, Oviedo, Spain. 41 Servei de Medicina Intensiva, Hospital Universitari Son Espases, Palma de Mallorca, Illes Balears, Spain. 42 Servicio de Medicina Intensiva, Hospital Universitario Marqués de Valdecilla, Santander, Spain. 43 UGC‑Medicina Intensiva, Hospital Universitario Reina Sofia, Instituto Maimonides IMIBIC, Córdoba, Spain. 44 Servei de medicina intensiva, Hospital Universitari Germans Trias, Badalona, Spain. 45 Hospital Verge de La Cinta, Tor‑tosa, Tarragona, Spain. 46 Hospital de Sant Joan d’Alacant, Alacant, Spain. 47 Ser‑vicio de medicina intensiva, Hospital Universitario y Politécnico La Fe, Valencia, Spain. 48 Intensive Care Unit, Hospital Son Llàtzer, Palma de Mallorca, Illes Balears, Spain. 49 Critical Care Department, Hospital Dr. Negrín Gran Canaria,
Page 13 of 13Torres et al. Crit Care (2021) 25:331
Las Palmas, Gran Canaria, Spain. 50 Intensive Care Unit, Hospital Universitario La Princesa, Madrid, Spain. 51 Critical Care Department, Hospital Universitario Río Hortega de Valladolid, Valladolid, Spain. 52 Servicio de Medicina Intensiva, Hospital Universitario Mútua de Terrassa, Terrassa, Barcelona, Spain. 53 Servei de Pneumologia i Al·lèrgia Respiratòria, Hospital Clínic, Villarroel 170, Esc 6/8 Planta 2, 08036 Barcelona, Spain.
Received: 6 July 2021 Accepted: 9 August 2021
References 1. Grasselli G, Zangrillo A, Zanella A, Antonelli M, Cabrini L, Castelli A, et al.
Baseline characteristics and outcomes of 1591 patients infected with SARS‑CoV‑2 admitted to ICUs of the Lombardy Region, Italy. JAMA. 2020;323(16):1574–81.
2. Lim ZJ, Subramaniam A, PonnapaReddy M, Blecher G, Kadam U, Afroz A, et al. Case Fatality Rates for Patients with COVID‑19 Requiring Invasive Mechanical Ventilation. A Meta‑analysis. Am J Respir Crit Care Med. 2021;203(1):54–66.
3. Spain; WgftsacoC‑i, Spain. MotWgftsacoC‑i. The first wave of the COVID‑19 pandemic in Spain: characterisation of cases and risk factors for severe outcomes, as at 27 April 2020. Euro surveillance : bulletin Europeen sur les maladies transmissibles = European communicable disease bulletin. 2020;25(50):2001431.
4. Schmidt M, Hajage D, Demoule A, Pham T, Combes A, Dres M, et al. Clinical characteristics and day‑90 outcomes of 4244 critically ill adults with COVID‑19: a prospective cohort study. Intensive Care Med. 2021;47(1):60–73.
5. Torres A, Sibila O, Ferrer M, Polverino E, Menendez R, Mensa J, et al. Effect of corticosteroids on treatment failure among hospitalized patients with severe community‑acquired pneumonia and high inflammatory response: a randomized clinical trial. JAMA. 2015;313(7):677–86.
6. Esperatti M, Ferrer M, Giunta V, Ranzani OT, Saucedo LM, Li Bassi G, et al. Validation of predictors of adverse outcomes in hospital‑acquired pneu‑monia in the ICU. Crit Care Med. 2013;41(9):2151–61.
7. Torres A, Arguimbau M, Bermejo‑Martín J, Campo R, Ceccato A, Fernandez‑Barat L, et al. CIBERESUCICOVID: a strategic project for a better understanding and clinical management of COVID‑19 in critical patients. Arch Bronconeumol. 2021;57(Suppl 2):1–2.
8. von Elm E, Altman DG, Egger M, Pocock SJ, Gøtzsche PC, Vandenbroucke JP. The Strengthening the Reporting of Observational Studies in Epidemi‑ology (STROBE) statement: guidelines for reporting observational studies. Lancet. 2007;370(9596):1453–7.
9. Caviedes I, Soto R, Torres A. Pulmonary angiopathy in severe COVID‑19: physiological conclusions derived from ventilatory ratio? Am J Respir Crit Care Med. 2021;203(2):258–9.
10. Ranieri VM, Rubenfeld GD, Thompson BT, Ferguson ND, Caldwell E, Fan E, et al. Acute respiratory distress syndrome: the Berlin Definition. JAMA. 2012;307(23):2526–33.
11. Knight SR, Ho A, Pius R, Buchan I, Carson G, Drake TM, et al. Risk stratifica‑tion of patients admitted to hospital with covid‑19 using the ISARIC WHO Clinical Characterisation Protocol: development and validation of the 4C Mortality Score. BMJ. 2020;370:m3339.
12. Gelman AHJ. Data analysis using regression and multilevel/hierarchical models New York: Cambridge University Press. 2007.
13. Hardin JWHJ. Generalized Linear Models and Extensions (2nd ed.). Stata press. 2007.
14. Kutner MH NC, Neter J Applied Linear Regression Models (4th ed.). McGraw‑Hill Irwin 2004.
15. Ahlström B, Frithiof R, Hultström M, Larsson IM, Strandberg G, Lipcsey M. The swedish covid‑19 intensive care cohort: Risk factors of ICU admission and ICU mortality. Acta Anaesthesiol Scand. 2021;65(4):525–33.
16. Guan WJ, Liang WH, Zhao Y, Liang HR, Chen ZS, Li YM, et al. Comorbidity and its impact on 1590 patients with COVID‑19 in China: a nationwide analysis. Eur Respir J. 2020;55(5).
17. Botta M, Tsonas AM, Pillay J, Boers LS, Algera AG, Bos LDJ, et al. Ventilation management and clinical outcomes in invasively ventilated patients with COVID‑19 (PRoVENT‑COVID): a national, multicentre, observational cohort study. Lancet Respir Med. 2021;9(2):139–48.
18. Esperatti M, Ferrer M, Giunta V, Ranzani OT, Saucedo LM, Li Bassi G, et al. Validation of predictors of adverse outcomes in hospital‑acquired pneu‑monia in the ICU*. Crit Care Med. 2013;41(9):2151–61.
19. Henry BM, de Oliveira MHS, Benoit S, Plebani M, Lippi G. Hematologic, biochemical and immune biomarker abnormalities associated with severe illness and mortality in coronavirus disease 2019 (COVID‑19): a meta‑analysis. Clin Chem Lab Med. 2020;58(7):1021–8.
20. Osuchowski MF, Winkler MS, Skirecki T, Cajander S, Shankar‑Hari M, Lachmann G, et al. The COVID‑19 puzzle: deciphering pathophysiology and phenotypes of a new disease entity. Lancet Respir Med. 2021:Online ahead of print.
21. Sinha P, Fauvel NJ, Singh S, Soni N. Ventilatory ratio: a simple bedside measure of ventilation. Br J Anaesth. 2009;102(5):692–7.
22. Sinha P, Calfee CS, Beitler JR, Soni N, Ho K, Matthay MA, et al. Physiologic analysis and clinical performance of the ventilatory ratio in acute respira‑tory distress syndrome. Am J Respir Crit Care Med. 2019;199(3):333–41.
23. Morales‑Quinteros L, Schultz MJ, Bringue J, Calfee CS, Camprubi M, Cre‑mer OL, et al. Estimated dead space fraction and the ventilatory ratio are associated with mortality in early ARDS. Ann Intensive Care. 2019;9(1):128.
24. Barbeta E, Motos A, Torres A, Ceccato A, Ferrer M, Cilloniz C, et al. SARS‑CoV‑2–induced acute respiratory distress syndrome: pulmonary mechanics and gas‑exchange abnormalities. Ann Am Thorac Soc. 2020;17(9):1164–8.
25. Schenck EJ, Hoffman K, Goyal P, Choi J, Torres L, Rajwani K, et al. Respira‑tory mechanics and gas exchange in COVID‑19‑associated respiratory failure. Ann Am Thorac Soc. 2020;17(9):1158–61.
26. Liu X, Liu X, Xu Y, Xu Z, Huang Y, Chen S, et al. Ventilatory ratio in hypercapnic mechanically ventilated patients with COVID‑19‑associ‑ated acute respiratory distress syndrome. Am J Respir Crit Care Med. 2020;201(10):1297–9.
27. Morales‑Quinteros L, Neto AS, Artigas A, Blanch L, Botta M, Kaufman DA, et al. Dead space estimates may not be independently associated with 28‑day mortality in COVID‑19 ARDS. Critical Care (London, England). 2021;25(1):171.
28. Patel BV, Arachchillage DJ, Ridge CA, Bianchi P, Doyle JF, Garfield B, et al. Pulmonary angiopathy in severe COVID‑19: physiologic, imaging, and hematologic observations. Am J Respir Crit Care Med. 2020;202(5):690–9.
29. Ball L, Robba C, Herrmann J, Gerard SE, Xin Y, Mandelli M, et al. Lung distribution of gas and blood volume in critically ill COVID‑19 patients: a quantitative dual‑energy computed tomography study. Crit Care. 2021;25(1):214.
30. Cressoni M, Cadringher P, Chiurazzi C, Amini M, Gallazzi E, Marino A, et al. Lung inhomogeneity in patients with acute respiratory distress syndrome. Am J Respir Crit Care Med. 2014;189(2):149–58.
31. Chiumello D, Busana M, Coppola S, Romitti F, Formenti P, Bonifazi M, et al. Physiological and quantitative CT‑scan characterization of COVID‑19 and typical ARDS: a matched cohort study. Intensive Care Med. 2020;46(12):2187–96.
32. Mauri T, Spinelli E, Scotti E, Colussi G, Basile MC, Crotti S, et al. Potential for lung recruitment and ventilation‑perfusion mismatch in patients with the acute respiratory distress syndrome from coronavirus disease 2019. Crit Care Med. 2020;48(8):1129–34.
33. Costa ELV, Slutsky AS, Brochard LJ, Brower R, Serpa‑Neto A, Cavalcanti AB, et al. Ventilatory variables and mechanical power in patients with acute respiratory distress syndrome. Am J Respir Crit Care Med. 2021;204(3):303–11.
Publisher’s NoteSpringer Nature remains neutral with regard to jurisdictional claims in pub‑lished maps and institutional affiliations.