seismicity near the hypocenter of the 2011 off the pacific ... · seismicity near the hypocenter...
TRANSCRIPT

Earth Planets Space, 64, 1125–1135, 2012
Seismicity near the hypocenter of the 2011 off the Pacific coast of Tohokuearthquake deduced by using ocean bottom seismographic data
Kensuke Suzuki1, Ryota Hino1, Yoshihiro Ito1, Yojiro Yamamoto2, Syuichi Suzuki1, Hiromi Fujimoto1, Masanao Shinohara3,Masao Abe4, Yoshiharu Kawaharada4, Yohei Hasegawa4, and Yoshiyuki Kaneda2
1Research Center for Prediction of Earthquakes and Volcanic Eruptions, Graduate School of Science, Tohoku University,6-6 Aza-Aoba, Aramaki, Aoba-ku, Sendai 980-8578, Japan
2Japan Agency for Marine-Earth Science and Technology, 3175-25 Showa-machi,Kanazawa-ku, Yokohama, Kanagawa 236-0001, Japan
3Earthquake Research Institute, University of Tokyo, Yayoi 1-1-1, Bunkyo-ku, Tokyo 113-0032, Japan4Japan Meteorological Agency, 1-3-4, Otemachi, Chiyoda-ku, Tokyo 100-8122, Japan
(Received December 27, 2011; Revised April 26, 2012; Accepted April 27, 2012; Online published January 28, 2013)
We relocated hypocenters of the foreshock, mainshock, and aftershocks of the 2011 off the Pacific coast ofTohoku earthquake (M 9.0) in the middle part of the Japan Trench where the earthquake rupture initiated. OceanBottom Seismographs (OBSs), deployed in the area, recorded the earthquakes and these data provide improvedimages of the hypocenter distribution. The mainshock hypocenter was relocated slightly westward from thatreported by Japan Meteorological Agency (JMA), placing it near the intersection between the plate boundaryand the Moho of the overriding plate. The foreshock seismicity mainly occurred on the trenchward side of themainshock hypocenter, where the Pacific slab contacts the island arc crust. The foreshocks were initially activatedat the up-dip limit of the seismogenic zone ∼30 km trenchward of the largest foreshock (M 7.3, two days beforethe mainshock). After the M-7.3 earthquake, intense interplate seismicity, accompanied by epicenters migratingtoward the mainshock hypocenter, was observed. The focal depth distribution changed significantly in response tothe M-9 mainshock. Earthquakes along the plate boundary were almost non-existent in the area of huge coseismicslip, whereas earthquakes off the boundary increased in numbers in both the upper and the lower plates.Key words: Tohoku-oki earthquake, Ocean Bottom Seismograph, seismicity, Miyagi-oki.
1. IntroductionOn March 11, 2011, a massive interplate earthquake
(M 9.0), the 2011 off the Pacific coast of Tohoku earthquake(hereafter, the Tohoku-oki earthquake), occurred along theJapan Trench subduction zone (Fig. 1), producing strongground shaking and high tsunamis that devastated the Pa-cific coast of northeastern Japan. In this region, interplatethrust faulting earthquakes along the subduction interfacehave occurred frequently, accommodating the relative mo-tion between the subducting Pacific plate and the over-riding North American plate. Among them, large earth-quakes with M 7–8 have repeatedly occurred at approxi-mately fifty-year intervals. Some studies have demonstratedthat these large interplate earthquakes can be interpretedas recurrent ruptures of persistent asperities whose loca-tions and sizes are time invariant (e.g., Nagai et al., 2001;Yamanaka and Kikuchi, 2004). In the middle part of thesubduction zone, where the hypocenter of the Tohoku-okiearthquake is located, the recurrence of interplate earth-quakes of M ∼ 7.5 (Miyagi-oki earthquakes) has been es-tablished on the basis of investigations into the past seismic-ity (http://www.jisin.go.jp/main/choukihyoka/kaikou.htm).
Copyright c© The Society of Geomagnetism and Earth, Planetary and Space Sci-ences (SGEPSS); The Seismological Society of Japan; The Volcanological Societyof Japan; The Geodetic Society of Japan; The Japanese Society for Planetary Sci-ences; TERRAPUB.
doi:10.5047/eps.2012.04.010
The most recent such earthquake (M 7.2) occurred on Au-gust 16, 2005. This earthquake was considered to be a par-tial re-rupturing of the asperities responsible for the recur-rent Miyagi-oki earthquakes, because the size of the rupturearea was smaller than that of the previous 1978 Miyagi-okiearthquake (Okada et al., 2005; Wu et al., 2008).
The seismicity near the Miyagi-oki region became moreactive than usual in the beginning of February 2011, almostone month before the Tohoku-oki earthquake occurred. Be-fore the Tohoku-oki earthquake, the largest earthquake wasan interplate earthquake with M 7.3, which occurred onMarch 9, 2011 (Fig. 1). Intensive aftershock seismicity, in-cluding moderate-sized (M 5–6) earthquakes, followed thatevent. In this paper, we refer to the earthquakes that pre-ceded the M-9 earthquake as foreshocks of the Tohoku-oki earthquake because of their proximity to the Tohoku-oki earthquake in terms of time and space. Further, fromthe hypocenter catalogue published by JMA, it has beenpointed out that the epicenters of the foreshocks migratedtoward the hypocenter of the mainshock of the Tohoku-okiearthquake (Ando and Imanishi, 2011; Kato et al., 2012).
The determination of precise hypocenter locations is im-portant for understanding the mechanisms of earthquakegeneration, because they can be used as the basis to com-pare fault rupture models and underground structure varia-tions. Interplate earthquakes typically occur in offshore ar-eas, far away from onshore seismic stations, and, hence, it
1125
1126 K. SUZUKI et al.: SEISMICITY NEAR THE HYPOCENTER OF THE 2011 TOHOKU-OKI EARTHQUAKE
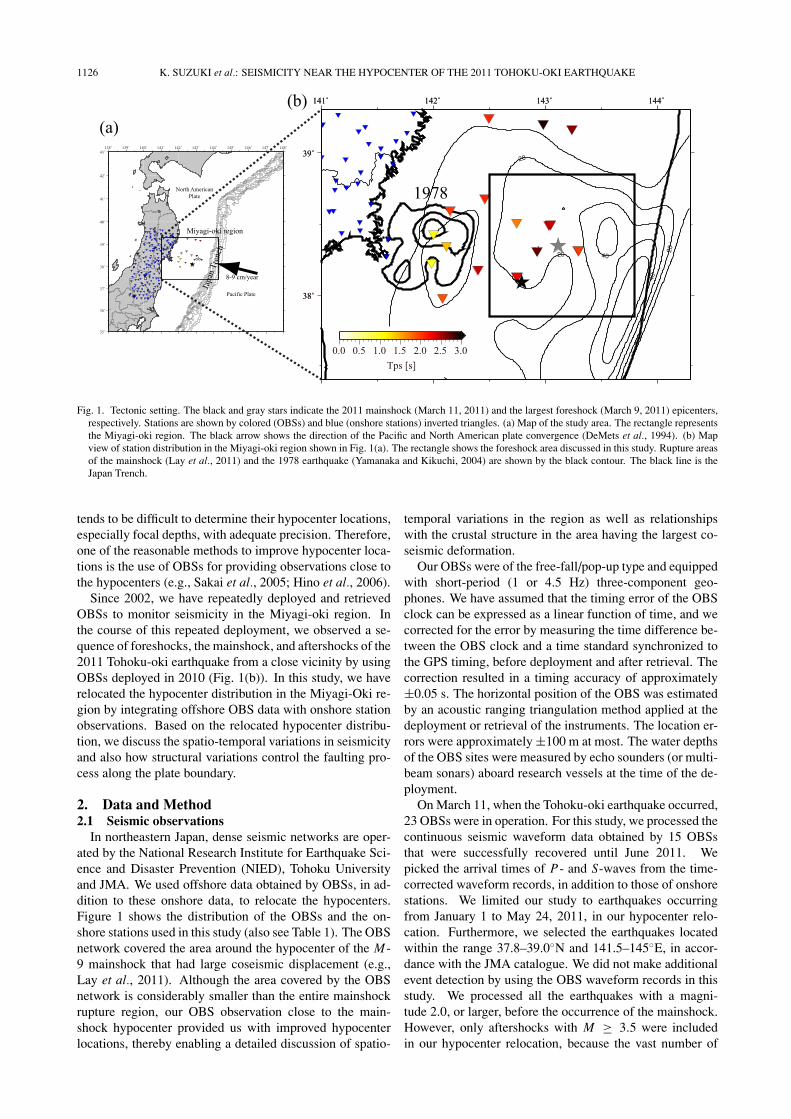
Fig. 1. Tectonic setting. The black and gray stars indicate the 2011 mainshock (March 11, 2011) and the largest foreshock (March 9, 2011) epicenters,respectively. Stations are shown by colored (OBSs) and blue (onshore stations) inverted triangles. (a) Map of the study area. The rectangle representsthe Miyagi-oki region. The black arrow shows the direction of the Pacific and North American plate convergence (DeMets et al., 1994). (b) Mapview of station distribution in the Miyagi-oki region shown in Fig. 1(a). The rectangle shows the foreshock area discussed in this study. Rupture areasof the mainshock (Lay et al., 2011) and the 1978 earthquake (Yamanaka and Kikuchi, 2004) are shown by the black contour. The black line is theJapan Trench.
tends to be difficult to determine their hypocenter locations,especially focal depths, with adequate precision. Therefore,one of the reasonable methods to improve hypocenter loca-tions is the use of OBSs for providing observations close tothe hypocenters (e.g., Sakai et al., 2005; Hino et al., 2006).
Since 2002, we have repeatedly deployed and retrievedOBSs to monitor seismicity in the Miyagi-oki region. Inthe course of this repeated deployment, we observed a se-quence of foreshocks, the mainshock, and aftershocks of the2011 Tohoku-oki earthquake from a close vicinity by usingOBSs deployed in 2010 (Fig. 1(b)). In this study, we haverelocated the hypocenter distribution in the Miyagi-Oki re-gion by integrating offshore OBS data with onshore stationobservations. Based on the relocated hypocenter distribu-tion, we discuss the spatio-temporal variations in seismicityand also how structural variations control the faulting pro-cess along the plate boundary.
2. Data and Method2.1 Seismic observations
In northeastern Japan, dense seismic networks are oper-ated by the National Research Institute for Earthquake Sci-ence and Disaster Prevention (NIED), Tohoku Universityand JMA. We used offshore data obtained by OBSs, in ad-dition to these onshore data, to relocate the hypocenters.Figure 1 shows the distribution of the OBSs and the on-shore stations used in this study (also see Table 1). The OBSnetwork covered the area around the hypocenter of the M-9 mainshock that had large coseismic displacement (e.g.,Lay et al., 2011). Although the area covered by the OBSnetwork is considerably smaller than the entire mainshockrupture region, our OBS observation close to the main-shock hypocenter provided us with improved hypocenterlocations, thereby enabling a detailed discussion of spatio-
temporal variations in the region as well as relationshipswith the crustal structure in the area having the largest co-seismic deformation.
Our OBSs were of the free-fall/pop-up type and equippedwith short-period (1 or 4.5 Hz) three-component geo-phones. We have assumed that the timing error of the OBSclock can be expressed as a linear function of time, and wecorrected for the error by measuring the time difference be-tween the OBS clock and a time standard synchronized tothe GPS timing, before deployment and after retrieval. Thecorrection resulted in a timing accuracy of approximately±0.05 s. The horizontal position of the OBS was estimatedby an acoustic ranging triangulation method applied at thedeployment or retrieval of the instruments. The location er-rors were approximately ±100 m at most. The water depthsof the OBS sites were measured by echo sounders (or multi-beam sonars) aboard research vessels at the time of the de-ployment.
On March 11, when the Tohoku-oki earthquake occurred,23 OBSs were in operation. For this study, we processed thecontinuous seismic waveform data obtained by 15 OBSsthat were successfully recovered until June 2011. Wepicked the arrival times of P- and S-waves from the time-corrected waveform records, in addition to those of onshorestations. We limited our study to earthquakes occurringfrom January 1 to May 24, 2011, in our hypocenter relo-cation. Furthermore, we selected the earthquakes locatedwithin the range 37.8–39.0◦N and 141.5–145◦E, in accor-dance with the JMA catalogue. We did not make additionalevent detection by using the OBS waveform records in thisstudy. We processed all the earthquakes with a magni-tude 2.0, or larger, before the occurrence of the mainshock.However, only aftershocks with M ≥ 3.5 were includedin our hypocenter relocation, because the vast number of

K. SUZUKI et al.: SEISMICITY NEAR THE HYPOCENTER OF THE 2011 TOHOKU-OKI EARTHQUAKE 1127
Table 1. Free-fall/pop-up and cabled OBSs used in this study.
Station Observation Lat. Lon. Dep. Tps
period (◦N) (◦E) (km) (s)
S01 2010/11/05∼2011/05/22 38.3502 142.1169 0.524 1.4
S02 2010/11/05∼2011/05/22 37.9836 142.0827 0.538 1.9
S03 2010/11/05∼2011/04/14 38.1834 142.3997 1.052 2.4
S08 2010/05/15∼2011/02/01 38.1336 142.7485 1.532 2.3
S10 2010/10/01∼2011/03/19 38.4984 143.0341 1.981 2.4
S14 2010/07/01∼2011/05/23 38.5138 142.7457 1.459 1.7
S15 2010/07/01∼2011/05/23 38.3138 142.9276 1.454 2.7
S18 2010/07/01∼2011/03/19 38.3191 143.2960 2.770 2.0
S21 2010/11/05∼2011/05/22 38.4319 142.0019 0.358 1.1
S22 2010/11/05∼2011/05/22 38.2292 141.9838 0.299 1.0
S27 2010/11/05∼2011/05/22 38.6003 142.1501 0.545 2.0
LS1 2010/11/05∼2011/04/14 38.6840 142.4606 1.112 2.1
NS08a 2011/03/15∼2011/04/19 38.1354 142.7482 1.498 2.3
NS10a 2011/03/15∼2011/04/19 38.5016 143.0495 2.017 2.4
NS18a 2011/03/15∼2011/04/19 38.3181 143.2984 2.746 2.0
OB1 39.1667 143.239 2.480 2.6
OB2 39.2029 142.984 1.840 2.9
OB3 39.2451 142.498 1.057 2.1
earthquakes after the mainshock made it difficult to processevents with M < 3.5. We selected 970 local earthquakesthat occurred in the Miyagi-oki region. As a result, 43,464and 29,523 picked arrival times of P- and S-waves, respec-tively, were used.2.2 Initial hypocenters
In this paper, we have used two stages for the hypocenterlocation process: (1) rough relocation of the JMA hypocen-ters by using a 1-D velocity model, and (2) hypocenterdetermination by using a 3-D structure model. Since thehypocenter locations reported in the JMA catalogue may beill-constrained owing to the lack of close-in observations,we preferred to use those hypocenters determined by thefirst step as the initial hypocenters in stage (2).
In the first step of hypocenter determination, we appliedstation corrections for the OBS arrival time data. The ob-served arrival time data at the OBS stations were signifi-cantly delayed owing to low P- and S-wave velocities inthe sedimentary layer just beneath the seafloor. In the sameway as described by Hino et al. (2000), we estimated thetime delays due to the sedimentary layer from the arrival-time differences (Tps) between the direct P- and S-wavesconverted from the direct P-wave at the base of the sedi-mentary layer. Assuming constant P- and S-wave veloc-ities in the sediment and basement, the delay times (�Ti ,i = P , S) can be estimated as:
�Ti = Tps
(V s
p V ss
V sp − V s
s
) (1
V si
− 1
Vi
). (1)
Here, V sp and Vp are the P-wave velocities in the sediment
and basement, respectively, and V ss and Vs are the S-wave
velocities in the sediment and basement, respectively. Inthis study, we assumed V s
p and V ss to have constant values
of 1.80 km/s and 0.60 km/s, respectively. In the case of Vp
and Vs , we used the values at zero depth in the 1-D velocitymodel used for the hypocenter calculation.
Fig. 2. The 1-D velocity structure model used to estimate the initialhypocenter locations. The solid and dashed lines are for the modelsused in this study and the average velocity of the 3-D model estimatedby Yamamoto et al. (2008), respectively.
Our 1-D velocity model comprised two spherical shellscorresponding to the crust and mantle layers (Fig. 2). Wereferred to the 3-D structure model estimated in the Miyagi-oki region by Yamamoto et al. (2008) to obtain appropriatevalues of P- and S-wave velocities in the two layers, as well

1128 K. SUZUKI et al.: SEISMICITY NEAR THE HYPOCENTER OF THE 2011 TOHOKU-OKI EARTHQUAKE
Fig. 3. Comparison of the hypocenter distribution between those relocated (black), and those from the JMA catalogue (gray), in the vicinity of themainshock hypocenter shown in Fig. 1(b). The stars and open stars denote the mainshock and the largest foreshock, respectively. (a) Map view. (b)Cross-section of rectangle shown in the map view. (c) Epicenter distance from the JMA catalogue of the relocated earthquakes.
as the crustal thickness. In the model, the crustal thicknesswas 24 km. The Vp/Vs values were 1.84 and 1.74 for thecrust and mantle, respectively.2.3 Relocation using a 3-D model
The hypocenters estimated by the first step assumingthe 1-D model were used as the initial hypocenters for amore detailed hypocenter determination using a 3-D struc-ture model. We applied a code developed for Double-Difference (DD) tomography method (Zhang and Thurber,2003, 2006). We used a known 3-D model for travel timecalculations, and travel time residuals were solved only forhypocenter coordinates and origin times, but not for veloc-ity perturbations. The velocity model was kept unchangedin the process. For the 3-D velocity model, we used amodel derived by Yamamoto et al. (2008) who investigated3-D P- and S-wave structures using on- and off-shore pas-sive seismic observation data. In our hypocenter relocation,travel time differences between event pairs, i.e., DD traveltimes, were used as well as absolute times. In this calcu-lation, we selected stations and earthquakes from the relo-cated ones in the first step according to the following cri-teria: (1) stations whose distance to the earthquake epicen-ter was smaller than 200 km; (2) earthquakes whose epi-central distance to the nearest station was smaller than 40km; and (3) earthquakes observed by stations with an az-
imuth coverage larger than 90◦. We obtained the DD datafor event pairs with separations less than 15 km. The DDswere calculated from arrival time data picked manually, af-ter corrections for the travel time delays due to the surfacesediments. Both the P- and S-wave data were used in therelocation, but the weights of the S-wave data in the inver-sion were taken as 1/3 of those of the P-wave data in orderto account for the smaller picking accuracies of the S-wavereadings. Our criteria were satisfied by 824 earthquakes,and we inverted the absolute 25,276(P)/19,421(S) and rel-ative 53,882(P)/41,449(S) travel time data for hypocenterlocations. The root mean square of the travel time residualsreduced from 1.10(P)/1.23(S) s for the initial hypocentersto 0.23(P)/0.69(S) s after 30 iterations.
3. ResultBefore discussing the relocated hypocenter distributions
in detail, we present comparisons of our hypocenter loca-tions with those in the JMA catalogue to demonstrate howthe hypocenter distribution has been improved by addingthe OBS data. Figures 3(a) and (b) show the epicenter dis-tribution and focal depth distribution, respectively, aroundthe hypocenter of the Tohoku-oki earthquake. The relocatedhypocenters clearly show more concentrated patterns thanthe JMA hypocenters, especially in the focal depth distri-

K. SUZUKI et al.: SEISMICITY NEAR THE HYPOCENTER OF THE 2011 TOHOKU-OKI EARTHQUAKE 1129
Table 2. Relocated hypocenters of the mainshock and largest foreshock.
Lat. Lon. Dep. Del. from JMA Az. to JMA
(◦N) (◦E) (km) (km) (◦)
Mainshock 38.0919 142.7897 28 6 258
Largest foreshock 38.2477 143.1164 23 14 279
Fig. 4. Hypocenter distribution. The dark gray and black dots show the relocated hypocenters of 2011 earthquakes before and after the 2011 mainshock.Light gray dots show the earthquake that occurred between 2004 and 2009 (background seismicity). (a) Map view. (b) Cross section of the rectangleshown in the map view.
bution. Because most of the earthquakes in this area werethrust-type, the landward dipping planar structure of the re-located hypocenters is more plausible than the scattered pat-tern of the JMA hypocenters.
The relocated hypocenter of the mainshock (also seeTable 2) shifted by ∼6 km westward from the JMAhypocenter. The hypocenter of the largest foreshock, theM-7.3 earthquake on March 9, shows a larger differencewith a westward shift of ∼13 km in the epicenter. Al-though these two major earthquakes have westward relo-cation shifts (or an eastward mislocation of JMA epicen-ters), these are not representative of the systematic patternsof shifts in the epicenters due to the relocation. In general,the relocation shifts show an elongated pattern with a largescatter in the EW direction (Fig. 3(c)). The center of thedistribution suggests that the relocated epicenters tend to beshifted eastward from the JMA ones. The elongated pat-
tern indicates poorer resolutions of the JMA epicenters inthe EW direction coinciding with the dip direction of thesubducting interface than in the NS (strike) direction.
The obtained hypocenter distribution is shown in Fig. 4.In the figure, the hypocenters of the earthquakes from 2004to 2009 are also displayed to show the background seismic-ity in this area. The pre-2011 hypocenters were also relo-cated by using OBS data, but the selection criteria appliedto the pre-2011 earthquakes were eased because the numberand density of OBSs were smaller for the early observationperiod. Nevertheless, the method of hypocenter determina-tion was identical to that applied to the 2011 earthquakes.
As can be seen in the epicenter distribution, the back-ground seismicity is fairly heterogeneous in space, andforms several clusters of concentrated epicenters separatedby zones of almost no seismicity. Most of the epicentersof the earthquakes in 2011 are located in these clusters of

1130 K. SUZUKI et al.: SEISMICITY NEAR THE HYPOCENTER OF THE 2011 TOHOKU-OKI EARTHQUAKE
Fig. 5. Hypocenter and focal mechanism distributions of earthquakes that occurred in 2011. The dots show hypocenters. The focal mechanismsestimated by F-net are colored according to its type classified by the rake angle—red: thrust (rake > 45◦); green: strike-slip (−45◦ < rake < 45◦);and blue: normal-fault (rake < −45◦). (a) Before the mainshock (from 1 January, 2011, to the mainshock). (b) After the mainshock (mainshock to24 May, 2011).
background seismicity. Furthermore, in the focal depth dis-tribution, the pre-2011 and 2011 earthquakes form a similarlandward dipping plane. The most notable characteristic ofthe spatial pattern is an aseismic region (or low seismicityregion) along the landward side of the trench axis. Becausewe relocated the hypocenter locations of earthquakes se-lected from the JMA catalogue, it is possible that this aseis-mic region reflects a low detectability of the JMA cataloguealong the landward side of the trench axis apart from on-shore stations. Here, we checked b-values of the relocatedearthquakes in the landward and trenchward areas of themainshock hypocenter. If the difference in detectability issubstantial, cutoff magnitudes of frequency-magnitude re-lations must be different between the two areas. The cutoffmagnitude estimated in the landward area was 3.5, whereasthat in the trenchward area was 3.5 ∼ 4.0. Considering thissmall difference, it is very unlikely that a significant num-ber of earthquakes were overlooked only within the narrowzone along the Japan Trench. Furthermore, the existence ofthis aseismic zone has already been pointed out by previousOBS studies in the Japan Trench area (e.g., Hirata et al.,1985) and this is regarded as a stable structure. Althoughthe spatial distribution of the seismicity changed consider-ably before and after the occurrence of the M-9 Tohoku-oki earthquake, as will be explained below, the near-trenchzone had a low seismicity compared with the more land-ward area throughout the observation period. A small num-ber of earthquakes were located within the zone after themainshock. Judging from their focal depths and mecha-nisms, they seem to have occurred in the subducting oceanic
plate; however, no interplate or shallow crustal events weredetected in the trenchward zone.
A detailed examination of the hypocenter distributionshows that the distributions before, and after, the main-shock of the Tohoku-oki earthquake are different from eachother. Moreover, this difference is prominent in the case ofthe focal-depth distribution (Fig. 4). The hypocenters be-fore March 11 tend to concentrate along the dipping planeto a greater degree than those after March 11. We plot-ted the focal mechanisms estimated by the F-net waveformmonitoring by NIED (http://www.fnet.bosai.go.jp) at the re-located hypocenters from the present study (see Fig. 5).Since thrust-type focal mechanisms are dominant for earth-quakes before the mainshock (from 1 January, 2011 to themainshock, Fig. 5(a)), the shallow dipping plane of thehypocenters is interpreted as the megathrust plane. After themainshock (from mainshock to 24 May, 2011), hypocenterstended to be located systematically away from the plane,both upward and downward (Fig. 4), indicating that theinterplate seismicity diminished while the earthquakes offthe plane became dominant. Most of the off-plane earth-quakes identified from the focal depth distribution werenot thrust type but tended to have normal-fault type mech-anisms (Fig. 5(b)), as reported by Asano et al. (2011).Other non-thrust type earthquakes included a large intraslabearthquake (M 7.1, April 7) and a normal faulting shallowearthquake (M 6.5, March 28) followed by their own af-tershocks. In addition to these pronounced activities, therewere numerous earthquakes in both the overriding and sub-ducting plates, and the proportion of these intraplate events

K. SUZUKI et al.: SEISMICITY NEAR THE HYPOCENTER OF THE 2011 TOHOKU-OKI EARTHQUAKE 1131
to the interplate ones increased significantly after the main-shock.
Detailed investigations of hypocenter distributions as-sociated with M < 8 interplate earthquakes using OBSdata have indicated that the aftershocks of such interplateearthquakes mostly occurred along the plate boundary, andthrust-type events dominated (e.g., Hino et al., 2000, 2006).The seismicity during March 9 to 11, which is interpretedas the aftershock activity of the M-7.3 earthquake, fol-lowed the typical spatial distribution pattern, a concentra-tion of thrust-type events along the plate boundary. How-ever, the pattern changed markedly after the M-9 main-shock on March 11. For previous interplate earthquakes,it has been observed that the number of aftershocks tendsto be smaller in the vicinity of the zones of large coseis-mic displacement (i.e., asperity) (e.g., Nagai et al., 2001).In the aftershock activity of the 1994 Sanriku earthquake, acluster in the overriding plate was found near the low activ-ity region corresponding to the asperity of the earthquake(Hino et al., 2000). Since the coseismic slip amount wasthe largest in the Miyagi-oki region and further up-dip (e.g.,Lay et al., 2011), the change in the seismicity distributionafter the mainshock can be interpreted by similar increasesin the off plate boundary seismicity near asperities with fewaftershocks.
Numerous earthquakes have occurred in the hanging wallof the plate boundary in this area: for example, Uchida etal. (2010) and Yamamoto et al. (2011) have found severalearthquake clusters (supra-slab earthquakes) in the hangingwall of the plate boundary along the Japan Trench, includ-ing the Miyagi-oki area. However, the exact location ofthe post-M 9 shallow seismicity is not identical to that ofthe supra-slab earthquakes. It is possible that the spatialpatterns of the seismicity in the Miyagi-oki region werechanged by the mainshock rupture, in a similar mannerto the inland changes in patterns reported by Toda et al.(2011).
4. Discussion4.1 Foreshock seismicity near the mainshock hypocen-
terWe examine the foreshock activity in terms of its spatio-
temporal variations based on the relocated hypocenter dis-tribution. Map view and space-time plots of the foreshocksare shown in Figs. 6 and 7, respectively. In these space-time plots, the relocated epicenters are projected onto twoorthogonal axes, the X -axis is taken in the dip direction ofthe plate boundary, and the Y -axis in the strike directionsub-parallel to the trench strike. The origin is set as theepicenter of the largest foreshock (M 7.3, March 9, LFS,Fig. 7).
The first foreshock activity was a moderate (M 5.5) earth-quake on February 16. The seismicity was relatively mod-est for the first ∼25 days (period-I). Several M ∼ 5foreshocks occurred intermittently during this period andthe seismicity presented a swarm-like pattern rather than amainshock/aftershock pattern. Our relocation results indi-cate that the foreshock activity initiated at the border be-tween the active seismogenic area of the background seis-micity and the aseismic zone near the Japan Trench. Since
no foreshocks were located within the aseismic zone, theactivity effectively began at the up-dip end of the seismo-genic area. It is notable that the foreshock activity in period-I was concentrated along the up-dip edge. Although therewas no evident increase in the seismicity in the landwardarea (X > 0), a sequence of foreshocks was observed atX ∼ −30 km. In the space-time plot along the dip (Y ) di-rection, the activity appears to have migrated southward at∼1.8 km/day.
The foreshock became considerably more active after theLFS occurred, i.e., for the last two days before the main-shock (period-II). The foreshock activity can be interpretedas the aftershocks of the LFS, as explained above. Theepicenter of the LFS was located ∼20 km landward of thefringe of the foreshocks in period-I, but the space betweenthe early foreshock activity and the LFS was filled by theforeshocks in period-II (aftershocks of the M-7.3 earth-quake). A southward migration of the foreshock epicenterscan also be observed during period-II, but at a faster (∼6.7km/day) speed (Fig. 7(d)). This result supports early stud-ies on foreshock migration based on the onshore stations(Ando and Imanishi, 2011; Kato et al., 2012). Those workshad pointed out that the foreshock activity migrated towardthe MS, presumably as a result of diffusional propagation ofthe LSF afterslip. Moreover, in contrast to the active seis-micity on the trenchward side of the MS hypocenter, fewearthquakes occurred in the down-dip side and the south-ern side of the MS epicenter (Figs. 7(c) and (d)); this maysuggest that the afterslip did not propagate beyond the MShypocenter. If the foreshocks in period-I were also asso-ciated with a slow aseismic slip, as in period-II, the narrowforeshock distribution suggests that the aseismic slip did notpropagate in the down-dip direction in the early stage of theforeshock activity.4.2 Comparison with seismic structure models
Since the earthquakes with thrust-type mechanisms arepresumably located along the plate boundary, the locationsof those hypocenters must be good indicators of the bound-ary. Further, since most of the foreshocks, including thelargest foreshock, were thrust-type events, the shallow dip-ping plane formed by their relocated hypocenters (Fig. 4) isexpected to correspond to the geometry of the plate bound-ary in this region. On the other hand, the geometry of theplate boundary has been estimated by previous active seis-mic explorations by travel time analyses of the clear seis-mic reflection signals from the slab surface. We show ahistogram of the relative depths of the foreshocks (Fig. 8)measured from the plate boundary modeled by Ito et al.(2005). Contrary to expectations, the peak does not appearat 0 in the relative depth but at ∼ +5 km. Since the peakis very narrow, the depth discrepancies appear to be almostconstant for the sampled hypocenters. These results indi-cate that the dipping plane of the hypocenter distribution isparallel to the modeled plate boundary, with a depth sys-tematically greater by ∼5 km. This discrepancy might bea result of the poor assumption of P- and S-wave veloci-ties (Vp and Vs) in the shallow sedimentary layer used forour hypocenter determination procedure. As discussed byHino et al. (2006), the focal depths determined by the OBSdata are strongly affected by the Vp/Vs ratio assumed for

1132 K. SUZUKI et al.: SEISMICITY NEAR THE HYPOCENTER OF THE 2011 TOHOKU-OKI EARTHQUAKE
Fig. 6. Hypocenter distribution in the foreshock area shown in Fig. 1(b). Hypocenters that occurred between −30 and 0 days before the mainshock areplotted by dots colored according to the elapsed time from the mainshock. (a) Map view. (b) Cross-section of the rectangle shown in the map view.
the shallow sedimentary layer, but it is difficult to obtain re-liable estimations of Vp/Vs . The plate boundary model wasderived from P-wave based observations without errors dueto the uncertainties in Vs and can be expected to be betterconstrained than our focal-depth estimations. Therefore, weregard our focal depths to be biased to a deeper part by ∼5km. It is possible to obtain optimum Vp/Vs values that givefocal depths that are more consistent with the plate bound-ary model by further analyses, and this remains a topic forour future work.
In Fig. 9, the relocated hypocenters are plotted on a 2-DVp model obtained by an airgun-OBS wide-angle seismicsurvey conducted in the Miyagi-oki area (Ito et al., 2005).In the figure, the focal depths are shifted upward by 5 kmfrom the calculated values to remove the possible bias in ourhypocenter solutions. Although this manipulation makes itdifficult to interpret the focal depths in an absolute sense,the results are still of valuable to understand how the seis-
micity in the Miyagi-oki region is related to the structurevariations along the dip direction. After shifting the fo-cal depths, the mainshock (and largest foreshock) are stilldeeper than the plate boundary and plane formed by thethrust-type earthquakes. Hino et al. (2006) determined thehypocenter distribution of the main- and aftershocks of the2005 Off Miyagi Prefecture earthquake and reported a sim-ilar discrepancy of the mainshock from the plate boundary.This result might be caused by ill-conditioned pickings ofS-wave arrival time, or the lack of those of mainshock andlargest foreshocks at OBS stations.
The thickness of the overriding Tohoku arc crust underthe Miyagi-Oki region is approximately 20 km, and theplate boundary meets the Moho (crust-mantle boundary)of the overriding crust at this depth. The location of themainshock hypocenter almost coincides with that of theintersection of the plate boundary and the Moho. Sincethe activity of the foreshocks was significantly different on

K. SUZUKI et al.: SEISMICITY NEAR THE HYPOCENTER OF THE 2011 TOHOKU-OKI EARTHQUAKE 1133
Fig. 7. Space-time distribution projected using two orthogonal axes shown in Fig. 6. The stars show the LFS (Largest ForeShock) and MS (MainShock).(a) Space-time plot between −30 and 0 days before the MS of the seismicity along the dip of the subducting plate boundary (X -axis). (b) Space-timeplot between −30 and 0 days before the MS of the seismicity along the strike of the subducting plate boundary (Y -axis). (c) Space-time plot of theseismicity along the X -axis from the LFS to the MS. (d) Space-time plot of the seismicity along the Y -axis from the LFS to the MS.
the trenchward and landward sides of the hypocenter of themainshock, the difference can be interpreted in terms of thedifferences in the structure above the plate boundary. On thetrenchward side of the mainshock hypocenter, where mostof the foreshocks occurred, the shallow dipping subductingPacific slab contacts the continental crustal layer (slab-crustcontact zone). In contrast, no significant foreshocks wereobserved in the landward side of the mainshock hypocenter,where the Pacific slab contacts the forearc mantle (slab-mantle contact zone).
The mainshock hypocenter can be a good reference pointto compare the rupture process of the Tohoku-oki earth-quake and the seismic structure near the plate boundary. Inmany studies (e.g., Lay et al., 2011; Yagi and Fukahata,2011), the estimated coseismic slip amount was substan-tially larger toward the trenchward side of the hypocen-ter than the landward (down-dip) side. This tendency canbe interpreted as the slab-crust contact zone accommodat-ing more coseismic slip than the slab-mantle contact zone.In the slab-crust contact zone, the interplate seismicity hasbeen active, including the occurrence of foreshocks, untilthe mainshock took place, but it diminished drastically inthe aftershock activity. In the slab-mantle contact zone, al-though the number of thrust-type earthquakes decreased af-ter the mainshock, they did not vanish, in contrast to theslab-crust contact zone.
Besides the difference of the hanging wall side materials,the geometry of the subducting Pacific slab may be relevantto the spatial pattern of the seismicity. In the Miyagi-Okiregion, Ito et al. (2005) pointed out that the slab abruptly
Fig. 8. Histogram of the relative depths of the foreshocks that occurredin the foreshock area (Fig. 1(b)) and between −30 and 0 days beforethe mainshock, measured from the plate boundary modeled by Ito et al.(2005).
changes its dip angle and further that the spatial extent ofthe rupture areas of the M < 8 class Miyagi-Oki earth-quakes seems to be delimited by the bending points of theslab. Comparing the location of the slab bending points (at∼50 and ∼110 km in Fig. 9, according to Ito et al., 2005)with the spatial pattern of the foreshock/aftershock activityof the Tohoku-Oki earthquake, it seems that the trenchward

1134 K. SUZUKI et al.: SEISMICITY NEAR THE HYPOCENTER OF THE 2011 TOHOKU-OKI EARTHQUAKE
Fig. 9. (a) Map of the seismic survey line used in Ito et al. (2005). Black and gray contours are rupture areas of the 2011 (Lay et al., 2011) and 1978(Yamanaka and Kikuchi, 2004) earthquakes. (b) Comparison between the hypocenter locations and the 2-D Vp model obtained by Ito et al. (2005).The earthquakes before and after the 2011 mainshock are shown by the gray and black dots, respectively. Focal mechanisms of large earthquakesestimated by F-net are shown.
bending point delimits concentrated foreshocks. The bend-ing of the plate boundary may cause a variation of stressaround the plate boundary, and as a result seismicity varia-tion might occur in response to that stress distribution.
Although it is difficult to single out the seismogenicmechanism from a number of proposed models, more de-tailed discussions of the relationship between hypocenterlocations, fault segmentation and the material structure con-trast around the plate boundary, are important for consider-ing the seismogenic mechanism in terms of metamorphicenvironments (e.g., Hyndman and Peacock, 2003). It isnecessary for those discussions to obtain a detailed seismicstructure, including the trenchward area. This is part of ourfuture work, as well as verifying if focal depths and mod-eled plate boundary locations are consistent.
Our list of hypocenter locations relocated bythe present study using OBSs data can be down-loaded from http://www.aob.geophys.tohoku.ac.jp/˜suzuki/hypoEPS2012suzuki.dat.
5. ConclusionIn this study, we have relocated the hypocenters of the
foreshocks, mainshock, and aftershocks of the 2011 off thePacific coast of Tohoku earthquake that occurred on March11, 2011, by using the arrival time data obtained by 15temporally deployed OBSs, 3 cabled OBSs, and onshoreseismic stations. Although the seismicity in the Miyagi-Oki region was high in the central part of the Japan Trenchsubduction zone, the spatial distribution of the hypocenters
changed significantly in response to the M-9 mainshockoccurrence throughout the observation period. The earth-quakes prior to the mainshock formed a landward dippingplane indicating active interplate seismic activity. In con-trast, the number of interplate earthquakes, identified by thefocal depths and mechanisms, decreased considerably af-ter the mainshock, while intraplate activity, off the plateboundary, occurred simultaneously in both the overridingand subducting plates.
The foreshock activity started near the up-dip limit ofthe active interplate seismicity and no foreshocks were lo-cated in the aseismic near-trench zone, as identified by thebackground seismicity. The area of the foreshock activ-ity showed minor expansions along the strike of the plateboundary but almost no down-dip propagation until a largeforeshock (M 7.3) occurred on March 9. After the M-7.3foreshock, the seismicity rapidly increased with migrationtoward the mainshock hypocenter. The foreshock activitywas observed mainly on the trenchward side of the main-shock hypocenter, where the subducting Pacific slab con-tacts the crust of the Tohoku arc, but did not expand furtherlandward where the slab contacts the forearc mantle.
Acknowledgments. We thank T. Lay and an anonymous reviewerfor providing thoughtful reviews, which helped us to improve thismanuscript. This study was supported by the MEXT project,“Evaluation and disaster prevention research for the coming Tokai,Tonankai and Nankai earthquakes”. We thank the captain, crewsand scientists on board several research vessels for their kind sup-port of the OBS observations. We are grateful to NIED and JMAfor allowing us to use focal mechanisms or arrival time data at

K. SUZUKI et al.: SEISMICITY NEAR THE HYPOCENTER OF THE 2011 TOHOKU-OKI EARTHQUAKE 1135
onshore stations. Figures were prepared using Generic MappingTools software (Wessel and Smith, 1995).
ReferencesAndo, R. and K. Imanishi, Possibility of Mw 9.0 mainshock triggered
by diffusional propagation of after-slip from Mw 7.3 foreshock, EarthPlanets Space, 63, 767–771, 2011.
Asano, Y., T. Saito, Y. Ito, K. Shiomi, H. Hirose, T. Matsumoto, S. Aoi,S. Hori, and S. Sekiguchi, Spatial distribution and focal mechanismsof aftershocks of the 2011 off the Pacific coast of Tohoku Earthquake,Earth Planets Space, 63, 669–673, 2011.
DeMets, C., R. G. Gordon, D. F. Argus, and S. Stein, Effect of recentrevisions to the geomagnetic reversal time scale on estimates of currentplate motions, Geophys. Res. Lett., 21, 2191–2194, 1994.
F-net, NIED, NIED CMT solutions, http://www.fnet.bosai.go.jp, 2011.Hino, R., S. Ito, H. Shiobara, H. Shimamura, T. Sato, T. Kanazawa,
J. Kasahara, and A. Hasegawa, Aftershock distribution of the 1994Sanriku-oki earthquake (Mw 7.7) revealed by ocean bottom seismo-graphic observation, J. Geophys. Res., 105, 21697–21710, 2000.
Hino, R., Y. Yamamoto, A. Kuwano, M. Nishino, T. Kanazawa, T. Yamada,K. Nakahigashi, K. Mochizuki, M. Shinohara, K. Minato, G. Aoki,N. Okawara, M. Tanaka, M. Abe, E. Araki, S. Kodaira, G. Fujie, andY. Kaneda, Hypocenter distribution of the main- and aftershocks ofthe 2005 Off Miyagi Prefecture Earthquake located by ocean bottomseismographic data, Earth Planets Space, 58, 1543–1548, 2006.
Hirata, N., T. Kanazawa, K. Suehiro, and H. Shimamura, A seismicity gapbeneath the inner wall of the Japan trench as derived by ocean bottomseismography measurement, Tectonophysics, 112, 193–209, 1985.
Hyndman, D. R. and S. M. Peacock, Serpentinization of the forearc mantle,Earth Planet. Sci. Lett., 212, 417–432, 2003.
Ito, A., G. Fujie, S. Miura, S. Kodaira, and Y. Kaneda, Bending of thesubducting oceanic plate and its implication for rupture propagationof large interplate earthquakes off Miyagi, Japan, in the Japan Trenchsubduction zone, Geophys. Res. Lett., 32, doi:10.1029/2004GL022307,2005.
Kato, A., K. Obara, T. Igarashi, H. Tsuruoka, S. Nakagawa, and N. Hirata,Propagation of slow slip leading up to the 2011 Mw 9.0 Tohoku-OkiEarthquake, Science, 335, 705-708, 2012.
Lay, T., C. J. Ammon, H. Kanamori, L. Xue, and M. J. Kim, Possible largenear-trench slip during the 2011 Mw 9.0 off the Pacific coast of TohokuEarthquake, Earth Planets Space, 63, 687–692, 2011.
Nagai, R., M. Kikuchi, and Y. Yamanaka, Comparative study on the sourceprocess of recurrent large earthquakes in Sanriku-oki region: The 1968Tokachi-oki earthquake and the 1994 Sanriku-oki earthquake, J. Seis-mol. Soc. Jpn., 52, 267–289, 2001 (in Japanese with English abstract).
Okada, T., T. Yaginuma, N. Umino, T. Kono, T. Matsuzawa, S. Kita, andA. Hasegawa, The 2005 M7.2 MIYAGI-OKI earthquake, NE Japan:
Possible rerupturing of one of asperities that caused the previous M7.4earthquake, Geophys. Res. Lett., 32, doi:10.1029/2005GL024613, 2005.
Sakai, S., T. Yamada, M. Shinohara, H. Hagiwara, T. Kanazawa, K. Obana,S. Kodaira, and Y. Kaneda, Urgent aftershock observation of the 2004off the Kii Peninsula Earthquake using ocean bottom seismometers,Earth Planets Space, 57, 363–368, 2005.
Toda, S., R. S. Stein, and J. Lin, Widespread seismicity excitation through-out central Japan following the 2011 M = 9.0 Tohoku earthquake andits interpretation by Coulomb stress transfer, Geophys. Res. Lett., 38,L00G03, doi:10.1029/2011GL047834, 2011.
Uchida, N., S. H. Kirby, T. Okada, R. Hino, and A. Hasegawa,Supraslab earthquake clusters above the subduction plate bound-ary offshore Sanriku, northeastern Japan: Seismogenesis in a grave-yard of detached seamounts?, J. Geophys. Res., 115, B09308,doi:10.1029/2009JB006797, 2010.
Wessel, P. and W. H. F. Smith, New version of the Generic Mapping Toolsreleased, Eos Trans. AGU, 76, 329, 1995.
Wu, C., K. Koketsu, and H. Miyake, Source process of the 1978 and2005 Miyagi-Oki, Japan, earthquake: Repeated rupture of asperitiesover successive large earthquakes, J. Geophys. Res., 113, B08316,doi:10.1029/2007JB005189, 2008.
Yagi, Y. and Y. Fukahata, Rupture process of the 2011 Tohoku-oki earth-quake and absolute elastic strain release, Geophys. Res. Lett., 33,L19307, doi:10.1029/2011GL048701, 2011.
Yamamoto, Y., R. Hino, K. Suzuki, Y. Ito, T. Yamada, M. Shinohara, T.Kanazawa, G. Aoki, M. Tanaka, K. Uehira, G. Fujie, Y. Kaneda, T.Takanami, and T. Sato, Spatial heterogeneity of the mantle wedge struc-ture and interplate coupling in the NE Japan forearc region, Geophys.Res. Lett., 35, L23304, doi:10.1029/2008GL036100, 2008.
Yamamoto, Y., R. Hino, and M. Shinohara, Mantle wedge structure in theMiyagi Prefecture forearc region, central northeastern Japan arc, and itsrelation to corner-flow pattern and interplate coupling, J. Geophys. Res.,116, B10310, doi:10.1029/2011JB008470, 2011.
Yamanaka, Y. and M. Kikuchi, Asperity map along the subduction zonein northeastern Japan inferred from regional seismic data, J. Geophys.Res., 109, B07307, doi:10.1029/2003JB002683, 2004.
Zhang, H. and C. H. Thurber, Double-Difference Tomography: TheMethod and Its Application to the Hayward Fault, California, Bull. Seis-mol. Soc. Am., 93, 1875–1889, 2003.
Zhang, H. and C. H. Thurber, Development and applications of double-difference seismic tomography, Pure Appl. Geophys., 163, 373–403,doi:10.1007/s00024-005-0021-y, 2006.
K. Suzuki (e-mail: [email protected]), R. Hino, Y. Ito,Y. Yamamoto, S. Suzuki, H. Fujimoto, M. Shinohara, M. Abe, Y.Kawaharada, Y. Hasegawa, and Y. Kaneda