selected problems of stability of steel structurespbc.gda.pl/content/51037/565 iwicki piotr...
TRANSCRIPT

monografie
105
POLITECHNIKA GDAŃSKA
kolo
r -
2768C
, nakła
d -
100, fo
lia -
bły
sk
ISBN 978-83-7348-328-6
W Y D A W N I C T W O
PIOTR IWICKI
SELECTED PROBLEMS
OF STABILITY
OF STEEL STRUCTURES
20
10

GDAŃSK 2010
POLITECHNIKA GDAŃSKA
PIOTR IWICKI
SELECTED PROBLEMS
OF STABILITY
OF STEEL STRUCTURES

PRZEWODNICZĄCY KOMITETU REDAKCYJNEGO WYDAWNICTWA POLITECHNIKI GDAŃSKIEJ
Romuald Szymkiewicz
REDAKTOR PUBLIKACJI NAUKOWYCH
Janusz T. Cieśliński
REDAKTOR SERII
Jerzy M. Sawicki
RECENZENCI
Jakub Marcinowski Czesław Szymczak
PROJEKT OKŁADKI Jolanta Cieślawska
Wydano za zgodą Rektora Politechniki Gdańskiej
Oferta wydawnicza Politechniki Gdańskiej jest dostępna na stronie www.pg.gda.pl/wydawnictwoPG
© Copyright by Wydawnictwo Politechniki Gdańskiej, Gdańsk 2010
Utwór nie może być powielany i rozpowszechniany, w jakiejkolwiek formie i w jakikolwiek sposób, bez pisemnej zgody wydawcy
ISBN 978−83−7348−328−6
WYDAWNICTWO POLITECHNIKI GDAŃSKIEJ
Wydanie I. Ark. wyd. 13,1, ark. druku 12,0, 1005/565
Druk i oprawa: EXPOL P. Rybiński, J. Dąbek, Sp. Jawna ul. Brzeska 4, 87-800 Włocławek, tel. 54 232 37 23

CONTENTS
LIST OF SYMBOLS ................................................................................................................... 7
1. INTRODUCTION................................................................................................................... 9 1.1. General remarks ............................................................................................................... 9 1.2. Scope of the work............................................................................................................. 14
2. REVIEW OF REQUIREMENTS CONCERNING BRACING.............................................. 19 2.1. Code requirements concerning bracing ........................................................................... 19 2.2. Code requirements concerning sway and non-sway frames ............................................ 22 2.3. Classical approach concerning bracing............................................................................ 23 2.4. Column on elastic foundation.......................................................................................... 26
3. SENSITIVITY ANALYSIS OF BUCKLING LOADS OF THIN-WALLED STRUC-TURAL MEMBERS............................................................................................................... 28 3.1. First variation of buckling load due to variation of continuously distributed design
variables........................................................................................................................... 30 3.1.1. First variation of flexural-torsional buckling load due to variation of cross-
section dimensions or variation of bracing stiffness ............................................. 31 3.1.2. First variation of torsional buckling load .............................................................. 32 3.1.3. First variation of flexural buckling load................................................................ 33 3.1.4. First variation of critical loads due to variation of residual stresses ..................... 34 3.1.5. Sensitivity analysis of buckling load of thin-walled columns due to temperature
change ................................................................................................................... 37 3.2. The first variation of the buckling loads due to the variation of stiffeners location ................. 42
3.2.1. The first variation of the critical load of torsional buckling due to the variation of stiffeners location.............................................................................................. 42
3.2.2. First variation of the flexural buckling load due to the variation of lateral brace location.................................................................................................................. 45
3.3. Sensitivity analysis of critical buckling loads of discrete structural systems................... 46 3.4. Linear approximation of exact relation between critical load and design variable.......... 47 3.5. Parametrical analysis of structures .................................................................................. 47
4. BUCKLING OF BRACED COLUMNS ................................................................................ 50 4.1. Sensitivity analysis of buckling loads of I-section columns due to variation of cross-
section dimensions and residual stresses ......................................................................... 50 4.2. Sensitivity analysis of buckling loads of I-section columns with bracing elements ........ 56
4.2.1. Column with discrete lateral braces ...................................................................... 56 4.2.2. Column with warping stiffeners............................................................................ 58 4.2.3. Column with torsional stiffeners........................................................................... 60 4.2.4. Column braced by corrugated plate ...................................................................... 64
4.3. Sensitivity of buckling loads of I-section columns due to temperature variations .......... 75
5. BUCKLING OF BRACED FRAMES.................................................................................... 79 5.1. Frame with bracing modelled as elastic springs .............................................................. 81
5.1.1 Description of the model....................................................................................... 81 5.1.2. Results of numerical simulation............................................................................ 82
5.2. Frame braced by a vertical column.................................................................................. 90

Contents 6
5.2.1. Description of the model....................................................................................... 90 5.2.2. Results of numerical simulations .......................................................................... 90
5.3. One-storey frame with bracing ........................................................................................ 96 5.4. Ten-storey braced frame with columns of constant stiffness........................................... 97
5.4.1. Description of the model....................................................................................... 97 5.4.2. Results of numerical simulation............................................................................ 98
5.5. Ten-storey braced frame with columns of variable stiffness ........................................... 102 5.5.1. Description of the model....................................................................................... 102 5.5.2. Results of numerical simulation............................................................................ 102
6. BUCKLING OF BRACED TRUSSES................................................................................... 107 6.1. Truss with horizontal elastic braces................................................................................. 109
6.1.1. Description of the model....................................................................................... 109 6.1.2. Results of numerical simulation............................................................................ 110
6.2. Truss with sloping elastic braces ..................................................................................... 116 6.2.1. Description of the model....................................................................................... 118 6.2.2. Results of the numerical simulation ...................................................................... 120
6.3. Truss with lateral and torsional braces............................................................................. 127 6.3.1. Torsional brace...................................................................................................... 128 6.3.2. Description of the model....................................................................................... 128 6.3.3. Results of numerical simulations .......................................................................... 131
6.4. Truss with braces placed in top and bottom chord........................................................... 139 6.4.1. Description of the model....................................................................................... 140 6.4.2. Results of numerical simulations .......................................................................... 141
6.5. Sensitivity analysis of buckling load of truss with braces ............................................... 145 6.5.1. Truss with lateral braces ....................................................................................... 146 6.5.2. Truss with torsional braces.................................................................................... 161 6.5.3. Truss with torsional and lateral braces.................................................................. 165
6.6. Sensitivity analysis of limit loads of truss with elastic braces ......................................... 168 6.7. Numerical verification of experimental research of truss with elastic braces.................. 172
6.7.1. Description of model............................................................................................. 172 6.7.2. Results of numerical and experimental tests ........................................................ 173
6.8. Part of 3D roof structure with bracing ............................................................................. 178 6.8.1. Part of the roof structure with truss bracing.......................................................... 178 6.8.2. Part of the roof structure with flexural bracing ..................................................... 180
7. FINAL REMARKS................................................................................................................. 182
REFERENCES............................................................................................................................. 184 SUMMARY IN ENGLISH.......................................................................................................... 191 SUMMARY IN POLISH............................................................................................................. 193

LIST OF SYMBOLS
A – cross-section area Ac – cross-section of the compressed part of the member Aeff – effective cross-section area B – bimoment b – I section flange width e0 – maximum amplitude of a member imperfection E – Young’s modulus of elasticity ET – Young’s modulus of elasticity at temperature T F – flexibility matrix F0 – equivalent stabilizing force for one braced element Fm – equivalent stabilizing force for m braced elements fd – steel strength fdT – reduced steel strength at temperature T fy – yield strength fyk – characteristic yield strength G – shear modulus of elasticity h – depth of I section or frame storey height H – total horizontal load or reaction J – moment of inertia J0 – polar moment of inertia Jω – warping section constant Jd – torsion section constant K – stiffness matrix KG – initial stress stiffness matrix (geometrical matrix) k – stiffness of elastic spring kbr – stiffness of bracing element kv – stiffness of lateral restraint kΘ – stiffness of torsional restraint kΘ’ – stiffness of warping restraint kr – coefficient L – member length L0 – reference effective length l1 – brace spacing le – effective length m – number of restrained members or half-waves of buckling mode M – bending moment Ms – torque Mt – Saint-Venant torsional moment Mω – warping torque N – normal force Nc – normal force in the compressed part of the member Ncr – critical axial compression force NRc – load-bearing capacity of column cross-section Nb,Rd – design buckling resistance No,Rd – design local buckling resistance p – load per unit length P – external load

List of symbols
8
Pcr – critical load Pbr – axial load-carrying capacity of column non-sway buckling mode Pubr – axial load-carrying capacity of column sway buckling mode q – equivalent stabilizing load per unit length r0 – radius of gyration AJr /00 =
Rw – residual stress constant tf – thickness of I section flange tw – thickness of I section web T – shear force or cross-section temperature u – design variable u – design variables vector v – displacement in direction y v0 – amplitude of imperfection in direction y V – total potential energy or total vertical load z – nodal displacement vector α – ratio, factor or coefficient of bracing stiffness αm – reduction factor for m restrained members γ – partial safety factor, ratio δ(...) – first variation of (…) δi – displacement at i η – coefficient Θ – twisting angle of the cross-section κ – torsion parameter
dGJ EJωκ =
λ – slenderness ratio or Lagrangian multiplier λ – relative slenderness ratio
,crP uΛ – under-integral sensitivity function of Pcr due to variation of u
μ – buckling length factor ν – Poissson ratio σres – residual stresses σ1 – residual stresses parameter σ2 – residual stresses parameter σc – residual stresses parameter x,y,z – coordinate axes ϕ – angle, ratio or factor ϕT – reduced stability coefficient at temperature T ψF – inclination of unbraced frame ψFbr – inclination of braced frame

Chapter 1
INTRODUCTION
1.1. General remarks
Steel structures, such as trusses, beams or frames have a much greater strength and stiffness in their plane where the load is applied than out-of their plane, and therefore those elements are designed to carry the loading in their plane. It is known that the effect of struc-tural imperfections or various inaccuracies, residual post-welding or rolling stresses which occurs during the manufacturing process, often decrease the nominal load-carrying capacity of those structures. Bracing at discrete points or even along the whole length of the beams, columns or the trusses span is frequently used to increase the buckling strength. The pur-pose of structural mechanics is to create and analyse some theoretical models of real engi-neering structures. These models allow to obtain the relation between the design variables and the structure response such as: internal forces, displacements or buckling loads. There-fore all kinds of design variables such as: cross-section dimensions, material characteristics, residual stresses or bracing parameters, and their influence on the structural carrying-capacity are the subject of design codes (see, for example, Polish Code 1990, 2006, Euro-code 3 1992, 2005, British Standard 5950 2000, Chinese Code GB50017 2003), and books (see, for example Biegus 1997, 2003, Bródka et al. 1999, 2004, Pałkowski 2009, Rykaluk 1981, Thompson and Hunt 1973, Trahair 1993, Weiss and Giżejowski 1991).
There have been numerous investigations of the effects of various elastic restraints on the buckling load of structures, and studies of structure models with some imperfections have been of great concern to researchers. The problem of bracing requirements for purlins was investigated by Chu et al. (2005). In the research the influence of the lateral restraint provided by cladding on the lateral-torsional buckling of zed-purlin beams was considered. Analytical solutions of the problems of global and local buckling for cold-formed thin-walled channel beams with open or closed profile of drop flanges were presented by Mag-nucki and Paczos (2009). Kołakowski and Kowal-Michalska (1999) discussed instabilities in composite thin-walled structures. The simplified formulas for buckling length factor of frame columns were proposed by Giżejowski and Żółtowski (1986). The influence of vari-ous inaccuracies of structure or stiffness or flexibility of connections between frame mem-bers on the buckling load was studied among others by Giżejowski et al. (1987), Giże-jowski (1998), Kozłowski (1999) or Giżejowski et at. (2008). The decrease of buckling load when an influence of elastic-plastic behavior of frames is taken into account was the subject of research by Cichoń and Waszczyszyn (1979) and Giżejowski et at. 2006a. Buck-ling of thin-walled frames with partial warping restraints has been studied by Cichoń et al. 2000. The studies of braced frames conducted by Özmen and Girgin (2005) and Girgin et al. (2006) indicated that simplified formulae for buckling length of frames, present in design codes might yield erroneous results. The storey buckling approach of frames has been the subject of research by Mageirou, et al. (2006). In the work conducted by Tong and Shi (2001), or Tong and Ji (2007) stability of multi-storey frames braced by vertical beams was analysed. Numerical analyses of bracing requirements for inelastic castellated beams were carried out by Mohebkhah and Showkati (2005), or in the case of cantilevers, by

1. Introduction 10
Bradford (1998). Investigations of elastic flexural-torsional buckling of steel beams with rigid and continuous lateral restraints were presented by Larue et al. (2007). Both theoreti-cal solutions and model tests of spatial stability problems of laterally and longitudinally braced steel I-section columns have been presented by Gosowski (1992) and (2003). Brac-ing requirements of inelastic columns have been investigated by Gil and Yura (1999). Restrained distortional buckling of I-section beam-column with both lateral and torsional braces has been described by Vrcelj and Bradford (2006).
Fig. 1.1. Industrial hall
Fig. 1.2. Silo structure (Wójcik et al. 2010b)
A similar problem of trusses with side supports was investigated only in few studies, as for example, in a numerical analysis by Jankowska-Sandberg, and Pałkowski (2002) or Biegus and Wojczyszyn (2004, 2005, 2006) or Jankowska-Sandberg et al. (2003a, 2003b). In the above mentioned research concerning trusses the side-supports were assumed to be rigid, and on the basis of this condition it has been found that the buckling length of truss chord is lower than the side-support distance. One of the reasons for that conclusion is force distribution along the chord. The normal force in chord is usually maximal in the middle of the truss, while near the supports the force is lower. For this reason part of the chord where the normal force is lower has a positive influence on reducing the buckling length in those parts with normal force reaching the maximal value. Another explanation for the buckling length reduction is the positive influence of verticals, diagonals and tension chord in stiff-ening the compressed chord of the truss. To the best of the author’s knowledge only in experimental research carried out by Kołodziej and Jankowska-Sandberg (2006) or in

1.1. General remarks 11
numerical studies conducted by Iwicki (2006, 2007a, 2007b, 2007d and 2007f, 2010a) the side supports of truss were considered to be elastic.
In order to increase the limit load of trusses, beams or columns, those structures should be braced against lateral deflection and twisting. One can consider the side supports, like purlins or corrugated decking, as part of the bracing system (Bródka et al. 1999). Those elements bear the forces caused by imperfect beams or trusses onto the horizontal bracing installed at the ends of the roof. The bracing is usually constructed as a truss on the roof plane. Some examples of roof truss structures are presented in Fig. 1.1 and Fig. 1.3. The side supports of trusses and beams not only stabilize the roof trusses or beams against dis-tortional buckling, but also carry vertical loads, as for example, the wind loading. In the case of columns the bracing is provided by wall rails or by corrugated plate of the walls, as for example, in a silo column stiffened by means of a wall plate (Fig. 1.2).
There are various kinds of braces, as for example, restraints against lateral displace-ment of the member axis, torsional restraints against the member cross-section rotation, and warping restraints against the cross-section warping. All the mentioned kinds of bracing may reduce the column effective length and cause an increase of the buckling load. The rotational restraints are responsible for an interaction between the purlin bending and the truss torsion. The restraint stiffness depends on the connection between the truss and the purlins. Various structural elements, such as, purlins or the sheeting connected to the bear-ing trusses, beams or columns affect specially the lateral torsional buckling of the main elements because torsion of one element is correlated with bending of another element. The restraints may be modelled as rotational springs (Iwicki 2007e, 2008b). It is worth noting that only a limited number of studies of buckling of various structures with torsional braces are available. Such studies of lateral-torsional buckling of I-girders with discrete torsional braces were presented by Trahair (1993) in the case of only one mid-span torsional restraint. The influence of torsional braces on stability of steel beams and columns was con-ducted among others by Heins and Potocko (1979), Valentino et al. (1997), Valentino and Trahair (1998), Pi and Bradford (2003) and Nguyen et al. (2010). Another kind of restraint is a warping brace. As a warping brace of the column or beam one can consider all ele-ments that connect flanges and reduce warping of the cross-section. This type of brace may result in an increase of the torsional or lateral torsional buckling load of constructional elements (Chudzikiewicz 1961, Swensson and Plum 1983, Plum and Swensson 1993, Szewczak et al. 1983, Szymczak 1999a, Szymczak 2003b, Iwicki 2010b).
Fig. 1.3. Roof construction
The determination of the buckling loads and effective buckling length of frame col-umns, truss compressed chords, or diagonals and verticals is the most important phase of

1. Introduction 12
design because even small changes in the effective length may cause significant changes in the bearing coefficient of the member. According to the design codes (Polish Code 1990, 2006, Eurocode 3 1992) the buckling length of truss members may not be calculated but in many cases may be assumed by the designer. In the case of the truss chords the buckling length in the out-of-truss plane may be regarded as distance between braces. In this approach a lower chord of the truss, the verticals and the diagonals are neglected, and bracing of truss chord is taken as a rigid side-support. In many researches (see, for example Jankowska-Sandberg, Pałkowski 2002 or Biegus and Wojczyszyn 2004, 2005, 2006 or Jankowska-Sandberg et al. 2003a, 2003b) it has been found that other elements of the truss, and the normal force distribution in the chord result in a decrease of the effective buckling length of the truss chord. Therefore the code procedure can ensure a safe design of the struc-ture. Although the code assumptions take bracing of the truss as a rigid support and the buck-ling length as equal to the side-support distance, the requirements of an equivalent stability loading for design of bracing, in fact, result in the design of elastic bracing (see Chapter 2).
In the present research the problem of stability of various steel structures with bracing is considered, and in particular, attention is concentrated on the so-called full bracing condi-tion, defined as the threshold bracing stiffness, needed to obtain maximal critical buckling force of the member. It means that a further increase of bracing stiffness does not cause an additional rise in buckling load. The problem of full bracing condition was analysed by Winter (1958), who introduced a simple model of a column with fictitious hinges at the brace joints. The use of the model allowed to calculate a bracing stiffness necessary for the column to support the load levels corresponding to an unbraced length equal to the distance between braces. Winter (1958) research was followed by the research conducted by Yura (1996). In the latter research the Winter method was extended to cases where less than full bracing occurred. Similar three column system with various kind of lateral and rotational linear and non-linear springs was used by Marcinowski (1999) to investigate technique of calculation of nonlinear equilibrium paths. The research conducted by Marcinowski (1999) was devoted to nonlinear stability of elastic shells. A practical importance of the threshold bracing stiffness is not only its use in the design of roof trusses or roof bracings but also its application to plane frames. According to the design codes it is also possible to determine the buckling length of frame columns by means of simple formulas or diagrams (see, for example, Polish design code (1990, 2006) or Eurocode 3 (1992, 2005). Frames are divided into two categories, sway and non-sway frames. Codes use simplified formulas or diagrams for the estimation of buckling length of frame columns. The application of code formulas has shown on several numerical examples that erroneous results may be encountered both in sway and non-sway modes (Özmen and Girgin 2005, and Girgin et al. 2006). Another drawback of design codes is that most codes ignore the partially-sway behaviour of frames.
In currently designed structures the statics of structure is well-developed, and many types of loading are taken into account and various results of static analyses are available to designers. Moreover the dimensioning of structures is executed according to design codes where the buckling length of the members in many cases is assumed. Modern commercial computer programs offer both stability analysis of multiple structures and the sensitivity analysis of stability problems. Therefore the design of structural elements and bracing may be more rational.
In most roof constructions rigid braces are required. However, there are some struc-tures where bracing should be flexible or even of non–linear characteristics. This situation occurs in roofs with sloping side-supports, as described by Iwicki and Kin (2000), Iwicki and Krutul (2006) or Iwicki (2007d). When the sloping side bracing of an important struc-
1.1. General remarks 13
tural element is rigid, the bracing, instead of stabilizing the structure, becomes a support of the main constructional element, and therefore bracing may be overloaded. In this case a minimal stiffness required for supports that provide stability of the main structural ele-ment against distortional buckling should be determined. Moreover the sloping braces of the structure may result in a significant decrease of limit load for imperfect structures (see, for example Szymczak 2003a).
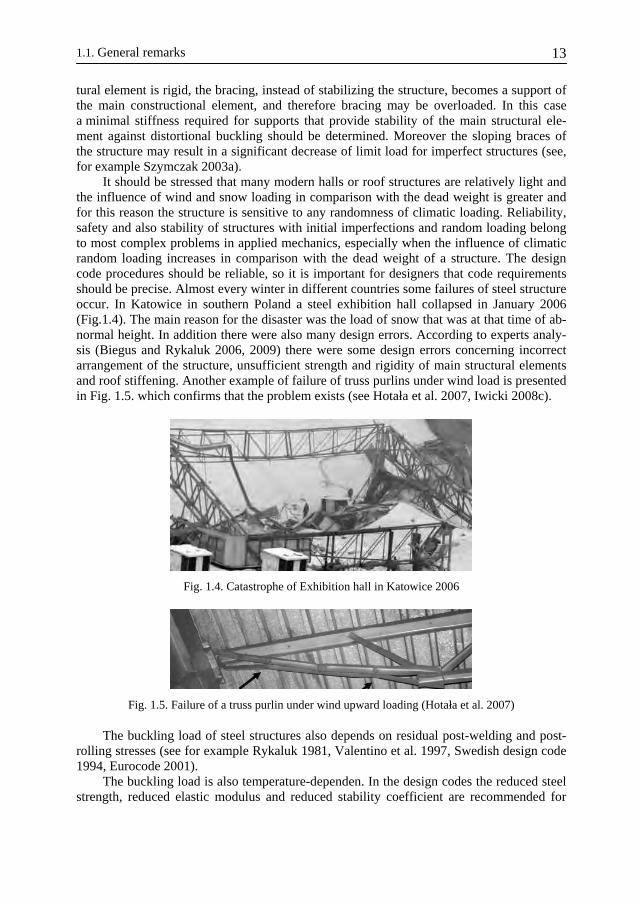
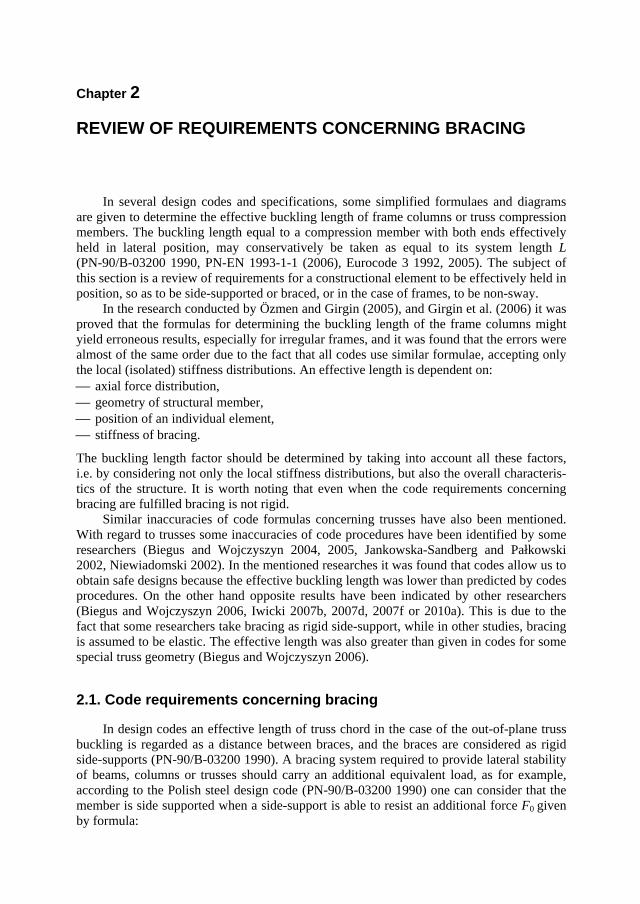
It should be stressed that many modern halls or roof structures are relatively light and the influence of wind and snow loading in comparison with the dead weight is greater and for this reason the structure is sensitive to any randomness of climatic loading. Reliability, safety and also stability of structures with initial imperfections and random loading belong to most complex problems in applied mechanics, especially when the influence of climatic random loading increases in comparison with the dead weight of a structure. The design code procedures should be reliable, so it is important for designers that code requirements should be precise. Almost every winter in different countries some failures of steel structure occur. In Katowice in southern Poland a steel exhibition hall collapsed in January 2006 (Fig. 1.4). The main reason for the disaster was the load of snow that was at that time of ab-normal height. In addition there were also many design errors. According to experts analy-sis (Biegus and Rykaluk 2006, 2009) there were some design errors concerning incorrect arrangement of the structure, unsufficient strength and rigidity of main structural elements and roof stiffening. Another example of failure of truss purlins under wind load is presented in Fig. 1.5. which confirms that the problem exists (see Hotała et al. 2007, Iwicki 2008c).
Fig. 1.4. Catastrophe of Exhibition hall in Katowice 2006
Fig. 1.5. Failure of a truss purlin under wind upward loading (Hotała et al. 2007)
The buckling load of steel structures also depends on residual post-welding and post-rolling stresses (see for example Rykaluk 1981, Valentino et al. 1997, Swedish design code 1994, Eurocode 2001).
The buckling load is also temperature-dependen. In the design codes the reduced steel strength, reduced elastic modulus and reduced stability coefficient are recommended for

1. Introduction 14
analysis of steel structures at elevated temperature (see for example Polish design code 1990, and Eurocode 3 (2001) or British Standard 5950 1990).
Many of the above described problems related to the stability of steel structures may be solved by means of the sensitivity analysis method. The aim of the sensitivity analysis is to describe the relation between a variation of the state variables due to changes of the design variables (Dems and Mróz 1983, Haug et al. 1986, Haftka and Mróz 1986, Mróz and Haftka 1994, Kleiber 1997). All variables that describe the behaviour of the structure, for example, displacements, internal forces, reactions, critical buckling loads, frequencies and modes of free vibrations can be assumed to be state variables. The values of state variables depend on parameters, known as, design variables, such as, cross-section dimensions, mate-rial characteristics or the stiffness of bracing. The sensitivity analysis in the case of beams and frames being subject to bending is well known (see, Haug et al. 1986). The sensitivity analysis of thin-walled structures was developed in numerous problems of engineering practice, for example, in the stability problems of thin-walled columns of bisymmetric cross-section by Szymczak (1992, 1996, and 1999b) or Szymczak et al. (2000a). The prob-lem of the sensitivity of buckling loads due to variation of residual stresses on buckling and initial post-buckling behaviour of thin-walled columns was studied by Szymczak (1998), Szymczak et al. (1998), and by Iwicki (2007c). The sensitivity analysis was applied to stability problems of structures supported by various elastic restraints. The effect of elastic restraints on the buckling load and the initial post-buckling behaviour of thin-walled col-umns were investigated by Szymczak (1999a). The sensitivity of load bearing coefficient according to code PN-90/B-03200 was the object of studies by Szymczak and Iwicki (1996). The sensitivity analysis of critical torsional buckling load of thin-walled I-columns resting on elastic foundation was searched by Budkowska and Szymczak (1991, 1992) or in the case of an axially loaded pile with account on its varying length by Budkowska and Szymczak (1995). A review of problems related to sensitivity analysis of thin-walled mem-bers was presented by Szymczak (2003b) and Szymczak et al. (2003).
The present research deals with stability problems of braced steel structures. The parametric studies and sensitivity analysis of the buckling load of columns, trusses and frames are carried out. The effects of various design parameters, such as, cross-section dimensions, material characteristics, residual stresses, temperature, or the stiffness and location of braces are taken into account.
1.2. Scope of the work
The work is organized as follows. Chapter 1 presents introduction and scope of the work. Previous research devoted to
the problem of bearing capacity of steel structures stiffened by means of various types of braces, and applications of the sensitivity analysis method to the stability problems are also described.
Chapter 2 deals with the design codes and specifications where simplified formulas and diagrams for determining the buckling lengths of the frame columns or the compressed elements of trusses are given. In this section some selected codes requirements (Polish Code 1990, 2006, Eurocode 3 1992, 2005, British Standard 5950 2000, and Chinese Code GB50017 2003) concerning bracing of trusses and frames are presented. Code formulas defining additional equivalent loads needed to provide lateral stability of beams, columns or trusses and a ruling criterion for the frame classification into two groups, sway and non-sway frames are given. In Chapter 2 the classical method to estimate a safe lower limit of

1.2. Scope of the work 15
the necessary rigidity of bracing such that the braced column would attain a maximal criti-cal force, proposed by Winter (1958) is presented. Attention is concentrated on the research conducted by Yura (1996) where the Winter method extended to cases with less than full bracing is provided.
In Chapter 3 a sensitivity analysis method is considered (see, Dems and Mróz 1983, Haug et al. 1986, Haftka and Mróz 1986). This method is used to study the first variation of buckling load due to variation of the design variables. In Chapter 3 special attention is given to the sensitivity analysis of critical buckling loads of structures stiffened with vari-ous kinds of bracing due to variations of the following design variables: ⎯ cross-section dimensions, ⎯ material characteristics, especially Young’s modulus variations related to cross-section
temperature, ⎯ post-rolling and post-welding stresses, ⎯ stiffness of various elastic restraints, such as, transverse stiffeners and stiffeners that re-
strain warping and torsion of cross-section.
The first order variation of critical loads of thin-walled columns with bisymmetric open cross-section due to some variations of the stiffness and location of stiffeners is derived. The assumptions of the classical theory of thin-walled members with non-deformable cross-section (Vlasov 1961) are adopted. The sensitivity analysis of the buck-ling loads for I-columns with continuous distribution of design variables and for discrete systems is considered.
Chapter 3 presents some theoretical basics of the sensitivity analysis applied to various examples of Chapter 4–6. In Chapter 3 attention is concentrated on the finite elements used for the parametrical analysis of columns, frames and trusses. The parametrical analysis of various structures was conducted by means of commercial structural analysis program ROBOT STRUCTURAL ANALYSIS PROFESSIONAL (2010), MATLAB (2007), FEMAP with NX NASTRAN (2009) or the author’s own program SEAN (see, Iwicki 1997), for the sensitivity analysis of thin-walled structures. The stability analysis and the geometrically non-linear analysis used in the parametrical studies of various structures are described.
The research is a continuation of the author’s earlier work devoted to the sensitivity analysis applied to the problem of statics of thin-walled beams of bisymmetric cross-section (see, for example Iwicki 1995, 1997). The outcomes presented in Chapter 3 resume the author’s studies of sensitivity analysis in stability problems (Iwicki 2000, 2002, 2003a, 2003b, 2004a, 2004b, 2007c, 2010b, Iwicki et al. 1999b) or the research by Szymczak, Iwicki and Mikulski (see Szymczak and Iwicki 1996, Szymczak et al. 1998, 1999a, 1999b, and 2000b).
In Chapter 4 various examples of sensitivity analysis of columns are discussed. The first variations of critical forces of column due to a change of cross-section dimensions and the residual stress variations are investigated. The sensitivity of critical forces of column with various restraints are carried out. The lateral and torsional braces and the warping re-straints are considered. Both the variation of stiffness and the location of restraints on the variation of buckling load are studied.
Later the sensitivity analysis for predicting the critical buckling loads of steel columns under changing temperature conditions is described. A steel model according to the Polish code (1990) is applied. In the example sensitivity analysis is used to predict the column behaviour at elevated temperatures, taking advantage of the results of conventional analysis of column performed at ambient temperature.

1. Introduction 16
In the examples presented in the Chapter 4 the influence lines of the variation of the critical buckling load due to the location of additional stiffeners of the unit stiffness or due to variation of the cross-section dimensions and temperature are determined, and the linear approximation of the exact relation of the critical loads due to variations of design variables is made. The accuracy of the approximate changes of the state variables achieved by sensi-tivity analysis is also discussed. Some of the examples presented in Chapter 4 were pub-lished by Iwicki (2003a, 2004a, 2004b, 2007c, 2010b). One of examples I-column is reana-lysed here by FEMAP with NX NASTRAN (2009) by 3D shell elements.
Chapter 5 is devoted to a buckling analysis of the plane frames. In this Chapter atten-tion is focused on a parametrical analysis of the buckling loads, a sensitivity analysis, and on an analysis of the Winter – type model of braced frame. The effective buckling lengths of the frame columns and a reaction in bracing due to the bracing stiffness are also calcu-lated. The relation between variations of the buckling load due to location of the unit stiff-ness brace along the frame column is found. The linear approximation of the exact relation of the buckling loads due to the variations of the bracing stiffness is determined, and the approximation error is discussed. In this section a method based on the sensitivity analysis for the determination of the threshold bracing rigidity is proposed. The problem of frames buckling and the effective lengths of frame columns is very important in frame design, for the reason that the effective length of columns has a great effect on the design of the cross-section profile. Some of the research results presented in Chapter 5 were published by Iwicki (2009a, 2010d).
Chapter 6 is devoted to stability analysis of roof truss structures. The first example is a truss with elastic bracing. That truss with rigid bracing was previously analysed by Niewiadomski (2002). His research was focused on the influence of various imperfections of the truss statics. The next of the analysed trusses is a truss binder that is a bearing ele-ment of a church roof structure, designed by Iwicki and Kin (2001) in cooperation with Swedish company MAKU AB in 1999. The design problems of that roof structure were de-scribed by Iwicki and Kin (2001), and Iwicki and Krutul (2006). The problems that emerged during the design of that roof structure were also an inspiration for the stability and the sensitivity analysis of the truss with elastic bracing. Various research results related to the parametrical and sensitivity analysis of the above mentioned trusses (see Iwicki 2006, 2007a, 2007b, 2007d, and 2007f) are verified, reanalysed and resumed in Chapter 6.
The next truss is considered with a view to the stability analysis of typical roof trusses with linear and rotational elastic side-bracing. The rotational side-bracing of the truss is provided by roof purlins. The torsion of the truss is co-related with the flexural deformation of purlins resting on the truss. It is worth noting that in the design codes, as for example, PN-90/B-3200 (1990), Eurocode 3 (1992) the stabilizing effect of rotational bracing is not taken into account. The research results of the rotational bracing having influence on the roof truss stability were published by Iwicki (2007e, 2008a, 2008b).
Next, a roof truss with side-supports placed both in the upper and lower chord is analysed. In the case of upward wind loading and especially when the roof construction is of low dead weight in such structures the compression force may also occur in the bottom truss chord, which in general, is not braced against loss of stability. A failure of the ana-lysed truss was described by Hotała et al. (2007). A problem for the designers is to calcu-late an effective length of the chord especially when the chord is not horizontal, and to pre-dict the necessary stiffness to support the lower truss chord. The results of a numerical analysis of that truss were published by Iwicki (2008c).

1.2. Scope of the work 17
The sensitivity analysis of buckling loads of truss with side-bracing is also carried out. The influence lines of the unit change of the bracing stiffness on the buckling load are found. The approximations of the exact relation between the buckling load and the bracing stiffness are studied. The research is focused on numerical study of truss with elastic brac-ing in order to obtain a full bracing condition of truss. The application of the sensitivity analysis to the problem of the out-of- plane truss buckling of braced trusses to the best of the author’s knowledge was published only by Iwicki (2010a). In Chapter 6 the sensitivity analysis of the truss with torsional and lateral braces is conducted and a sensitivity analysis carried out by the finite difference method (Chen and Ho 1994) is also presented.
Another example of truss in Chapter 6 deals with a numerical verification of an experiment devoted to the bearing capacity of the truss with elastic bracing conducted by Kołodziej and Jankowska-Sandberg (2006).
Next, a part of the roof with trusses and bracing is analysed. The analysis includes a numerical verification of some relevant code requirements. It is worth pointing out that in the calculation of a typical roof structure presented by Pałkowski (2007) according to codes PN-90/B03200 (1990) and PN-EN (2006) there have been shown some inaccuracies be-tween the codes.
In the studied truss examples use is made of both the geometrical non-linear static analysis of the 3D models (space model) and the eigen value analysis of trusses. The geo-metrically non-linear static analysis allows for the determination of the limit loads of the truss (that may be compared to the buckling load) and the reaction in bracing. By the appli-cation of the results of the eigen value analysis the critical load multiplier and the effective buckling length may be found.
Final remarks and plans for future research are outlined in Chapter 7. The idea of this work and some of the presented results are based on the studies per-
formed by prof. dr hab. C. Szymczak, dr T. Mikulski and the author of the work, published in the form of projects (Polish State Committee for Scientific Research Problem, Sensitivity analysis in dynamics and stability problems of the thin-walled bars with open cross-section no. 7T07E 035 12 (Szymczak et al. 2000)), and some related papers (see References). In the project some theoretical basics of sensitivity analysis of critical buckling loads of thin-walled bars with monosymmetric cross-section have been worked out. The cross-section dimensions, the bar material modulus, initial normal stresses, stiffness modulus and loca-tion of the stiffeners or the bar ends were assumed to be the design variables. The torsional and the flexural-torsional buckling were taken into consideration. The effect of the initial normal stresses on the critical load of torsional buckling and the post-buckling behaviour of the I-bar were also investigated. The results obtained by means of the theory of thin-walled beams with non-deformable cross-section were compared with the aid of a more precise shell model of the bar. The verification concerned the critical load of torsional buckling, the localization phenomena of stability of the bar flanges and the effect of longitudinal stiffen-ers on torsional vibration frequency. The computer program MSC/NASTRAN (2001) was used for this purpose.
The results of the above described project constituted a theoretical background for the author’s research devoted to problems of the sensitivity analysis of trusses and frames, the full bracing condition of frames and trusses, and studies of the influence of elevated tem-peratures on the critical buckling load sensitivities. The original elements – the results of the author’s scientific research are: ⎯ the sensitivity analysis of critical forces due to post-rolling stresses and post-welding
stresses according to Swedish codes (Boverkets handbok om stålkonstruktioner 1994),

1. Introduction 18
⎯ sensitivity analysis of critical forces due to variation of brace location, ⎯ application of sensitivity analysis to the problem of the truss out-of-plane buckling, ⎯ application of sensitivity analysis to the determination of the threshold bracing stiffness
of trusses and frames, ⎯ verification of classical Winter approach to problems of stability of frames and trusses, ⎯ identification of some inaccuracies of PN-90/B-03200 (1990) procedures concerning the
design of trusses with elastic bracing especially related to effective lengths of com-pressed chords and equivalent stabilizing loading,
⎯ the problem of the required stiffness of bracing in the case of sloping roof bracings, ⎯ requirements of bracing stiffness sufficient to stabilize lower truss chord, ⎯ application of rotational restraints as additional bracings of compression truss chord.
The presented work resumes the author’s research dealing with the problem of stabil-ity of braced structures but it is not a complete answer to the problem. It should be pointed out that the application of the sensitivity analysis can result in a reduction of the laborious structural study and may be helpful in design of structures. It should also be stressed that engineering experience plays an essential role in the field of design.
Chapter 2
REVIEW OF REQUIREMENTS CONCERNING BRACING
In several design codes and specifications, some simplified formulaes and diagrams are given to determine the effective buckling length of frame columns or truss compression members. The buckling length equal to a compression member with both ends effectively held in lateral position, may conservatively be taken as equal to its system length L (PN-90/B-03200 1990, PN-EN 1993-1-1 (2006), Eurocode 3 1992, 2005). The subject of this section is a review of requirements for a constructional element to be effectively held in position, so as to be side-supported or braced, or in the case of frames, to be non-sway.
In the research conducted by Özmen and Girgin (2005), and Girgin et al. (2006) it was proved that the formulas for determining the buckling length of the frame columns might yield erroneous results, especially for irregular frames, and it was found that the errors were almost of the same order due to the fact that all codes use similar formulae, accepting only the local (isolated) stiffness distributions. An effective length is dependent on: ⎯ axial force distribution, ⎯ geometry of structural member, ⎯ position of an individual element, ⎯ stiffness of bracing.
The buckling length factor should be determined by taking into account all these factors, i.e. by considering not only the local stiffness distributions, but also the overall characteris-tics of the structure. It is worth noting that even when the code requirements concerning bracing are fulfilled bracing is not rigid.
Similar inaccuracies of code formulas concerning trusses have also been mentioned. With regard to trusses some inaccuracies of code procedures have been identified by some researchers (Biegus and Wojczyszyn 2004, 2005, Jankowska-Sandberg and Pałkowski 2002, Niewiadomski 2002). In the mentioned researches it was found that codes allow us to obtain safe designs because the effective buckling length was lower than predicted by codes procedures. On the other hand opposite results have been indicated by other researchers (Biegus and Wojczyszyn 2006, Iwicki 2007b, 2007d, 2007f or 2010a). This is due to the fact that some researchers take bracing as rigid side-support, while in other studies, bracing is assumed to be elastic. The effective length was also greater than given in codes for some special truss geometry (Biegus and Wojczyszyn 2006).
2.1. Code requirements concerning bracing
In design codes an effective length of truss chord in the case of the out-of-plane truss buckling is regarded as a distance between braces, and the braces are considered as rigid side-supports (PN-90/B-03200 1990). A bracing system required to provide lateral stability of beams, columns or trusses should carry an additional equivalent load, as for example, according to the Polish steel design code (PN-90/B-03200 1990) one can consider that the member is side supported when a side-support is able to resist an additional force F0 given by formula:

2. Review of requirements concerning bracing 20
0 0.01 cF N= and 0 0.005 c dF A f≥ , (2.1)
where: Nc is the normal force in the compression chord, Ac the cross-section of the com-pression chord, fd is steel strength. According to the code the maximal displacement of the side support should not exceed l1/200, where l1 denotes the side-support distance (Fig. 2.1).
Fig. 2.1. A bracing displacement allowed by code PN-90/B-03200 (1990)
In the case of a few members braced by the same bracing the side-support should resist additional force Fm :
01
2,
1
m
m ii
F Fm =
=+
∑ (2.2)
where m denotes the number of roof sections stabilized by bracing (Fig. 2.2).
Fig. 2.2. A scheme for calculating an additional bracing load when bracing should stabilize a few structural elements against lateral buckling according to PN-90/B-03200

2.1. Code requirements concerning bracing 21
According to the Eurocode 3 (1992) a member can be considered to be side-supported when distributed equivalent load q can be transferred to the foundation by horizontal brac-ing:
,
for50 2500
,
(1 ) for60 2500
500and 0.2,
q
q
q
N Lq
L
N Lq
L
L
δ
α δ
δα α
= ≤
= + >
= ≥
(2.3)
where δq denotes displacement of the bracing caused by load q and other horizontal load-ings (Fig. 2.3). For multiple restrained members:
( )
( )
for60 2500
for60 2500
0.2 ,
,
10.2 , 1.0.
q
q
r
r
r
Lq
L
Lq
L
Nk
Nk
k km
δ
δα
= ≤
=
+
+ >
= + ≤
∑
∑ (2.4)
Fig. 2.3. A scheme for calculating the equivalent stabilising load according Eurocode 3 (1993)
In Eurocode 3 (2005) or (PN-EN 2006) a slightly different formula for an equivalent stabilizing force is presented in the following form:
0
2
8( )qeq
LN
δ=
+∑ . (2.5)
In the above equation it is assumed that the member is bent in the out-of-plane direction and that the initial bow imperfection is:
2. Review of requirements concerning bracing 22
0 500me Lα= × . (2.6)
Another assumption is that the normal force N is constant along the member length. Coeffi-cient αm is responsible for taking into account the case of m members to be restrained:
1
0.5 1m mα ⎛ ⎞= +⎜ ⎟
⎝ ⎠. (2.7)
Both Polish code PN-90/B-03200 (1990) and Eurocodes 3 (1992), (2005) describe the con-ditions that refer to the required stiffness of the side-supports. Significant differences in the design of bracings according to above described codes were described by Pałkowski (2007).
2.2. Code requirements concerning sway and non-sway frames
In design codes the effective lengths of frame columns are based on the sway classifi-cation into two groups, sway and non-sway frames. The ruling criterion for qualifying the frame for sway or non-sway is based on relation between frame and bracing stiffness. In the Polish design code PN-90/B-03200 (1990) when stiffness of braced frame is five times greater or is equal to the stiffness of the frame without bracing, then the frame can be con-sidered as non-sway:
1 5
FBr Fψ ψ≥ , (2.8)
where ψFBr and ψF denote the inclination of braced frame and unbraced frame respectively. Condition (2.8) describes the lateral stiffness of a bracing system (such as a shear wall, a vertical beam or a reinforced concrete core) and when the stiffness of the braced frame is equal to or five times greater than the frame itself, the frame is regarded as non-sway. Oth-erwise the frame is classified as sway.
According to Tong and Ji (2007) a similar condition is present in Chinese design code (GB50017-2003). By this rule, in many braced frame structures where the lateral stiffness of the bracing system is five times smaller than the frame stiffness (weakly braced frame), the effect of the bracing stiffness on the lateral stability of the frame is entirely neglected.
According to Eurocode 3 (1992) a frame may be classified as being non-sway in a given load case if the elastic critical load ratio satisfies the following condition:
0.1Sd
cr
V
V≤ , (2.9)
where VSd is the design value of the total vertical load, and Vcr is the elastic value for failure in a sway mode.
The beam and the column-type plane frames according to Eurocode 3 (1992) may be classified as non-sway for a given load case when the horizontal displacements in an indi-vidual storey due to the design loads plus the initial sway imperfection that is applied to the frame in the form of horizontal load, satisfy the following condition:
0.1H V
h H
δ≤ , (2.10)

2.2. Code requirements concerning sway and non-sway frames 23
where δH is the horizontal displacement of the individual storey, h denotes the storey height, H is horizontal, and V is the vertical reaction at the bottom of the storey.
According to to Tong and Ji (2007) in Chinese code GB50017 (2003) for the design of steel structures when the lateral rigidity of bracing in storey kbr satisfies the following rela-tion:
( )
1
3 1.2m
bri ubrii
br
P P
kh
=
⎛ ⎞−⎜ ⎟⎝ ⎠=∑
, (2.11)
the frame is non-sway, where Pbr and Pubr denote the axial load carrying capacity of column non-sway and sway buckling mode respectively, m is the number of columns in a storey, and h is the storey height. If Eq. (2.11) is not satisfied, the storey will buckle in a sway mode, but the effect of the lateral bracing on the storey stability may be taken into account by the following equation:
( )1
( )
3 1.2
brsway nonsway sway m
bri ubrii
k
P P h
ϕ ϕ ϕ ϕ
=
= + −⎛ ⎞−⎜ ⎟⎝ ⎠∑
. (2.12)
The sway stiffness of frames may be supplied by stiffness of frame or rigid-joints of col-umns and beams, or may result from the shear walls, the stiff cores, or some other kind of bracing. The bracing systems in the braced frames should resist the horizontal loads and forces that arise from the frame imperfections. Under horizontal loads, the bracing in a bracing frame system fulfils two functions, to carry the horizontal loads, and to create lat-eral supports for the frame.
2.3. Classical approach concerning bracing
Most code requirements concerning bracing are based on principles formulated by Winter (1958). The Winter research was focused on the estimation of a safe lower limit of bracing rigidity necessary to ensure a maximal critical force for the column with bracing. Winter concentrated his attention on full bracing requirements defined as minimal bracing stiffness needed to force the buckling of column to take place between braces. A simple model with fictitious hinges at the brace joints was introduced (Fig. 2.4). As a consequence of the location of the fictitious hinges in the column the bracing importance increases and therefore the bracing stiffness calculated in the model is expected to be a safe lower limit of the required stiffness. The use of the model makes it possible to calculate a full bracing necessary for the column to support the load level corresponding to an unbraced length equal to the distance between braces. The compression force is assumed to be constant along the column. The basic concepts of the Winter approach can be explained on a simple model of a simply supported column with only a single brace in the middle of the column. The equilibrium at hinge is given as:
0 02cr
kM P L
δδ= − = . (2.13)
Then the full bracing stiffness condition causing the column to buckle between braces is:
0
2 crPk
L= . (2.14)

2. Review of requirements concerning bracing 24
Fig. 2.4. Buckling mode for a braced column according to the Winter (1958) model
At brace stiffness smaller than the full bracing condition, buckling occurs with lateral movement in the direction of brace point. For brace stiffness greater than the full bracing condition the column buckles between supports and the brace, and the critical force is:
2
0 20
cr
EJP
L
π= . (2.15)
The relation between the relative critical force and the coefficient of support stiffness is presented in Fig. 2.5. The full bracing is obtained for bracing stiffness parameter α = 2. The difference between the Winter model of the column and the column without fictitious hinge in the analysed case is very small (Fig. 2.5). The classical Winter’s approach was focused on full bracing requirements and not on cases of lower bracing stiffness than the full brac-ing condition. In the research conducted by Yura (1996) the Winter method was extended to cases when braces have unequal spacing.
0 0.5 1 1.5 2 2.5 3
α = kL0/Pcr00.0
0.2
0.4
0.6
0.8
1.0
Pcr /
Pcr
0
exact
Winter method
Fig. 2.5. Relative buckling load vs. bracing stiffness parameter
In Winter’s (1958) and Yura’s (1996) research the normal force was constant along a compressed member. The results of research conducted by Gil and Yura (1999) showed that Winter’s simplified method to determine the full brace requirements can be applied to inelastic members as well as to elastic ones. The Winter model of column with fictitious hinges at bracing was adopted by Yura (1996) to calculate the critical load of column when less than a full bracing stiffness is provided. In the research conducted by Yura (1996) the column presented in Fig. 2.6 was analysed. The column has three intermediate braces of constant stiffness.

2.3. Classical approach concerning bracing 25
Fig. 2.6. Buckling mode for truss chord analysed as isolated member
At a low brace stiffness the column buckles into a single wave. When the brace stiffness in-creases the column buckles into two, then three and four waves for maximal stiffness of braces. An equilibrium of the bending moments in the fictitious hinges can be written as (Fig. 2.6):
( )
( )
( )
3 2 0,4
2 4 2 0,4
2 3 0.4
B cr B B C D
C cr C B C D
D cr D B C D
LkM P
LkM P
LkM P
δ δ δ δ
δ δ δ δ
δ δ δ δ
= − + + =
= − + + =
= − + + =
∑
∑
∑
(2.16)
By solving a set of Eqs (2.16) three solutions that describe three modes of buckling for the Winter model can be obtained (Fig. 2.7). Using three modes of buckling the lower bound of the required bracing stiffness for critical force of column, lower than the maximal force can be found.
Fig. 2.7. Buckling modes for column with three braces

2. Review of requirements concerning bracing 26
The relation between the critical force and the stiffness of braces are found by means of construction lines. The lines run between the starting points that describe the critical force at zero brace stiffness for column without fictitious hinges and the end-points which describe the stiffness of bracing when the maximal buckling load is reached for the Winter model. Depending on the required critical force level the bracing stiffness changes and according to the Winter model can be presented as a polyline that is a lower bound of the construction lines (Fig. 2.8). The poly-line constructed by means of the Winter model is compared with the relation between the relative critical buckling force and the bracing stiffness parameter found by using program Matlab (2007). A full bracing condition in the examined column is obtained for coefficient α = 3.41. In the next sections the Winter model is adopted to plane frames and to truss chord model. The threshold bracing stiffness found by means of the Winter method for frames and trusses is compared with parametrical analysis of these structures with bracing.
0 0.5 1 1.5 2 2.5 3 3.5 4
α = kL/Pcr00.0
0.2
0.4
0.6
0.8
1.0
Pcr /
Pcr
0 exact
Winter method
construction line
Fig. 2.8. Winter poly-line between relative buckling force and coefficient of bracing stiffness
2.4. Column on elastic foundation
In many steel structures the bracing is continuously distributed along a member length. This kind of bracing is usually provided by corrugated plate and is modelled by elastic foundation. Let us consider a simply supported column with rigid supports at the ends and an elastic foundation in the column span (Fig. 2.9). The column is compressed by a force P
Fig. 2.9. A simply supported column resting on elastic foundation
The following differential equation is valid:
0,IVcrEJy P y ky′′+ + = (2.17)
where Pcr is the column axial compression force, EJ is the bending stiffness of columns and k denotes the foundation stiffness. Assuming that the buckled shape of the column has the following form:

2.4. Column on elastic foundation 27
0( ) sin ,m x
y x yl
π= (2.18)
where m is the number of half-waves. Eq. (2.17) can be expressed by:
4 2
0cr
m mEJ P k
l l
π π⎛ ⎞ ⎛ ⎞− + =⎜ ⎟ ⎜ ⎟⎝ ⎠ ⎝ ⎠
, (2.19)
thus:
2 2
cr
m lP EJ k
l m
ππ
⎛ ⎞ ⎛ ⎞= +⎜ ⎟ ⎜ ⎟⎝ ⎠ ⎝ ⎠
. (2.20)
The critical buckling force N depends on the column stiffness, the height, the foundation stiffness, and the number of half-waves of the column buckling mode. The minimum of the column critical force with respect to the number of half-waves is described by the following condition:
2 2
2 3 22 2 0crP m l
EJ km l m
ππ
∂= − =
∂. (2.21)
Thus, the critical number of half-waves is:
4l k
mEJπ
= . (2.22)
The buckling load of the column resting on an elastic foundation is given by the formula:
2crP EJk= . (2.23)
The same formula is recommended in code PN-EN 1993-4-1 (2007) for load bearing capac-ity of the column stiffened by corrugated plate. The application of above derived formula for the stability analysis of bridge bracing was presented by Pałkowski and Kołodziej (1995).
Chapter 3
SENSITIVITY ANALYSIS OF BUCKLING LOADS OF THIN-WALLED STRUCTURAL MEMBERS
Thin-walled members are parts of beams, columns, frames or trusses. These members are often subjected to axial loads or are subjected to normal forces as a result of the load of the whole structure and therefore it is important to determine its buckling loads.
The buckling load of the structural elements depends on: ⎯ the geometrical dimensions, ⎯ material characteristics, ⎯ residual post welding and post rolling stresses, ⎯ stiffness and position of the bracing elements, ⎯ temperature of the structure.
The above listed parameters are called design variables. The degree of accuracy of the manufacturing process or changes in the bracing elements stiffness or their location can be described as some variations of the design variables.
The variations of the design parameters may significantly change the buckling resis-tance of the member. For example, an increase of cross-section dimensions may result in a decrease of the member critical load. Such paradox for I column was found by Cywiński and Kollbrunner (1971), Dąbrowski (1981), Szymczak (1983) or Szymczak et al. (2003a).
The buckling load of steel structures also depends on residual post-welding and post-rolling stresses (see, for example, Rykaluk 1981, Valentino et al. 1997, Swedish design code 1994, Eurocode 2001).
The buckling load is also temperature-dependent because an increase of the tempera-ture of structural element reduces steel strength and elastic modulus. Steel characteristics at elevated temperature are described in codes, as for example, PN-90/B-03200 (1990), and Eurocode 3 (1992, 2005) or British Standard 5950 (1990).
The structural elements, such as, beams, columns, trusses or frames are supports for other elements, like purlins, wall girders or corrugated sheeting, which can be regarded as stiffeners, and together with the bracing systems provide stability for the whole structure. Bracing of the main structural elements may be modelled as elastic side-supports. All the above mentioned braces lead to an increase in the critical loads. It is therefore important to know how the elements influent the stability of the structure. There are many research activities related to requirements of bracing stiffness in order to stabilize structural ele-ments. The problem of bracing stiffness on buckling load of I-columns has been analysed by Gosowski (1992), (2003) or by Gil and Yura (1999). In the case of braced frames research conducted by Özmen and Girgin (2005) and Girgin et al. (2006) or Mageirou, et al. (2006), Tong and Shi (2001) or Tong and Ji (2006) was published. Similar numerical analyses of bracing requirements for inelastic castellated beams were carried out by Mo-hebkhah and Showkati (2005). The requirements according to bracing are also present in design codes (see section 2). The minimal stiffness of stiffeners needed to consider a full bracing condition of a compressed member was derived by Winter (1958) or Yura (1996).

29
Any variations of the design variables may change the stability of the structure. As there are many design variables that may affect the stability of the structure it is significant for the designers to determine the relation between the structure performance variation due to the varia-tions of the design variables. This is a subject of the sensitivity analysis that was first developed by Haug et al. (1986), Dems and Mróz (1983), Haftka and Mróz (1986) or Szefer (1983). In this Chapter attention is paid to the basis of sensitivity analysis making it possible to predict changes in the buckling load of a structure due to the variation of cross-section dimensions and material characteristics or residual stress variation and the bracing parameters.
The relation between the buckling load of the structure and the design variables may also be found by the use of standard commercial programs of the structural analysis. In order to obtain the relations the designer must repeat the analysis for different values of the design variables. Such analysis is called a parametrical study of a structure. Parametrical analyses of columns, frames and trusses are conducted in Chapters 4–6. Both the stability analysis and the geometrically non-linear statical analysis are described in the Chapter 3. In this section the finite elements used in the parametrical analysis are outlined.
In the present section the application of the sensitivity analysis to the research of criti-cal loads of I-column with stiffeners is presented. This method was successfully used by Szymczak (1992, 1996, 1999a, 1999b, 2003) or Szymczak and Iwicki (1996), Szymczak et al. (1998b, 2003) in the static and stability analyses of thin-walled members. The applica-tion of the sensitivity analysis to problems of structural stability presented by in the chapter resumes the author previous research (Iwicki 2000, 2002, 2003a, 2004b, 2007a, 2007c, 2007d, 2010a, 2010b).
The problem investigated in this section is devoted to an analysis of the first order variation of critical loads of I-section column due to variations of the design variables. The following structural characteristics were considered to be the design parameters: ⎯ cross-section dimensions, ⎯ Young’s modulus E, ⎯ shear modulus G, ⎯ stiffness and location of the stiffeners, ⎯ initial welding and rolling stresses, ⎯ cross-section temperature.
The considerations are based on the classical assumptions of the thin-walled beam theory with non-deformable cross-section (Vlasow (1961)). Material is perfectly linear elas-tic. It is assumed that the dimensions of the cross-section, except for the web height may be variable along the member axis but the bisymmetry condition of the cross-section is ful-filled. The member rests on elastic Winkler-type foundation that restrain warping, torsion and lateral displacement of the cross-section.
In this section the first variation of the buckling load for the distributed parameter structural systems is determined. Later the case of variation of restraints localization is con-sidered. The position of the restraints is assumed to be a design variable. The variactions of the buckling load for a discrete structural system are also analysed.
The application of formulas derived in this section are presented in the following sec-tions, where buckling load sensitivity is illustrated by a set of examples concerning the stability of columns, frames and trusses.
As a result of the sensitivity analysis the influence lines of the variation of buckling loads due to the variations of the design variables are found. These lines allow us to predict changes of buckling loads of various structures due to the variations of the design variables.

3. Sensitivity analysis of buckling loads of thin-walled structural members 30
3.1. First variation of buckling load due to variation of continuously distributed design variables
In this section the first variation of the buckling load for the distributed parameter struc-tural systems are determined. The buckling loads of a thin-walled column braced by different means of restraining elements are considered. Three kinds of elastic stiffeners are taken into account: lateral side supports, warping prevention stiffeners and torsional stiffeners.
As a lateral brace of a constructional element one can consider such elements as purlins, wall rails or corrugated decking that are connected to a constructional member to prevent its side displacements at the brace points. The influence of bracing stiffness on the buckling load of I-columns has been analysed by Gosowski (1992) and by Gil and Yura (1999), Waszczyszyn et al. (1990), Weiss and Giżejowski (1991), or Trahair (1993). It is also possible to take the bridging members as torsional braces. The members provide a lateral side-support and are subject to bending when the column twists. Research on the influence of those restraints on the stability of steel beams and columns was conducted among others by Heins and Potocko (1979), Trahair (1993), Valentino et al (1997), Valen-tino and Trahair (1998), Nguyen et al. (2010).
x
z
y
y
z
Θ
kΘ,
kΘ,
kΘ
kΘkv
kv
Fig. 3.1. Thin-walled column with out-of-plane multiple-restraints
All elements that connect flanges and reduce warping of the cross-section can be con-sidered to be a warping brace of the column. Warping prevention restraints in the form of transverse stiffeners, longitudinal edge stiffeners or box stiffeners of stiffness k ′Θ are pre-
sented in Fig. 3.1. The behaviour of those stiffeners and its effect on column statical per-formance was analysed, among others, by Chudzikiewicz (1961) and later by Svensson and Plum (1983), Szewczak et al. (1983), Gosowski (1992), Plum and Svensson (1993) and Szymczak et al. (2003). In the research conducted by Iwicki (1997) a sensitivity analysis of static problem of thin-walled members with various kinds of the above mentioned stiffeners was performed. In Szymczak et al. (2003) the research of the previously simplified models of the warping type stiffeners was modified with the aid of a more precise shell model and a concept of a superelement was developed. All the above mentioned stiffeners lead to an increase in the critical buckling loads.
In the present work, the sensitivity analysis method is used to predict changes in the buckling load of columns as a result of the variation of brace localisation and the stiffness. It is worth noting that in the design code procedures, as for example in code PN-90/ B-03200, the effective buckling length of compression members is required and therefore both the flexural and torsional buckling loads have to be calculated. All types of braces af-fect the buckling load level and the effective buckling length. Thus the designer needs

3.1. First variation of buckling load due to variation of continuously distributed… 31
a tool for predicting the points where braces should be applied in order to efficiently increase the buckling load. The investigated problem is devoted to the analysis of the first order variation of critical loads of I-section column due to variations of stiffness and loca-tion of the bracing elements. The sensitivity analysis is used to determine the influence lines describing the location of the braces with unit stiffness on the critical buckling load of the column. The linear approximation of the exact relation of the critical load due to the variation of the stiffness and location of braces is determined.
3.1.1. First variation of flexural-torsional buckling load due to variation of cross-section dimensions or variation of bracing stiffness
At first a column with continuously distributed restraints subjected to compressive load P shown in Fig. 3.2a is considered. Three kinds of elastic restraints are taken into account, the lateral side-supports, the warping prevention braces, and the torsional braces. The lateral braces are situated at distance zt from the centroid. The total potential energy of the column can be written as (Weiss and Giżejowski (1991) or Trahair (1993)):
( )
( ) ( )( )
2 2 2 2
0
22 2 2 20 0
0
2 2 2 200 0
0
1V
2
12
2
12 ,
2
l
y z d
l
v v t v t
l
cr
EJ w EJ v EJ GJ dx
k v k k k v z z k z z dx
JP v w z z v dx
A
ω
′Θ Θ
′′ ′′ ′′ ′= + + Θ + Θ +
′+ Θ + Θ − Θ − + Θ −
⎛ ⎞⎛ ⎞′ ′ ′ ′ ′− + + + Θ + Θ⎜ ⎟⎜ ⎟⎝ ⎠⎝ ⎠
∫
∫
∫
(3.1)
where: E – Young’s modulus, G – shearing modulus, A – cross-section area, Jy , Jz , J0, Jω,
Jd, moments of inertia, polar moment of inertia, warping and torsion section constants, , ,vk k k ′Θ Θ – stiffnesses of the continuously distributed restraints, z0 is coordinate of shear
centre. The primes denote the differentiation with respect to coordinate x. The first order variation of the above equation due to a change in design variable u can be written as:
( )
( )( ) ( )( )( )
( ) ( ) ( ) ( )
0
2
0 0
0
200 0
0
2 2 2
V
1, , , ,
2
l
z y d
l
v v t v t
l
cr
y u z u u d u
EJ v v EJ w w EJ GJ dx
k v v k z z v v k k k z z dx
JP v v w w z z v v dx
A
EJ w EJ v EJ GJ
ω
ω
δ δ δ δ δ
δ δ δ δ δ δ
δ δ δ δ δ
′Θ Θ
′′ ′′ ′′ ′′ ′′ ′′ ′ ′= + + Θ Θ + Θ Θ +
′ ′− − Θ + Θ + Θ Θ + Θ Θ + − Θ Θ
⎛ ⎞⎛ ⎞′ ′ ′ ′ ′ ′ ′ ′ ′ ′− + + + Θ Θ + Θ + Θ +⎜ ⎟⎜ ⎟⎝ ⎠⎝ ⎠
′′ ′′ ′′+ + Θ +
∫
∫
∫
( )
( )( ) ( )( )( )
2
0
22 2 2 20 0
0
2 200 0
0
2 2 2 200 0
0
1, 2 , , , ,
2
1, 2 ,
2
12 0.
2
l
l
v u v t u u u v t u
l
cr u u
l
cr
u dx
k v k z z v k k k z z u dx
JP z z v udx
A
JP v w z z v dx
A
δ
δ
δ
δ
′Θ Θ
′Θ +
′− − Θ + Θ + Θ + − Θ
⎛ ⎞⎛ ⎞ ′ ′ ′− + Θ + Θ⎜ ⎟⎜ ⎟⎝ ⎠⎝ ⎠
⎛ ⎞⎛ ⎞′ ′ ′ ′ ′− + + + Θ + Θ =⎜ ⎟⎜ ⎟⎝ ⎠⎝ ⎠
∫
∫
∫
∫
(3.2)

3. Sensitivity analysis of buckling loads of thin-walled structural members 32
The variation of the total potential energy at buckling state vanishes, and the first three integrals of Eq. (3.2) are zero because of virtual work theorem. The first variation of the critical load for flexural-torsional buckling resulting from a change of the design variable u takes the following form (see also Iwicki 2010b):
( ) ( ) ( ) ( )
( )( ) ( )( )
2 2 2 2
2 200 0
0
22 2 2 20 0
2 2 2 200 0
0
, , , ,
, 2 ,
, 2 , , , ,
2
z u y u u d u
l
cr u u
v u v t u u u v t u
cr l
EJ v EJ w EJ GJ
JP z z v u dx
A
k v k z z v k k k z zP
Jv w z z v dx
A
ω
δ
δ′Θ Θ
⎛ ⎞′′ ′′ ′′ ′+ + Θ + Θ⎜ ⎟⎜ ⎟⎛ ⎞⎛ ⎞⎜ ⎟′ ′ ′− + Θ + Θ +⎜ ⎟⎜ ⎟⎜ ⎟⎝ ⎠⎝ ⎠⎜ ⎟
′⎜ ⎟− − Θ + Θ + Θ + − Θ⎝ ⎠= =
⎛ ⎞⎛ ⎞′ ′ ′ ′ ′+ + + Θ + Θ⎜ ⎟⎜ ⎟⎝ ⎠⎝ ⎠
=
∫
∫
,
0
.cr
l
P u udxδΛ∫
(3.3)
The under-integral functions ,crP uΛ describe the influence of a column design variable
variation on the buckling load. In order to find the first variation of the column buckling load it is necessary to solve the eigen-value problem for the initial values of the design parameters ( ( ) ( ) ( ), , ,crP v x w x xΘ are known), and than for assumed variation of the design
parameter ( uδ ) it is possible to calculate crPδ . The integral in denominator of Eq. (3.3) can
be calculated or is equal one depending on normalization of the buckling mode.
a) b)
z
yx
zz, w
yy, vzt
θθ
P P
kΘ,
kΘ,kΘ
,
kΘ
kΘkΘ
kv
kv
kvkv
a) b)
Fig. 3.2. Axially compressed I-section column with continuously distributed restraints a) lateral brace is shifted from the shear centre, b) lateral braces at the centroid.
3.1.2. First variation of torsional buckling load
Let us consider a column with continuously distributed restraints presented in Fig. 3.2b. The column is axially loaded and stiffened by means of continuously distributed elas-tic restraints that affect torsion and warping of the cross-section. All the restraints are loca-ted in the centroid of the cross-section. Because of bisymmetry of the cross-section, ben-ding and torsion are not coupled and the buckling modes can be considered independently. The total potential energy of the column is:
( )2 2 2 2 20
0 0
1 1V
2 2
l l
d cr
JEJ GJ k k dx P dx
Aω ′Θ Θ′′ ′ ′ ′= Θ + Θ + Θ + Θ − Θ∫ ∫ . (3.4)

3.1. First variation of buckling load due to variation of continuously distributed… 33
The first order variation of the above equation due to variation of design variable is:
( )
( ) ( )( )0
2 2 2 20
0 0
2 20 0
0 0
V
1, , , ,
2
1 1, .
2 2
l
d
l l
cr u d u u u
l l
cr u cr
EJ GJ k k dx
JP dx EJ GJ k k u dx
A
J JP u dx P dx
A A
ω
ω
δ δ δ δ δ
δ δ
δ δ
′Θ Θ
′Θ Θ
′′ ′′ ′ ′ ′ ′= Θ Θ + Θ Θ + Θ Θ + Θ Θ +
′ ′ ′′ ′ ′− Θ Θ + Θ + Θ + Θ + Θ +
⎛ ⎞ ′ ′− Θ − Θ⎜ ⎟⎝ ⎠
∫
∫ ∫
∫ ∫
(3.5)
The variation of the total potential energy at buckling state vanishes, and the first two inte-grals of Eq. (3.5) are zero because of virtual work theorem. The first variation of the critical load of torsional buckling takes the following form:
( ) ( )2 2 2 2 20
0
20
0
,
0
, , , , ,
( ) ,cr
l
u d u u u cr u
cr l
l
P u
JEJ GJ k k P udx
AP
Jdx
A
x u dx
ω δδ
δ
′Θ Θ⎛ ⎞⎛ ⎞′′ ′ ′ ′Θ + Θ + Θ + Θ − Θ⎜ ⎟⎜ ⎟
⎝ ⎠⎝ ⎠=′Θ
= Λ
∫
∫
∫
(3.6)
where u denotes the design variable and (...), stands for the differentiation with respect to the design variable, Pcr is the critical load of the torsional buckling. The under-integral function ΛPcr,u describes the influence of variation of the design variable u as cross-section dimension, material characteristic or location of warping stiffener or torsional stiffener of the unit stiffness along the column length, on the critical load of torsional buckling.
3.1.3. First variation of flexural buckling load
Consider now an axially loaded column with continuously distributed elastic lateral re-straints. The total potential energy of the column is:
( )2 2 2
0 0
1 1V .
2 2
l l
z v crEJ v k v dx P v dx′′ ′= + −∫ ∫ (3.7)
The first variation of the critical load for flexural buckling can be derived in a similar way to the torsional buckling:
( )( )
( )
2 2 2
0 0
0 0
1 1V , ,
2 2
.
l l
z u v u cr
l l
z v cr
EJ v k v u dx P v dx
EJ v v k v v dx P v v dx
δ δ δ
δ δ δ
′′ ′= + − +
′′ ′′ ′ ′+ −
∫ ∫
∫ ∫ (3.8)
The variation of the total potential energy at buckling state vanishes, and the last two inte-grals of Eq. (3.8) are zero because of virtual work theorem. The first variation of the critical load of the flexural buckling takes the following form:

3. Sensitivity analysis of buckling loads of thin-walled structural members 34
( )( )2 2
0,
2 0
0
, ,
( ) cr
l
z u v u l
cr P ul
EJ v k v u dx
P x u dx
v dx
δδ δ
′′ += = Λ
′
∫∫
∫. (3.9)
The under-integral functions ( ),crP u xΛ describe the influence of variation of the cross-
section dimension, the material characteristics or the location of the transverse stiffener of the unit stiffness along the column length on the flexural buckling load.
3.1.4. First variation of critical loads due to variation of residual stresses
The critical buckling load of thin-walled columns depends on the design variables, such as, residual post-welding or rolling stresses. During the manufacturing process there are some variations of the cross-section dimensions (imperfections), material characteris-tics, or residual post-welding or rolling stresses. The inaccuracy of some of the above men-tioned values are the object of codes describing basic requirements of constructional steel-work specification, as for example, Swedish design code Boverkets handbok om stalkon-struktioner (1994). The aim of the present analysis is to show advantages of the design sen-sitivity analysis (Haug et al. (1986)) as a tool to describe the influence of the degree of accuracy of the manufacturing process on the critical load. Sensitivity analysis is used for many practical problems concerned with thin-walled members (Szymczak 2003), and the application of the sensitivity analysis to the stability problems due to the residual stresses was investigated in several researches, as for instance, Szymczak (1998), Szymczak et al. (1998b) or Iwicki (2002, 2007c). In the present section the influence of the residual post-welding or post-rolling stresses on the critical load of torsional buckling is taken into account. Three models of residual stress distribution in the column cross-section are adopted according to Rykaluk (1981), Valentino et al. (1997), and the Swedish design code according to Boverkets handbok om stalkonstruktioner (1994).
It is well known that cooling of a steel member after rolling or welding causes some residual normal stresses (Rykaluk (1981)). The reason for residual stresses is different rate of cooling in different parts of the member. The flange tips and the centre of web in the I cross-section cool more rapidly. Those regions where cooling is faster becomes a kind of restraint for other parts of the member and causes tension after cooling. The distribution of the residual stresses depends on cross-section geometry and the cooling processes. The dis-tribution of the residual stresses should be an object of the design codes. In Polish design code (1990) there is no suggestion about the distribution of residual stresses across the cross-section. Other codes, as for example, the Swedish ones provide designers with that information. In the present paper it is assumed that the self-equilibrated residual stress dis-tribution in the cross-section is bisymmetric as adopted by Rykaluk (1981), Valentino et al. (1997), and the Swedish code (1994). The governing torsional differential equation of the column with respect to the influence of the residual stresses could be written in the follow-ing form (Rykaluk (1981)):
( ) 0 0 , cr d w
JEJ P GJ R
Aω
′⎛ ⎞⎛ ⎞″′′ ′Θ + − − Θ =⎜ ⎟⎜ ⎟⎜ ⎟⎝ ⎠⎝ ⎠
(3.10)
where Rw is the residual stress constant defined as follows:
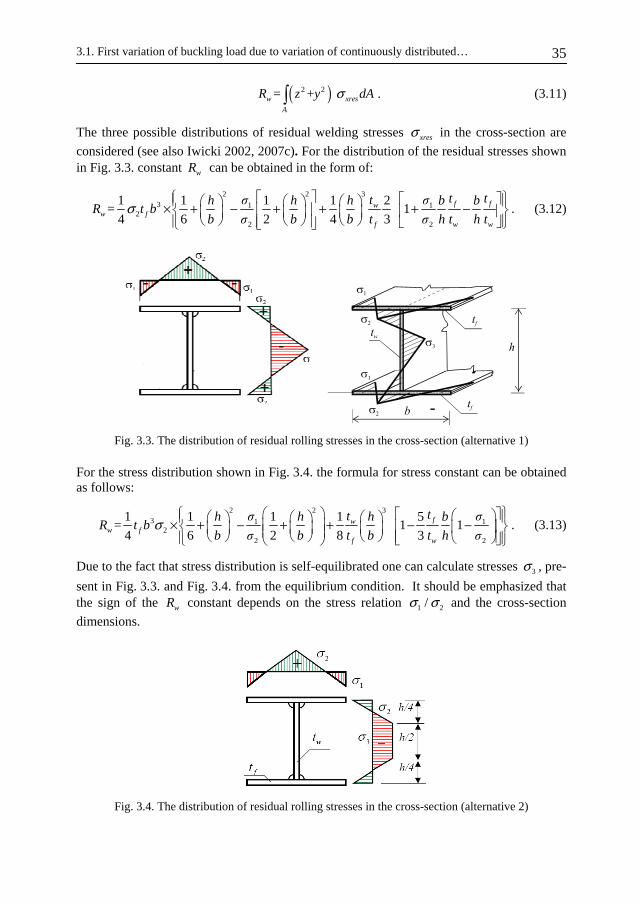
3.1. First variation of buckling load due to variation of continuously distributed… 35
( )2 2= + . w xres
A
R z y dAσ∫ (3.11)
The three possible distributions of residual welding stresses xresσ in the cross-section are
considered (see also Iwicki 2002, 2007c). For the distribution of the residual stresses shown in Fig. 3.3. constant wR can be obtained in the form of:
2 2 3
3 1 12
2 2
1 1 1 1 2= 1
4 6 2 4 3f fw
w ff w w
t ttσ σh h h b bR t b
b σ b b t σ h t h tσ
⎧ ⎡ ⎤ ⎫⎡ ⎤⎪ ⎪⎛ ⎞ ⎛ ⎞ ⎛ ⎞× + − + + + −⎢ ⎥⎨ ⎬⎢ ⎥⎜ ⎟ ⎜ ⎟ ⎜ ⎟⎝ ⎠ ⎝ ⎠ ⎝ ⎠ ⎪⎢ ⎥⎪ ⎣ ⎦⎭⎩ ⎣ ⎦
. (3.12)
Fig. 3.3. The distribution of residual rolling stresses in the cross-section (alternative 1)
For the stress distribution shown in Fig. 3.4. the formula for stress constant can be obtained as follows:
2 2 3
3 1 12
2 2
1 1 1 1 5= 1 1
4 6 2 8 3fw
w ff w
ttσ σh h h bR t b
b σ b t b t h σσ
⎫⎧ ⎛ ⎞ ⎡ ⎤⎛ ⎞⎪ ⎪⎛ ⎞ ⎛ ⎞ ⎛ ⎞× + − + + − −⎜ ⎟ ⎢ ⎥⎨ ⎬⎜ ⎟⎜ ⎟ ⎜ ⎟ ⎜ ⎟⎜ ⎟⎝ ⎠ ⎝ ⎠ ⎝ ⎠ ⎢ ⎥⎪ ⎝ ⎠ ⎪⎣ ⎦⎩ ⎝ ⎠ ⎭. (3.13)
Due to the fact that stress distribution is self-equilibrated one can calculate stresses 3σ , pre-
sent in Fig. 3.3. and Fig. 3.4. from the equilibrium condition. It should be emphasized that the sign of the wR constant depends on the stress relation 1 2/σ σ and the cross-section
dimensions.
Fig. 3.4. The distribution of residual rolling stresses in the cross-section (alternative 2)

3. Sensitivity analysis of buckling loads of thin-walled structural members 36
The sign of the stress constant depends on the relationship between the stresses in the cross section. Relationships described by Eq. (3.12) and Eq. (3.13) for I-column with b = h, tw = tf, in function of the stress relation in the cross-section are shown in Fig. 3.5. Similar conclusions are presented by Szymczak (1998), where the initial post-buckling behaviour of column with residual stresses is also investigated.
0.8 0.9 1.0 1.1
σ1 /σ2
-0.6
-0.4
-0.2
0.0
0.2
0.4
Rw [k
Nm
2 ]
Rw 1
Rw 2
b = h = 0.2 mtf = tw = 0.01 mσ1 = σ2 = 100000 kPa
Fig. 3.5. The Rw constant relationships in function of σ1 /σ2 for two alternatives (Eq. 3.12 and Eq. 3.13) of residual stress distribution
Fig. 3.6. The distribution of residual rolling stresses in the cross-section [MPa] (Boverkets handbok om stalkonstruktioner 1994)
For residual stress distribution according to Swedish code (1994), there is no doubt about the sign of constant wR (Fig. 3.6). For the stress distribution shown in Fig. 3.7. the formula
for the stress constant can be obtained as follows:
( )( )4 3 4 2 2 2
3 2 2 2 2 4w
3 2 2 3 4
405 1008 1620 216 1
32 96 216 405 192
16 216 1008 1620
yk f w w f w
f f f f
c
w w w w
f t ht t h t t
R b t bh t h t t
h t h t ht tσ
⎛ ⎞× − + + + +⎜ ⎟⎜ ⎟= ⎛ ⎞− − + + +⎜ ⎟×⎜ ⎟⎜ ⎟⎜ ⎟− + − +⎝ ⎠⎝ ⎠
, (3.14)

3.1. First variation of buckling load due to variation of continuously distributed… 37
where cσ is the stress that can be calculated from equilibrium condition in normal direc-
tion, ykf is the yield strength.
Fig. 3.7. The distribution of residual welding stresses in the cross-section (Boverkets handbok om stalkonstruktioner 1994)
The first variation of critical load of torsional buckling due to the residual stress variation may be derived in a similar form to Eq. (3.6). Thus,
( )2
0,
2 2 00
0
,
( ) ,cr
l
w u l
cr P ul
R udx
P x u dx
r dx
δδ δ
′Θ= = Λ
′Θ
∫∫
∫ (3.15)
where u denotes the design variable, as for example, residual stress parameters. The under-integral function ΛPcr,u describes the influence of variation of the residual stresses on the critical load of torsional buckling.
3.1.5. Sensitivity analysis of buckling load of thin-walled columns due to temperature change
The objective of the numerical modelling, the analytical methods and the experimental tests of steel columns and frames at elevated temperature is the estimation of the construc-tion critical temperature and the critical time for the construction to resist fire. In the analy-sis of the load-bearing capacity of columns, beams and frames at elevated temperature loss of the material strength, stiffness and internal force redistribution due to thermal expansion should be taken into account. The effects of various parameters, such as, relative slender-ness ratio, load eccentricity, steel grade, residual stresses and initial imperfections should be considered. In practical design problems it is useful to have a simple method to obtain
3. Sensitivity analysis of buckling loads of thin-walled structural members 38
a realistic estimation of the column fire resistance. The finite element programs offer a wide range of applications, but for design purposes a simplified analysis that can be performed manually is needed, because it enables engineers to calculate quickly the column buckling loads. Such simple approach based on the Rankine interaction formula was proposed by Tang et al. (2001), and later developed by Toh et al. (2003) or Huang and Tan (2003). The problem of fire resistance is also present in many design codes. In Polish steel structures design rules (PN-90/B-03200 1990), in Eurocode 1993-1-2 (2001) or in British Standard 5950 the reduced steel strength, the reduced elastic modulus and the reduced stability coef-ficient are recommended for analysis of steel structures at elevated temperature.
Columns under fire conditions are usually exposed to non-uniform temperature distri-bution in the longitudinal direction. The difference in temperature between the top and the bottom ends of a column can be quite significant and therefore in numerical calculations the gas layers are artificially divided into zones of different temperatures. In multistorey frames fire protection may have different thicknesses in different zones and due to this the struc-ture is subjected to non-uniform temperature in various zones. Only in few researches the temperature distribution along the member length is taken into account, as for example in the work conducted by Tan & Yuan (2008, 2009) where analytical derivations of the stabil-ity of columns being subject to longitudinal temperature variations are presented.
In the present paper the sensitivity analysis (Haug et al. 1986) is used to predict the column behaviour at elevated temperature, on the basis of the results of conventional analy-sis of column performed at ambient temperature. The sensitivity analysis of critical force due to Young’s modulus is calculated and then the description of the material model in function of the member temperature is implemented to obtain the critical force sensitivity in function of cross-sectional temperature. The assumptions of the classical theory of thin–walled members with non-deformable cross-section (Vlasov 1961) are adopted in this research. Across a column section, the temperature is assumed to be uniform. The sensitiv-ity analysis makes it possible to find functions describing the influence of the temperature variation in the cross-section on the critical loads. The influence line gives a possibility to find parts of the column where the temperature change causes the largest variation of the critical force. Using the influence line one can divide the column into a fire zone with dif-ferent fire protection thicknesses or in design of fire zone in multi-storey frames. The linear approximation of the exact relation of the critical loads due to variation of the cross-section temperature is determined. The sensitivity analysis enables engineers to predict the critical force of column undergoing non-uniform temperature distribution along its length on the basis of the conventional statical analysis for columns with uniform temperature distribu-tion. The research presented in this section gives some possible applications of the sensitiv-ity analysis rather than some exact solutions of structural stability in the case of fire. The correctness and accuracy of the presented method also depend on the functions describing the material characteristics related to temperature.
The load – bearing capacity of an axially loaded column
The load-bearing capacity of an axially compressed column at elevated temperature depends on the temperature variation along the column and over its cross-section, the mate-rial expansion due to temperature variation and the reduction of material strength and stiff-ness. When the column is affected by a rising temperature the load-bearing coefficient calculated at ambient temperature decreases. It is therefore useful in design practice to approximate the relation between the load-bearing coefficient and the temperature of the column. The sensitivity analysis makes it possible to derive such a relation. The first order
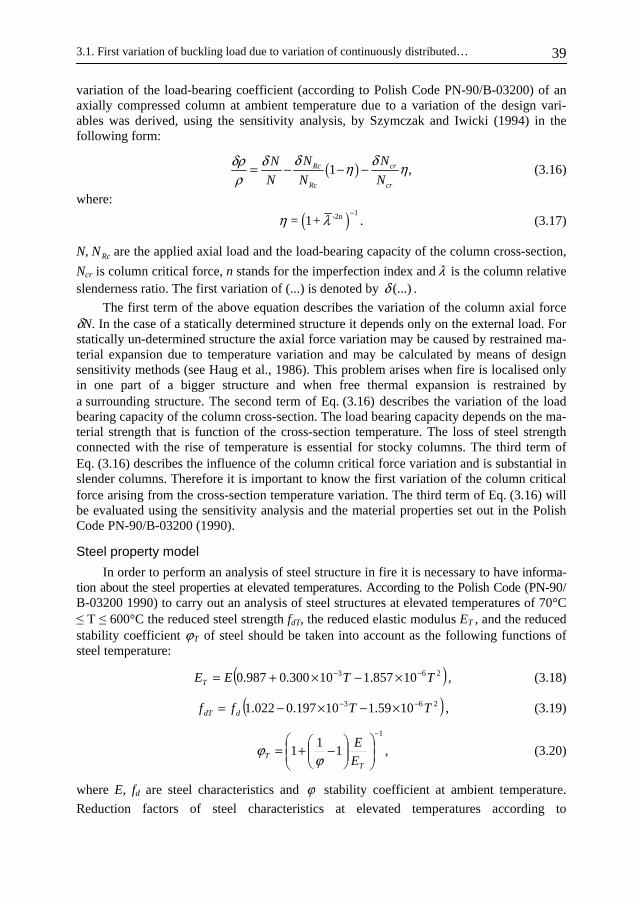
3.1. First variation of buckling load due to variation of continuously distributed… 39
variation of the load-bearing coefficient (according to Polish Code PN-90/B-03200) of an axially compressed column at ambient temperature due to a variation of the design vari-ables was derived, using the sensitivity analysis, by Szymczak and Iwicki (1994) in the following form:
( )1 ,Rc cr
Rc cr
N NN
N N N
δ δδρ δ η ηρ
= − − − (3.16)
where:
( ) 1-2n= 1+ .η λ−
(3.17)
N, RcN are the applied axial load and the load-bearing capacity of the column cross-section,
Ncr is column critical force, n stands for the imperfection index and λ is the column relative slenderness ratio. The first variation of (...) is denoted by (...)δ .
The first term of the above equation describes the variation of the column axial force δN. In the case of a statically determined structure it depends only on the external load. For statically un-determined structure the axial force variation may be caused by restrained ma-terial expansion due to temperature variation and may be calculated by means of design sensitivity methods (see Haug et al., 1986). This problem arises when fire is localised only in one part of a bigger structure and when free thermal expansion is restrained by a surrounding structure. The second term of Eq. (3.16) describes the variation of the load bearing capacity of the column cross-section. The load bearing capacity depends on the ma-terial strength that is function of the cross-section temperature. The loss of steel strength connected with the rise of temperature is essential for stocky columns. The third term of Eq. (3.16) describes the influence of the column critical force variation and is substantial in slender columns. Therefore it is important to know the first variation of the column critical force arising from the cross-section temperature variation. The third term of Eq. (3.16) will be evaluated using the sensitivity analysis and the material properties set out in the Polish Code PN-90/B-03200 (1990).
Steel property model
In order to perform an analysis of steel structure in fire it is necessary to have informa-tion about the steel properties at elevated temperatures. According to the Polish Code (PN-90/ B-03200 1990) to carry out an analysis of steel structures at elevated temperatures of 70°C ≤ T ≤ 600°C the reduced steel strength fdT, the reduced elastic modulus ET , and the reduced stability coefficient ϕT of steel should be taken into account as the following functions of steel temperature:
( )263 10857.110300.0987.0 TTEET−− ×−×+= , (3.18)
( )263 1059.110197.0022.1 TTff ddT−− ×−×−= , (3.19)
1
11
1
−
⎟⎟⎠
⎞⎜⎜⎝
⎛⎟⎟⎠
⎞⎜⎜⎝
⎛−+=
TT E
E
ϕϕ , (3.20)
where E, fd are steel characteristics and ϕ stability coefficient at ambient temperature.
Reduction factors of steel characteristics at elevated temperatures according to
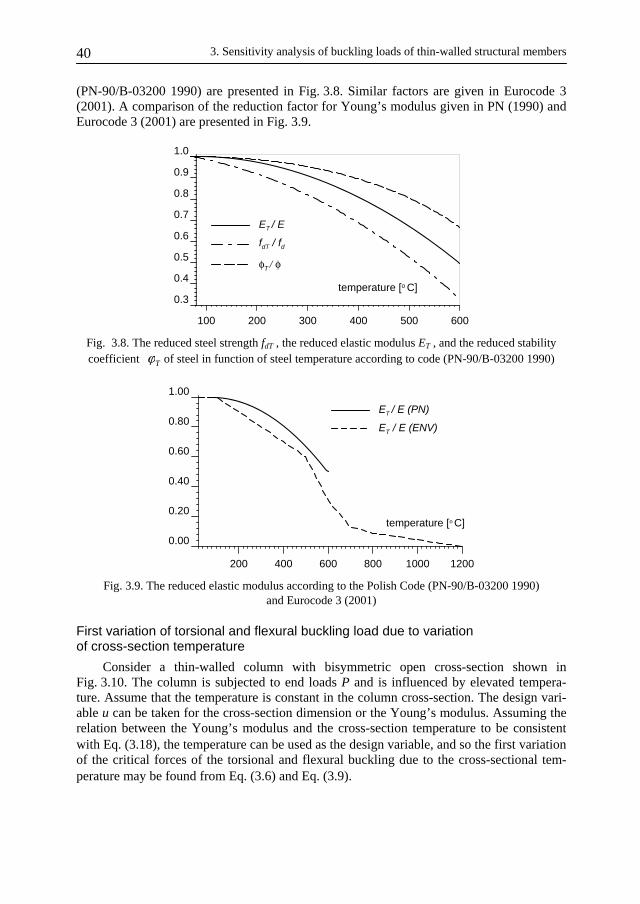
3. Sensitivity analysis of buckling loads of thin-walled structural members 40
(PN-90/B-03200 1990) are presented in Fig. 3.8. Similar factors are given in Eurocode 3 (2001). A comparison of the reduction factor for Young’s modulus given in PN (1990) and Eurocode 3 (2001) are presented in Fig. 3.9.
100 200 300 400 500 600
temperature [o C]0.3
0.4
0.5
0.6
0.7
0.8
0.9
1.0
ET / E
fdT / fd
φT / φ
Fig. 3.8. The reduced steel strength fdT , the reduced elastic modulus ET , and the reduced stability coefficient Tϕ of steel in function of steel temperature according to code (PN-90/B-03200 1990)
200 400 600 800 1000 1200
temperature [o C]
0.00
0.20
0.40
0.60
0.80
1.00
ET / E (PN)
ET / E (ENV)
Fig. 3.9. The reduced elastic modulus according to the Polish Code (PN-90/B-03200 1990) and Eurocode 3 (2001)
First variation of torsional and flexural buckling load due to variation of cross-section temperature
Consider a thin-walled column with bisymmetric open cross-section shown in Fig. 3.10. The column is subjected to end loads P and is influenced by elevated tempera-ture. Assume that the temperature is constant in the column cross-section. The design vari-able u can be taken for the cross-section dimension or the Young’s modulus. Assuming the relation between the Young’s modulus and the cross-section temperature to be consistent with Eq. (3.18), the temperature can be used as the design variable, and so the first variation of the critical forces of the torsional and flexural buckling due to the cross-sectional tem-perature may be found from Eq. (3.6) and Eq. (3.9).
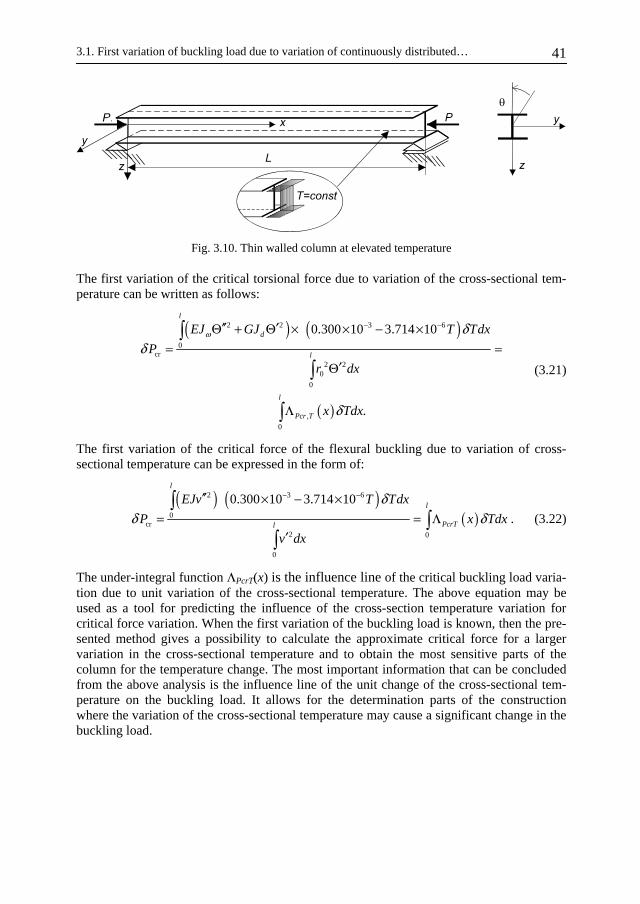
3.1. First variation of buckling load due to variation of continuously distributed… 41
Fig. 3.10. Thin walled column at elevated temperature
The first variation of the critical torsional force due to variation of the cross-sectional tem-perature can be written as follows:
( ) ( )
( )
2 2 3 6
0cr
2 20
0
,
0
0.300 10 3.714 10
.
l
d
l
l
Pcr T
EJ GJ T Tdx
P
r dx
x Tdx
ω δδ
δ
− −′′ ′Θ + Θ × × − ×= =
′Θ
Λ
∫
∫
∫
(3.21)
The first variation of the critical force of the flexural buckling due to variation of cross-sectional temperature can be expressed in the form of:
( ) ( )
( )2 3 6
0cr
2 0
0
0.300 10 3.714 10l
l
PcrTl
EJv T Tdx
P x Tdx
v dx
δδ δ
− −′′ × − ×= = Λ
′
∫∫
∫. (3.22)
The under-integral function ΛPcrT(x) is the influence line of the critical buckling load varia-tion due to unit variation of the cross-sectional temperature. The above equation may be used as a tool for predicting the influence of the cross-section temperature variation for critical force variation. When the first variation of the buckling load is known, then the pre-sented method gives a possibility to calculate the approximate critical force for a larger variation in the cross-sectional temperature and to obtain the most sensitive parts of the column for the temperature change. The most important information that can be concluded from the above analysis is the influence line of the unit change of the cross-sectional tem-perature on the buckling load. It allows for the determination parts of the construction where the variation of the cross-sectional temperature may cause a significant change in the buckling load.

3. Sensitivity analysis of buckling loads of thin-walled structural members 42
3.2. The first variation of the buckling loads due to the variation of stiffeners location
3.2.1. The first variation of the critical load of torsional buckling due to the variation of stiffeners location
Let us consider a column with an in-span elastic restraint situated at position x0
(Fig. 3.11). The variation δx0 is assumed to be the design variable. The derivation of the critical force variation is based on functional analysis (Gelfand and Fomin 1970).
Fig. 3.11. Axially compressed thin-walled column with stiffeners of changed location: (a) warping stiffener, (b) torsional, and (c) lateral
The brace divides the column into two parts. In each part of the column the differential equilibrium equation has the form well known in the literature (Vlasov 1961):
( ) 0 0, ii i i i i di i
i
JE J P G J
Aω
′⎛ ⎞⎛ ⎞″′′ ′Θ + − Θ =⎜ ⎟⎜ ⎟⎜ ⎟⎝ ⎠⎝ ⎠
(3.23)
where index i=L, P denotes part of the column on the left and on the right side of the brace position. The multiplication of the above equation by λ and its integration provides:
( ){ } ( ){ }2
0 0
0 , , , , , , ,ll l
L L L L L P P P P PG dx G dxλ λ′ ′′ ′ ′′= Θ Θ Θ + Θ Θ Θ∫ ∫ (3.24)

3.2. The first variation of the buckling loads due to the variation of stiffeners location 43
where λ is Lagrangian multiplier, l1 , l2 are the lengths of parts of the column on the left and on the right side of the brace, and:
( ) ( ) 0i G , , , i
i i i i i i i i i dii
JE J P GJ
Aωλ λ′⎡ ⎤⎛ ⎞⎛ ⎞″⎢ ⎥′ ′′ ′′ ′Θ Θ Θ = Θ + − Θ⎜ ⎟⎜ ⎟⎜ ⎟⎢ ⎥⎝ ⎠⎝ ⎠⎢ ⎥⎣ ⎦
(3.25)
The increment of Eq. (3.24) due to change of brace location 0xδ is:
( )
( )
( ) ( )
1
2
1 2
0
P
0+
0 0
0 , , ,
, , ,
, , , , , , .
l x
L L L L L L L L L
l
P P P P P P P P
x
l l
L L L L L P P P P P
G dx
G dx
G dx G dx
δ
δ
λ δλ δ δ δ
λ δλ δ δ δ
λ λ
+
′ ′ ′′ ′′= + Θ + Θ Θ + Θ Θ + Θ +
′ ′ ′′ ′′+ + Θ + Θ Θ + Θ Θ + Θ +
′ ′′ ′ ′′− Θ Θ Θ − Θ Θ Θ
∫
∫
∫ ∫
(3.26)
Expanding Eq. (3.26) into power series, and taking into account only the linear part of it, after integration by parts one can obtain the following relation for the first variation of the torsional buckling load:
( ) ( )
( ) ( )
( )1
0 0
, ,0 0
0
0
l l
cr dL P L P
d
L sL L L sL L L L P sP Pl
J JP dx EJ P GJ k k
A A
JEJ P GJ k k dx
A
M B M B x M B
ω
ω
δ λ λ λ λ λ δ
δλ
λ λ δ λ λ
′Θ Θ
′Θ Θ
′⎧⎡ ⎤⎛ ⎞″ ′⎛ ⎞⎪⎢ ⎥′ ′ ′′ ′ ′Θ = − − − + − Θ +⎨ ⎜ ⎟⎜ ⎟⎢ ⎥⎝ ⎠⎝ ⎠⎪⎣ ⎦⎩′ ⎫⎡ ⎤⎛ ⎞″ ′⎛ ⎞ ⎪⎢ ⎥′′ ′ ′− Θ + − Θ − Θ + Θ ⎬⎜ ⎟⎜ ⎟⎢ ⎥⎝ ⎠⎝ ⎠ ⎪⎣ ⎦ ⎭
′ ′ ′ ′ ′′ ′ ′ ′+ − + + Θ − Θ − − +
∑ ∑∫ ∫
( )
1 1 1 11 11 1
00
0 0 0 00 00 0
,
P sP P P P
sL Ll L Ll L Ll L sLll ll l
sP P P P P P P sP
M B x
M B B M
M B B M
δ
δ δ λ δ λ δ
δ δ λ δ λ δ
′ ′′+ Θ − Θ +
′ ′− Θ + Θ − + +
′ ′+ Θ − Θ + −
(3.27)
where the following relation for the boundary values of variations, and the notations are used:
( )
( )
( )
0
0
,
,
,
,
s d
s d
JM EJ GJ P
A
B EJ
B EJ
JM EJ GJ P
A
ω
ω
ω
ω
δ δ
δ δλ
λ λ
⎛ ⎞⎛ ⎞′′′ ′= − Θ + − Θ⎜ ⎟⎜ ⎟⎝ ⎠⎝ ⎠
′′= − Θ
′′= −
⎛ ⎞′′′ ′= − + −⎜ ⎟⎝ ⎠
(3.28)
and

3. Sensitivity analysis of buckling loads of thin-walled structural members 44
1 11
1 11
1 11
1 11
0 0 00
0
0 0 00
0
0 0 00
0
0 0 00
0
,
,
,
,
,
,
,
,
sP sP sP
sL sLl sLll
P P P
L Ll Lll
P P P
L Ll Lll
P P P
L Ll Lll
M M M x
M M M x
B B B x
B B B x
x
x
x
x
δ δ δ
δ δ δ
δ δ δ
δ δ δ
δ δ δ
δ δ δ
δ δ δ
δ δ δ
′= −
′= −
′= −
′= −
′Θ = Θ − Θ
′Θ = Θ − Θ
′ ′ ′′Θ = Θ − Θ
′ ′ ′′Θ = Θ − Θ
(3.29)
Since the first variation of the objective functional should be independent of the displace-ment function and the Lagrangian multiplier variations and δ δλΘ , the under-integral part of Eq. (3.27) is zero. The under-integral parts of Eq. (3.27) represent a differential equation of the primary and adjoint system. In the case of critical load variation, the primary and adjoint systems have the same buckling mode of the column. Taking into account the natu-ral boundary conditions in the following form:
11
11
11
11
00
00
00
00
0
0
0
0
sL Ll sP Pl
L Ll P Pl
L Ll P Pl
L sLl P sPl
M M
B B
B B
M M
δ δ
δ δ
λ δ λ δ
λ δ λ δ
− Θ + Θ =
′ ′+ Θ − Θ =
′ ′− + =
+ − =
(3.30)
one can finally obtain the first variation of the torsional critical load of the column due to a change of brace location:
( )( )
1
1 2
0
2 2 2 20 0
0 0
L sL L L sL L L L l
P sP P P sP P P P
cr l l
M B M Bx
M B M BP
r dx r dx
λ λδ
λ λδ
⎧ ⎫′ ′ ′ ′ ′′− + + Θ − Θ +⎪ ⎪⎨ ⎬
′ ′ ′ ′ ′′− − + + Θ − Θ⎪ ⎪⎩ ⎭=′ ′Θ + Θ∫ ∫
0
. (3.31)
First variation of the torsional critical load due to the variation of warping restraint location
Let us consider at first a column with braces of a bimoment type (Fig. 3.11a). Accord-ing to Plum and Svensson (1993) the brace of a bimoment type causes a discontinuity of the bimoment in the beam. The warping stiffener connected to beam flanges undergoes torsion enforced by warping of beam-column flanges. In recent research by Szymczak et al. (2003) the stiffeners have been modelled by means of shell elements and their stiffness was set with a better accuracy. Aside from stiffener modelling, the warping restraining elements

3.2. The first variation of the buckling loads due to the variation of stiffeners location 45
cause a torsional angle of rotation, its first and third derivative, and also the torsional mo-ment become continuous in the cross-section with a bimoment-type stiffener applied. Thus,
( )0B k x′Θ ′Δ = Θ . (3.32)
Taking into account the continuity conditions (3.32), the first variation of the tosional criti-cal load due to the variation of warping restraining stiffener location, 0xδ takes the follow-
ing form:
( )
( )( )
0
0
2 20 0
0
2 20 0 0
0
l
cr L L P P x
l
L P x
P B B x r dx
k x x r dx
δ δ
δ′Θ
′′ ′′ ′= − Θ + Θ Θ
′ ′′ ′′ ′= Θ Θ + Θ Θ
∫
∫ (3.33)
First variation of the torsional buckling load due to the variation of torsional stiffener location
Let us consider now a column with torsional stiffener (Fig. 3.11b). In the case of tor-sional stiffener with stiffness kΘ , the torsional angle and its first and second derivatives are
continuous in the cross-section. Thus,
.i ix x
M kΘΔ = Θ (3.34)
Making use of Eq. (3.31), the first variation of torsional critical load due to the variation of torsional stiffener location 0xδ can be written in the following form:
( )
( ) ( )
0
2 20 0 0
0
2 20 0 0 0
0
( )
2 .
l
cr x
l
P x M M x r dx
k x x x r dx
ω ωδ λ δ
δΘ
′ ′ ′= −Δ − Δ Θ Θ =
′ ′Θ Θ Θ
∫
∫
(3.35)
3.2.2. First variation of the flexural buckling load due to the variation of lateral brace location
Let us consider now a column with lateral braces (Fig. 3.11c). The deflection and its first and second derivatives are continuous in the cross-section. Thus,
0 0
,vx xT k vΔ = (3.36)
where T is shear force. The first variation of the flexural critical load related to the variation of the lateral brace location can be expressed in the following form:
( ) ( ){ } ∫ =′′+′′−′+′′=l
xPPPPLLLLcr dxvxvTMvTMP0
20
0δλλδ
∫ ′′l
v dxvxxvxvk0
2000 .)()(2 δ
(3.37)
Examples of sensitivity of critical buckling loads of columns due to variations of stiffeners location are presented in Section 4.

3. Sensitivity analysis of buckling loads of thin-walled structural members 46
3.3. Sensitivity analysis of critical buckling loads of discrete structural systems
Let us now consider a discrete structural system. The equilibrium equation for the structural systems can be written as follows:
( )G- = , crPK K z 0 (3.38)
where K is the initial stiffness matrix component, KG is initial stress stiffness matrix (geo-metrical matrix), z denotes the nodal displacement vector, and Pcr is the critical load multi-plier. Initial stiffness and initial stress matrices for a member undergoing torsion were de-rived by Szymczak (1978, 1980), Waszczyszyn et al. (1990) or Weiss and Giżejowski (1991). Assuming that the displacement vector is normalized with respect to geometrical matrix by the condition: G 1, T =z K z (3.39)
and that the global stiffness and geometric matrices are positive definite and differentiable with respect to design variables vector u, it is possible to differentiate Eq. (3.38) with respect to design variable u:
G G G, = , , . T T T T Tu u cr u cr u cr uP P P+ + +z K z z Kz z K z z K z z K z (3.40)
Using normalization condition (3.39) one can obtain the first derivative of the buckling load with respect to the design variable in the form
G G, ( , , ) ( ) .T Tcr u u cr u cr uP P P= − + −z K K z z K K z (3.41)
The second term of the above equation is zero because the structure must satisfy the equi-librium condition (Eq. (3.38)). On the basis of the first derivative of the buckling load with respect to the arbitrary design variable, the equation for the first variation of the critical load with respect to the variation of the design variables vector can be obtained (see also Iwicki 2010a)
( )G ,, , , .cr
Tcr cr cr PP P Pδ δ δ δ= = − =u u u uu z K K z u Λ u (3.42)
The ,crP uΛ vector describes the influence of the unit change of the design on the buckling
load. The above equation may be used as a tool to determine the influence of the manufac-turing inaccuracies, the variations of the cross-sectional dimensions, the residual stresses or the cross-section temperature variation on the variation of the buckling load.
The Eq. (3.42) may be used to determine a change in the structural response in the dis-cretized systems, due to variation of such design variables as degree of accuracy of the manufacturing (variation of the cross-section dimensions) or imperfections, the cross-section temperature, stiffness and position of braces or the residual stresses. The variation of the following design parameters might be taken as degree of accuracy: the web thickness and width, the flange thickness and the width as well as Young’s modulus. Many of the above parameters are included in the Polish Code (PN-B-06200). For example, the cross-section height may vary about 0.3%, and the width of the flange may vary about 1%. The use of the presented method makes it possible to calculate the approximate structural re-sponse to a larger variation in the design and to obtain most sensitive parts of the column responding to the inaccuracy of the manufacturing process. Eq. (3.42) might be helpful, for

3.3. Sensitivity analysis of critical buckling loads of discrete structural systems 47
example, in the estimation of structure response to other changes of cross-section dimen-sions caused by corrosion. The most important information that can be concluded from the above analysis is the influence of the unit change of the design on the buckling load.
3.4. Linear approximation of exact relation between critical load and design variable
The first variation of the critical load of column crPδ due to the variation of the design
variables may by used to determine the linear approximation of an exact relation between the critical buckling load of the column and the magnitude of the design variable u in the following form: ( ) ( ) ( )cr cr 0 cr 0( 1)P u P u P u u uδ δ= + = × − , (3.43)
where: u – actual magnitude of the design variable, u0 – initial magnitude of the design variable. The linear approximation of the exact relation between the critical buckling load of the column and the brace location can be written in a similar form to the variation of other design variables. It yields:
( ) ( ) ( )cr cr 0 cr 0 0 0( ) ( ) ( ( 1))P k x P k x P k x x x xδ δ= + + = × − , (3.44)
where: x – actual coordinate of brace that changes its position, x0 – initial coordinate of brace.
3.5. Parametrical analysis of structures
The sensitivity analysis are compared to “exact relation” between the critical buckling loads and the design parameters. This relation is found by means od a parametrical analysis carried out for different magnitudes of the design parameters. The parametrical analysis of various illustrative examples of columns presented in Section 4 are calculated by means of program SEAN, developed by Iwicki (1997) for the sensitivity analysis of statical prob-lems, and then adopted by the author to the stability problems of thin-walled structures with a bisymmetric open cross-section (Szymczak et al. 2000). The beam element applied in the program takes into account the warping effect of the cross-section. Part of initial stiffness matrix component and the initial stress stiffness matrix responsible for torsion and the warping effects were derived by Szymczak (1978, 1980), Waszczyszyn et al. (1990) or Weiss and Giżejowski (1991) are:
2 2 2 2
2 2 22 2
3 2 2
22
12 1 6 1 12 1 6 110 60 10 60
4 1 6 1 2 130 60 60
,
12 1 6 110 60
4 130
e
l l
l lEJ
lsymmetry l
l
ω
κ κ κ κ
κ κ κ
κ κ
κ
Θ
⎡ ⎤⎛ ⎞ ⎛ ⎞ ⎛ ⎞ ⎛ ⎞+ + − + +⎢ ⎥⎜ ⎟ ⎜ ⎟ ⎜ ⎟ ⎜ ⎟
⎝ ⎠ ⎝ ⎠ ⎝ ⎠ ⎝ ⎠⎢ ⎥⎢ ⎥⎛ ⎞ ⎛ ⎞ ⎛ ⎞⎢ ⎥+ − + −⎜ ⎟ ⎜ ⎟ ⎜ ⎟⎢ ⎥⎝ ⎠ ⎝ ⎠ ⎝ ⎠= ⎢ ⎥
⎛ ⎞ ⎛ ⎞⎢ ⎥+ − +⎜ ⎟ ⎜ ⎟⎢ ⎥⎝ ⎠ ⎝ ⎠⎢ ⎥⎢ ⎥⎛ ⎞
+⎢ ⎥⎜ ⎟⎢ ⎥⎝ ⎠⎣ ⎦
K

3. Sensitivity analysis of buckling loads of thin-walled structural members 48
0 Ge r
Θ =K
2 22
2
1.2 0.1 1.2 0.1
2 10.1
15 30 .1.2 0.1
2.
15
l l
l l l
ll
sym l
−⎡ ⎤⎢ ⎥⎢ ⎥− −⎢ ⎥⎢ ⎥−⎢ ⎥⎢ ⎥⎢ ⎥⎣ ⎦
(3.45)
where dGJ EJωκ = is torsion parametr.
In the parametrical analysis of trusses, columns or frames presented in Chapter 5, 6 a commercial finite element program ROBOT STRUCTURAL ANALYSIS PROFESSIONAL (2010) has been used. Spatial beam elements with six degrees of freedom in node were used to model the trusses and frames. Positive displacements and nodal forces in 3D frame element are presented in Fig 3.12.
Fig. 3.12. The 3D beam element used in the program ROBOT STRUCTURAL ANALYSIS PROFESSIONAL (2010)
By the use of the stability analysis it is possible to calculate the critical load multiplier Pcr (Eq. (3.38)). Once the critical load multiplier Pcr is determined, the buckling length le and the effective length factor μ of an individual column can be computed as:
,cr
ee
ll
l
EJ
Pπ μ= = . (3.46)
The buckling length of the compressed elements is necessary for the designer to calcu-late the slenderness ratio λ , and than the stability coefficientϕ , that is needed to find the
load – bearing capacity of an axially loaded member. The effective buckling length may also be compared with some simplified code requirements. However in the case of torsional of flexural-torsional buckling, a more general formula for the slenderness ratio is used:
cr
Rc
N
N15.1=λ , (3.47)
where Ncr is the normal force in the member corresponding to the buckling load and NRc is the load-bearing capacity of the cross-section.
The stability analysis allows finding the buckling modes of structure, but does not provide information about the forces in bracing. Therefore a geometrically non-linear
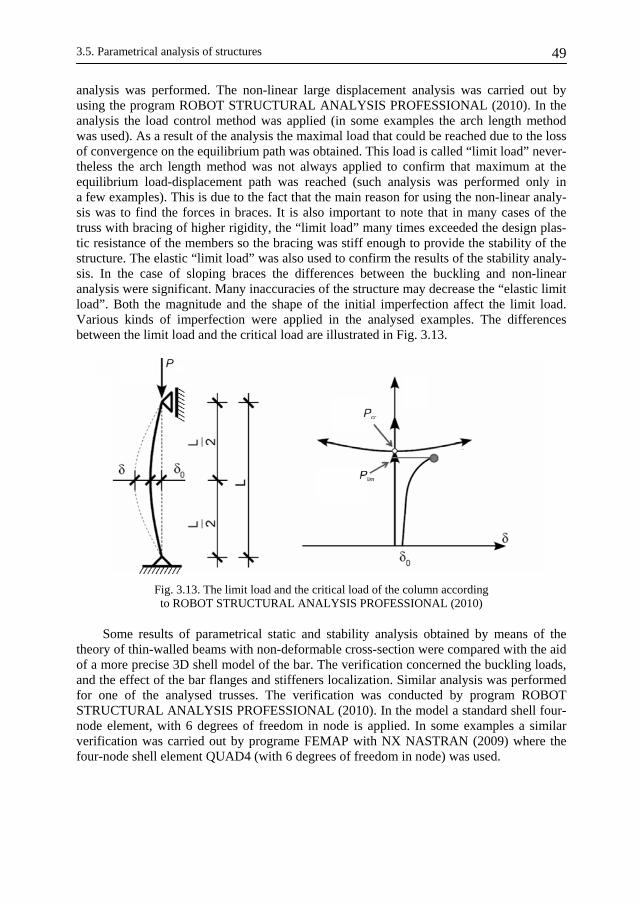
3.5. Parametrical analysis of structures 49
analysis was performed. The non-linear large displacement analysis was carried out by using the program ROBOT STRUCTURAL ANALYSIS PROFESSIONAL (2010). In the analysis the load control method was applied (in some examples the arch length method was used). As a result of the analysis the maximal load that could be reached due to the loss of convergence on the equilibrium path was obtained. This load is called “limit load” never-theless the arch length method was not always applied to confirm that maximum at the equilibrium load-displacement path was reached (such analysis was performed only in a few examples). This is due to the fact that the main reason for using the non-linear analy-sis was to find the forces in braces. It is also important to note that in many cases of the truss with bracing of higher rigidity, the “limit load” many times exceeded the design plas-tic resistance of the members so the bracing was stiff enough to provide the stability of the structure. The elastic “limit load” was also used to confirm the results of the stability analy-sis. In the case of sloping braces the differences between the buckling and non-linear analysis were significant. Many inaccuracies of the structure may decrease the “elastic limit load”. Both the magnitude and the shape of the initial imperfection affect the limit load. Various kinds of imperfection were applied in the analysed examples. The differences between the limit load and the critical load are illustrated in Fig. 3.13.
Fig. 3.13. The limit load and the critical load of the column according to ROBOT STRUCTURAL ANALYSIS PROFESSIONAL (2010)
Some results of parametrical static and stability analysis obtained by means of the theory of thin-walled beams with non-deformable cross-section were compared with the aid of a more precise 3D shell model of the bar. The verification concerned the buckling loads, and the effect of the bar flanges and stiffeners localization. Similar analysis was performed for one of the analysed trusses. The verification was conducted by program ROBOT STRUCTURAL ANALYSIS PROFESSIONAL (2010). In the model a standard shell four-node element, with 6 degrees of freedom in node is applied. In some examples a similar verification was carried out by programe FEMAP with NX NASTRAN (2009) where the four-node shell element QUAD4 (with 6 degrees of freedom in node) was used.
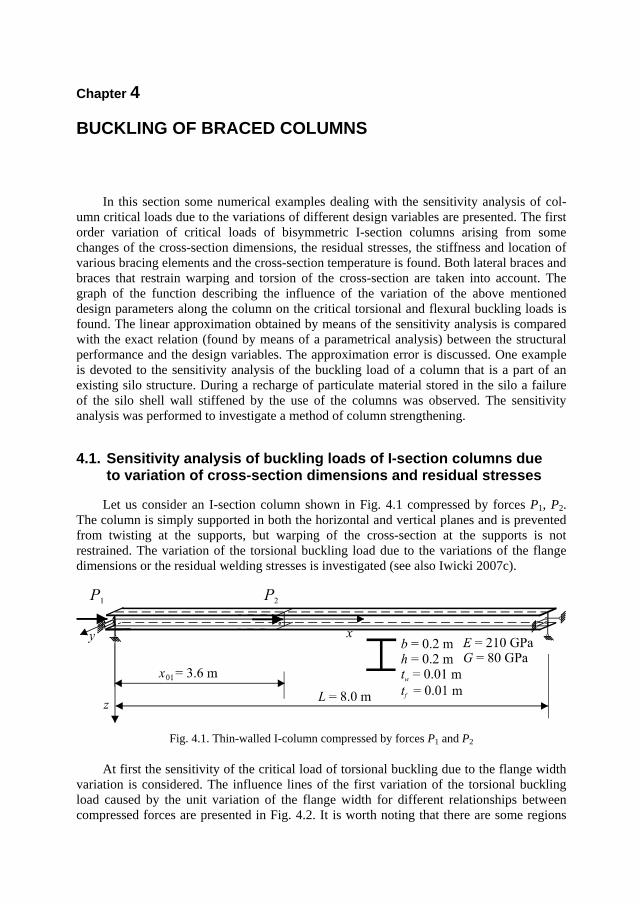
Chapter 4
BUCKLING OF BRACED COLUMNS
In this section some numerical examples dealing with the sensitivity analysis of col-umn critical loads due to the variations of different design variables are presented. The first order variation of critical loads of bisymmetric I-section columns arising from some changes of the cross-section dimensions, the residual stresses, the stiffness and location of various bracing elements and the cross-section temperature is found. Both lateral braces and braces that restrain warping and torsion of the cross-section are taken into account. The graph of the function describing the influence of the variation of the above mentioned design parameters along the column on the critical torsional and flexural buckling loads is found. The linear approximation obtained by means of the sensitivity analysis is compared with the exact relation (found by means of a parametrical analysis) between the structural performance and the design variables. The approximation error is discussed. One example is devoted to the sensitivity analysis of the buckling load of a column that is a part of an existing silo structure. During a recharge of particulate material stored in the silo a failure of the silo shell wall stiffened by the use of the columns was observed. The sensitivity analysis was performed to investigate a method of column strengthening.
4.1. Sensitivity analysis of buckling loads of I-section columns due to variation of cross-section dimensions and residual stresses
Let us consider an I-section column shown in Fig. 4.1 compressed by forces P1, P2. The column is simply supported in both the horizontal and vertical planes and is prevented from twisting at the supports, but warping of the cross-section at the supports is not restrained. The variation of the torsional buckling load due to the variations of the flange dimensions or the residual welding stresses is investigated (see also Iwicki 2007c).
Fig. 4.1. Thin-walled I-column compressed by forces P1 and P2
At first the sensitivity of the critical load of torsional buckling due to the flange width variation is considered. The influence lines of the first variation of the torsional buckling load caused by the unit variation of the flange width for different relationships between compressed forces are presented in Fig. 4.2. It is worth noting that there are some regions

4.1. Sensitivity analysis of buckling loads of I-section columns due to variation…
51
of the column where the influence lines magnitudes are negative. Thus, an increase of the flange width in those regions of the column will cause a decrease of the critical force. For P2 = 4P1 and P2 = 7P1 part of the column near x = 3.8 m and for xœ (7.2 m, 8 m) has a negative sign of the influence line. The same effect for P2 = 0 is found in the vicinity of the supports and for P2 = P1 only near the right support. All lines are related to the critical force of column (P1) for initial value of design variable b0 = 0.2 m. It should be pointed out that the increase of flange width near the column centre is most responsible for increasing the critical torsional load (for P2 = 0).
0.0 1.0 2.0 3.0 4.0 5.0 6.0 7.0 8.0
x [m]-1.0
-0.5
0.0
0.5
1.0
1.5
2.0
ΛP
cr b / P
cr [
1/m
2 ]
P2 = 0(Pcr = 2047.20 kN)
P2 = P1
(Pcr = 1315.80 kN)
P2 = 4P1
(Pcr = 597.48 kN)
P2 = 7P1
(Pcr = 383.13kN)
Fig. 4.2. The influence lines of the column torsional buckling load variation due to the unit variation of the flange width for different compressive load relationships
0.0 1.0 2.0 3.0 4.0 5.0 6.0 7.0 8.0
x [m]-1.0
-0.5
0.0
0.5
1.0
1.5
2.0
ΛP
cr b / P
cr [
1/m
2 ] P2=P1
δb = 0
δb = const
Fig. 4.3. The influence sensitivity function of the column torsional buckling load variation due to the unit variation of the flange width found for the column divided into 20 elements (for P2 = P1)
The sensitivity influence lines allow to find the variation of the buckling load. An applica-tion of Eqs (3.6), (3.42), for the first variation of the buckling load is illustrated in Fig. 4.3. The influence sensitivity function is found for the column divided into 20 elements. The influence of the unit change of the flange width along the element is found by means of Eq. (3.6), and then the first variation of the torsional buckling load for the whole structure is calculated by means of Eq. (3.42) (the variation of the flange width may be different along the column, but constant for each element). It is assumed that the flange width variation

4. Buckling of braced columns
52
δb ∈ const ∈ (3.6 m, 8 m), and that P2 = P1, and then the reference value Pcr01 = 1315.8 kN. As the flange variation δb is assumed for x > 3.6, only this part of the sensitivity function is integrated (outlined part of the Fig. 4.3).
The linear approximation of the relative torsional buckling load of the column due to the flange width variation, found by using the sensitivity analysis method, is compared with the exact relationship between the torsional buckling load and the flange width obtained by a parametrical study (Fig. 4.4).
0.50 0.75 1.00 1.25 1.50 1.75
b / b0 0.7
0.8
0.9
1.0
1.1
1.2
Pcr
/ P
cr01
exact solution P2 = P1
sensitivity analysis
b0 = 0.2 m
Fig. 4.4. The linear approximation of the exact relation of the relative torsional buckling load due to the constant change of the flange width for xœ (3.6 m, 8 m), for the compressive
load relationship P2 = P1
Then the above mentioned effect of the critical force decrease after adding the flange width is numerically verified for the relationship between compressed forces P2 = 7P1. It is assumed that the flange width is changed only close to the right support for x ∈ (7.2 m, 8 m). The linear approximation found by means of the sensitivity method and an exact rela-tionship of the critical load due to the variation of the flange width in this part of the column is obtained (Fig. 4.5). It is assumed that the reference value is the critical load of torsional buckling for the initial flange width Pcr01 = 383.13 kN.
0.50 0.75 1.00 1.25 1.50
b / b0
0.90
0.95
1.00
1.05
1.10
Pcr
/ P
cr01
exact solution P2 = 7P1
sensitivity analysis
b0 = 0.2 m
Fig. 4.5. The linear approximation of the exact relation of the relative torsional buckling load due to constant change of the flange width for ( )7.2 m, 8 mx ∈ , for the compressive load relationship P2 = 7P1

4.1. Sensitivity analysis of buckling loads of I-section columns due to variation…
53
This effect was also confirmed in a spatial analysis of the column modelled in program ROBOT STRUCTURAL ANALYSIS PROFESSIONAL (2010) by means of shell elements (Fig. 4.6). In this analysis a decrease of the critical load is 3.2% for an increase of flange width from 0.2 m to 0.3 m. For the same change of flange width in the column mod-elled by means of beam element the decrease of buckling load is 8%. One can draw a conclusion that in the column modelled by the beam and by the shell elements the effect predicted by the sensitivity analysis is confirmed, but in the column modelled by the shell element the decrease of the buckling load is lower than in the column modelled by the beam elements. The differences between the critical forces of a I-section beam-column found by means of the theory of thin-walled members and from the non-linear 6-parameter theory of shells was presented and discussed by Chróścielewski et at. (2006). It is worth noting that this paradox was found by Cywiński and Kollbrunner (1971), Dąbrowski (1981), Szymczak (1983) or Szymczak et al. (2003a).
Fig. 4.6. Part of the column with a changed width of flange modelled by shell elements
The investigations are followed by a sensitivity analysis of the critical buckling load due to the flange thickness. The influence line of the torsional buckling load resulting from the unit variation of the flange thickness for different relationships between compressed forces is found (Fig. 4.7.). One can conclude that an increase of the flange thickness near the supports causes the largest rise of the torsional buckling load.
0 1 2 3 4 5 6 7 8
x[m]0
10
20
30
40
50
60
ΛP
cr t
/ P
cr
[1/m
2 ]
P2 = 0 (Pcr = 2047.20 kN)
P2 = P1 (Pcr = 1315.80 kN)
P2 = 4P1 (Pcr = 597.48 kN)
P2 = 7P1 (Pcr = 383.12 kN)
Fig. 4.7. The influence lines of the column torsional buckling load variation due to the unit variation of the flange thickness for different compressive load relationships

4. Buckling of braced columns
54
The linear approximation of the exact function of relative buckling load due to the flange thickness variation δt f = const along the column is derived (Fig. 4.8). It is assumed that P2 = P1 (the initial value of the critical normal force of torsional buckling Pcr01 = 1315.8 kN for an initial value of flange thickness t0 = 0.01 m).
0.6 0.8 1.0 1.2 1.4 1.6 1.8
t / t0 0.0
0.5
1.0
1.5
2.0
2.5
Pcr /
Pcr
01
sensitivity analysis P2 = P1
exact solution
t0 = 0.01 m
Fig. 4.8. The linear approximation of the exact relation of the relative critical torsional load due to a constant change of the flange thickness along the column for compressive load relation k = 2
The last case under investigation is the sensitivity analysis of the torsional buckling load due to a variation of the residual stresses. It is assumed that the cross-section residual stress distribution is shown in Fig. 3.3. The maximum value of stresses is initially σ10 = σ20 = 100 MPa. The critical buckling load, for an initial value of residual stress, is Pcr1 = 1295.2 kN (P2 = P1). The influence line of the variation of the torsional buckling load, for different values of the relation between compression forces P2 and P1 due to the unit variation of the residual stress parameter σ1 is found (Fig. 4.9). All lines are related to the torsional buckling load of the column for the initial value of residual stress and for each relation between compression forces P2 and P1.
0 1 2 3 4 5 6 7 8
x [m]
-5.0x10⁻⁷
-4.0x10⁻⁷
-3.0x10⁻⁷
-2.0x10⁻⁷
-1.0x10⁻⁷
ΛP
cr σ
1 / Pcr
[m /
kN]
P2 = 0 (Pcr= 2013.90 kN)
P2 = P1 (Pcr= 1295.20 kN)
P2 = 4P1(Pcr= 588.89 kN)
P2 = 7P1 (Pcr= 377.77 kN)
Fig. 4.9. The influence lines of the column torsional buckling load variation due to the unit variation of the residual welding stresses for different compressive load relationships

4.1. Sensitivity analysis of buckling loads of I-section columns due to variation…
55
Next the linear approximation of the exact relation between the critical load and the residual welding stress parameter 1σ is obtained (Fig. 4.10). The approximation is related
to the critical load for the column with initial value of residual welding stresses and for the relation between the compression forces P2 = P1.
For σ1 = σ2 = fyk = 210 MPa constant Rw is calculated for three assumed residual stress distributions (Figs 3.3, 3.4, 3.7) by means of Eqs 3.12–3.14. It was found that Rw indicated the lowest value for stress distribution shown in Fig. 3.4 (Table 4.1).
0.5 1.0 1.5 2.0 2.5
σ1 /σ10 0.7
0.8
0.9
1.0
1.1
Pcr /
Pcr
0
sensitivity analysis P2 = P1
exact solution
σ10 = 100 MPa
Fig. 4.10. The linear approximation of the exact relationship of the relative torsional buckling load due to a constant change of the residual welding stresses along the column (load relationship P2 = P1)
Table 4.1
Comparison of constant R w for different self-equilibrated residual stress distribution when 1 2 210 MPaykfσ σ= = =
Residual stress distribution
alternative 1 (Fig. 3.3) alternative 2 (Fig. 3.4) alternative 3 (Fig. 3.7)
Rw [kNm2] –0.7 –0.875 –0.233
The above presented example of the sensitivity analysis of the column due to variation of the cross-sectional dimensions or residual stress variation makes it possible to draw the following conclusions: ⎯ In the example under consideration the influence line of the torsional buckling load
variation due to the unit variation of the flange width indicates that a increase of the flange width near the supports causes a decrease of the critical force. The most effective growth in the torsional buckling load is obtained by increasing the flange width in the middle of the column.
⎯ The influence line of the variation of the torsional buckling load due to the unit varia-tion of the flange thickness makes it possible to conclude that an additional growth of the flange thickness near the supports is responsible for the largest increase of the buc-kling load.
⎯ In the analysed example the initial stresses cause a decrease of the critical force. The influence of the variation of the torsional buckling load due to the welding stresses

4. Buckling of braced columns
56
depends on the sign of the stress constant Rw. In the design codes there should be no doubt about the sign of the constant.
⎯ The approximation of the exact relation between the buckling load and the design para-meter variation found using the sensitivity analysis is correct.
⎯ The sensitivity analysis may be helpful in predicting the structure response due to some manufacturing inaccuracy. It could be used to define the allowable manufacturing accu-racy and the preparation of the welding scheme. The design sensitivity method can be used to divide the construction into parts where the possible manufacturing accuracy may cause a large change in the structure response. It is possible to divide the structure into some zones of higher and lower manufacturing accuracy.
4.2. Sensitivity analysis of buckling loads of I-section columns with bracing elements
4.2.1. Column with discrete lateral braces
Let us consider, another example of a simply supported in both the horizontal and vertical plane I-section column with two lateral braces placed at positions x = 1.6 m and x = 3.6 m (Fig. 4.11). The column is prevented from twisting at the supports, while the warping of the cross-section is free. Three variants of braces stiffness are analysed (see also Iwicki 2010b). At first it is assumed that the stiffness of the lateral braces is kv = 100 kN/m, and then this stiffness is set to be 500 kN/m and 1000 kN/m. The magnitude of the assumed stiffness may be verified according to a design code formula. For example in the Polish design code PN-90/B-03200 the compressed element may be regarded as side supported when the support is able to carry a force equal to 1% of the normal force magnitude in a compressed part of the member, and when the lateral displacement is less than 1/200 of distance between braces.
Fig. 4.11. Axially compressed thin-walled I-section column with two lateral braces
For the analysed column the design normal force is about 700 kN. Assuming that the brace distance is l0 = 4.4 m the magnitude of the approximated stiffness of the lateral brace is:
0
0.01 7 kN318.18 kN/m
/ 200 0.022 mv
Nk
l= = = . (4.1)
The numerical calculations were carried out with the finite element code SEAN (2000). The column was divided into 20 elements. The influence lines of the flexural

4.2. Sensitivity analysis of buckling loads of I-section columns with bracing elements
57
critical load variation due to the location of a new unit stiffness brace are presented in Fig. 4.12. The influence lines are related to the critical load of the column, namely: Pcr0 = 642 kN, 1300 kN and 1594 kN, respectively for three analysed cases of the brace stiffness.
The linear approximation of the exact relation (found by means of a parametrical analysis) of the relative flexural buckling load due to a change of the lateral brace stiffness for the column with stiffeners kv = 100 kN/m and kv = 500 kN/m is calculated. The lines are related to the critical load for the column with brace stiffness kv0 = 100 kN/m (Fig. 4.13). The linear approximations are determined according to Eq. (3.43).
0 1 2 3 4 5 6 7 8
x [m]
0.0000
0.0005
0.0010
0.0015
0.0020
0.0025
0.0030
ΛP
cr k
v / P
cr [m
/kN
]
kv = 1000 kN/m
kv = 500 kN/m
kv = 100 kN/m
Fig. 4.12. The influence lines of the column flexural buckling load variation due to the location of the lateral restraint with unit stiffness for the column with two stiffeners at x = 1.6 m and x = 3.6 m
of stiffness kv = 100 kN/m, kv = 500 kN/m, kv = 1000 kN/m
0 1 2 3 4 5 6 7 8 9 10 11 12 13 14 15 16
kv / kv0 0.5
1.0
1.5
2.0
2.5
3.0
Pcr /
Pcr
0 kv = 500 kN/m
kv = 100 kN/m
exact results
kv0 = 100 kN/m
Fig. 4.13. The linear approximation of the exact relation of the relative flexural buckling load due to changes of the stiffness of lateral restraints at x = 1.6 m and x = 3.6 m for a column with stiffeners
kv = 100 kN/m, or kv = 500 kN/m
Next, the linear approximation of the relation of the relative critical load of the column due to a change of the brace location at initial position x = 1.6 m with stiffness kv = 100 kN/m is drawn (Fig. 4.14). The approximation is determined according to Eq. (3.44).

4. Buckling of braced columns
58
-0.15 -0.1 -0.05 0 0.05 0.1 0.15
δx01 / L 0.90
0.95
1.00
1.05
1.10
Pcr /
Pcr
0
linear approximation
exact results
Fig. 4.14. The linear approximation of the exact relation of the relative flexural buckling load of the column with two lateral restraints due to changes of the restraints location at x = 1.6 m
of stiffness kv = 100 kN/m
4.2.2. Column with warping stiffeners
The simply supported I-section column with two warping stiffeners placed in cross-sections at x = 1.6 m and x = 3.6 m is investigated (Fig. 4.15). It is assumed that the warp-ing stiffness of the stiffeners is
0k ′Θ = 100 kNm3. The stiffness range of the warping stiffener
for the assumed I-section given in Fig. 4.15 is determined by means of relations proposed by Gosowski (1992). Taking the above into account two variants of the column have been investigated: the column without warping stiffeners and the column with the stiffeners of stiffness
0k ′Θ = 100 kNm3. The torsional buckling load of the column with stiffeners is
0crP = 2868.5 kN. The critical load of torsional buckling is 2047.2 kN for the column with-
out stiffeners, and 2604.6 kN for the column with warping stiffeners of stiffness 50 kNm3. The influence lines of the variation of torsional buckling load due to the location of
a new stiffener with the unit warping stiffness are presented in Fig. 4.16. The lines are related to the critical buckling load of each of the analysed columns. These lines show that the points on the column where the warping stiffeners are most effective in increasing the buckling load are near the supports.
In the course of time, the linear approximation of the exact relation of the critical load due to the variation of the stiffeners stiffness is examined. The approximation is determined according to Eq. (3.43) for both the columns with no stiffeners and the one with two warp-ing stiffeners whose stiffness is k ′Θ = 100 kNm3 (Fig. 4.17). The approximation is related to
the critical load for the columns with two stiffeners of stiffness k ′Θ = 100 kNm3.
The critical load change resulting from the change of location of the stiffener at x = 1.6 m is investigated. A linear approximation of the relation between the relative buck-ling load and the stiffener’s position is found using Eq. (3.44). A comparison of the exact and the approximated results is shown in Fig. 4.18.

4.2. Sensitivity analysis of buckling loads of I-section columns with bracing elements
59
h h
b
warping brace (a) warping brace (b) warping brace (c)
b1t2
t1
b2
h
g
b dw
Warping brace (a): g = 3–10 mm, h = 190 mm, b = 100–200 mm, kΘ’ = 0.01–1.02 kNm3
Warping brace (b): d = 5–15 mm, w = 190 mm, h = 190 mm, b = 50–150 mm kΘ’ = 12–336 kNm3
h = 0.2 m
b = 0.2 m
t = 0.01 mg = 0.01 m
Warping brace (c): t1, t2 = 5–7.5 mm. h = 190 mm, b1 = 35–260 mm b2 = 80–190 mm, kΘ’ = 10–1248 kNm3
Fig. 4.15. Axially compressed thin-walled I-section column with two warping restraints
0.0 1.0 2.0 3.0 4.0 5.0 6.0 7.0 8.0
x [m]0.000
0.005
0.010
0.015
ΛP
cr k θ'
/ P
cr [
kN-1m
-3]
kθ' = 100 kNm3
kθ' = 50 kNm3
kθ' = 0 kNm3
Fig. 4.16. The influence lines of the column relative torsional buckling load variation due to the location of an additional restraint with unit warping stiffness for the column without
any restraints and with two restraints of stiffness kΘ' = 50 kNm3, and kΘ' = 100 kNm3 situated at x = 1.6 m and x = 3.6 m

4. Buckling of braced columns
60
0.0 0.5 1.0 1.5 2.0 2.5 3.0 3.5 4.0
kθ' / kθ0'
0.6
0.7
0.8
0.9
1.0
1.1
1.2
1.3
1.4
Pcr / P
cr0
kθ' = 100 kNm3
kθ' = 0 kNm3
exact results
kθ0' = 100 kNm3
Fig. 4.17. The linear approximation of the exact relation of the relative torsional critical load due to changes of the stiffness of warping restraints at x = 1.6 m and x = 3.6 m, for the column without
any restraints, and with restraints kΘ' = 100 kNm3
-0.12 -0.08 -0.04 0.00 0.04 0.08 0.12
δx01 / L
0.7
0.8
0.9
1.0
1.1
1.2
Pcr / P
cr0
linear approximation
exact results
Fig. 4.18. The linear approximation of the exact relation of the relative torsional critical load of the column with two restraints due to changes of location of the warping restraint kΘ' = 100 kNm3
at position x = 1.6 m
4.2.3. Column with torsional stiffeners
A simply supported I-section column with two torsional stiffeners positioned in the cross-sections at x = 1.6 m and x = 3.6 m is investigated (Fig. 4.19). It is assumed that the stiffnesses of the stiffeners are 0kΘ = 10 kNm/rad and 100 kNm/rad. The torsional buckling
load for the column without any stiffeners is 2047.5 kN and for the column with stiffeners of stiffness 10 kNm/rad, Pcr0 = 3207.5 kN and for stiffness 100 kNm, Pcr0 = 3717.3 kN.
Deformation of column is interrelated with deformation of the lateral braces, such as, purlins or wall rails resting on the column. On the assumption that the connectors between the lateral brace and the column are stiff enough and are able to carry arising forces, the rotation of the lateral brace is interrelated with torsion of the column. Thus the magnitude of stiffness of the torsional brace could be estimated as at least 2EJbr/Lbr for symmetrical deformation of one span lateral element or as 4EJbr /Lbr for restraining elements fixed at one end or in the case of a middle support, of two span lateral braces 6EJbr /Lbr

4.2. Sensitivity analysis of buckling loads of I-section columns with bracing elements
61
0 2 4 6 = , = , =br br br br
br br br
Mk k k
EJ EJ EJ
L L LΘ Θ Θ=Θ
. (4.2)
where (…),br denotes the brace characteristics. So the magnitude of the torsional brace stiffness is at least 2–32 kNm/deg (100–1800 kNm/rad) for a 3–6 m long lateral brace.
Fig. 4.19. Axially compressed thin-walled I-section column with two torsional restraints
The influence line of the variation of the torsional buckling load due to the location of an additional torsional stiffener of unit stiffness is shown in Fig. 4.20. All influence lines are related to the critical torsional load of each column. The lines show that in the middle of the unbraced part of the column, the torsional stiffeners are most effective in increasing the buckling load.
0.0 1.0 2.0 3.0 4.0 5.0 6.0 7.0 8.0
x [m]0.00
0.01
0.02
0.03
0.04
0.05
0.06
0.07
0.08
ΛP
cr k
θ / P
cr [r
ad /
kNm
]
kθ = 100 kNm/rad
kθ = 10 kNm/rad
kθ = 0 kNm/rad
Fig. 4.20. The influence lines of the column relative torsional buckling load variation due to the location of an additional torsional restraint with unit stiffness for the column without any restraints, and with two restraints of stiffness kΘ = 10 kNm/rad, or kΘ = 100 kNm/rad
Let us assume that the stiffness of torsional stiffeners increases. By means of the sensi-tivity analysis the linear approximation of the exact relation of the critical load due to some variations of the stiffeners stiffness is found (Eq. (3.43)). The approximation is determined for the column with the stiffeners of stiffness kΘ0 = 10 kNm/rad. The approximation is related to the critical load of torsional buckling of the column (Fig. 4.21).
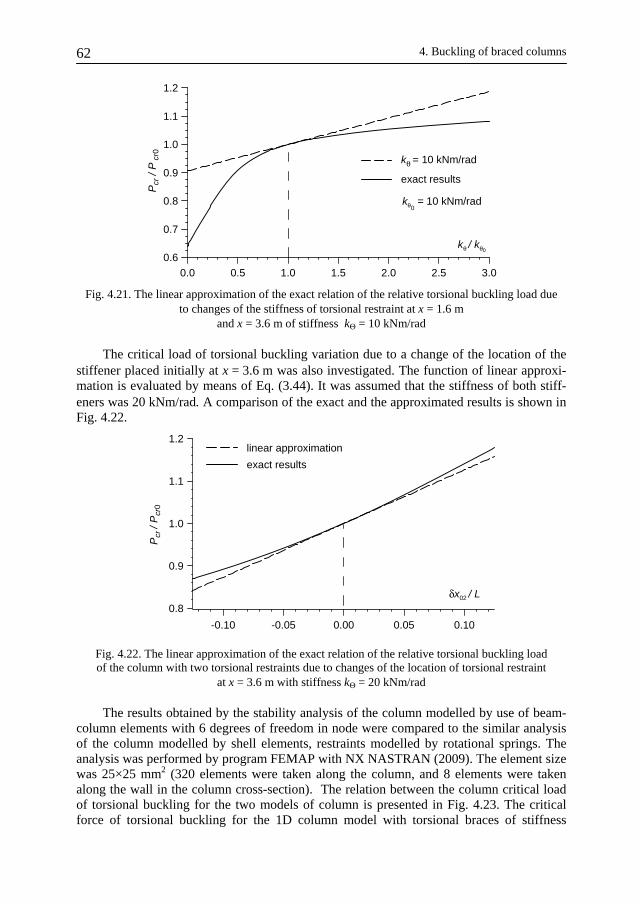
4. Buckling of braced columns
62
0.0 0.5 1.0 1.5 2.0 2.5 3.0
kθ / kθ0
0.6
0.7
0.8
0.9
1.0
1.1
1.2
Pcr
/ P c
r0kθ = 10 kNm/rad
exact results
kθ0 = 10 kNm/rad
Fig. 4.21. The linear approximation of the exact relation of the relative torsional buckling load due to changes of the stiffness of torsional restraint at x = 1.6 m
and x = 3.6 m of stiffness kΘ = 10 kNm/rad
The critical load of torsional buckling variation due to a change of the location of the stiffener placed initially at x = 3.6 m was also investigated. The function of linear approxi-mation is evaluated by means of Eq. (3.44). It was assumed that the stiffness of both stiff-eners was 20 kNm/rad. A comparison of the exact and the approximated results is shown in Fig. 4.22.
-0.10 -0.05 0.00 0.05 0.10
δx02 / L0.8
0.9
1.0
1.1
1.2
Pcr
/ P
cr0
linear approximation
exact results
Fig. 4.22. The linear approximation of the exact relation of the relative torsional buckling load of the column with two torsional restraints due to changes of the location of torsional restraint
at x = 3.6 m with stiffness kΘ = 20 kNm/rad
The results obtained by the stability analysis of the column modelled by use of beam-column elements with 6 degrees of freedom in node were compared to the similar analysis of the column modelled by shell elements, restraints modelled by rotational springs. The analysis was performed by program FEMAP with NX NASTRAN (2009). The element size was 25×25 mm2 (320 elements were taken along the column, and 8 elements were taken along the wall in the column cross-section). The relation between the column critical load of torsional buckling for the two models of column is presented in Fig. 4.23. The critical force of torsional buckling for the 1D column model with torsional braces of stiffness

4.2. Sensitivity analysis of buckling loads of I-section columns with bracing elements
63
kΘ0 = 10 kNm/rad is assumed to be a reference value. The critical loads for 3D model are up to 9% lower than in the case of the column modelled by means of beam elements. The difference is larger for braces of higher magnitude. The buckling mode for the 3D shell model with torsional braces of kΘ0= 10 kNm/rad is presented in Fig. 4.24.
0 1 2 3 4 5 6 7 8 9 10
kθ / kθ0
0.6
0.7
0.8
0.9
1.0
1.1
1.2
Pcr
/ P c
r0 1 D model
shell model
kθ0 = 10 kNm/rad
Fig. 4.23. The relative torsional buckling vs. torsional braces at x = 1.6 m and x = 3.6 m relative stiffness kΘ0 = 10 kNm/rad
Fig. 4.24. The buckling mode of column with torsional braces at x = 1.6 m and x = 3.6 m of stiffness kΘ = 10 kNm/rad

4. Buckling of braced columns
64
4.2.4. Column braced by corrugated plate
The examples in this chapter presented so far are rather theoretical. Therefore in the next example a column of an existing silo structure is analysed. The silo is one part of a battery of eight such structures that are connected at their tops (Fig. 4.25). During the recharge of some particulate material stored in the silo a failure of the silo shell wall stiff-ened by means of columns was noted. After unloading the displacement of the silo wall was still evident (Fig. 4.26). A detailed description of the silo damage is described by Wójcik et al. (2010b).
Fig. 4.25. A battery of silos
Fig. 4.26. The silo shell wall stiffened by columns after the silo failure

4.2. Sensitivity analysis of buckling loads of I-section columns with bracing elements
65
The main problem analysed in this section is devoted to the investigation of a method of strengthening the silo columns. The sensitivity analysis is applied to predict the location of additional column restraints (some circumferential horizontal rings along the silo pe-rimeter). The numerical calculations were carried out with the finite element code ROBOT STRUCTURAL ANALYSIS PROFESSIONAL (2010) and program MATLAB (2007). The column was divided into 24 elements. The silo structure is a cylindrical shell of a 20.11 m height and of 12.48 m diameter. The silo mantle in a vertical direction consists of 24 horizontally corrugated sheets 890×2940 mm2. The properties of the silo plate vary along its height. The silo plate is vertically stiffened by means of twenty-eight columns of open cross-sections. The column cross-section along its height is variable (see Table 4.2 and Fig. 4.27).
Table 4.2
Geometrical characteristics of the silo column and plate along the silo height
Section number from the silo top Column cross-section Plate thickness [mm]
1 C1.5 1,00 2 C1.5 0,75 3 C1.5 0,75 4 C2.0 0,75 5 C2.0 1,00 6 C2.0 1,00 7 C3.0 1,00 8 C3.0 1,25 9 C3.0 1,25
10 V4.0 1,25 11 V4.0 1,25 12 V4.0 1,50 13 V4.0 1,50 14 V4.0 1,50 15 V4.0 1,50 16 V5.0 1,50 17 V5.0 1,50 18 V5.0 1,75 19 V6.0 1,75 20 V6.0 1,75 21 V6.0 1,75 22 B7.0 1,75 23 B7.0 1,75 24 B7.0 1,75
The analysis is conducted according to code PN-EN 1993-4-1 (2007) where it is assumed that the horizontal load is transferred onto the silo walls causing tension. The vertical com-ponent of the particulate material generates pressure which is acting on the columns. The silo corrugated walls provide a continuous elastic support along the column length in hori-zontal direction (perpendicular to the silo wall). The stiffness of continuous foundation

4. Buckling of braced columns
66
according to code PN-EN 1993-4-1 (2007) is determined as a reaction of the corrugated plate caused by unit deflection of the column as presented in Fig. 4.28. Thus:
3
6 plv
s
EJk
d= , (4.3)
where ds is the distance between columns, and EJpl is the corrugated plate stiffness and kv denotes the stiffness of the column elastic foundation provided by the bending stiffness of sheets between vertical columns. The stiffness of the silo column foundation is presented in Table 4.3.
Fig. 4.27. Column cross-section profiles along wall height (dimensions in [mm])
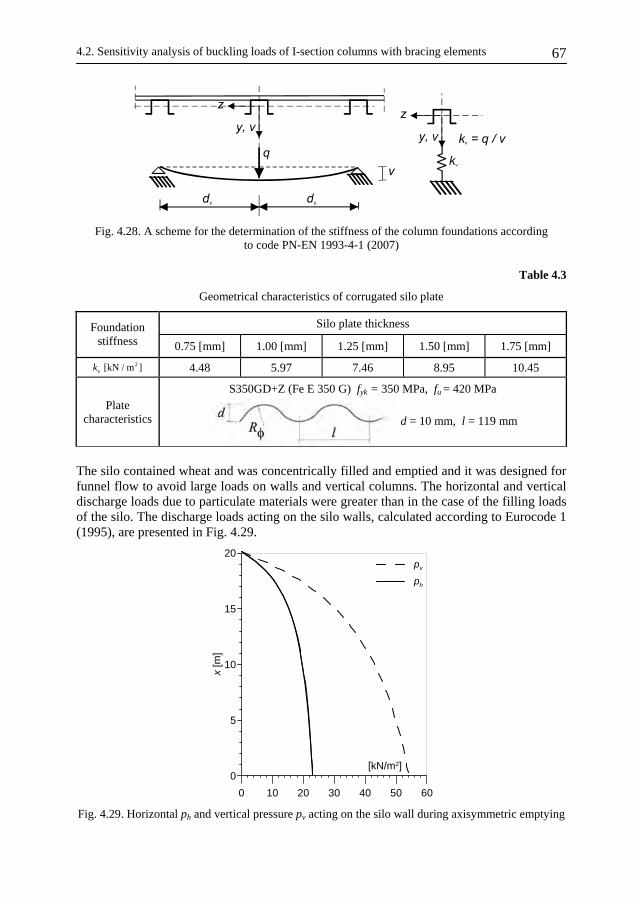
4.2. Sensitivity analysis of buckling loads of I-section columns with bracing elements
67
Fig. 4.28. A scheme for the determination of the stiffness of the column foundations according to code PN-EN 1993-4-1 (2007)
Table 4.3
Geometrical characteristics of corrugated silo plate
Silo plate thickness Foundation stiffness 0.75 [mm] 1.00 [mm] 1.25 [mm] 1.50 [mm] 1.75 [mm]
2[kN / m ]vk 4.48 5.97 7.46 8.95 10.45
Plate characteristics
S350GD+Z (Fe E 350 G) fyk = 350 MPa, fu = 420 MPa
d = 10 mm, l = 119 mm
The silo contained wheat and was concentrically filled and emptied and it was designed for funnel flow to avoid large loads on walls and vertical columns. The horizontal and vertical discharge loads due to particulate materials were greater than in the case of the filling loads of the silo. The discharge loads acting on the silo walls, calculated according to Eurocode 1 (1995), are presented in Fig. 4.29.
0 10 20 30 40 50 60
[kN/m2]0
5
10
15
20
x [m
]
pv
ph
Fig. 4.29. Horizontal ph and vertical pressure pv acting on the silo wall during axisymmetric emptying

4. Buckling of braced columns
68
During axisymmetric emptying, the standard maximum wall normal and shear stress were in the bin pw=23.0 kPa and ph=54.2 kPa, respectively. When considering possible non-symmetric emptying, they increased up to pw=32.7 kPa and ph=65.6 kPa (Wójcik et al. 2010b).
Accordind to code PN-EN 1993-4-1 (2007) the maximal normal force of the silo col-umn under axial compressive stresses is calculated by means of the following relation
( ), ,min ,Rd b Rd o RdN N N= , (4.4)
where Nb,Rd is the design buckling resistance of a compression member similar to the criti-cal force for the column resting on elastic foundation of stiffness kv (Eq. (2.23))
1
. 2M
vzRdb
kEJN
γ= , (4.5)
and No.Rd denotes the design local buckling resistance of the cross section
.1
eff yo Rd
M
A fN
γ= , (4.6)
EJz is the bending stiffness of the column, and Aeff is the effective cross-section area of the col-umn, yield strength fy = 350 MPa and coefficient γM1 = 1.10 (Table 2.2, PN-EN 1993-4-1 2007).
It is found that the load bearing capacity of the silo columns is exceeded between 101% and 248% depending on the column cross-section and even without any safety factor (see Table 4.4). Therefore the silo columns need strengthening. The restraint of the silo col-umn analysed in this section consists in applying additional circumferential horizontal rings that would provide a new horizontal support of the column. In order to find the best loca-tion of this restraint, the sensitivity analysis of the buckling load of the column is con-ducted. Two static models of the column are considered. In the first model it is assumed that the column is simply supported at both ends of the column (model A), and in the sec-ond model (B) the column is fixed at the bottom.
Table 4.4
Characteristics of the column cross-section (Wójcik et al. 2010b)
Cross-section profile C1.5 C2.0 C3.0 V4.0 V5.0 V6.0 B7.0
Aψ [m2] 3.72E-04 4.99E-04 7.58E-04 1.49E-03 1.88E-03 2.27E-03 2.99E-03
Jz / Jy [cm4] 21.6 47.4
29.4 64.3
46.2 99.9
225.8 668.8
288.6 851.9
354.1 1041.7
574.4 1555.0
EJ z [kNm2] 45.36 61.74 97.02 474,18 606.06 743.61 1206,24
25.91 30.23 43.76 108.15 133.94 160.25 204.10 Critical normal force according to Eqs (4.5–4.6) .b RdN .o RdN [kN] 118.36 158.77 241.18 474.09 598.18 722.27 951.36
Normal force in column Nw.max [kN]
(Nw.max/1.5)
39.7 (26.4)
112.4 (74.6)
202.8 (134.7)
412.4 (273.9)
525.9 (349.4)
643.2 (427.3)
763.5 (507.1)
Load bearing coefficient [%]
153 (101)
371 (246)
461 (307)
381 (253)
393 (261)
401 (267)
374 (248)

4.2. Sensitivity analysis of buckling loads of I-section columns with bracing elements
69
The underintegral sensitivity function of the silo column buckling load variation of the first model due to the location of a new unit stiffness support is presented in Fig. 4.31a. One can draw a conclusion that the most effective location of the new support is between 4 and 5 m from the bottom of the column. The first support is assumed to be located 5 m from the bottom of the column. In order to find the required stiffness of the new support a parametric analysis of the column with different stiffnesses of the new support is carried out (Fig. 4.30). The buckling load (the maximum wall vertical load in the bin) for the column with initial elastic foundation provided by the corrugated plate is assumed to be the reference value (pv cr0 = 12.49 kPa). The increase of the column buckling load due to the stiffness of additional support K is greater for lower support stiffness (K < 60 kN/m). Also an assump-tion is made that the new support stiffness is K = 200 kN/m. Such a support would be secured by an additional circumferential horizontal ring. The stiffness of the ring was calcu-lated according mechanism presented in Fig. 4.28, and in code PN-EN 1993-4-1. The ring stiffness is equal to EJ = 91.47 kNm2 (J = 44.62 cm4).
0 50 100 150 200
K [kN/m]1.0
1.1
1.2
1.3
1.4
1.5
1.6
p v c
r / p
v cr
0
pv cr0 = 12.49 kPa
Fig. 4.30. Relative column buckling load vs. stiffness of additional elastic support situated at coordinate x = 5.025 m from the bottom of the silo
Then the sensitivity analysis is applied to determine the most effective location for second additional support (Fig. 4.31b). One can conclude that the next ring should be located at x = 9.2 m from the bottom of the column. Similar investigations of the most ef-fective location of a third and fourth additional support to increase the column buckling load are presented in Fig. 4.31c, d, e. In all of the analysed cases the additional spring stiff-ness provided by the horizontal ring around the silo is 200 kN/m.
A comparison of the vertical component of a particulate material pressure correspond-ing to the buckling load multiplier pvcri for a different number of additional side support is presented in Table 4.5. For an initial condition, buckling occurs at 38% load acting on the silo wall. Additional supports result in a buckling load increase of about 216% but the load acting on the silo is still greater.

4. Buckling of braced columns
70
a)
0 2 4 6 8 10 12 14 16 18 20
x[m]
0
0.004
0.008
0.012
Λp v
cr,
k / pv
cr0
[m/k
N]
pv cr 0= 12.49 kPa
b)
0 2 4 6 8 10 12 14 16 18 20
x[m]
0
0.004
0.008
0.012
Λp v
cr,
k / p
v cr
1 [m
/kN
]
pv cr 1= 18.83 kPaadditional supportK = 200 kN/m
c)
0 2 4 6 8 10 12 14 16 18 20
x[m]
0
0.004
0.008
0.012
Λp v
cr,
k / pv
cr2
[m/k
N]
pv cr 2= 20.90 kPaadditional supports K = 200 kN/m
d)
0 2 4 6 8 10 12 14 16 18 20
x[m]
0
0.004
0.008
0.012
Λp v
cr,
k / p
v cr
3 [
m/k
N]
pv cr 3= 26.27 kPaadditional ringsK=200 kN/m
e)
0 2 4 6 8 10 12 14 16 18 20
x[m]
0
0.004
0.008
0.012
Λp v
cr,
k / p
v cr
4 [
m/k
N]
pv cr 4= 26.96 kPa
additional supports K=200 kN/m
Fig. 4.31. The influence lines of the column relative buckling load variation (model A) due to the location of a new unit stiffness support K for a column at each strengthening step

4.2. Sensitivity analysis of buckling loads of I-section columns with bracing elements
71
Table 4.5
Vertical component of a particulate material pressure
Additional support of K = 200 kN/m Buckling load pvcri [kPa] pvcri / pvcr0
0 12.49 1.00
1 18.83 1.51
2 20.90 1.67
3 26.27 2.10
4 26.96 2.16
load acting on the silo wall 32.50
It is therefore needed to strengthen the column of the silo with additional restraints. Therefore the second model (B) of the silo column with a fixed support at the bottom is analysed. The sensitivity analysis of the column buckling load due to the location of a new side support is conducted. In the first step of the column strengthening two additional sup-ports at x = 6.7 m and 13.4 m are introduced. Moreover, two additional supports at x = 10.5 m and 15.9 m are added. The influence lines of the column relative buckling load variation, due to the location of a new unit stiffness support for each step of column strengthening are presented in Fig. 4.32.
The vertical component of the particulate material pressure corresponding to the buck-ling load for different locations and stiffness of the additional side supports are given in Table 4.6. Four additional supports of 400 kN/m stiffness would result in an increase of the buckling resistance of the silo column being equal to the particulate material load acting on the silo wall.
Table 4.6
Vertical component of the particulate material pressure
Additional support Buckling load pvcri [kPa] pvcri / pvcr0
0 17.36 1.00
1 and 2 K = 200 kN/m 21.39 1.23
3 and 4 K = 200 kN/m 30.84 1.78
1, 2, 3, 4 K = 300 kN/m 31.86 1.84
1, 2, 3, 4 K = 400 kN/m 32.43 1.87
load acting on the silo wall 32.50 1.87
All of the above presented calculations are based on PN-EN 1993-4-1:2007 code as-sumption that the stiffness of horizontal supports of the silo column provided by the corru-gated plate or by the additional ring is calculated by using Eq. (4.3) according to the mecha-nism presented in Fig. 4.28.
In order to verify that assumption a 3D model of the silo is built. The silo wall is mod-elled by means of standard ROBOT STRUCTURAL ANALYSIS PROFESSIONAL (2010) orthotropic shell elements (Fig. 4.33). It is taken for granted that only the vertical load component acts on the silo wall.

4. Buckling of braced columns
72
0 2 4 6 8 10 12 14 16 18 20
x[m]
0
0.002
0.004
0.006
0.008
0.01
Λp v
cr,
k / p
v cr
0 [m
/kN
]
pv cr 0= 17.36 kPa
0 2 4 6 8 10 12 14 16 18 20
x[m]0
0.002
0.004
0.006
0.008
0.01
Λp v
cr,
k / p
v cr
1 [m
/kN
]
pv cr 1= 21.39 kPa
additional supports K = 200 kN/m
0 2 4 6 8 10 12 14 16 18 20
x[m]0
0.002
0.004
0.006
0.008
0.01
Λp v
cr,
k / p
v cr
2 [m
/kN
]
pv cr 2= 30.84 kPa
additional supports K = 200 kN/m
Fig. 4.32. The influence lines of the column relative buckling load variation (model B), due to the location of a new unit stiffness support K for a column at each strengthening step
The buckling load and the buckling mode are determined (Fig. 4.34). The first buckling load of the 3D silo model corresponds to the vertical load of the silo wall of about 84 kN/m2 (about 258% of the load acting on the wall). The difference between the buckling load of the 3D silo model and the silo column resting on elastic foundation adopted accord-ing to code PN-EN 1993-4-1 (2007) may be explained as a different number of half-waves of the buckling modes of the models. According to the code the number of half-waves in the horizontal projection of the buckling modes would be 14 (half of the column number) and in the 3D analysis it is 20 half-waves, so the stiffness of the elastic foundation would be greater. It is likely that the code approach makes it possible to obtain a safe result, but it should also be added that in the above presented analysis the eccentric discharge of bulk solids from the silos was not taken into account. This eccentric discharge can lead to local pressure variations that in codes is referred to as patch loads. The load may affect the buck-ling strengths of the silos (see, for example Song and Teng 2003). Various imperfections may also significantly lower the silo strength (see Wójcik et al. 2010a).

4.2. Sensitivity analysis of buckling loads of I-section columns with bracing elements
73
Fig. 4.33. The FEM model of a silo

4. Buckling of braced columns
74
Fig. 4.34. The first buckling mode of the silo structure loaded by the vertical component of the particulate material pressure
From the example of the sensitivity analysis of columns with different stiffeners the following conclusions can be drawn: ⎯ In the presented examples, the influence line of the torsional buckling load due to the
location of the unit warping stiffeners enables us to conclude that the location of the stiffeners close to the supports is of primary significance in increasing the torsional critical load.
⎯ For a column with torsional stiffeners, the influence line of the torsional buckling load makes it possible to note that the location of the stiffeners near the middle of the unre-strained part of the column causes the most effective increase of the critical load.
⎯ In the case of a column with lateral bracing, one can state that the location of braces near the middle of the unrestrained part of the column causes the most effective increase of the flexural critical load.
⎯ A comparison of the relative influence lines of the buckling load with respect to the warping stiffeners allows us to conclude that the lines are of equal significance for col-umns with or without stiffeners.
⎯ In the case of a column with torsional and lateral bracing, the magnitude of the relative influence lines decreases with an increase of the bracing elements stiffness.
⎯ The sensitivity analysis makes it possible to find the approximation of the exact relation between the buckling load and the stiffness and location of the brace elements.
⎯ The sensitivity analysis may be helpful in the column design to place the stiffeners most effectively as it is illustrated in the analysis of the silo column buckling load.
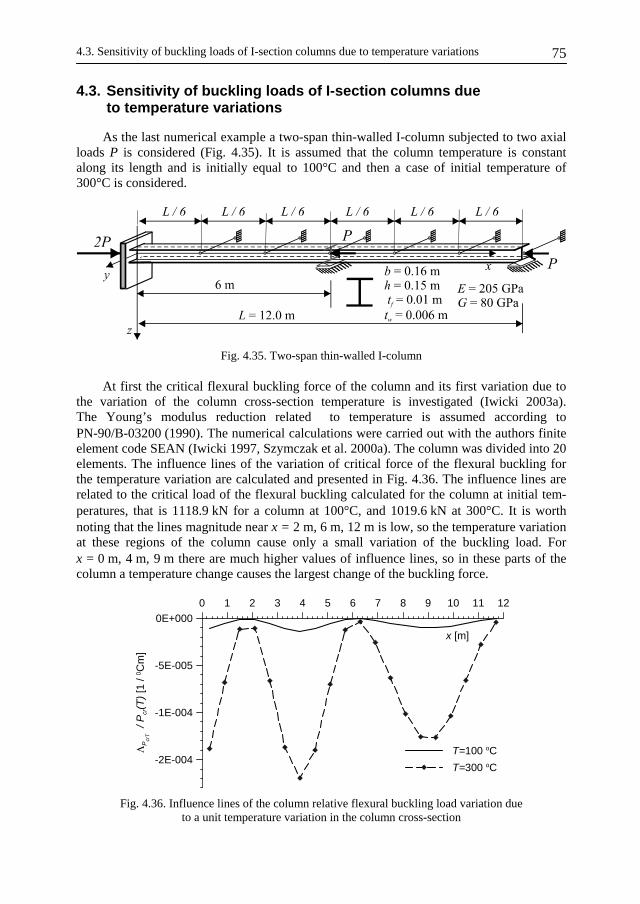
4.3. Sensitivity of buckling loads of I-section columns due to temperature variations
75
4.3. Sensitivity of buckling loads of I-section columns due to temperature variations
As the last numerical example a two-span thin-walled I-column subjected to two axial loads P is considered (Fig. 4.35). It is assumed that the column temperature is constant along its length and is initially equal to 100°C and then a case of initial temperature of 300°C is considered.
Fig. 4.35. Two-span thin-walled I-column
At first the critical flexural buckling force of the column and its first variation due to the variation of the column cross-section temperature is investigated (Iwicki 2003a). The Young’s modulus reduction related to temperature is assumed according to PN-90/B-03200 (1990). The numerical calculations were carried out with the authors finite element code SEAN (Iwicki 1997, Szymczak et al. 2000a). The column was divided into 20 elements. The influence lines of the variation of critical force of the flexural buckling for the temperature variation are calculated and presented in Fig. 4.36. The influence lines are related to the critical load of the flexural buckling calculated for the column at initial tem-peratures, that is 1118.9 kN for a column at 100°C, and 1019.6 kN at 300°C. It is worth noting that the lines magnitude near x = 2 m, 6 m, 12 m is low, so the temperature variation at these regions of the column cause only a small variation of the buckling load. For x = 0 m, 4 m, 9 m there are much higher values of influence lines, so in these parts of the column a temperature change causes the largest change of the buckling force.
0 1 2 3 4 5 6 7 8 9 10 11 12
x [m]
-2E-004
-1E-004
-5E-005
0E+000
ΛP
crT /
Pcr(T
) [1
/ 0 C
m]
T=100 oC
T=300 oC
Fig. 4.36. Influence lines of the column relative flexural buckling load variation due to a unit temperature variation in the column cross-section

4. Buckling of braced columns
76
The approximation of the exact relation (found by means of a parametrical analysis) between the critical load of the flexural buckling and the column temperature is found (Fig. 4.37). The approximation error is less than 20% when the initial column temperature is 100°C for temperatures up to 400°C. In the case of approximations of the exact relation be-tween the critical load of the flexural buckling and the column initial temperature of 300°C the approximation error is less than 2%, for temperatures variations 100°C (Fig. 4.38).
100 200 300 400
temperature [oC]
0.8
0.9
1.0
Pcr /
Pcr(T
= 1
00 o C
)
approximation T = 100 oC
approximation T = 300 oC
exact
Fig. 4.37. Comparison of exact relative critical load of flexural buckling vs. temperature of column cross-section with its approximations obtained by means of sensitivity analysis
100 200 300 400
temperature [oC]
0
5
10
15
20
erro
r of
app
roxi
mat
ion
[%]
T = 100 oC
T = 300 oC
Fig. 4.38. Error of approximations of exact relative critical load of flexural buckling vs. temperature of column cross-section
The variation of the torsional buckling load due to the variation of column cross-section temperature was also under investigation. By means of the sensitivity analysis the influence lines of the variation of the critical load of torsional buckling caused by tempera-ture variation were established (Fig. 4.39). The influence lines are presented with reference to the critical loads of the torsional buckling calculated for columns at initial temperatures: 1209.3 kN for a column at 100°C, 1178.1 kN for a column at 200°C, 1102 kN for a column at 300 °C temperature. An increase in values of the influence lines with the rise of the col-umn initial temperature can be observed. For example, values of the influence line for the initial temperature of 300°C are 12.5 times higher than for the temperature of 100°C. It should be noticed that the shape of the influence line for different temperatures is similar, so the conclusion drawn from the sensitivity analysis of the buckling loads of a column for one initial temperature should be valid for different temperatures as well. The values of the influence lines are higher in the column first span (0< x <6 m) than in the second span and for x between 4.5 m and 6 m there are the highest values of the influence lines. Thus in

4.3. Sensitivity of buckling loads of I-section columns due to temperature variations
77
these parts of the column an increase of temperature causes the largest decrease of the torsional buckling force.
Assume now a constant variation of the cross-section temperature along the column. After integration of the influence lines the first variation of the critical load of the torsional buckling is obtained and the approximation of the relative torsional buckling load due to the column temperature can be found (Fig. 4.40). Such an approximation was calculated for a column at initial temperature equal to 100°C and 200°C. A relative error of approxima-tion obtained by the sensitivity analysis is presented in Fig. 4.41. The approximation error at initial temperature reaching 100°C is less than 8% for temperatures up to 300°C, and for an approximation at an initial temperature of 200°C the error is less than 3% for tempera-tures up to 300°C.
0 1 2 3 4 5 6 7 8 9 10 11 12
x [m]
-2E-004
-1E-004
-5E-005
0E+000
ΛP
crT /
Pcr(T
) [1
/ 0 C
m]
T = 100 oC
T = 200 oC
T = 300 oC
Fig. 4.39. Influence lines of the column relative torsional buckling load variation due to unit temperature variation of the column cross-section for three initial temperatures
100 200 300
temperature [oC]0.9
1.0
Pcr /
Pcr
(T =
100
0 C)
approximation T = 100 0C
approximation T = 200 0C
exact
Fig. 4.40. Comparison of exact relative critical load of torsional buckling vs. temperature of column cross-section with its approximations obtained by sensitivity analysis
By the use of the example of the sensitivity analysis of critical forces of column due to variations of cross-section temperature one can draw the following conclusions: ⎯ The sensitivity analysis may be used to predict the variation of the critical buckling load
of the steel column undergoing non-uniform heating along its length. ⎯ By the sensitivity analysis it is possible to find the function describing the influence of
the temperature variation in the cross-section on the critical load of the column. The

4. Buckling of braced columns
78
influence line calculated by means of the sensitivity analysis makes it possible to find some regions of the column where the temperature variation causes the largest varia-tions of the critical load. Parts of the column where the temperature variation causes the largest decrease in the critical forces may by protected by thicker thermal insulation. Consequently the sensitivity influence lines may be used by designers to divide the column into zones with different fire protection thicknesses.
⎯ The sensitivity analysis gives an opportunity to predict the column critical force at ele-vated temperatures on the basis of the results of stability analysis of column performed at ambient temperature, and the steel model that describes the material behaviour in function of temperature. Such a model is described in the design codes.
⎯ In the numerical examples the first variation of buckling loads of thin-walled column due to the temperature variation was investigated. Owing to the accuracy of the approximation of the relation between the buckling forces and the column temperature it is possible to conclude that the results obtained by means of the sensitivity method in the examined cases gave sufficiently good results.
⎯ Similar sensitivity analysis may be conducted for load bearing capacity coefficient of an axially compressed column due to temperature variation. In the analysis of the load bearing capacity of column it is necessary to take into account not only the loss of mate-rial strength but also the stiffness and the normal force redistribution due to thermal expansion. Thus the presented example shows a possible application of the sensitivity analysis to the structure performance at elevated temperature.
⎯ Before the proposed method could be used in practical applications a further research especially by means of a 3D shell elements model of the column is planned. This verifi-cation would determine a range of temperatures where the structure performance obtained for the ambient temperature may approximate its performance for elevated temperatures.
100 200 300temperature [oC]
0
5
10
erro
r of
app
roxi
mat
ion
[%]
T = 100 0C
T = 200 0C
Fig. 4.41. Error of approximations of exact relative critical load of torsional buckling vs. temperature of column cross-section

Chapter 5
BUCKLING OF BRACED FRAMES
Determination of the buckling load and then the effective lengths of frame columns is one of the most important phases of frame design. The effective length of frame columns has a great influence on the design of cross-section profiles. Even small changes in effec-tive length may cause significant changes in the bearing coefficient of structural elements. Various braces may reduce the frame columns effective length. In many practical design problems the buckling length is not calculated but it is assumed by the designer.
The buckling length of an individual column that is part of the frame structure should be determined by calculating the buckling load of the whole frame. It can be evaluated us-ing some engineering software based on linear or non-linear procedures, in terms of large displacements and material yielding, or with analytical methods. The present computer programs usually provide a tool for stability calculation. Both critical loading and effective buckling lengths of frame columns may be numerically found for each frame. This analysis is usually computed with the application of geometrical matrix. Thus the result depends on the adopted model for a discrete structural system and sometimes it is not exact.
In many practical applications, some simplified formulae and diagrams are needed and therefore such tools for determining the effective buckling lengths of frame columns are present in most design codes and specifications. Buckling lengths of columns may therefore be calculated by means of a simple formula, as found, for example, in Polish design code (1990) or Eurocode 3 (1992). The code simplified formulas for effective buckling lengths were investigated by Giżejowski and Żółtowski (1986), Girgin et al. (2006) or Mageirow and Gantes (2006). According to the design codes the effective lengths of frame columns depend on the sway classification. Frames are divided into two groups, sway and non-sway structures. In many braced frame structures where the lateral stiffness of bracing system is less than the required value for a non-sway frame, the effect of the bracing stiffness on the lateral stability of the frame is entirely neglected and effective lengths of frame columns are calculated as for sway-frames. This approach is not economical but provides a safe design.
Only very limited researches on the buckling of braced multistorey frames are available in the literature. In the research conducted by Özmen and Girgin (2005) and Girgin et al. (2006) it is shown that simplified formulas used for determining the buckling length of frame columns may yield erroneous results, especially for irregular frames. The application of code formulas has proven on several numerical examples that the erroneous results may appear both in sway and non-sway modes. This problem occurs mainly because, only local stiffness distributions are considered in these formulae, while the general behaviour of the frame is not taken into account. The above mentioned investigations carried out on a number of numerical examples have indicated that buckling length multipliers are dependent on: ⎯ axial force distribution, ⎯ number of storeys, ⎯ position of an individual element.
It can be concluded that the buckling length multipliers should be determined by taking into account all these factors, i.e., by considering not only the local stiffness distribu-
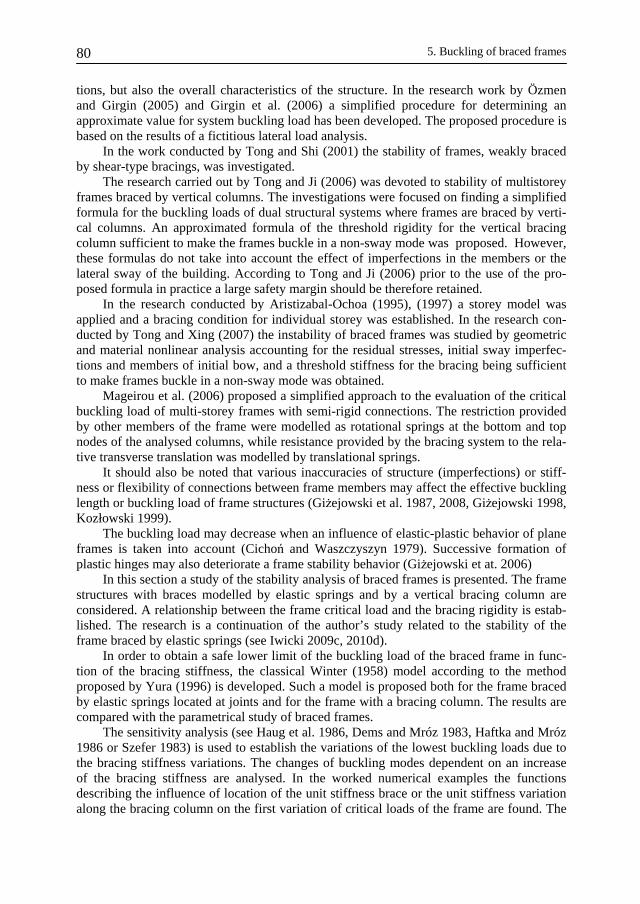
5. Buckling of braced frames 80
tions, but also the overall characteristics of the structure. In the research work by Özmen and Girgin (2005) and Girgin et al. (2006) a simplified procedure for determining an approximate value for system buckling load has been developed. The proposed procedure is based on the results of a fictitious lateral load analysis.
In the work conducted by Tong and Shi (2001) the stability of frames, weakly braced by shear-type bracings, was investigated.
The research carried out by Tong and Ji (2006) was devoted to stability of multistorey frames braced by vertical columns. The investigations were focused on finding a simplified formula for the buckling loads of dual structural systems where frames are braced by verti-cal columns. An approximated formula of the threshold rigidity for the vertical bracing column sufficient to make the frames buckle in a non-sway mode was proposed. However, these formulas do not take into account the effect of imperfections in the members or the lateral sway of the building. According to Tong and Ji (2006) prior to the use of the pro-posed formula in practice a large safety margin should be therefore retained.
In the research conducted by Aristizabal-Ochoa (1995), (1997) a storey model was applied and a bracing condition for individual storey was established. In the research con-ducted by Tong and Xing (2007) the instability of braced frames was studied by geometric and material nonlinear analysis accounting for the residual stresses, initial sway imperfec-tions and members of initial bow, and a threshold stiffness for the bracing being sufficient to make frames buckle in a non-sway mode was obtained.
Mageirou et al. (2006) proposed a simplified approach to the evaluation of the critical buckling load of multi-storey frames with semi-rigid connections. The restriction provided by other members of the frame were modelled as rotational springs at the bottom and top nodes of the analysed columns, while resistance provided by the bracing system to the rela-tive transverse translation was modelled by translational springs.
It should also be noted that various inaccuracies of structure (imperfections) or stiff-ness or flexibility of connections between frame members may affect the effective buckling length or buckling load of frame structures (Giżejowski et al. 1987, 2008, Giżejowski 1998, Kozłowski 1999).
The buckling load may decrease when an influence of elastic-plastic behavior of plane frames is taken into account (Cichoń and Waszczyszyn 1979). Successive formation of plastic hinges may also deteriorate a frame stability behavior (Giżejowski et at. 2006)
In this section a study of the stability analysis of braced frames is presented. The frame structures with braces modelled by elastic springs and by a vertical bracing column are considered. A relationship between the frame critical load and the bracing rigidity is estab-lished. The research is a continuation of the author’s study related to the stability of the frame braced by elastic springs (see Iwicki 2009c, 2010d).
In order to obtain a safe lower limit of the buckling load of the braced frame in func-tion of the bracing stiffness, the classical Winter (1958) model according to the method proposed by Yura (1996) is developed. Such a model is proposed both for the frame braced by elastic springs located at joints and for the frame with a bracing column. The results are compared with the parametrical study of braced frames.
The sensitivity analysis (see Haug et al. 1986, Dems and Mróz 1983, Haftka and Mróz 1986 or Szefer 1983) is used to establish the variations of the lowest buckling loads due to the bracing stiffness variations. The changes of buckling modes dependent on an increase of the bracing stiffness are analysed. In the worked numerical examples the functions describing the influence of location of the unit stiffness brace or the unit stiffness variation along the bracing column on the first variation of critical loads of the frame are found. The

5.1. Frame with bracing modelled as elastic springs 81
linear approximations of the exact relation of the buckling loads due to the variations of the bracing stiffness are determined.
The threshold rigidity of bracing is also under consideration. The threshold rigidity de-fined as bracing stiffness sufficient to make the frames buckle in a non-sway mode is found. A method, based on the sensitivity analysis, for the estimation of the threshold brac-ing stiffness for full bracing of the frames is proposed. The threshold bracing stiffness de-termined by the proposed method is compared with the stiffness found by means of para-metrical study of the frames. An advantage of the proposed method is that the maximal magnitude of the frame first buckling load in function of the bracing stiffness may be de-termined for the unbraced frame. Another advantage of the proposed method is that the threshold bracing condition can be found in a few approximation steps, and a labour-consuming parametrical stability analysis for the frame with various bracing stiffnesses is not necessary. It is worth noting that the application of a sensitivity analysis appears in many publications (see, for example Szymczak 2003), but its use in the analysis of the threshold condition of full bracing of frames cannot be found in literature.
In the present section the stiffness of bracing required for the frame stability is under consideration, but other effects, such as horizontal loading, nonlinearity, or initial sway are not taken into account. The above mentioned effect should be used for practical applica-tions to increase the threshold bracing condition.
5.1. Frame with bracing modelled as elastic springs
5.1.1. Description of the model
As the first parametric study consider a two-storey frame presented in Fig. 5.1 (see also Iwicki 2009a, 2010d). All beams and columns have constant cross-sections. The frame columns are loaded on their tops by forces P. The storey height is h, and the beam span is l. The frame is supported by horizontal linear springs on each floor level. It is assumed that the stiffness of bracing on each floor is constant and that the bracing characteristics are linear.
Fig. 5.1. Frame with horizontal bracing
Next the frame is modified to obtain a Winter – type model (Fig. 5.2). At first some fictitious hinges at column and beam joints are used. The purpose of the development of the Winter-type frame model is to calculate a safe lower limit of braces stiffness necessary to

5. Buckling of braced frames 82
obtain a maximal possible critical load of the frame. In the present analysis the classical Winter’s approach (see section 2) is extended to cases where less than a full bracing is ap-plied. In Yura’s (1996) research a similar model of columns provided a safe lower bound of the relation between the buckling load and the required bracing stiffness. The critical forces calculated for the Winter-type model of column were lower than for a similar column without hinges for the same bracing stiffness. The purpose of development of the Winter-type model for the frame was aimed to calculate similar relationships between the critical forces and the necessary bracing stiffness.
Fig. 5.2. The Winter-type model of braced frame, and laterally distributed position of the frame
5.1.2. Results of numerical simulation
In the application of the Winter model proposed by Yura (1996) a set of equilibrium equations at brace joints was introduced. This operation was followed by solving these equations to provide modes of buckling for the Winter model and the Winter poly-line that describes the relation between the buckling load and the brace stiffness. Below a similar so-lution for frame is proposed using the energy method.
The fictitious hinges at the column and the beam joints introduced in the Winter model of the frame allow us to consider the frame beams and columns to be rigid. With this in view the total potential energy for the Winter-type model of the frame consists of an increase in the strain energy stored in the elastic springs and a decrease in the potential energy of external forces P:
( )2 21 2 1 2
1 12 2 cos cos
2 2V k k P h h hδ δ θ θ= + − − × − . (5.1)
When the variation of total potential energy vanishes at the equilibrium position the follow-ing condition can be written:
1 1
2
2
4 20
2 2 0
V P Pk
h hV P P
kh h
δ δδ
δ
∂⎡ ⎤ ⎡ ⎤−⎢ ⎥ ⎢ ⎥∂ ⎡ ⎤ ⎡ ⎤⎢ ⎥ = =⎢ ⎥ ⎢ ⎥ ⎢ ⎥⎢ ⎥∂ ⎢ ⎥ ⎣ ⎦⎣ ⎦−⎢ ⎥ ⎢ ⎥∂ ⎣ ⎦⎣ ⎦
. (5.2)
The determinant of the above matrix is equal to zero:

5.1. Frame with bracing modelled as elastic springs 83
4 2
det 02 2
P Pk
h hP P
kh h
⎡ ⎤−⎢ ⎥=⎢ ⎥
⎢ ⎥−⎢ ⎥⎣ ⎦
. (5.3)
This gives two critical loads that correspond to the buckling modes of the Winter-type frame shown in Fig. 5.3.
2
1 2 1 0 2 0 20.19098 , 1.30902 , , .cr cr cr cr cr cr
EJP hk P hk P P P P
h
π= = ≤ ≤ = (5.4)
Fig. 5.3. Buckling modes corresponding to the calculated buckling loads and to the maximal buckling load for the Winter-type model of frame
The Winter poly-line that describes the relation between the buckling load and the bracing stiffness is constructed by means of construction lines. Assuming that the brace stiffness in-creases, an increment of the critical force given by Eq. (5.4) is obtained. When that force is equal to the buckling force for the simply supported column of length h, then the buckling mode changes to a mode shown in Fig. 5.3c. and the critical load is constant with a further increase of the bracing stiffness. This idea provides a basis for finding the end points of the construction lines of the Winter poly-line. The coordinates of the end points of the lines are (5.236,1) and (0.764,1) (see Fig. 5.4). The starting points of the construction lines appear as the first two critical loads of the analysed frame without bracings and without hinges: (0.1845,0) (0.6111,0). The poly-line calculated for the Winter-type model of frame is com-pared with the exact relation between the critical force and the coefficient of bracing (Fig. 5.4). Buckling loads are related to critical forces of a simply supported column of length h (Pcr0). The above presented analysis gives a reason for a conclusion that for bracing stiff-ness parameter α between 0.4–1.2, the buckling load predicted by means of the Winter method is greater than the calculated one for frame model without fictitious hinges. Hence, for this stiffness of bracing, the Winter method does not provide a safe lower limit of criti-cal load of frame. The same example was previously analysed by Iwicki (2009c), where the Winter-type model was analysed using the parametrical study.
The sensitivity analysis of the buckling load due to the bracing stiffness variation is also carried out. According to the sensitivity analysis the first variation of the critical load of flexural buckling is found in the form of Eq. (3.9) for the system with continuously dis-tributed design parameters, or in the form of Eq. (3.42) for a discrete system. The analysis may be performed by means of any commercial structure analysis program aimed at finding the buckling mode normalized by the condition of Eq. (3.39) and the spreadsheet program,
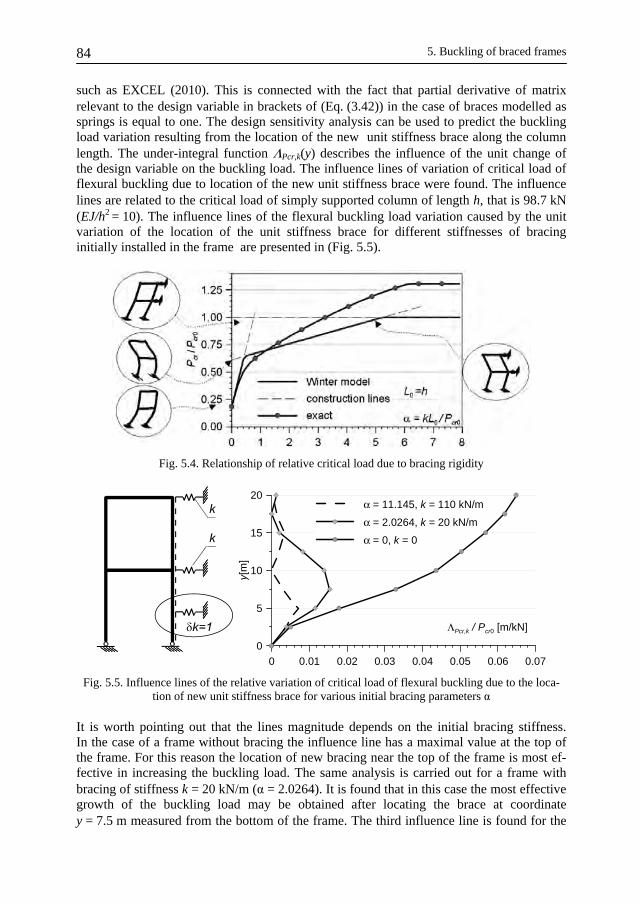
5. Buckling of braced frames 84
such as EXCEL (2010). This is connected with the fact that partial derivative of matrix relevant to the design variable in brackets of (Eq. (3.42)) in the case of braces modelled as springs is equal to one. The design sensitivity analysis can be used to predict the buckling load variation resulting from the location of the new unit stiffness brace along the column length. The under-integral function ΛPcr,k(y) describes the influence of the unit change of the design variable on the buckling load. The influence lines of variation of critical load of flexural buckling due to location of the new unit stiffness brace were found. The influence lines are related to the critical load of simply supported column of length h, that is 98.7 kN (EJ/h2 = 10). The influence lines of the flexural buckling load variation caused by the unit variation of the location of the unit stiffness brace for different stiffnesses of bracing initially installed in the frame are presented in (Fig. 5.5).
Fig. 5.4. Relationship of relative critical load due to bracing rigidity
0 0.01 0.02 0.03 0.04 0.05 0.06 0.07
ΛPcr,k / Pcr0 [m/kN]
0
5
10
15
20
y[m
]
α = 11.145, k = 110 kN/m
α = 2.0264, k = 20 kN/m
α = 0, k = 0
Fig. 5.5. Influence lines of the relative variation of critical load of flexural buckling due to the loca-tion of new unit stiffness brace for various initial bracing parameters α
It is worth pointing out that the lines magnitude depends on the initial bracing stiffness. In the case of a frame without bracing the influence line has a maximal value at the top of the frame. For this reason the location of new bracing near the top of the frame is most ef-fective in increasing the buckling load. The same analysis is carried out for a frame with bracing of stiffness k = 20 kN/m (α = 2.0264). It is found that in this case the most effective growth of the buckling load may be obtained after locating the brace at coordinate y = 7.5 m measured from the bottom of the frame. The third influence line is found for the

5.1. Frame with bracing modelled as elastic springs 85
frame with bracing of stiffness k = 110 kN/m (α = 11.145). One can conclude that increas-ing the stiffness of bracing at the joints between beams and columns does not cause a rise of the buckling load. The lines show that a further increase of the buckling load would be attained if additional bracing was located in the middle of the unbraced part of the columns. The parametrical analysis of the relation between the first three critical buckling loads and the coefficient of bracing stiffness are presented in Fig. 5.6.
0 1 2 3 4 5 6 7 8 9 10 11 12
α = kL0/Pcr0
0.0
0.5
1.0
1.5
2.0
2.5
Pcr
/ P
cr0
Pcr1 / Pcr0
Pcr2 / Pcr0
Pcr3 / Pcr0
L0 = h
Fig. 5.6. Relation of relative critical loads (1–3) to bracing rigidity coefficient α
The first variation of the second and third buckling load due to the stiffness variation of the brace located in the frame joints is also carried out. The relation between the first variation of the buckling loads and the bracing stiffness are presented in Fig. 5.7–5.9 for the first, the second and the third buckling load respectively. It is interesting to note that when the rigidity of the bracing is low (α < 0.82), the third buckling load is not sensitive to an in-crease of the bracing stiffness, and the second buckling load becomes insensitive to a rise of the bracing stiffness if the coefficient of bracing is between 0.82 < α < 6.2. And finally when the initial stiffness of bracing is greater than k > 62 (α > 6.28), the first buckling load becomes insensitive to changes of the bracing stiffness. This stiffness is a threshold value of stiffness required for non-sway buckling mode of the frame.
An interesting observation is, that increasing the bracing stiffness causes an increase in the first buckling load, but the maximal critical force that may be reached is equal to the value of critical buckling load of higher order of initially unbraced frame that is not sensi-tive to changes in the bracing stiffness. Consequently, when a maximum of the first buck-ling load is to be determined it is only necessary to carry out a sensitivity analysis of the buckling load for an unbraced frame and to find the buckling load that is insensitive to the location of the new unit stiffness brace. The level of the critical buckling load, that is not sensitive to the bracing stiffness variations is constant. It is also necessary to explain the insensitivity of the buckling load due to the initial stiffness of the frame bracing. The rela-tion between the buckling loads and the bracing stiffness may be explained as changes of the overall mode of the frame buckling. At a low bracing stiffness the first mode of the frame buckling is a sway mode. The third mode of buckling is a non-sway buckling mode. Then with an increase of the bracing stiffness the non-sway buckling mode corresponds to the second buckling load and finally to the first buckling load when the buckling load for sway buckling is greater than that for the non-sway buckling mode (Fig. 5.10).

5. Buckling of braced frames 86
0 1 2 3 4 5 6 7 8 9 10 11 12
α = kL0 /Pcr0
0.00
0.02
0.04
0.06
0.08
0.10
δPcr
1/ P
cr0
δPcr1 / Pcr0
L0 = h
Fig. 5.7. Relative variation of the first buckling load vs. bracing stiffness parameter α
0 1 2 3 4 5 6 7 8 9 10 11 12
α = kL0/Pcr0
0.00
0.02
0.04
0.06
0.08
0.10
δPcr
2 / P
cr0
δPcr2 / Pcr0
L0 = h
Fig. 5.8. Relative variation of the second buckling load vs. bracing stiffness parameter α
0 1 2 3 4 5 6 7 8 9 10 11 12
α = kL0/Pcr0
0.00
0.02
0.04
0.06
0.08
0.10
δPcr
3 / P
cr0
δPcr3 / Pcr0
L0 = h
Fig. 5.9. Relative variation of the third buckling load vs. bracing stiffness parameter α

5.1. Frame with bracing modelled as elastic springs 87
a)
b)
c)
d)
Fig. 5.10. The first three buckling modes for a) k = 0, α = 0, b) α = 1.1, k = 11 kN/m, c) α = 6.59, k = 65 kN/m d) α = 110, k = 11.15 kN/m

5. Buckling of braced frames 88
The sensitivity analysis may be helpful in calculating the full bracing condition that is defined as a threshold bracing stiffness needed to obtain the maximal critical load of the frame. The condition may also be interpreted as a non-sway condition of the frame. In order to calculate the threshold bracing stiffness, the following method is recommended. At the beginning of the analysis, the frame without bracing is studied. The first variation of the first few critical buckling loads should be calculated. Two important results should be dis-tinguished from the sensitivity analysis. The first information concerns a specific buckling load that is insensitive to the changes of bracing stiffness. The load value is the maximal magnitude of the first critical buckling load that may be reached due to an increase in the bracing stiffness. The second result is the first variation of the first critical buckling load due to a variation of the bracing stiffness. Then, a linear approximation of the exact relation between the critical load and bracing stiffness k can be found using the following relation:
11 1,0 .cr
cr cr
PP P k
kδ∂
= +∂
(5.5)
The first increment of the bracing stiffness can be obtained after assuming that the approximation of the first buckling load is equal to the maximal value of the buckling load (the buckling load of a higher buckling load for an unbraced frame that is not sensitive to the bracing variation). Moreover, the first buckling load and its first variation for a new bracing stiffness should be determined, and on this basis an increment of the bracing stiff-ness can be calculated. The calculation must be repeated until a required accuracy is reached. In that way the threshold value of the bracing stiffness for a full bracing condition is obtained. The approximation procedure is graphically illustrated in Fig. 5.11. The calcu-lation results are presented in Table 5.1. The coefficient of the bracing stiffness required for a full bracing condition is α = 6.161 when bracing stiffness k = 60.803 kN/m.
0 1 2 3 4 5 6 7
α = kL0 /Pcr00.00
0.25
0.50
0.75
1.00
1.25
1.50
Pcr /
Pcr
0 Pcr1 / Pcr0
approximation 1
approximation 2
approximation 3
approximation 4
Fig. 5.11. Relative first buckling load vs. relative bracing stiffness and its approximations constructed to find the threshold bracing stiffness condition
When buckling load Pcr has been determined, the buckling length of an individual column can be computed from Eq. (3.46). The buckling length related to the storey height of the frame columns due to the bracing stiffness is also investigated (Fig. 5.12). That buck-ling coefficient for a non-sway frame is 0.875, and in the case of a sway-frame it is 2.328.

5.1. Frame with bracing modelled as elastic springs 89
According to the design codes for weakly braced frames, this coefficient is calculated as for sway frames (excepting Chinesse code GB50017 2003). This approach gives a safe value of the coefficient but it is not precise and may cause an uneconomical design.
Table 5.1
The calculation of the threshold value of bracing stiffness
k Pcr1 Pcr3 δPcr1 δk
0.000 18.213 129.030 10.703 10.354
10.354 66.275 129.030 1.835 34.394
44.354 113.640 129.030 1.106 13.910
58.264 127.030 129.030 0.813 2.460
60.724 128.970 129.030 0.759 0.079
60.803 129.030 129.030 0.758
0 1 2 3 4 5 6 7 8 9 10 11 12
α = kL0/Pcr0
0.5
1.0
1.5
2.0
2.5
buck
ling
leng
th fa
ctor
L0 = h
Fig. 5.12. Effective buckling length of frame columns vs. bracing stiffness parameter α
0 0.5 1 1.5 2 2.5
ΣP/Pcr0-0.10
0.00
0.10
0.20
0.30
0.40
F1
/ (ΣP
) [%
]
bracing "1" reactionk =10 kN/m
k = 30 kN/m
k = 50 kN/m
k = 70 kN/m
Fig. 5.13. The relative bracing no.1 reaction due to vertical load of the frame

5. Buckling of braced frames 90
0 0.5 1 1.5 2 2.5
ΣP/Pcr0
-0.40
-0.30
-0.20
-0.10
F2
/ (ΣP
) [%
]bracing "2" reaction
k = 10 kN/m
k = 30 kN/m
k = 50 kN/m
k = 70 kN/m
Fig. 5.14. The relative bracing no. 2 reaction due to vertical load of the frame
The reactions in braces necessary to carry on forces to stabilize a frame is a significant factor in the design of frame structures. In order to calculate the reaction the frame with imperfection assumed as a horizontal force on the top of the frame equal to 0.2% of the ver-tical load is analysed. The magnitude of the reaction in braces related to the frame vertical loading obtained from the geometrically non-linear static analysis for different stiffnesses of bracing is presented in Fig. 5.13 and Fig. 5.14.
5.2. Frame braced by a vertical column
Multistorey frames may be braced by a vertical column, a rigid core or a vertical truss. In such dual structural systems, frequently used in multistorey or high-rise buildings, one or a number of vertical bracings (such as vertical trusses, concrete or steel shear walls, cores) are connected to frames and work together. In such structural systems, the bracing carries not only most of the horizontal load, but also provides lateral support to frames to prevent the latter from premature sway buckling. In this case a relationship between the buckling load and the bracing rigidity is subject of stability analysis. Such analysis was presented by Tong and Ji (2005), where a frame connected to a bracing column was analysed. The stiff-ness of the bracing column may have a constant rigidity or it may vary along its height.
5.2.1. Description of the model
The following example is a frame system presented in Fig. 5.15. The beams and col-umns have constant cross-sections. The stiffness of the bracing column is also constant along its height. The storey height is h, and the beam span is l. The frame columns are loaded at their tops by forces P. The Winter-type model of the frame is presented in Fig. 5.16.
5.2.2. Results of numerical simulations
The fictitious hinges at column and beam joints introduced in the Winter model of the frame make it possible to consider that the frame beams and columns are rigid and the equilibrium conditions may be formulated for the assumed displacement vector in the following form:
( )cr GP− =K K z 0 , (5.6)
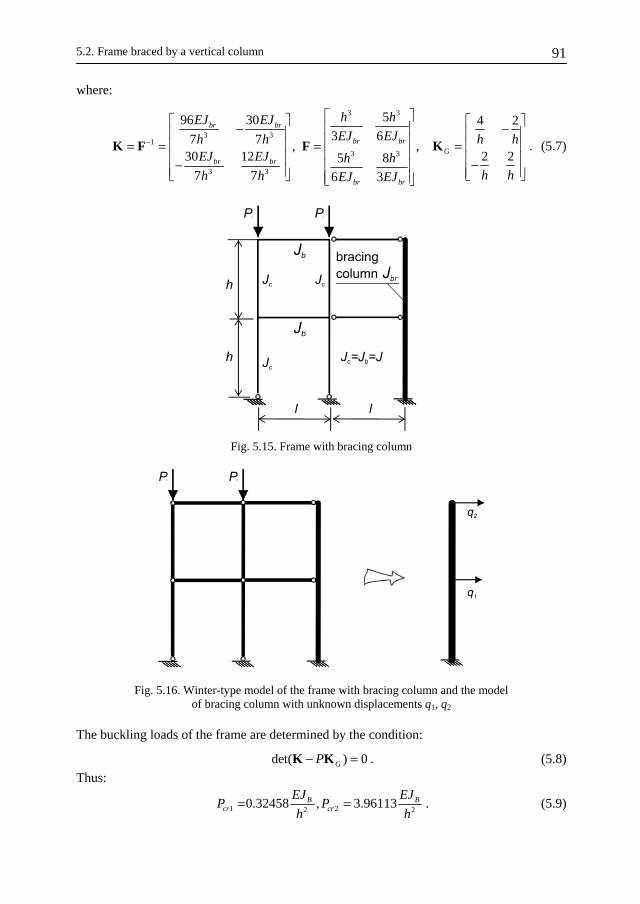
5.2. Frame braced by a vertical column 91
where:
3 3
3 31
3 3
3 3
596 30 4 23 67 7 , ,
30 12 2 25 87 7 6 3
br br
br brG
br br
br br
h hEJ EJEJ EJh h h h
EJ EJ h hh hh h EJ EJ
−
⎡ ⎤⎡ ⎤ ⎡ ⎤− −⎢ ⎥⎢ ⎥ ⎢ ⎥⎢ ⎥= = = =⎢ ⎥ ⎢ ⎥⎢ ⎥⎢ ⎥ ⎢ ⎥−− ⎢ ⎥⎢ ⎥ ⎢ ⎥⎣ ⎦⎣ ⎦ ⎢ ⎥⎣ ⎦
K F F K . (5.7)
Fig. 5.15. Frame with bracing column
Fig. 5.16. Winter-type model of the frame with bracing column and the model of bracing column with unknown displacements q1, q2
The buckling loads of the frame are determined by the condition:
det( ) 0GP− =K K . (5.8)
Thus:
22 21 0.32458 , 3.96113B Bcrcr
EJP
hP
EJ
h== . (5.9)

5. Buckling of braced frames 92
Using the above calculated two buckling loads it is possible to construct the end points of the Winter construction lines. Assuming that the buckling loads are equal to Pcr0, one can obtain the required stiffness of the bracing column. In order to present the result of the example in a similar form as the outcomes found in section 5.1, an elastic spring at the dis-placement q1 at bracing column is defined. Introducing the spring stiffness k1 the bracing stiffness parameter α can be defined by means of the bracing column characteristics as:
31
2
20
10
3, ,br
crcr
EJ EJP
Ph
k h
hk
πα = == (5.10)
It should be added that similar elastic support situated at the top of the bracing column pro-vides an elastic support of the frame that would have 8-times lower stiffness than k1. The buckling modes corresponding to the forces given by Eq. (5.9) are presented in Fig. 5.17. The end point of the construction line is (9.2427,1) (Fig. 5.18). The starting point of the construction line is set out as the first buckling load related to Pcr0 for frame without brac-ings and without hinges: (0.18, 0).
Fig. 5.17. The first two buckling modes for the Winter-type frame (Jbr / J = 1)
0 1 2 3 4 5 6 7 8 9 10 11 12
α = kL0/Pcr00.0
0.2
0.4
0.6
0.8
1.0
1.2
1.4
Pcr /
Pcr
0
exact
Winter modelL0=h
Fig. 5.18. Relationship of relative critical load due to bracing stiffness parameter α
The poly-line calculated for the Winter-type model of frame is compared with the exact relationship (found by parametrical analysis) between the buckling load and the coefficient of bracing (Fig. 5.18). Unlike the previous example the Winter poly-line is a safe lower limit of the buckling load of the braced frame in function of the bracing stiffness. This is due to the fact that the first buckling mode corresponds to overall sway mode both for the Winter-type and the original frame (Figs 5.19, 5.20). This is different from the buckling of

5.2. Frame braced by a vertical column 93
the frame braced by a multiple lateral bracing where the first buckling mode is changed from one half-wave to multiple half-waves when the bracing stiffness increases.
The sensitivity analysis of the frame with a bracing column due to the variation of the stiffness of that column can be performed by the formula of Eq. (3.42). According to Eq. (3.42) the buckling mode normalized by condition Eq. (3.39) and partial derivatives of the initial stiffness and initial stress stiffness matrix due to the design variable are needed. The sensitivity analysis of the frame was performed by program MATLAB (2007).
Fig. 5.19. The first two buckling modes for frame (Jbr / J = 0.01)
a) b) c)
Fig. 5.20. The first buckling mode: a) α = 0.00299, Jbr / J = 0.01, b) α = 1.4955, Jbr / J = 5, c) α = 8.973, Jbr / J = 30
The influence lines of the buckling load variation due to the unit stiffness variation (δEJB = 1) of bracing column along its length were found (Fig. 5.21). The influence lines are related to the critical load of a simply supported column of length h: Pcr0. The lines magnitude depends on the initial bracing column stiffness. In the case of a frame with a bracing column of low stiffness the influence line has a maximal value at the bottom of the column and at coordinate y = 11 m. Then the same analysis is carried out for a frame with a bracing column of stiffness k1 = 17.71 kN/m (α = 1.79). It has been found out that in this case the most effective increase of the buckling load may be obtained after an increase of the column stiffness at the bottom. The third influence line is found for the bracing col-umn stiffness k1 = 109.22 kN/m (α = 11.79). One can conclude that the increase of the column stiffness does not cause a rise of the buckling load.

5. Buckling of braced frames 94
0x100 2x10⁻⁵ 4x10⁻⁵ 6x10⁻⁵ 8x10⁻⁵
ΛPcr ,IB / Pcr0 [1/(kNm3)]
0
5
10
15
20
y [m
]
α = 11.79, k1 = 109.22 kN/m
α = 1.79, k1 = 17.71 kN/m
α = 0.299, k1 = 2.95 kN/m
Fig. 5.21. Influence lines of the critical load relative variation of the flexural buckling due to variation of the bracing column stiffness for various initial coefficients of the bracing column rigidity α
The parametrical analysis of changes in the first three buckling loads of the frame due to the stiffness of vertical bracing column was carried out. As a result the relationship between the buckling loads and the bracing stiffness parameter was estimated (Fig. 5.22). For an unbraced frame the third buckling load is insensitive to the bracing stiffness varia-tion (horizontal line in Fig. 5.22) for α < 0.8. Thus with an increase of the bracing stiffness the second and finally the first buckling load become insensitive to the bracing column stiffness variation. The magnitude of the bracing stiffness enough to obtain a maximal value of the first buckling load is the threshold condition for full bracing.
0 1 2 3 4 5 6 7 8 9 10 11 12
α = kL0/Pcr0
0.0
0.5
1.0
1.5
2.0
Pcr
/ P
cr0
Pcr1 / Pcr0
Pcr2 / Pcr0
Pcr3 / Pcr0
Fig. 5.22. Relationship of relative buckling loads (1–3) to bracing stiffness parameter α for the frame with a bracing column
The sensitivity analysis was used to determine the full bracing condition that appeared to be the threshold bracing stiffness needed to obtain a maximal critical load of the frame. In order to calculate the threshold bracing stiffness the method described in section 5.1.2. was applied. At the beginning of the analysis, a frame without bracing is considered. The first variation of a few lowest critical buckling loads should be calculated. In the examined
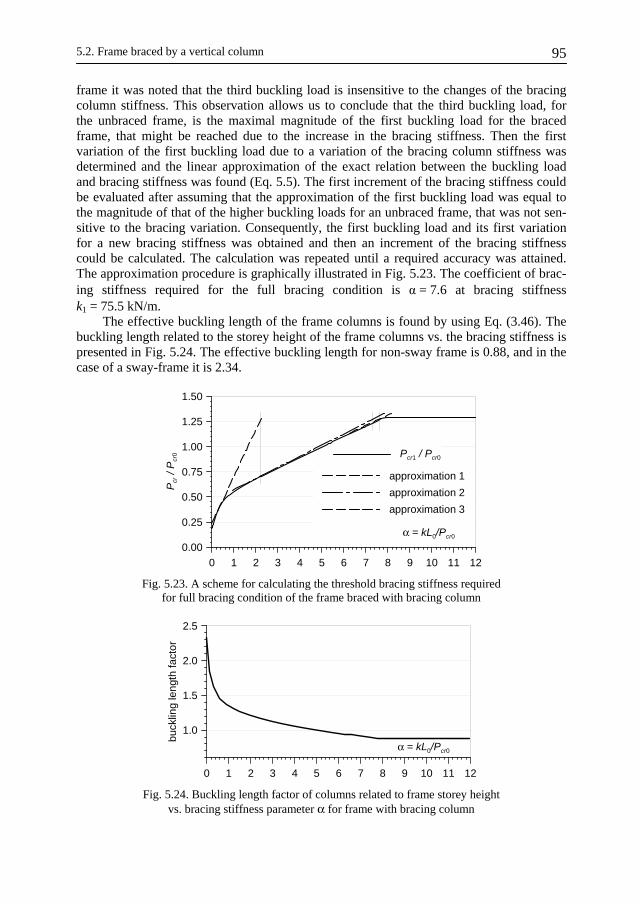
5.2. Frame braced by a vertical column 95
frame it was noted that the third buckling load is insensitive to the changes of the bracing column stiffness. This observation allows us to conclude that the third buckling load, for the unbraced frame, is the maximal magnitude of the first buckling load for the braced frame, that might be reached due to the increase in the bracing stiffness. Then the first variation of the first buckling load due to a variation of the bracing column stiffness was determined and the linear approximation of the exact relation between the buckling load and bracing stiffness was found (Eq. 5.5). The first increment of the bracing stiffness could be evaluated after assuming that the approximation of the first buckling load was equal to the magnitude of that of the higher buckling loads for an unbraced frame, that was not sen-sitive to the bracing variation. Consequently, the first buckling load and its first variation for a new bracing stiffness was obtained and then an increment of the bracing stiffness could be calculated. The calculation was repeated until a required accuracy was attained. The approximation procedure is graphically illustrated in Fig. 5.23. The coefficient of brac-ing stiffness required for the full bracing condition is α = 7.6 at bracing stiffness k1 = 75.5 kN/m.
The effective buckling length of the frame columns is found by using Eq. (3.46). The buckling length related to the storey height of the frame columns vs. the bracing stiffness is presented in Fig. 5.24. The effective buckling length for non-sway frame is 0.88, and in the case of a sway-frame it is 2.34.
0 1 2 3 4 5 6 7 8 9 10 11 12
α = kL0/Pcr0
0.00
0.25
0.50
0.75
1.00
1.25
1.50
Pcr /
Pcr
0 Pcr1 / Pcr0
approximation 1
approximation 2
approximation 3
Fig. 5.23. A scheme for calculating the threshold bracing stiffness required for full bracing condition of the frame braced with bracing column
0 1 2 3 4 5 6 7 8 9 10 11 12
α = kL0/Pcr0
1.0
1.5
2.0
2.5
buck
ling
leng
th fa
ctor
Fig. 5.24. Buckling length factor of columns related to frame storey height vs. bracing stiffness parameter α for frame with bracing column
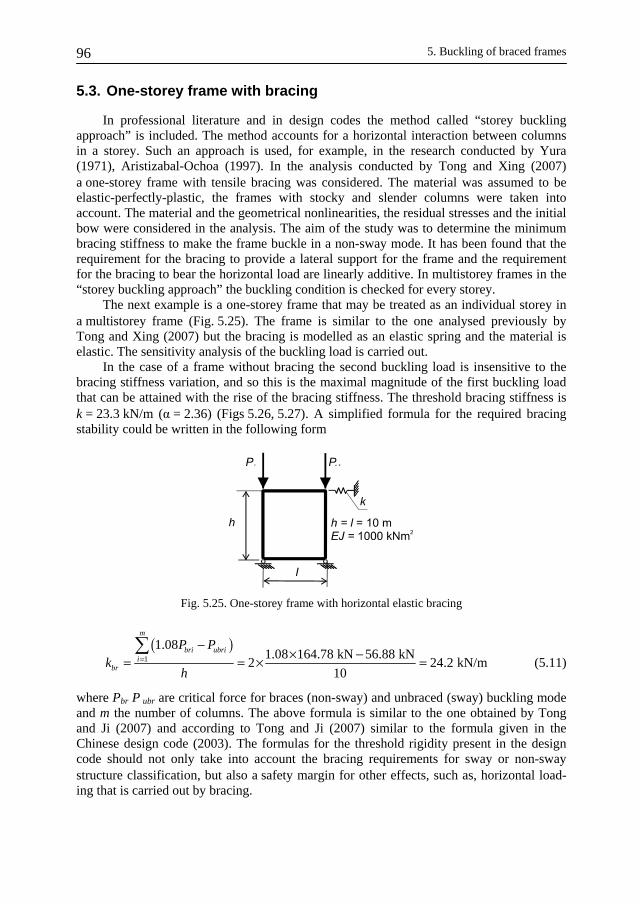
5. Buckling of braced frames 96
5.3. One-storey frame with bracing
In professional literature and in design codes the method called “storey buckling approach” is included. The method accounts for a horizontal interaction between columns in a storey. Such an approach is used, for example, in the research conducted by Yura (1971), Aristizabal-Ochoa (1997). In the analysis conducted by Tong and Xing (2007) a one-storey frame with tensile bracing was considered. The material was assumed to be elastic-perfectly-plastic, the frames with stocky and slender columns were taken into account. The material and the geometrical nonlinearities, the residual stresses and the initial bow were considered in the analysis. The aim of the study was to determine the minimum bracing stiffness to make the frame buckle in a non-sway mode. It has been found that the requirement for the bracing to provide a lateral support for the frame and the requirement for the bracing to bear the horizontal load are linearly additive. In multistorey frames in the “storey buckling approach” the buckling condition is checked for every storey.
The next example is a one-storey frame that may be treated as an individual storey in a multistorey frame (Fig. 5.25). The frame is similar to the one analysed previously by Tong and Xing (2007) but the bracing is modelled as an elastic spring and the material is elastic. The sensitivity analysis of the buckling load is carried out.
In the case of a frame without bracing the second buckling load is insensitive to the bracing stiffness variation, and so this is the maximal magnitude of the first buckling load that can be attained with the rise of the bracing stiffness. The threshold bracing stiffness is k = 23.3 kN/m (α = 2.36) (Figs 5.26, 5.27). A simplified formula for the required bracing stability could be written in the following form
Fig. 5.25. One-storey frame with horizontal elastic bracing
( )
1
1.081.08 164.78 kN 56.88 kN
2 24.2 kN/m10
m
bri ubrii
br
P Pk
h=
−× −= = × =
∑ (5.11)
where Pbr P ubr are critical force for braces (non-sway) and unbraced (sway) buckling mode and m the number of columns. The above formula is similar to the one obtained by Tong and Ji (2007) and according to Tong and Ji (2007) similar to the formula given in the Chinese design code (2003). The formulas for the threshold rigidity present in the design code should not only take into account the bracing requirements for sway or non-sway structure classification, but also a safety margin for other effects, such as, horizontal load-ing that is carried out by bracing.

5.3. One-storey frame with bracing 97
0 1 2 3 4
α = kL0/Pcr0
0.00
0.01
0.02
0.03
0.04
0.05
0.06
0.07
δPcr /
Pcr
0
δPcr1 / Pcr0
δPcr2 / Pcr0
Fig. 5.26. Relative variation of first and second buckling load vs. bracing stiffness parameter α
0 1 2 3 4
α = kL0/Pcr0
0.0
0.5
1.0
1.5
2.0
2.5
Pcr /
Pcr
0
Pcr1 / Pcr0
Pcr2 / Pcr0
Fig. 5.27. First and second relative buckling load vs. bracing stiffness parameter α
5.4. Ten-storey braced frame with columns of constant stiffness
5.4.1. Description of the model
The next frame under consideration is presented in Fig. 5.28a. The frame is loaded at each beam and column connections. The beams and the columns stiffness are constant. The frame is braced by a column of stiffness EJbr that is constant along its height.

5. Buckling of braced frames 98
Fig. 5.28. The frame with bracing column: a) constant stiffness along the frame height Jn =J1, Jbr n= Jbr 1, b) variable stiffness along the frame height Jn = n × J1, Jbr n = n × Jbr 1
5.4.2. Results of numerical simulation
The relation of the first, the second, the third, the fourth and the eighth buckling load to the relative stiffness of the bracing column is shown in Fig. 5.29. The magnitude of the buckling load that is insensitive to the bracing stiffness is constant. For the initially unbraced frame the eighth buckling load is constant in function of the bracing stiffness, but this is not visible in Fig. 5.29 because of the assumed scale. And thus other lower buckling forces become insensitive to the bracing column stiffness variations, and in the end the first buckling load at the threshold bracing stiffness is also insensitive to the changes of the

5.4. Ten-storey braced frame with columns of constant stiffness 99
bracing stiffness. The variation of the first fifteen buckling loads due to the stiffness of the column for an initially unbraced frame is presented in Fig. 5.30.
0 100 200 300 400 500
Jbr / J0br1
0
20
40
60
80
100
Pcr
i [k
N]
Pcr8
Pcr4
Pcr3
Pcr2
Pcr1
J0br1=480 cm4
Fig. 5.29. Relation of critical loads (1–4, 8) to the relative rigidity of the bracing column for the frame braced by the column with constant stiffness (model of Fig. 5.28a)
1 2 3 4 5 6 7 8 9 10 11 12 13 14 15
buckling load number
0.000
0.002
0.004
0.006
0.008
0.010
δPcr
i (δ
EJ b
r =
1)
Fig. 5.30. The first fifteen frame buckling load variations due to the bracing column stiffness variation for the initially unbraced frame (model of Fig. 5.28a)
The sensitivity analysis of the buckling load due to the bracing stiffness variation is carried out. The numerical calculations were carried out with the commercial finite element code ROBOT STRUCTURAL ANALYSIS PROFESSIONAL (2010) and MATLAB (2007). The frame was divided into 50 elements along its height.
The influence lines of the flexural buckling load variation due to the unit stiffness variation of the bracing column are found. The influence line of the variation of the first flexural buckling load due to the unit variation of the stiffness bracing column is presented in Fig. 5.31. One can conclude that the increase of the bracing column stiffness in the part of the column where y < 5 m and 12 m < y < 21 m is most effective in the increase of the buckling load.

5. Buckling of braced frames 100
0.0x100 5.0x10⁻⁵ 10-4 1.5x10⁻⁴ 2.0x10⁻⁴
ΛPcr , J br [1/m3]
0
6
12
18
24
30
36
42
48
54
60
y [m
]
Jbr/ J0br1=0.0035
Fig. 5.31. The influence line of the frame buckling load variation due to the bracing column stiffness variation for the frame with bracing column of stiffness Jbr / J0br1= 0.0035 (model a)
The sensitivity analysis was applied to determine the full bracing condition of the frame. At the beginning of the analysis, the frame without bracing was considered. The first variation of the first few critical buckling loads allow us to find that the eighth buckling load is not sensitive to an increase of the bracing column stiffness. Then the iteration de-scribed in sections 5.1 and 5.2 is carried out. The threshold value of the bracing stiffness for a full bracing condition was determined. The calculation results are presented in Table 5.2. The threshold value of the bracing stiffness required for a full bracing condition is EJbr /EJ0br1 = 365.96 and for that stiffness of bracing the first buckling load multiplier is 52.44 (99% of the eighth buckling load).
The buckling modes of the frame were also under consideration. When the relative stiffness of the bracing column increases from zero to 365.96, the first buckling mode of the frame corresponds to the overall sway buckling mode. At the threshold bracing stiffness the first buckling mode is changed to non-sway buckling mode (Fig. 5.32). This is different in comparison with the buckling of a column braced by multiple lateral bracings (as in sec-tion 5.1), where the first buckling mode is changed from a one half-wave to multiple half-waves with a rise of the bracing stiffness. It is worth noting that the threshold bracing stiff-ness is determined in three approximation steps.
An effective buckling length of the frame columns is found by means of Eq. (3.46). The buckling length related to the storey height of the frame columns due to the bracing stiffness is presented in Fig. 5.33. The buckling length factor for the unbraced sway-frame is between 1.32–4.17 and for a non-sway frame 0.72–2.27, depending on the storey of the frame (Fig. 5.33).
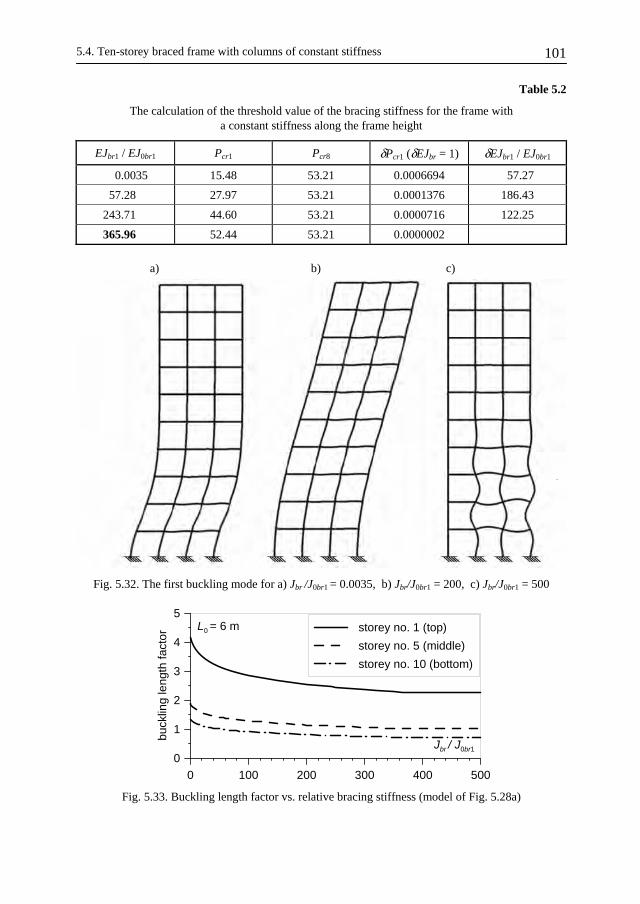
5.4. Ten-storey braced frame with columns of constant stiffness 101
Table 5.2
The calculation of the threshold value of the bracing stiffness for the frame with a constant stiffness along the frame height
EJbr1 / EJ0br1 Pcr1 Pcr8 δPcr1 (δEJbr = 1) δEJbr1 / EJ0br1
000.0035 15.48 53.21 0.0006694 057.27
057.2800 27.97 53.21 0.0001376 186.43
243.7100 44.60 53.21 0.0000716 122.25
365.9600 52.44 53.21 0.0000002
a) b) c)
Fig. 5.32. The first buckling mode for a) Jbr /J0br1 = 0.0035, b) Jbr/J0br1 = 200, c) Jbr/J0br1 = 500
0 100 200 300 400 500
Jbr / J0br1
0
1
2
3
4
5
buck
ling
leng
th fa
ctor
storey no. 1 (top)
storey no. 5 (middle)
storey no. 10 (bottom)
L0 = 6 m
Fig. 5.33. Buckling length factor vs. relative bracing stiffness (model of Fig. 5.28a)

5. Buckling of braced frames 102
5.5. Ten-storey braced frame with columns of variable stiffness
5.5.1. Description of the model
The frame presented in Fig. 5.28b is the object of consideration. The multistorey framed structure is braced by a vertical column. The frame is loaded at each beam and the column connections. The sectional properties of the frames and the bracing columns change along the height, but the stiffness of the horizontal beams is constant. It is assumed that the sectional properties of the frame and the bracing column vary linearly along the frame height being constant at each storey. This assumption is more realistic because it is similar to the normal force distribution along the frame columns.
5.5.2. Results of numerical simulation
The relationship of the first four and eleventh buckling loads to the relative stiffness of the bracing column is shown in Fig. 5.34.The relationship of the first buckling load to the stiffness of the bracing column increases almost linearly with the stiffness of the bracing column and then the buckling mode changes to a non-sway mode. The magnitude of the buckling load that is insensitive to the bracing stiffness variation is constant. For the initially unbraced frame the eleventh buckling load is constant in function of the bracing stiffness. With an increase of the bracing column stiffness other buckling forces become insensitive to the bracing column stiffness variations. Finally, at the threshold bracing stiff-ness, the first buckling load is also insensitive to the changes of the bracing stiffness. The variation of the first fifteen buckling loads due to the stiffness of the column for initially unbraced frame is presented in Fig. 5.35.
0 500 1000 1500 2000
Jbr1 / J0br1
0
100
200
300
400
500
Pcr
i [k
N]
Pcr11
Pcr4
Pcr3
Pcr2
Pcr1
J0br1=480 cm4
Fig. 5.34. Relationship of critical loads (1-4,11) to the relative rigidity of the bracing column for the frame braced by the column with variable stiffness along its height (model of Fig. 5.28b)
The sensitivity analysis of the buckling load due to the bracing stiffness variation is carried out. The analysis is performed by means of program ROBOT STRUCTURAL ANALYSIS PROFESSIONAL (2010) and MATLAB (2007). The frame was divided into 50 elements along its height. The influence lines of variation of the first buckling load due to the unit stiffness variation of the bracing column are found (Fig. 5.36). One can conclude

5.5. Ten-storey braced frame with columns of variable stiffness 103
that the increase of the bracing column stiffness in the first two storeys of the frame is most effective in the increase of the buckling load. The increase of column stiffness at fifth and sixth storey may also result in the increase of the buckling load, but this effect is several times lower than the influence of the stiffness at the first two storeys of the frame.
1 2 3 4 5 6 7 8 9 10 11 12 13 14 15
buckling load number
0.00
0.02
0.04
0.06
0.08δP
cri (δ
J br =
1)
Fig. 5.35. The first – fifteenth frame buckling load variations due to the bracing column stiffness variation for the initially unbraced frame (model of Fig. 5.28b)
0x100 10-4 2x10⁻⁴ 3x10⁻⁴
ΛPcr , J br [1/m3]
0
6
12
18
24
30
36
42
48
54
60
y [m
]
Jbr1/J0br1=0.00055, Jn=n x J1 , Jbr n=n x Jbr 1
Fig. 5.36. The influence line of the frame buckling load variation due to the bracing column stiffness variation for the frame with bracing column of stiffness Jbr1/J0br1 = 0.00055 (model of Fig. 5.28b)
By the use of the sensitivity method the full bracing condition of the frame was deter-mined. At first the frame without bracing was studied. The first variation of the first few critical buckling loads made it possible to note that the eleventh buckling load was insensi-tive to an increase of the bracing column stiffness. The iteration described in sections 5.1 and 5.2 is carried out. The threshold value of the bracing stiffness for a full bracing condi-

5. Buckling of braced frames 104
tion was determined. The calculation results are presented in Table 5.3. The threshold value of the bracing stiffness required for a full bracing condition is EJbr1 /EJ0br1 = 542.1, and the first buckling load multiplier is 306.99 (98% of the eleventh buckling load). It is worth noting that the threshold bracing stiffness is determined in only two approximation steps.
Table 5.3
The calculation of the threshold value of the bracing stiffness for the frame with variable stiffness along its height (model Fig. 5.28b)
EJbr1 / EJ0br1 Pcr1 Pcr11 δPcr1 (δEJbr) δEJbr1 / EJ0br1
000.0035 032.85 312.66 0.0019544 145.49
145.5000 120.19 312.66 0.0004932 396.59
542.1600 306.99 312.66 0.0000024
The buckling modes of the frame were also taken into consideration. When the relative stiffness of the bracing column increases from zero to 542.1, the first buckling mode of the frame is an overall sway buckling. At the threshold bracing stiffness the first buckling mode changes to non-sway buckling mode (Fig. 5.37). This is different in comparison with the buckling of a column braced by multiple lateral bracings (as in section 5.1), where the first buckling mode changes from one half-wave to a multiple half-waves with an increase of the bracing stiffness.
a) b) c)
Fig. 5.37. The first buckling mode for a) Jbr1/J0br1 = 1, b) Jbr1/J0br1 = 100, c) Jbr1/J0br1 = 600
The effective buckling length of the frame columns found using Eq. (3.46), related to the storey height, due to the bracing stiffness is illustrated in Fig. 5.38. The buckling length factor for the unbraced sway frame is about 2.87, and for a non-sway frame 0.94 (Fig. 5.38).

5.5. Ten-storey braced frame with columns of variable stiffness 105
0 100 200 300 400 500 600 700
Jbr1 / J0br1
0.5
1.0
1.5
2.0
2.5
3.0
buck
ling
leng
th fa
ctor L0 = 6 m
Fig. 5.38. Buckling length factor vs. relative bracing stiffness (model of Fig. 5.28b)
In this chapter the stability of the frame braced by lateral braces and by vertical columns is investigated. A relationship between the buckling load and the bracing stiffness is determined by using numerical simulations. The Winter-type model of frames with ficti-tious hinges at the beam and the column joints is constructed in order to investigate a safe lower limit of the relation between the buckling load and the bracing stiffness. The sensitiv-ity analysis of the buckling load due to the bracing stiffness is carried out. A method based on the sensitivity analysis to determine the threshold stiffness for the bracing to be sufficient to make the frames buckle in a non-sway mode is proposed. The results of the numerical analysis give a reason for some conclusions to be drawn re-garding the effect of the bracing stiffness on the critical buckling load. The main of them may be summarized as follows: ⎯ According to the relationship between the buckling load and the bracing stiffness it is
possible to account for a positive effect of bracing also for weakly braced frames, classi-fied in codes as sway structures.
⎯ The Winter-type model of frame with fictitious hinges does not provide a safe lower limit of the critical load for a frame braced by lateral braces (discrete springs) for a full range of bracing stiffnesses.
⎯ In the case of dual structural systems where frames are braced by vertical columns the Winter-type model of frame provides a safe lower limit of critical load of frame for a full range of bracing stiffnesses.
⎯ By the use of the sensitivity analysis of the buckling load it is possible to obtain the influence lines of the buckling load variation due to the bracing stiffness variation. The lines depend on the stiffness of bracing. The influence lines obtained for the frame with multiple lateral braces are different from some similar lines for dual structural systems where the frames are braced by vertical columns. The difference is essential because the largest increase of the first buckling load of the frame with lateral braces is obtained after location of a new brace at the top of the initially unbraced frame, and in the case of a dual frame-bracing column system an increase of the buckling load is achieved when the stiffness of the bottom part of the bracing column rises.
⎯ The proposed method based on the sensitivity analysis to determine the threshold stiff-ness of bracing for a full bracing condition can help to obtain the maximal magnitude of the first buckling load and of the threshold bracing stiffness that is defined as the bra-cing stiffness at which the braced frames buckle in a non-sway mode.
⎯ In the proposed method of applying the sensitivity analysis to the calculation of the threshold bracing condition only the stability requirements of the frame are taken into

5. Buckling of braced frames 106
account. In the calculation of the threshold bracing stiffness the effect of various imper-fections must be considered prior to its use in practice. In practical structures bracing carries also the horizontal loading that induces stresses both in the bracing member and in the frame as well. This load may cause a decrease of the stiffness of the bracing member. When the bracing column is loaded by vertical forces, part of its lateral stiff-ness must be used to prevent buckling by the axial force. In this case the stiffness used to strengthen the lateral stability of the frame decreases. The above mentioned effects should be taken into account and verified before the proposed method can be used in practice.
⎯ The buckling length factor for columns of weakly braced frames is lower than the one for sway structures and this effect is neglected in simplified code formulas.
⎯ The buckling mode for dual frame – bracing column system is different in comparison with the buckling of a column braced by multiple lateral bracing where the first buc-kling mode is changed from a one half-wave to multiple half-waves when the bracing stiffness increases.

Chapter 6
BUCKLING OF BRACED TRUSSES
Steel trusses have a much greater strength and stiffness in their plane than out of their plane, and therefore should be braced against lateral deflection and twisting. The problem of bracing requirements necessary to provide lateral stability of compressed members appears in code PN-90/B-03200 (1990) or PN-EN 1993-1-1 (2006), and in Eurocode 3 (1992, 2005). Some simplified design code requirements make it possible to assume that the out-of-plane buckling length of trusses compression chords is equal to the distance between braces. In this approach only the truss top chord is considered. The effect of lower chords, verticals and diagonals on the truss stability is neglected. The verticals and diago-nals are assumed to be vertical supports for the truss top chord, while the side-bracing of the truss chords is a rigid side-support, and the normal forces in the truss chords are assumed to be constant along their lengths. The flexural in-plane and out-of-plane buckling of the compressed chord is considered. Under the above described conditions the buckling length of the compressed truss chords is usually lower than described in the design codes. The codes should give a safe method to design the truss structures.
The buckling of real truss structures is more complex than the buckling of compressed truss chords and involves deformation of all truss elements. The stability analysis should therefore account for torsion and bending of the diagonals, verticals and the lower truss chord. In real truss structures the “web members” and bottom chord partially restrain the top chord against the out-of-plane buckling. The stiffness of connections between the truss chords, diagonals and verticals, and the boundary conditions at the supports are of funda-mental importance to the stability of the whole structure. The normal force in the truss top chord is usually maximal only in the middle of the truss span and lower near the supports. This variation in the member forces has also a positive effect on the truss top chord stabil-ity. The above described problems motivated many researchers to investigate the stability of trusses more carefully. All the above mentioned effects were the subject of many researches in Polish scientific literature, as for example, Jankowska-Sandberg and Pałkowski (2002), Biegus and Wojczyszyn (2004–2006) or Niewiadomski (2002). The problem was also experimentally investigated in a research carried out by Jankowska-Sandberg et al. (2003a, 2003b). In most of the above researches it has been found that the buckling length of the truss top chord is lower than the distance between braces. Another explanation of the buckling length reduction found in the papers mentioned before is a positive influence of the torsional restraints at the truss supports. In the researches the truss bracing was assumed to be rigid. This conclusion is consistent with the code recom-mendations where the buckling length of the truss chords in the case of the out-of-plane truss buckling can be regarded as the distance between braces. Only the research carried out by Biegus and Wojczyszyn (2004–2006) has shown that for short trusses the buckling length is about 10–20% greater than the side-support distance.
However, in real structures bracing is usually considered to be elastic or even the braces may be described by non-linear force-displacement characteristic. This is due to various inaccuracies or connection tolerance. In the literature there are many solutions oriented to the stability of restrained structures. A review of stability analysis problems of

6. Buckling of braced trusses 108
various structures, such as, columns, beams or frames with bracing was given in Chapter 1. Similar problems concerning bracing requirements of trusses are presented only in a few publications. The stability of trusses with elastic bracing was investigated in an experimen-tal research by Kołodziej and Jankowska-Sandberg (2006). The tests were verified by a nu-merical analysis conducted by Iwicki (2007b). Some extended results of such verification are presented in section 6.7. Other examples of roof structures where braces are not rigid but should even be elastic or of non-linear force-displacement characteristics were presented by Iwicki and Kin (2000) or Iwicki and Krutul (2006). This situation occurs, for example, in sloping roof constructions where the truss bracing may be situated at an angle to the horizontal plane. The results of the author’s numerical studies (2007d) of two roof trusses with horizontal and sloping elastic bracing indicate that the effective buckling length of truss compressed chords is greater than the side-support spacing. The non-linear static analysis of the trusses designed according to code PN-90/B-03200 (1990) has shown that the stability of the truss is provided even when the out-of-plane buckling length of truss chords is greater than the side-support spacing (see, for example, Iwicki 2007b, 2007d, 2007f). Similar results were obtained in the case of an analysis of roof trusses stabilised by corrugated sheets (Iwicki 2010c). The lateral braces, as for instance, purlins or bridging ele-ments may be taken also as torsional braces of the truss. The stability of the truss with both lateral and torsional braces was analysed by Iwicki (2008b). The limit normal force in chords was between 20% and 70% greater than that of a truss without torsional braces.
The present research is focused on the determination of the relation between the limit and the buckling load of trusses due to the bracing stiffness. A full bracing condition for trusses with elastic bracing is investigated. The basic problem under consideration is devoted to the study of the required bracing stiffness that ensures the out-of-plane truss buckling to occur between braces, or to be prevented. At the threshold bracing stiffness other truss elements, such as, compressed diagonals, or verticals, or the truss top chord may buckle in the truss plane. The full bracing condition may also be defined as the bracing stiffness necessary to obtain the maximal buckling load of the truss, or when an increase in bracing stiffness does not cause any further increase of the buckling load. The threshold condition of truss bracing is therefore needed, and such condition in the design codes should be described in an applicable form.
The geometrically non-linear static analysis of various braced trusses is also conducted. The analysis allows us to determine a bracing stiffness necessary to ensure that the maximal truss top chord normal forces in a limit state is greater than a similar force caused by design load. The analysis make it possible to find the reaction in braces of the imperfect trusses.
In the present Chapter some solutions of restrained column and beam buckling inves-tigated by Trahair (1993) are compared with the stability of braced trusses. The model of braced column introduced by Winter (1958) and extended by Yura (1996) is used to predict the buckling load of the truss compressed chord and to calculate a necessary stiffness of braces. Various roof trusses are considered. The examples are selected from the trusses previously analysed by Niewiadomski (2002) or Hotała et al. (2007). These trusses are re-analysed here, but with elastic bracing, instead of a rigid one (sections 6.1, 6.4). In section 6.7 the experimental research conducted by Kołodziej and Jankowska-Sandberg (2006) are examined in a parametrical study. The trusses analysed in sections 6.2, 6.3 and 6.5 are simi-lar to some roof trusses designed by the author in real roof structures. Most of the trusses are designed in a similar way, e.g. the chords are made of the same profile, usually from 2L rolled profiles, verticals and diagonals from channel sections, only the most loaded

6.1. Truss with horizontal elastic braces 109
compression diagonals are made of 2L rolled profiles. Such trusses are used in many real constructions and are produced by well-known factories, as for example, MAKU in Sweden.
In various worked examples of truss structures with side-bracing the following inves-tigations are conducted: ⎯ for different bracing stiffnesses the elastic limit and the buckling load of the truss are
calculated, ⎯ the reactions in braces in function of the normal force in the truss chord are found, ⎯ the effective buckling lengths of the truss top chord in the out-of-plane direction of the
truss are determined.
In the analysed trusses, the lateral braces of the truss top chord, the sloping braces, the torsional braces and the braces located both in the upper and lower truss chord, are consid-ered.
The sensitivity of the buckling and limit load of trusses due to the bracing stiffness is also analysed. The functions describing the effect of the braces stiffness variation on the limit and critical load of truss are found. The linear approximations of the exact relationship of the limit and the buckling truss load due to the variations of the braces stiffness are determined. A method for the determination of the threshold stiffness of bracing that is necessary to obtain the maximal buckling load is proposed. The method is based on the sensitivity analysis solutions applied to a truss without bracing. Both the trusses with brac-ing modelled as elastic springs, and a part of the roof structure with trusses braced by flexural bracing located in the roof plane are studied.
6.1. Truss with horizontal elastic braces
In the first example a typical roof truss is considered (Fig. 6.1). A similar truss was earlier studied by Niewiadomski (2002), who focused his research on static analysis of the truss with various imperfections. However, it was assumed that the truss braces were rigid. The non-linear analysis of this truss with elastic braces for different imperfections and brac-ing stiffnesses was presented by Iwicki (2006, 2007b, 2007d). Some comments concerning the results found by Iwicki (2007b) were published by Pałkowski et al. (2008). The com-ments assured the author that the problem investigated was important and required more attention (Iwicki 2008d). The comments also provided inspiration for the present analysis. The purpose of the present parametric analysis is to determine the critical and the limit load of the truss in function of braces stiffness. The reaction in braces and the effective buckling length of the truss top chord in function of the braces stiffness is also investigated. The pre-sent parametric study is intended to determine the minimal stiffness of bracing that prevents the truss from the out-of-plane buckling.
6.1.1. Description of the model
The truss under investigation is 24 m long, its height in the middle is 3 m, and 1.8 m at the supports (Fig. 6.1). The truss chords and two diagonals near the supports consist of 2L 80×80×8 rolled profiles. The diagonals and verticals are made of U80 profiles. At the truss joints, a U profile is placed between the L profiles. The two verticals at the supports are made of HEA110. The connections between all truss elements are assumed to be rigid. The load is applied to the truss top chord joints in the form of 9 concentrated forces, and its magnitude representing the dead weight, and the snow loading of the roof structure is

6. Buckling of braced trusses 110
21.7 kN. The truss top chord is laterally braced every 3 m at joints by elastic side-braces of stiffness amounting in the range up to 200 kN/m. It is assumed that the braces are connected with the truss top chord cross-section centre. The case of the truss without brac-ing is also considered. The truss is designed according to the code PN-90/B-03200 (1990). The normal force in truss top chord under snow and dead weight loading is N0 = 181.52 kN. The plastic resistance of chords is Npl = 750 kN. Both the truss with perfect geometry (without imperfections) and a model with some imperfections are analysed. The results of a large displacement static analysis are sensitive to initial imperfections. Both the magni-tude and the shape of initial imperfections affect the limit load of the truss. In the analysed model the truss top chord appears as a poly-line and the truss joints are located on a parab-ola of maximal magnitude in the middle being equal to L/500 (in the out-of-plane direction of the truss) .
Two discrete models of the truss are assumed. In the first model (I) each truss member is modelled by means of only one beam element with six degrees of freedom in node (see section 3.5). It should be noted that this kind of model is often generated by structural analysis programs as a typical structure from type library. In the second model (II) each truss member is divided into four spatial beam elements. The braces are modelled as linear elastic springs.
Fig. 6.1. Truss with bracing
6.1.2. Results of numerical simulation
The geometrically non-linear static analysis of the truss is carried out. The analysis is performed by means of program ROBOT STRUCTURAL ANALYSIS PROFESSIONAL (2010). The limit load of the truss is found by means of the non-linear analysis and the load control method. For different stiffnesses of braces the non-linear relations between the normal force in the truss top chord and the out-of-plane displacement of the truss (at midspan of the truss top chord) are found. The relations for the first model of the truss are presented in Fig. 6.2. The limit force rises with an increase of the braces stiffness. Even for braces of low stiffness, for example k = 10 kN/m, the normal force in the top chord corre-sponding to the limit load is greater than the normal force caused by a static load of the roof (N0). In the case under consideration normal forces in the truss top chord at limit state, for the braces stiffness lower than 120 kN/m, are lower than the top chord plastic resistance.
The non-linear relations between the normal force in the truss top chord and the braces stiffness for second model is presented in Fig. 6.3. It is worth pointing out that there are sig-nificant differences in the results of the two models. The truss limit load for the second

6.1. Truss with horizontal elastic braces 111
truss model with a bracing stiffness greater than 40 kN/m is almost of the same magnitude. The normal forces in the truss top chord, corresponding to the limit load of the truss, calcu-lated for the two models are compared in Fig. 6.4a. It can be concluded that the limit loads found for the assumed discrete models are similar with regard to low bracing stiffness. The differences are up to 7.7% for bracing stiffness less than k = 30 kN/m (α = 0.0361), and hence the differences are up to 81% for k = 200 kN/m (α = 0.241). Thus, the type of the discrete model may affect the results. Special attention should therefore be paid if a stan-dard library type of structural model is generated. The reason for the difference between the limit loads of the two models consist in ignoring the local deformation of the truss top chord in the first model. The deformations of the truss at the limit state for the two models are presented in Fig. 6.5.
-10 -5 0 5 10 15 20 25 30
out-of-plane truss displacement [cm]-0
200
400
600
800
norm
al fo
rce
in tr
uss
top
chor
d [k
N]
k[kN/m] 100
120
200
k[kN/m]10
20
40
60
80
N0
Npl
model I
N0 = 181.52 kNNpl = 750 kN
v0 = 4.8 cm
Fig. 6.2. Normal force in the truss top chord vs. the out-of-plane displacement of truss (at midspan) for different stiffnesses of braces (model I)
0 5 10 15 20 25 30
out-of-plane truss displacement [cm]0
100
200
300
400
norm
al fo
rce
in tr
uss
top
chor
d [k
N]
k[kN/m]60
80
k[kN/m]10
20
30
40
40 arch length method
N0
model II
N0 = 181.52 kNNpl = 750 kN
v0 = 4.8 cm
Fig. 6.3. Normal force in the truss top chord vs. the out-of-plane displacement of truss (at midspan) for different stiffnesses of braces (model II)

6. Buckling of braced trusses 112
a) b)
0 0.05 0.1 0.15 0.2 0.25
α = kL0 / Pcr0
0.0
0.1
0.2
0.3
0.4
Plim
/ P
cr0
model I
model II
Pcr0 = 2490.87 kNL0 = 3 m
0 0.05 0.1 0.15 0.2 0.25
α = kL0 / Pcr0
0.0
0.1
0.2
0.3
0.4
Pcr
/ P
cr0
model I
model II
Pcr0 = 2490.87 kNL0 = 3 m
Fig. 6.4. The limit (a) and the critical (b) normal force in the truss top chord vs. bracing stiffness parameter α for two models of the truss
Fig. 6.5. Deformation at the limit state of the two models of the truss a) model I, b) model II
The stability analysis of the truss is also carried out. In the analysis a buckling load multiplier is found according to the method described in section 3.2. The critical loads for the two models in function of the braces stiffness are also determined. The differences in the buckling load of the two models of the truss are smaller than in the case of the non-linear static analysis, but for braces of higher stiffness the differences in the buckling loads are up to 30% (Fig. 6.4b).
Moreover, the relationship between the normal forces in the truss top chord, corre-sponding to the five buckling loads and the bracing stiffness parameter α are found (Fig. 6.6). The maximal magnitude of the first buckling load of the truss is equal to the magni-tude of the third buckling load of the truss without bracing. The minimal bracing stiffness required to obtain the maximal first buckling load is equal to about 27.25 kN/m (α = 0.0328).
The buckling mode corresponding to the first buckling load depends on the bracing stiff-ness. For a low stiffness of braces the buckling mode is the flexural–torsional truss deforma-tion in the out-of-plane direction in the form of one half-wave (Fig. 6.7a). For stiffer braces (k > 20.42 kN/m, α > 0.025) the buckling mode changes into two half-waves (Fig. 6.7b) and hence, at the threshold stiffness of bracing, the shape of buckling mode consist in the defor-mation of the truss top chord, the verticals and the diagonals in the truss plane (Fig. 6.7c).
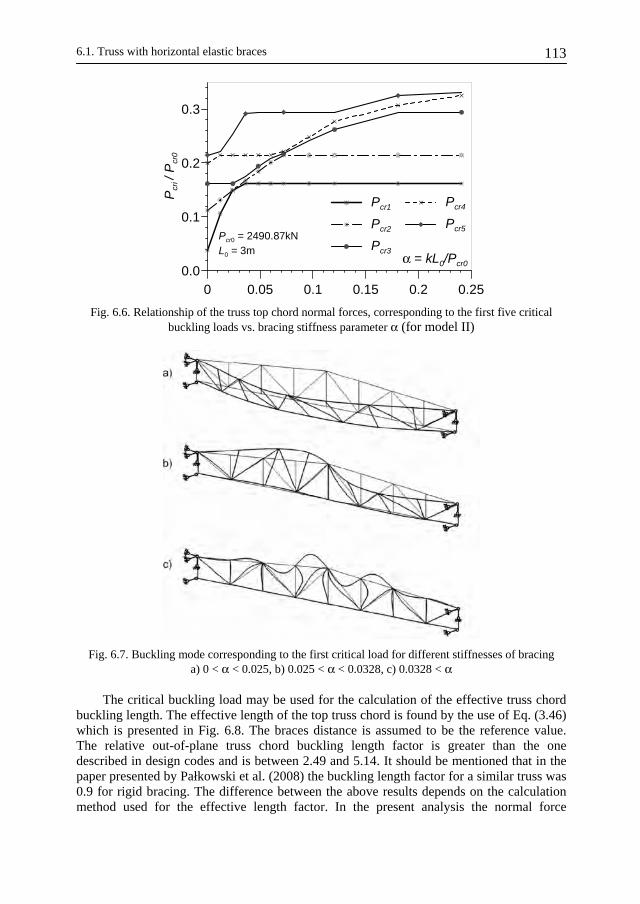
6.1. Truss with horizontal elastic braces 113
0 0.05 0.1 0.15 0.2 0.25
α = kL0/Pcr00.0
0.1
0.2
0.3
Pcr
i / P
cr0
Pcr1
Pcr2
Pcr3
Pcr4
Pcr5Pcr0 = 2490.87kNL0 = 3m
Fig. 6.6. Relationship of the truss top chord normal forces, corresponding to the first five critical buckling loads vs. bracing stiffness parameter α (for model II)
Fig. 6.7. Buckling mode corresponding to the first critical load for different stiffnesses of bracing a) 0 < α < 0.025, b) 0.025 < α < 0.0328, c) 0.0328 < α
The critical buckling load may be used for the calculation of the effective truss chord buckling length. The effective length of the top truss chord is found by the use of Eq. (3.46) which is presented in Fig. 6.8. The braces distance is assumed to be the reference value. The relative out-of-plane truss chord buckling length factor is greater than the one described in design codes and is between 2.49 and 5.14. It should be mentioned that in the paper presented by Pałkowski et al. (2008) the buckling length factor for a similar truss was 0.9 for rigid bracing. The difference between the above results depends on the calculation method used for the effective length factor. In the present analysis the normal force
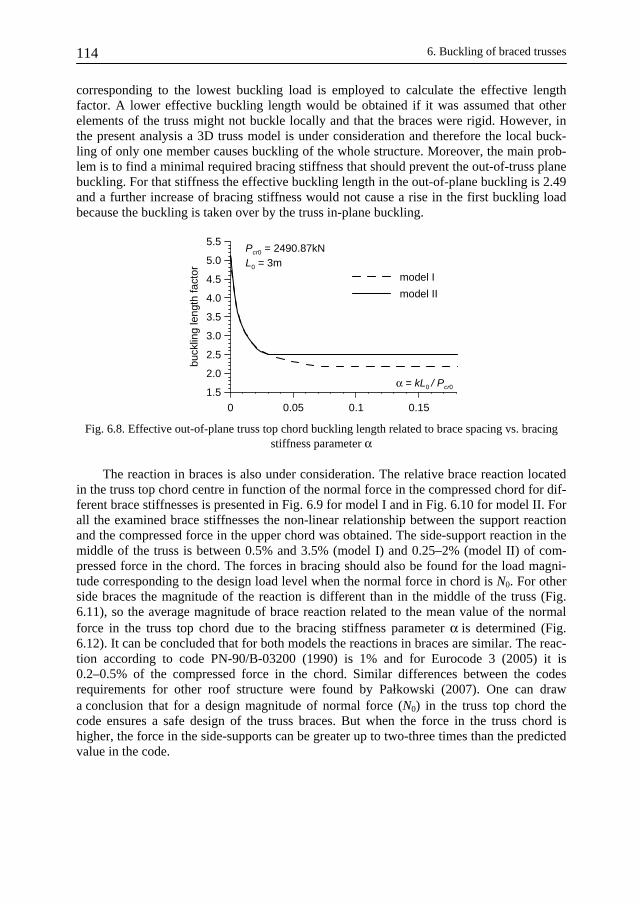
6. Buckling of braced trusses 114
corresponding to the lowest buckling load is employed to calculate the effective length factor. A lower effective buckling length would be obtained if it was assumed that other elements of the truss might not buckle locally and that the braces were rigid. However, in the present analysis a 3D truss model is under consideration and therefore the local buck-ling of only one member causes buckling of the whole structure. Moreover, the main prob-lem is to find a minimal required bracing stiffness that should prevent the out-of-truss plane buckling. For that stiffness the effective buckling length in the out-of-plane buckling is 2.49 and a further increase of bracing stiffness would not cause a rise in the first buckling load because the buckling is taken over by the truss in-plane buckling.
0 0.05 0.1 0.15
α = kL0 / Pcr01.5
2.0
2.5
3.0
3.5
4.0
4.5
5.0
5.5
buck
ling
leng
th fa
ctor model I
model II
Pcr0 = 2490.87kNL0 = 3m
Fig. 6.8. Effective out-of-plane truss top chord buckling length related to brace spacing vs. bracing stiffness parameter α
The reaction in braces is also under consideration. The relative brace reaction located in the truss top chord centre in function of the normal force in the compressed chord for dif-ferent brace stiffnesses is presented in Fig. 6.9 for model I and in Fig. 6.10 for model II. For all the examined brace stiffnesses the non-linear relationship between the support reaction and the compressed force in the upper chord was obtained. The side-support reaction in the middle of the truss is between 0.5% and 3.5% (model I) and 0.25–2% (model II) of com-pressed force in the chord. The forces in bracing should also be found for the load magni-tude corresponding to the design load level when the normal force in chord is N0. For other side braces the magnitude of the reaction is different than in the middle of the truss (Fig. 6.11), so the average magnitude of brace reaction related to the mean value of the normal force in the truss top chord due to the bracing stiffness parameter α is determined (Fig. 6.12). It can be concluded that for both models the reactions in braces are similar. The reac-tion according to code PN-90/B-03200 (1990) is 1% and for Eurocode 3 (2005) it is 0.2–0.5% of the compressed force in the chord. Similar differences between the codes requirements for other roof structure were found by Pałkowski (2007). One can draw a conclusion that for a design magnitude of normal force (N0) in the truss top chord the code ensures a safe design of the truss braces. But when the force in the truss chord is higher, the force in the side-supports can be greater up to two-three times than the predicted value in the code.
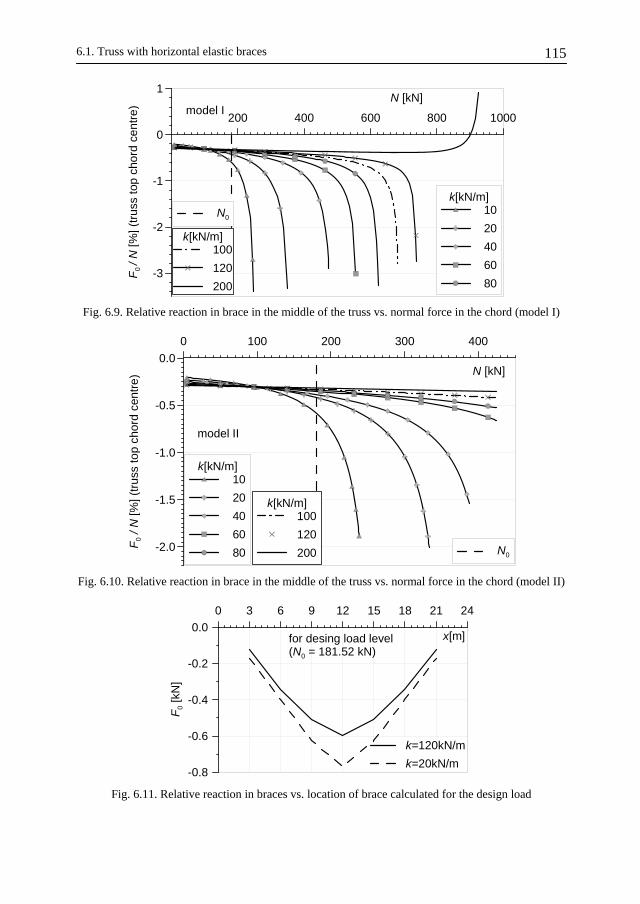
6.1. Truss with horizontal elastic braces 115
200 400 600 800 1000
N [kN]
-3
-2
-1
0
1
F0 / N
[%] (
trus
s to
p ch
ord
cent
re)
k[kN/m]100
120
200
k[kN/m] 10
20
40
60
80
N0
model I
Fig. 6.9. Relative reaction in brace in the middle of the truss vs. normal force in the chord (model I)
0 100 200 300 400
N [kN]
-2.0
-1.5
-1.0
-0.5
0.0
F0
/ N [%
] (tr
uss
top
chor
d ce
ntre
)
k[kN/m]100
120
200
k[kN/m] 10
20
40
60
80 N0
model II
Fig. 6.10. Relative reaction in brace in the middle of the truss vs. normal force in the chord (model II)
0 3 6 9 12 15 18 21 24
x[m]
-0.8
-0.6
-0.4
-0.2
0.0
F0
[kN
]
k=120kN/m
k=20kN/m
for desing load level (N0 = 181.52 kN)
Fig. 6.11. Relative reaction in braces vs. location of brace calculated for the design load
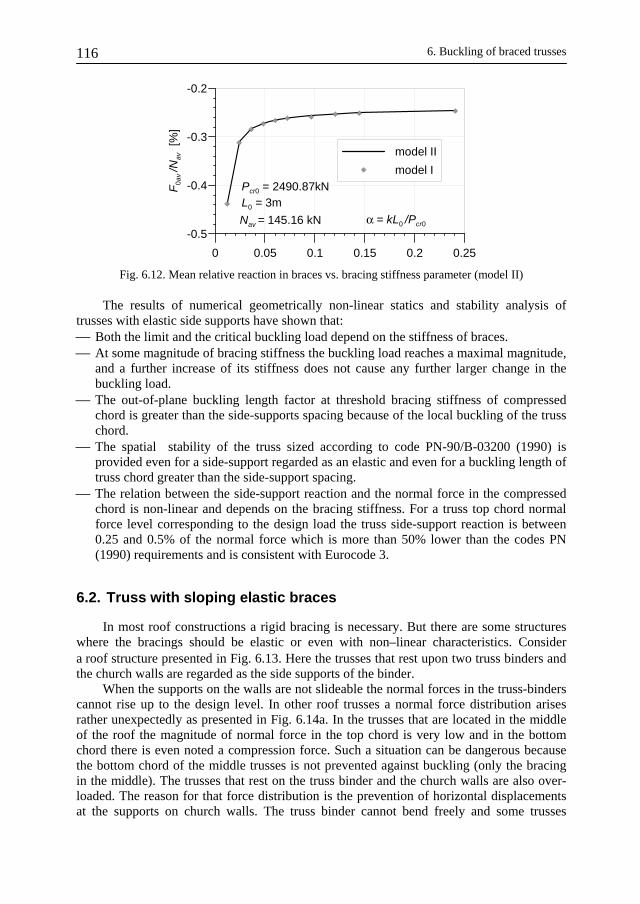
6. Buckling of braced trusses 116
0 0.05 0.1 0.15 0.2 0.25
α = kL0 /Pcr0
-0.5
-0.4
-0.3
-0.2
F0a
v /N
av [
%]
model II
model I
Nav = 145.16 kN
Pcr0 = 2490.87kNL0 = 3m
Fig. 6.12. Mean relative reaction in braces vs. bracing stiffness parameter (model II)
The results of numerical geometrically non-linear statics and stability analysis of trusses with elastic side supports have shown that: ⎯ Both the limit and the critical buckling load depend on the stiffness of braces. ⎯ At some magnitude of bracing stiffness the buckling load reaches a maximal magnitude,
and a further increase of its stiffness does not cause any further larger change in the buckling load.
⎯ The out-of-plane buckling length factor at threshold bracing stiffness of compressed chord is greater than the side-supports spacing because of the local buckling of the truss chord.
⎯ The spatial stability of the truss sized according to code PN-90/B-03200 (1990) is provided even for a side-support regarded as an elastic and even for a buckling length of truss chord greater than the side-support spacing.
⎯ The relation between the side-support reaction and the normal force in the compressed chord is non-linear and depends on the bracing stiffness. For a truss top chord normal force level corresponding to the design load the truss side-support reaction is between 0.25 and 0.5% of the normal force which is more than 50% lower than the codes PN (1990) requirements and is consistent with Eurocode 3.
6.2. Truss with sloping elastic braces
In most roof constructions a rigid bracing is necessary. But there are some structures where the bracings should be elastic or even with non–linear characteristics. Consider a roof structure presented in Fig. 6.13. Here the trusses that rest upon two truss binders and the church walls are regarded as the side supports of the binder.
When the supports on the walls are not slideable the normal forces in the truss-binders cannot rise up to the design level. In other roof trusses a normal force distribution arises rather unexpectedly as presented in Fig. 6.14a. In the trusses that are located in the middle of the roof the magnitude of normal force in the top chord is very low and in the bottom chord there is even noted a compression force. Such a situation can be dangerous because the bottom chord of the middle trusses is not prevented against buckling (only the bracing in the middle). The trusses that rest on the truss binder and the church walls are also over-loaded. The reason for that force distribution is the prevention of horizontal displacements at the supports on church walls. The truss binder cannot bend freely and some trusses

6.2. Truss with sloping elastic braces 117
become vertical supports of the binder instead of resting upon it. When the supports on the walls are slideable or flexible, the roof structure can bend as long as the truss binders participate in bearing the load of the roof. The forces in the truss binders are presented in Fig. 6.14b. When the truss supports on the walls are slideable, then there is a question if those trusses can still be regarded as side supports of the truss-binder and what stiffness of the side-supports is needed to provide stability of the truss binder against the out-of-plane buckling (see, Iwicki and Kin 2000, Iwicki and Krutul 2006).
Fig. 6.13. Roof construction (Iwicki and Krutul 2006)
A similar problem arises in all roof structures where the sloping bracing is designed to prevent the out-of-plane buckling of the main structural elements, because the rigid braces relieves the main bearing member and becomes overloaded itself. Since the problems of sloping bracing are also likely to occur in other roof structures it is important to study it in view of the stability of the main structural elements.

6. Buckling of braced trusses 118
a)
b)
Fig. 6.14. Normal force distribution in the roof trusses for two types of supports (Iwicki and Krutul 2006): a) horizontal supports not slideable, b) slideable horizontal supports
6.2.1. Description of the model
The truss under consideration is a truss binder of a real roof construction. The truss binder is similar to the one presented in Fig. 6.13. The binder length is 25 m, and its height is 1.5 m. For simplicity, all members in the same chord are made of the same profile. The com-pression chord consists of 2L 160×160×15. The tension chord is made of 2L 150×150×15. The diagonal members are made of U180 profiles. The binder is prevented against torsion at the supports. It is assumed that the loads are applied as concentrated forces to the top chord joints and their magnitude corresponds to the dead load of the roof structure together with the snow load (Fig. 6.15). The normal compression force in chord is N0 = 2194 kN. The truss is stiffened in the upper chord by elastic side-supports. The stiffness of braces is in the range from 0 up to 8000 kN/m. The side-supports are situated at angle α = 0°, 15°, 30°, 45° meas-ured from the horizontal line. The stiffness of supports approximated according to the relation presented in PN-90/B-03200 (1990) is about:

6.2. Truss with sloping elastic braces 119
0.01 2194 kN 0.01 2194 kN
351.04 kN/m 983.86 kN/m12.5 m 4.46 m
200 200
k× ×= < < = . (6.1)
The case with bilinear side-supports is also taken into account. The initial stiffness of sup-ports is 300 kN/m up to horizontal displacements 0.055 m, when the stiffness of supports increases to 5500 kN/m, which means that the support is not slideable (Fig. 6.16). This sup-port allows the roof structure to deflect as long as the truss binders participate in bearing the load of the roof. The truss binder is designed according to code PN-90/B-03200 (1990).
Fig. 6.15. Truss binder with sloping braces
Two models of the truss binder are considered. An assumption is made that the first model is ideal, with no imperfections. For that model the buckling load of the truss is searched for and the effective length factor of the truss top chord is calculated. Then, the model with imperfections shown in Fig. 6.17 is studied. In the present example the imper-fections in the form of horizontal loading are assumed. The horizontal concentrated forces perpendicular to the truss plane are located in the bottom truss chord and their magnitude is 0.53% of the resultant vertical forces. A non-linear large displacement analysis of truss was carried out by program ROBOT STRUCTURAL ANALYSIS PROFESSIONAL (2010). The spatial beam elements with six degrees of freedom in node were used to model the truss and a linear spring as a model of the side-supports. In the model 4 elements were taken along the truss members (diagonals, top chord between nodes) In the non-linear analysis the load control method was applied. The maximal load obtained from the large displacement analysis was taken as the limit load of the truss. By this analysis it was possi-ble to calculate the bracing reaction.

6. Buckling of braced trusses 120
0 1 2 3 4 5 6
x [cm]
0
10
20
30
40
50
N [k
N]
non-linear support
Fig. 6.16. Brace with non-linear characteristics
Fig. 6.17. The load imperfection applied to the truss binder with sloping braces
6.2.2. Results of the numerical simulation
Using the stability analysis of the truss binder it was possible to calculate the buckling load multiplier in function of the bracing stiffness and the angle measured from the horizontal plane. The relationship between the normal forces in the truss top chord corre-sponding to the four critical loads due to the bracing stiffness parameter α for different slopes of bracing are found (Figs 6.18, 6.19). The maximal magnitude of the first buckling load of the truss binder is equal to the magnitude of the third buckling load of the truss binder without bracing. The threshold stiffness of bracing able to provide the maximal buckling load depends on the slope of braces.

6.2. Truss with sloping elastic braces 121
0 0.2 0.4 0.6 0.8 1 1.2
α = kL0/Pcr00.0
0.1
0.2
0.3
0.4
0.5
0.6
Pcr
i / P
cr0
(φ=
450 )
Pcr1
Pcr2
Pcr3
Pcr4
L0 = 4.46 mPcr0 = 19292 kN
Fig. 6.18. Relationship of the truss top chord relative normal forces, corresponding to the first four critical buckling loads, vs. bracing stiffness parameter α for braces located at an angle of 45°
measured from the horizontal plane
0 0.2 0.4 0.6 0.8 1
α = kL0/Pcr0
0.0
0.1
0.2
0.3
0.4
0.5
0.6
Pcr
i / P
cr0 (φ
=30
0 )
Pcr1
Pcr2
Pcr3
Pcr4
L0 = 4.46 mPcr0 = 19292 kN
Fig. 6.19. Relationship of the truss top chord relative normal forces, corresponding to the first four critical buckling loads, vs. bracing stiffness parameter α for braces located at an angle of 30°
measured from the horizontal plane
The truss braced by side-supports located at a greater slope requires larger stiffness of bracing to provide a maximal buckling load (Fig. 6.20). The maximal relative buckling load for all the angles of bracing, except 45°, is equal to 0.433. For a slope of 45° the maximal relative buckling load is 0.44. It was assumed that the reference value was a buckling load of the column with the same profile as the truss top chord and a buckling length of L0 = 4.46 m, because in this section of the binder the normal force is maximal. The refer-ence force is 19292 kN. The minimal required stiffness of bracing is equal to about 1350kN/m (α = 0.31) for the truss with horizontal bracing, and 4300 kN/m (α = 0.99) for bracing located at angle of 45° (Fig. 6.21).
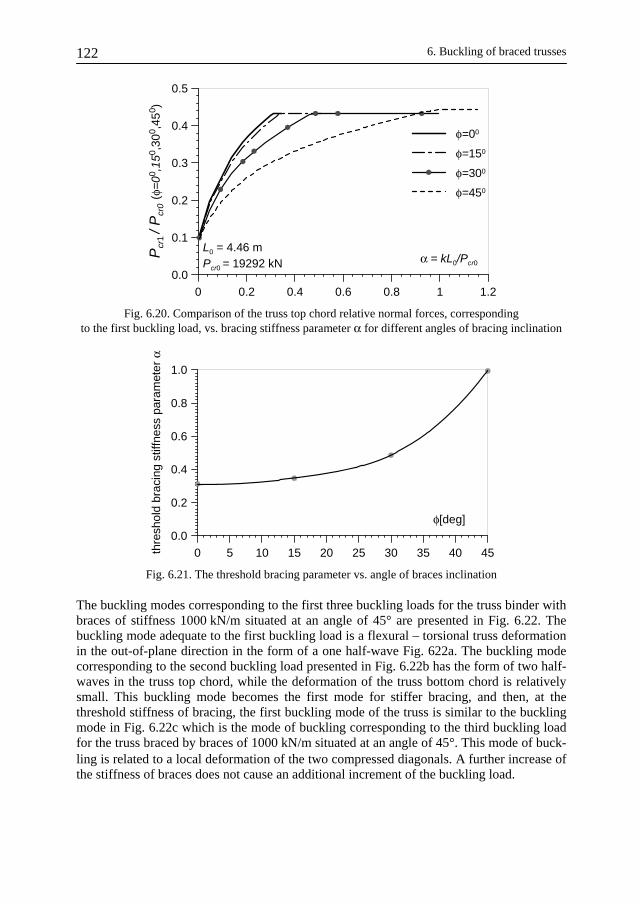
6. Buckling of braced trusses 122
0 0.2 0.4 0.6 0.8 1 1.2
α = kL0/Pcr0
0.0
0.1
0.2
0.3
0.4
0.5
Pcr
1 / P
cr0
(φ=0
0 ,15
0 ,30
0 ,45
0 )
φ=00
φ=150
φ=300
φ=450
L0 = 4.46 mPcr0 = 19292 kN
Fig. 6.20. Comparison of the truss top chord relative normal forces, corresponding to the first buckling load, vs. bracing stiffness parameter α for different angles of bracing inclination
0 5 10 15 20 25 30 35 40 45
φ[deg]0.0
0.2
0.4
0.6
0.8
1.0
thre
shol
d br
acin
g st
iffne
ss p
aram
eter
α
Fig. 6.21. The threshold bracing parameter vs. angle of braces inclination
The buckling modes corresponding to the first three buckling loads for the truss binder with braces of stiffness 1000 kN/m situated at an angle of 45° are presented in Fig. 6.22. The buckling mode adequate to the first buckling load is a flexural – torsional truss deformation in the out-of-plane direction in the form of a one half-wave Fig. 622a. The buckling mode corresponding to the second buckling load presented in Fig. 6.22b has the form of two half-waves in the truss top chord, while the deformation of the truss bottom chord is relatively small. This buckling mode becomes the first mode for stiffer bracing, and then, at the threshold stiffness of bracing, the first buckling mode of the truss is similar to the buckling mode in Fig. 6.22c which is the mode of buckling corresponding to the third buckling load for the truss braced by braces of 1000 kN/m situated at an angle of 45°. This mode of buck-ling is related to a local deformation of the two compressed diagonals. A further increase of the stiffness of braces does not cause an additional increment of the buckling load.

6.2. Truss with sloping elastic braces 123
a)
b)
c)
Fig. 6.22. Buckling modes corresponding to the first three critical loads for brace stiffness k = 1000kN/m (α = 0.2312, φ = 45°) a) first buckling mode, b) second buckling mode,
c) third buckling mode
The effective length factor of the truss top chord calculated by the use of Eq. (3.46) in function of the bracing stiffness for different bracing inclinations is presented in Fig. 6.23. In the threshold bracing condition the effective buckling length factor is 1.52 and 1.50 for bracing at an angle of 45°. The effective length increases with the rise of the bracing incli-nation (Fig. 6.24).
The results of the non-linear static analysis of the 3D truss model provide a basis to conclude that for all of the analysed stiffnesses and inclinations of braces the limit force of

6. Buckling of braced trusses 124
the truss is greater than the normal force caused by the static load of the roof (Fig. 6.25). For the truss-binder with a bracing situated at an angle of 300 the horizontal displacements corresponding to the design load are about 7.5 cm, and for the truss with braces at an inclination of 45° the horizontal displacement is over 13 cm, even for braces of greater stiffness. An increase of the bracing stiffness does not cause a significant decrease of the displacements.
0 0.2 0.4 0.6 0.8 1 1.2
α = kL0/Pcr0
1.4
1.5
1.6
1.7
1.8
1.9
2.0
μ (φ
=00 ,
150 ,
300 ,
450 )
φ=00
φ=150
φ=300
φ=450
L0 = 4.46 mPcr0 = 19292 kN
Fig. 6.23. The out-of-plane truss top chord effective length factor μ vs. bracing stiffness parameter α
0 5 10 15 20 25 30 35 40 45
φ [deg]
1.4
1.5
1.6
1.7
1.8
1.9
2.0
2.1
2.2
μ
α=0.138, k=600
α=0.1849, k=800
α=0.2774, k=1200
α=0.4524, k=2000
k [kN/m]
Fig. 6.24. The out-of-plane truss top chord effective length factor μ vs. angle of braces inclination for a different stiffness of braces
In order to reduce these displacement an additional bracing at a different angle should be applied. For other supports angles the load carrying condition is fulfilled at displacements in the out-of-plane direction smaller than 3.5 cm. This condition is also fulfilled for bilinear support characteristics (Fig. 6.16). This type of bracing allows the truss binders to bend in the vertical plane and to cooperate in bearing the load of the roof. Then the bracing stiffness increases and stabilises the truss binder against the out-of- plane truss buckling. In the case under consideration the elastic limit forces for truss with braces located at an inclination lower than 30° are greater compared with the plastic resistance of the truss top chord which is Npl = 2968.8 kN. From the non-linear analysis one can draw a conclusion
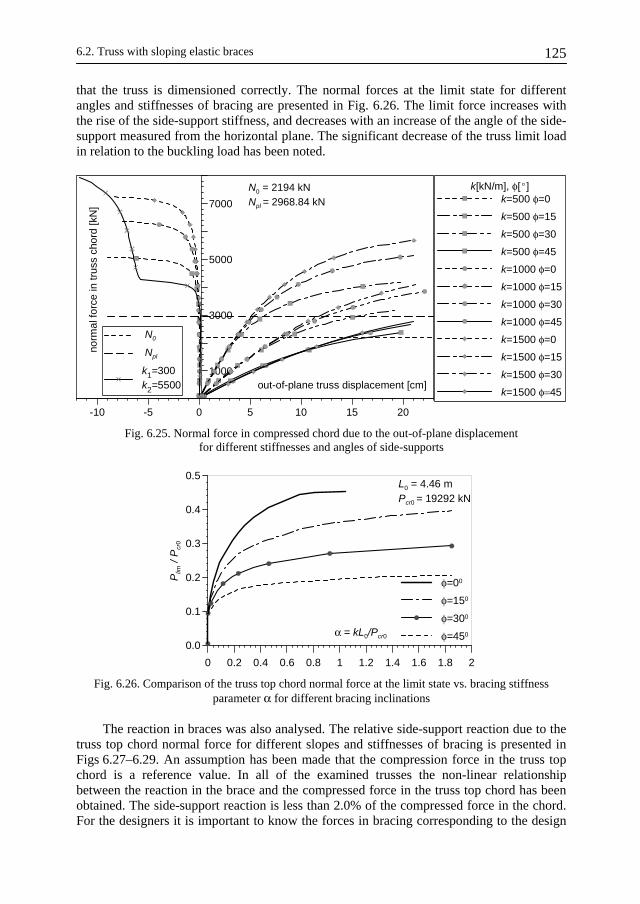
6.2. Truss with sloping elastic braces 125
that the truss is dimensioned correctly. The normal forces at the limit state for different angles and stiffnesses of bracing are presented in Fig. 6.26. The limit force increases with the rise of the side-support stiffness, and decreases with an increase of the angle of the side-support measured from the horizontal plane. The significant decrease of the truss limit load in relation to the buckling load has been noted.
-10 -5 0 5 10 15 20
out-of-plane truss displacement [cm]1000
3000
5000
7000
norm
al fo
rce
in tr
uss
chor
d [k
N]
N0
Npl
k1=300 k2=5500
k[kN/m], φ[ o ]k=500 φ=0
k=500 φ=15
k=500 φ=30
k=500 φ=45
k=1000 φ=0
k=1000 φ=15
k=1000 φ=30
k=1000 φ=45
k=1500 φ=0
k=1500 φ=15
k=1500 φ=30
k=1500 φ=45
N0 = 2194 kNNpl = 2968.84 kN
Fig. 6.25. Normal force in compressed chord due to the out-of-plane displacement for different stiffnesses and angles of side-supports
0 0.2 0.4 0.6 0.8 1 1.2 1.4 1.6 1.8 2
α = kL0/Pcr0
0.0
0.1
0.2
0.3
0.4
0.5
Plim
/ P
cr0
φ=00
φ=150
φ=300
φ=450
L0 = 4.46 mPcr0 = 19292 kN
Fig. 6.26. Comparison of the truss top chord normal force at the limit state vs. bracing stiffness parameter α for different bracing inclinations
The reaction in braces was also analysed. The relative side-support reaction due to the truss top chord normal force for different slopes and stiffnesses of bracing is presented in Figs 6.27–6.29. An assumption has been made that the compression force in the truss top chord is a reference value. In all of the examined trusses the non-linear relationship between the reaction in the brace and the compressed force in the truss top chord has been obtained. The side-support reaction is less than 2.0% of the compressed force in the chord. For the designers it is important to know the forces in bracing corresponding to the design

6. Buckling of braced trusses 126
load level. These forces are less than 0.43% of the corresponding normal forces in the truss top chord (Table 6.1).
0 1500 3000 4500 6000 7500
N [kN]
-1.5
-1.0
-0.5
0.0
0.5
1.0
1.5
F0
/ N [%
] (11
.62m
from
rig
ht s
uppo
rt) k[kN/m],φ[o]
φ=0
φ=15
φ=30
φ=45
N0
φ=0, k1=300,k2=5500
Npl
k=500
N0 = 2194 kNNpl = 2968.84 kN
Fig. 6.27. Relative brace reaction vs. normal force in truss top chord for bracing stiffness k = 500 kN/m and a different support angle, and for non-linear support characteristics
0 1500 3000 4500 6000
N [kN]
-2.0
-1.5
-1.0
-0.5
0.0
0.5
1.0
F0 / N
[%] (
11.6
2m fr
om r
ight
sup
port
) k[kN/m],φ[o]φ=0
φ=15
φ=30
φ=45
N0
Npl
k=1000
N0 = 2194 kNNpl = 2968.84 kN
Fig. 6.28. Relative brace reaction vs. normal force in truss top chord for bracing stiffness k = 1000 kN/m and a different support angle
The numerical results of the non-linear static and stability analysis of the truss with sloping elastic braces have shown that: ⎯ The effective length factor of the truss top chord for all stiffnesses and angles of braces
is greater than spacing of the braces. ⎯ The spatial stability of the truss sized according to code PN (1990) is provided even for
effective buckling length of truss chord greater than the braces spacing. ⎯ The relation between the reaction in braces and the normal force in the compressed truss
chord is non-linear. For a force level corresponding to the design load of the truss the reaction in braces is more that two times lower than the one described by code PN-90/B-03200 (1990), but for larger forces the reaction rises up to 2% of the normal force in a compressed chord.

6.2. Truss with sloping elastic braces 127
⎯ The side supports reaction increases with the rise of supports inclination measured from the horizontal plane. In this case the side-supports participates in bearing of the truss vertical load instead of stiffening the truss binder.
⎯ The implementation of non-linear side supports of the truss binder ensures the partici-pation of the roof load to be taken over by the binder and to provide spatial stability.
⎯ The threshold stiffness of bracing depends on the bracing angle and increases with gre-ater angles of braces inclination.
0 1500 3000 4500 6000
N [kN]
-2.0
-1.5
-1.0
-0.5
0.0
0.5
1.0
1.5
F0 / N
[%] (
11.6
2m fr
om r
ight
sup
port
) k[kN/m],φ[o]φ=0
φ=15
φ=30
φ=45
N0
Npl
k=1500
N0 = 2194 kNNpl = 2968.84 kN
Fig. 6.29. Relative brace reaction vs. normal force in truss top chord for bracing stiffness k = 1500 kN/m and a different support angle
Table 6.1
The reaction in brace (at distance x = 11.62 m from the right support) related to the truss top chord normal force corresponding to the design load level for different brace stiffnesses
k [kN/m] α F0/N0 [%] (φ = 45±)
F0/N0 [%] (φ = 30±)
F0/N0 [%] (φ = 15±)
F0/N0 [%] (φ = 0±)
0500 0.116 –0.376 –0.205 –0.105 –0.017
1000 0.231 –0.382 –0.224 –0.114 –0.013
1500 0.347 –0.434 –0.269 –0.135 –0.009
6.3. Truss with lateral and torsional braces
In the present section the lateral buckling of truss with lateral and torsional braces is analysed. The lateral braces such as purlins, corrugated decking, wall rails or bridging ele-ments are side-supports of trusses. These elements, apart from bearing the vertical load, are part of the bracing system, which stabilises the roof trusses against distortional buckling. The above mentioned elements can be modelled as linear, and depending on stiffness of connections, as rotational elastic springs. The rotational elastic springs are responsible for the interaction between the purlins bending and the truss torsion, and therefore are called torsional braces. The linear springs model the horizontal truss bracing.
The worked example includes: ⎯ an analysis of the limit and buckling loads of a truss due to the stiffness of the above
described braces,

6. Buckling of braced trusses 128
⎯ the brace reaction in relation to the force in the truss compressed chord and the effective buckling length related to the distance of braces,
⎯ the stability and non-linear static analysis of the 3D truss model compared with a similar analysis of the truss top chord model, resting on diagonals and verticals that are assumed to be vertical supports, and on the braces that are side-supports and rotatio-nal supports,
⎯ the results of the stability analysis of the described above models are compared with similar results of the Winter-type model of the truss top chord with fictitious hinges being introduced at braces connections .
The described in this section parametrical analysis of a truss braced by lateral and torsional braces is a continuation of some previously published studies by Iwicki (2008b). In the present research some new aspects have been added. The 3D truss stability analysis is com-pared with the Winter-type model of the truss chord. Relations between the buckling and limit loads and the bracing stiffness are determined. In the present analysis the effective length factor is set with better accuracy especially for bracing of higher stiffnesses. This is due to some more precise discrete models (see comments in Section 6.1). The average reac-tion in lateral and torsional braces is found.
6.3.1. Torsional brace
The deformation of truss is interrelated with deformations of purlins, wall rails or bridging elements, resting on the truss. On the assumption that connectors between those elements and the truss are stiff enough and are able to carry arising forces the rotation of purlins is interrelated with torsion of truss as presented in Fig. 6.30. Then the stiffness of torsional brace of the truss can be estimated as 2EJbr/Lbr for symmetrical deformation of one bay purlin or as 6EJbr/Lbr in the case of a middle support of two spans simply supported purlin
0 2 6 = br br
br br
Mk
EJ EJ
L LΘ = ÷Θ
(6.2)
Fig. 6.30. Truss-purlin system
6.3.2. Description of the model
In the present parametric study the roof truss illustrated in Fig. 6.31 is considered. The height of the truss in the middle is 1.61 m, and 0.9 m near the supports. The compression chord consists of 2L 90×90×9, the tension chord is made of 2L 80×80×8 rolled profiles.
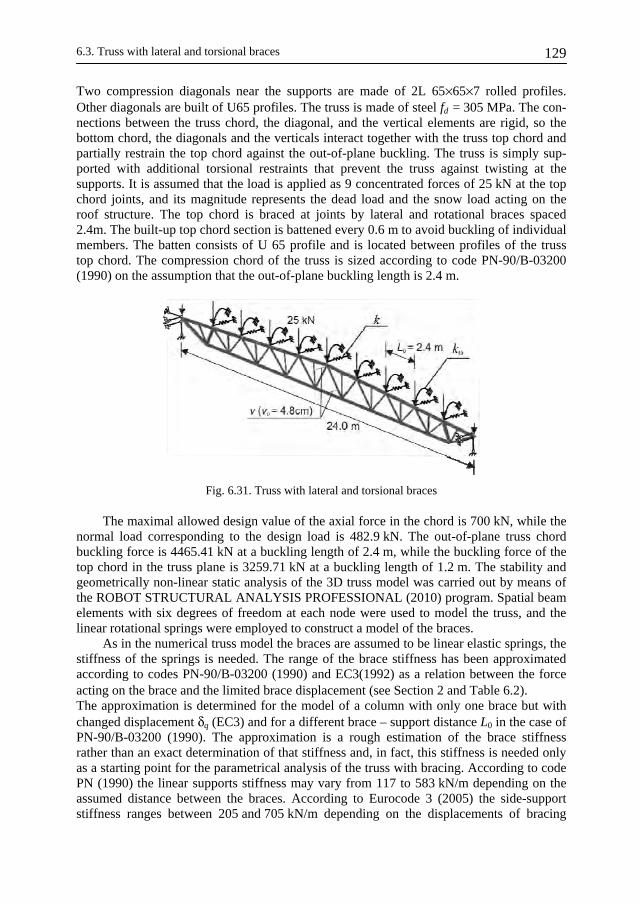
6.3. Truss with lateral and torsional braces 129
Two compression diagonals near the supports are made of 2L 65×65×7 rolled profiles. Other diagonals are built of U65 profiles. The truss is made of steel fd = 305 MPa. The con-nections between the truss chord, the diagonal, and the vertical elements are rigid, so the bottom chord, the diagonals and the verticals interact together with the truss top chord and partially restrain the top chord against the out-of-plane buckling. The truss is simply sup-ported with additional torsional restraints that prevent the truss against twisting at the supports. It is assumed that the load is applied as 9 concentrated forces of 25 kN at the top chord joints, and its magnitude represents the dead load and the snow load acting on the roof structure. The top chord is braced at joints by lateral and rotational braces spaced 2.4m. The built-up top chord section is battened every 0.6 m to avoid buckling of individual members. The batten consists of U 65 profile and is located between profiles of the truss top chord. The compression chord of the truss is sized according to code PN-90/B-03200 (1990) on the assumption that the out-of-plane buckling length is 2.4 m.
Fig. 6.31. Truss with lateral and torsional braces
The maximal allowed design value of the axial force in the chord is 700 kN, while the normal load corresponding to the design load is 482.9 kN. The out-of-plane truss chord buckling force is 4465.41 kN at a buckling length of 2.4 m, while the buckling force of the top chord in the truss plane is 3259.71 kN at a buckling length of 1.2 m. The stability and geometrically non-linear static analysis of the 3D truss model was carried out by means of the ROBOT STRUCTURAL ANALYSIS PROFESSIONAL (2010) program. Spatial beam elements with six degrees of freedom at each node were used to model the truss, and the linear rotational springs were employed to construct a model of the braces.
As in the numerical truss model the braces are assumed to be linear elastic springs, the stiffness of the springs is needed. The range of the brace stiffness has been approximated according to codes PN-90/B-03200 (1990) and EC3(1992) as a relation between the force acting on the brace and the limited brace displacement (see Section 2 and Table 6.2). The approximation is determined for the model of a column with only one brace but with changed displacement δq (EC3) and for a different brace – support distance L0 in the case of PN-90/B-03200 (1990). The approximation is a rough estimation of the brace stiffness rather than an exact determination of that stiffness and, in fact, this stiffness is needed only as a starting point for the parametrical analysis of the truss with bracing. According to code PN (1990) the linear supports stiffness may vary from 117 to 583 kN/m depending on the assumed distance between the braces. According to Eurocode 3 (2005) the side-support stiffness ranges between 205 and 705 kN/m depending on the displacements of bracing

6. Buckling of braced trusses 130
caused by the stabilising load. An equivalent stabilising force that the bracing should resist is according to Eurocode 3(2005) about 0.2–0.4% of the maximal design normal force in the truss top chord, and 1% of that force according to PN-90/B-03200 (1990). It is assumed that the stiffness of torsional braces is 20 kNm/deg (1145 kNm/rad). This stiffness has been estimated on the assumption that the purlin is a continuous beam with a 6 m long span, de-signed for a standard roof loading and that the connections between the purlin and the trusses are rigid. A case without lateral braces, and only with torsional braces of stiffness 5, 10, 50, 100 kNm/deg is also considered. The results of the 3D truss nonlinear analysis are compared with the stability analysis of an isolated truss top chord resting on vertical sup-ports placed at diagonals and verticals and the side-supports at braces. (Fig. 6.32). The plas-tic resistance to normal force of the compressed truss chord is 945 kN.
Table 6.2
Approximation of lateral and torsional brace stiffness according to codes PN-90/B-03200 (1990) and Eurocode 3 (1992) (Eq.(2.3))
N = 700kN Eurocode 3
δq [m] α q [kN/m] q
Lqk
δ2/×= [kN/m]
0.010 0.21 0.59 705
0.015 0.31 0.64 510
0.020 0.42 0.69 413
0.025 0.52 0.74 355
0.030 0.63 0.79 316
0.035 0.73 0.84 288
0.040 0.83 0.89 267
0.045 0.94 0.94 251
0.050 1.04 0.99 238
0.055 1.15 1.04 228
0.060 1.25 1.09 219
0.065 1.35 1.14 211
0.070 1.46 1.20 205
PN-90/B-03200 [kN/m]
L0 L0 /200 200/
01.0
0L
Nk
×= [kN/m]
2.4 0.012 583 4.8 0.024 292 7.2 0.036 194 9.6 0.048 146
12.0 0.060 117

6.3. Truss with lateral and torsional braces 131
Fig. 6.32. Truss chord with linear and rotational elastic side- supports
Next the top truss chord is analysed according to the Winter (1958) method. Some fictitious hinges at the brace joints were introduced and the compression force was assumed to be constant along the chord. The diagonals were used to be vertical supports of the chord and the diagonals and the tension chord were assumed to have no influence on the stabiliza-tion of the compressed chord against the out-of-plane truss buckling (Fig. 6.33). The truss in this model was regarded as horizontal.
Fig. 6.33. The Winter fictitious hinge model for the truss chord with bracing
The non-linear large displacement analysis of truss was carried out using the program ROBOT STRUCTURAL ANALYSIS PROFESSIONAL (2010). The limit load of truss is found in the non-linear static analysis by means of the load control method. Both the mag-nitude and the shape of the initial imperfection affect the limit load of truss. It was assumed that the top and the bottom truss chord were bent in the out-of-plane truss direction, and the maximal horizontal imperfection was L/500 (v0 = 4.8 cm). The shape of imperfection is a poly-line with nodes located on a parabola that has opposite values in the top and the bottom truss chord.
6.3.3. Results of numerical simulations
For different stiffnesses of the side-supports a non-linear relation between the normal force in the compressed chord due to the out-of- plane truss displacement has been obtained (Fig. 6.34). The limit normal force increases with an increase of the bracing stiffness. For all the considered stiffnesses of the lateral braces, except 50 kN/m, the limit normal force of the truss chord is greater than the design value of the normal force. Comparing the truss with the lateral and torsional braces and the truss only with the lateral braces one can draw a conclusion that additional torsional braces are responsible for an approximate 77% increase of the limit normal force for supports of stiffness 50 kN/m, and about 20% for sup-ports of stiffness 1000 kN/m. The braces of a sufficient stiffness should also reduce the out-of-plane displacements at the serviceability limit state. For braces of the stiffness amounting to 100 kN/m the out-of-plane displacements corresponding to the design value

6. Buckling of braced trusses 132
of the normal force are less than L/200. For supports of a higher stiffness the displacements are less than L/1000. In the case of the lateral braces of stiffness 100 kN/m and the rota-tional stiffness of 20 kNm/deg the out-of-plane displacements for a design value of normal force are less than L/700.
-20 -15 -10 -5 0 5
displacement v [cm]0
500
1000
1500
2000
2500
norm
al fo
rce
in c
ompr
esse
d ch
ord
[kN
]
k [kN/m]50
100
200
300
400
500
1000
k [kN/m];kΘ [kNm/deg]
50; 20
100; 20
200; 20
300; 20
400; 20
500; 20
1000; 20
300; 20 *)
Npl = 945 kNv0 = 4.8 cm*) arch length method
Fig. 6.34. Normal force in the compressed chord of truss due to the out-of-plane displacement for different stiffnesses of braces
The truss deformation corresponding to the limit state is presented in Fig. 6.35. For lateral braces of stiffnesses up to about 340 kN/m there are three half-waves and for higher brace stiffnesses there appear five half-waves in the deformation of the truss top chord. It is worth noting that for braces of stiffnesses greater than 340 kN/m the displacements of the bottom chord are greater than the ones in the top chord. Therefore instead of an additional increase of braces stiffness in the top chord a localization of braces in the bottom chord could be considered.
30 < k < 340 k > 340
Fig. 6.35. Horizontal projection of the truss deformation corresponding to limit load
The Winter model of the truss top chord consists of a column side-supported by braces in fictitious hinges at the brace joints. As a consequence of location of the fictitious hinges in the chord the significance of braces increases and therefore the buckling load calculated in the Winter-type model is expected to be a safe lower limit of the truss buckling load.

6.3. Truss with lateral and torsional braces 133
The relation between the bracing stiffness and the buckling load according to the Winter model can be presented as a poly-line that is a lower bound of construction lines. These construction lines are obtained as lines between the starting points that describe the critical force at zero brace stiffness for the column without fictitious hinges and the end-points that are described by the bracing stiffness when the maximal buckling load is reached for the Winter model (see section 2). Such construction lines are found for the first nine buckling modes because it has been found that only the first nine buckling modes indicate displace-ments at the bracing joints. For that reason only the first nine critical buckling loads are sensitive to the changes of the bracing stiffness. All lines are related to the buckling load of the column length equal to brace spacing Pcr0 = 4465 kN (Fig. 6.36).
0 1 2 3 4
α = kL0 /Pcr00.00
0.25
0.50
0.75
1.00
Pcr
/ P
cr0
Winter model
construction lines
Fig. 6.36. Relation between the relative critical force and the coefficient of the required bracing stiffness for the Winter model
0 1 2 3 4
α = kL0/Pcr0
0.0
0.2
0.4
0.6
0.8
1.0
Pcr
/ P
cr0
truss chord - k, kΘ
truss chord - k
3D truss - k kΘ
3D truss - k
Winter model
L0 = 2.4 mPcr0= 4465 kN/m
Fig. 6.37. Relation between the relative critical force and the coefficient of bracing stiffness for the Winter model, the truss chord and the 3D truss
The relation between the buckling load and the bracing stiffness found by means of the Winter model is compared with the results calculated for the 3D truss model with lateral and torsional braces, and with the model of the truss chord separated from the whole struc-ture (Fig. 6.37). This relation obtained for the Winter model is also compared with the rela-tion between the limit normal force in the compressed chord and the bracing stiffness

6. Buckling of braced trusses 134
(Fig. 6.38). The Winter model of the truss compressed chord used to determine the relation between the buckling load and the bracing stiffness does not provide a safe result for the whole range of the bracing stiffnesses. In the case of an isolated truss chord with rotational and linear supports the Winter model gives a safe result for coefficient α lower than 1.5. In the case of the 3D truss analysis the Winter model is secure only for bracing stiffnesses up to about α < 0.6. The buckling loads found for the truss top chord model (Fig. 6.32) with only lateral braces (k) are lower than for similar Winter type model (for the same bracing sfiffness). It may be caused by the difference in the normal force distribution (in Winter model N = const, in the truss top chord model N is variable along the length).
0 1 2 3 4α0.0
0.2
0.4
0.6
0.8
1.0
Plim
/ P
cr0
3D - k (non-linear analysis)
3D - k, kΘ (non-linear analysis)
Winter model
L0 = 2.4 mPcr0 = 4465 kN/m
Fig. 6.38. Relation between the relative critical force and the coefficient of the bracing stiffness for the Winter model and a 3D truss
-120 -100 -80 -60 -40 -20 0
displacement v [cm]
0
100
200
300
400
500no
rmal
forc
e in
com
pres
sed
chor
d [k
N]
kΘ [kNm/deg]kΘ = 5
kΘ = 10
kΘ = 50
kΘ = 100k = 0 kN/mv0= 4.8cm
Fig. 6.39. Normal force in the truss top chord vs. the out-of-plane displacement for different stiffnesses of torsional braces
In this case of the truss only with the torsional braces the limit normal force is between 40% and 60% of the design value of a normal force (Fig. 6.39). It is worth noting that there is no significant difference between the force-displacement relation for torsional stiffness

6.3. Truss with lateral and torsional braces 135
braces 50 kNm/deg and 100 kNm/deg and that the difference in the limit truss load with torsional braces of stiffness 5 and 10 kNm/deg is about 15%.
The effective buckling length of the truss chord is also analysed. The normal forces, corresponding to the buckling loads, for the models without imperfections made it possible to calculate the effective buckling length of the truss top chord (Eq. (3.46)). The buckling length factor is presented in (Fig. 6.40).
a) b)
0 0.5 1 1.5 2 2.5 3
α =kL0 /Pcr0
1.0
1.5
2.0
2.5
3.0μ Winter model
truss chord - k
truss chord - k, kΘ
L0= 2.4 mkΘ= 20 kNm/deg
0 0.5 1 1.5 2 2.5 3
α =kL0 /Pcr0
1.0
1.5
2.0
2.5
3.0μ Winter model
3D truss - k
3D truss - k, kΘ
L0= 2.4 mkΘ= 20 kNm/deg
Fig. 6.40. Buckling length factor μ vs. bracing stiffness parameter for the 3D truss, the truss chord and for the Winter model
For all the bracing stiffnesses the buckling length factor is greater than one, that is a value of the buckling length factor described in the codes. In the case of an isolated truss chord or the 3D truss model only with the lateral braces, the buckling length factor is greater than the calculated one according to the Winter model. Even for rigid side bracing the buckling length factor of the truss chord for an isolated truss chord model is 1.14. An additional increase of the stiffness of braces does not cause a rise of the buckling load for the reason that the chord buckles in the truss plane.
The reactions in braces were also under consideration. The reactions, in the brace located in the middle of the truss, related to normal force in the truss compressed chord for different side-support stiffnesses are presented in Fig. 6.41. In all the examined braces stiff-nesses a non-linear relationship between the reaction in braces and the compression force in the upper chord was obtained. The reaction in braces in the middle of the truss ranged between 0,11% and 1,54% of the design value of the normal force in the chord depending on the stiffness of support.
In other lateral braces the relation between the brace reaction and the normal force in the truss is different than in the middle of the truss, because this reaction corresponds to the deformation of the top chord of the truss. From a practical point of view it is therefore im-portant to know the average force in braces. That force in relation to an actual normal force in the truss chord at each lateral brace due to the bracing stiffness parameter is presented in Fig. 6.42. As there are discontinuities in the truss top chord normal forces, the reaction in the braces are related to the higher normal force magnitude (a) or to mean magnitude of the chord normal forces at the brace joints (b). The average force in bracing is lower than 0.4% of the normal force in the truss chord, and even less than 0.18% for the support of stiffness described by α > 0.2 (k > 370kN/m). The average force in the lateral braces was calculated for the design load level of the truss.

6. Buckling of braced trusses 136
0 500 1000 1500 2000 2500normal force in compressed chord [kN]
-2.5
-2.0
-1.5
-1.0
-0.5
0.0
0.5
1.0
1.5
2.0
2.5
F0 / N
[%]
k [kN/m]100
200
300
400
500
1000
k [kN/m];kΘ [kNm/deg]
50;20
100; 20
200; 20
300; 20
Npl = 945 kN
300;20
400;20
500;20
1000;20
Fig. 6.41. Relative reaction in the middle of the truss top chord brace due to normal force in the chord for different brace stiffnesses
0 0.2 0.4 0.6 0.8 1 1.2
α=kL0 /Pcr0
0.10
0.15
0.20
0.25
0.30
0.35
0.40
0.45
aver
age
reac
tion
in b
race
s (F
0/N
) [%
]
(a) 3D truss - k
(a) 3D truss - k, kΘ
(b) 3D truss - k
(b) 3D truss - k, kΘ
kΘ = 20 kNm/deg
Fig. 6.42. Relative average reaction in lateral braces vs. bracing stiffness parameter for the design load level
The relation between the moment in the torsional brace in the middle of the truss and the normal force in the compressed chord is also nonlinear (Fig. 6.43). For allowable design valuees of the truss load the moment in the torsional brace is between 0.2–1.96 kNm, only for a lateral brace of stiffness 50 kN/m the moment magnitude is higher and is equal to 4.16 kNm. For a higher load level the moment rises up to 10–20 kNm, but then the normal force in the compressed chord is greater than the plastic resistance of the chord. Since the moment in the torsional braces depends on the torsion of the truss top chord, this relation is different for different braces.

6.3. Truss with lateral and torsional braces 137
0 500 1000 1500 2000 2500
normal force in compressed chord [kN]
-25
-20
-15
-10
-5
0
5
10
15
20
25
mom
ent i
n to
rsio
nal b
race
[kN
m]
k [kN/m];kΘ [kNm/deg]
50;20
100; 20
200; 20
300; 20
k [kN/m];kΘ [kNm/deg]
400;20
500;20
1000;20
Npl = 945 kN
Fig. 6.43. Moment in the torsional brace in the middle of the truss top chord vs. normal force in compressed chord for different brace stiffnesses
Therefore the relation between the average moment in bracing related to the design moment of purlins, due to the coefficient of bracing stiffness was calculated (Fig. 6.44). The magni-tude of the moment in a 6m long purlin caused by a typical dead load and snow load acting on the roof structure is about M0 = 18.75 kNm. The relation presented in Fig. 6.44 was calculated for the design load level. It can be concluded that the moment in torsional braces is less than 2.8% of design moment of purlin and a connection should be designed to resist that moment. One can also conclude that it is possible to consider the purlins to be the torsional braces of the truss on condition that the connectors between the purlins and the truss are designed to carry an arising moment.
0 0.2 0.4 0.6 0.8 1 1.2
α=kL0/Pcr0
0.5
1.0
1.5
2.0
2.5
3.0
rela
tive
aver
age
mom
ent i
n br
aces
M
Θav
/ M
0 [%
]
3D truss - k, kΘ
kΘ = 20 kNm/degL0 =2.4 mPcr0= 4465 kNM0=18 kNm
Fig. 6.44. Relative average moment in torsional brace due to bracing stiffness parameter for the design load level
The boundary condition concerning the torsional restraints at the supports has also been verified. In order to verify the assumption that the bolts at the supports can be regarded as a torsional restraint, the support reaction obtained for the design load level was calculated (Fig. 6.45). The level of that moment made it possible to conclude that the assumed restraint was correct.

6. Buckling of braced trusses 138
0 0.2 0.4 0.6 0.8 1 1.2
α=kL0/Pcr0
0.0
0.5
1.0
1.5
2.0
2.5
3.0
aver
age
mom
ent a
t end
sup
port
s [k
Nm
]
3D truss - k
3D truss - k, kΘ
kΘ = 20 kNm/degL0 = 2.4 mPcr0= 4465 kN
Fig. 6.45. Average reaction in the truss supports due to coefficient of bracing stiffness for the design load level
The results of the conducted analysis of the truss with lateral and torsional braces have proved that: ⎯ The limit load of truss increases with an increase of the brace stiffness. ⎯ The simplified Winter model of the truss top chord used to determine the required bra-
cing stiffness for an assumed buckling load does not guarantee that a safe lower limit of bracing stiffnesses for the whole range of buckling load can be obtained.
⎯ The difference between the Winter model and other analysed models is greater for larger bracing stiffnesses. The difference in buckling loads found using the Winter model and the 3D truss models may be explained in terms of diagonals buckling at a certain bracing stiffness. This means that at some (threshold) bracing stiffness the buckling of most loaded diagonals occurs and a further increase of the bracing stiffness does not cause a rise in the truss buckling load. All elements of the truss are interrelated and therefore it is not possible to take into account only the positive effect of such mem-bers, as diagonals and verticals in reduction of the effective buckling length of the truss chord, and to neglect the risk of buckling of those members.
⎯ The buckling length of the truss top chord is greater than the distance of the braces. So code requirements are not precise and in fact predict higher buckling loads in compres-sed chords than the ones obtained by calculations.
⎯ Buckling length factor calculated for the truss chord modelled as an isolated member resting on elastic braces is higher than those found in the 3D truss model up to α < 1.1, then for α > 1.1 the buckling length factor for an isolated truss model is lower than for the 3D one.
⎯ A reduction of the buckling length in the 3D truss analysis (for α < 1.1) results from a positive influence of verticals, diagonals and the tension chord in stiffening the com-pressed chord of the truss. The relation between the brace reaction and the normal force in the compressed chord is non-linear.
⎯ In the examined truss example with both lateral and torsional braces the limit normal force in the truss chord is 20–70% greater than in the case without rotational springs.
⎯ The average lateral brace reaction corresponding to the design load of the truss is about two times lower than described by code PN-90/B-03200 (1990) and is comparable with the brace reaction described by Eurocode 3 (1992).
⎯ The moment in the rotational supports is lower than 2.5% of the bending design moment of purlins, caused be typical gravity loads, so it is possible to consider purlins as the rotational supports of the truss.

6.4. Truss with braces placed in top and bottom chord 139
6.4. Truss with braces placed in top and bottom chord
The next example is devoted to a study of the out-of-plane buckling of truss purlins under upward wind load. The purlin is supported by linear elastic braces located in the top and bottom truss chords. The stability of the bottom chord is considered. The critical load of the truss purlin for different bracing stiffnesses is calculated. It is assumed that the stiffness in the top and bottom chord may vary. In a real structure these stiffnesses are inter-related because the bottom truss chord stiffness is usually connected to the roof plane. A geometrically non-linear static analysis and a stability analysis of the 3D truss model are carried out. The reaction in the bottom chord brace in function of force in the compressed chord and the buckling length are calculated. In light weight constructions the influence of upward wind loading may be quite significant and may cause compression in the truss purlin bottom chord. However, the truss bottom chord is, in general, not designed for such loading and therefore is not always stabilized by bracing. The force needed to stabilize the bottom truss chord is not anticipated in codes either. There is no information about a required bracing stiffness. An effective buckling length of the bottom truss chord when the chord is not horizontal, as in the worked example given below, is not predicted in codes either. All of above mentioned problems cause difficulties in the design. An observed fail-ure of truss purlins under wind load presented in Fig. 6.46 confirms that the problem exists (Hotała et al. 2007). The truss under consideration is exactly the same as the one described first by Hotała et al. (2007) where a damage under upward wind loading is reported. The non-linear static and linear stability analysis of the truss was also performed by Iwicki (2008c).
Fig. 6.46. Failure of truss purlins caused by wind load (Hotała et al. 2007)

6. Buckling of braced trusses 140
6.4.1. Description of the model
In the present parametric study a roof truss purlin shown in Fig. 6.46 and in Fig. 6.47 is considered. The height of the truss is 0.8 m. The top truss chord consists of C120, and the bottom chord is made of C65. Two diagonals (or bottom chord elements) near the supports are made of 2L 50×50×6 profiles. The built-up section is battened by means of three battens. The diagonals near the supports are made of L 50×50×6 profiles, and other diago-nals are of L 45×45×5. In the numerical model the connections between the truss elements are rigid. It is assumed that the loads are applied as concentrated forces in the truss top chord joints. The top chord is laterally braced in joints by lateral braces of stiffness between 0-50 kN/m. The case with rigid side braces and the truss with bracing located in the bottom chord are also considered. In the 3D model of truss, rotational supports that prevent torsion of the truss at supports are implemented.
Two models of the truss were analysed. In the first model (I) the built-up section of the bottom truss chord is modelled as a member of cross-section of 2L 50×50×6, so in this model a member may be considered to be battened along its length. In the second model (II) the member is modelled as two parallel members of sections 50×50×6 without battens. In the geometrically non-linear analysis, imperfections in the form of horizontal forces located in the truss joints (W1) in the direction perpendicular to the truss plane are assumed. In order to find a lower limit load the imperfection forces equal to 0.03 kN are symmetrical or asymmetrical depending on the stiffness of brace in the middle of the bottom chord. For a lower stiffness of bracing the imperfection is symmetrical and for a higher bracing stiffness (greater than 30 kN/m), the imperfection is asymmetrical. In the discrete numerical model used for the truss stability analysis the truss elements (between joints) are divided into four finite elements in order to improve the precision of the results.
Fig. 6.47. Truss purlin (Hotała et al. 2007)

6.4. Truss with braces placed in top and bottom chord 141
6.4.2. Results of numerical simulations
The buckling load and appropriate normal forces for the perfect model of the truss purlin are calculated. The numerical analysis is conducted by means of program ROBOT STRUCTURAL ANALYSIS PROFESSIONAL (2010). The truss buckling load increases with a rise in the bracing stiffness. The relative normal force in the truss bottom chord, cor-responding to the buckling load, due to bracing stiffness parameter α is presented in Fig. 6.48 for model I and in Fig. 6.49 for model II. The critical force for the simply supported member of length L0 = 6 m, and the same cross-section as in the truss purlin bottom chord, was assumed to be the reference force.
0 1 2 3 4 5 6 7 8 9 10
α=kbottom L0 / Pcr0 2.0
2.5
3.0
3.5
4.0
Pcr /
Pcr
0
ktop [kN/m]0
10
20
30
∞
model I
L0 = 6 mPcr0 = 32.32 kN
Fig. 6.48. Relative normal force in the truss bottom chord, corresponding to the buckling load vs. brace stiffness parameter α (model I)
0 1 2 3 4 5 6 7 8 9 10 11 12 13 14
α=kbottom L0 / Pcr0 2.0
2.5
3.0
3.5
4.0
Pcr
/ P
cr0
ktop [kN/m]0
10
20
30
∞
model II
L0 = 6 mPcr0 = 32.32 kN
Fig. 6.49. Relative normal force in the truss bottom chord, corresponding to the buckling load vs. brace stiffness parameter α (model II)
As a result of the geometrically non-linear analysis of the truss-purlin model I, a relation between the normal force in the chord and the out-of-plane displacement in the middle of the truss bottom chord and in joint W1 was computed (Figs 6.50, 6.51). In the non-linear static analysis an equal stiffness of lower and upper truss chords was assumed. It was observed that for a bracing stiffness larger than 20 kN/m (α ≅ 3.7) the displacement

6. Buckling of braced trusses 142
in the out-of-plane truss direction in the middle of the lower truss chord for model I is blockaded.
The results of the non-linear analysis of model II are presented in Fig. 6.52. The limit forces obtained for model II are 8–15% lower than in model I. In the second model of the truss chord the relation between the normal force and the out-of-plane truss displacement reaches a maximum followed by normal force decrease. The relations in the members of a built-up cross-section are different. This may be interpreted as a local buckling of the built-up section. The design value of the normal force in the bottom truss chord is equal to 21.6 kN in the middle of the chord and 13.5 kN close to the supports (in the built-up section) (Hotala et al. 2007).
-15 -10 -5 0 5 10
v [cm]0
20
40
60
80
100
norm
al fo
rce
in b
otto
m c
hord
(m
iddl
e) [k
N]
ktop=kbottom [kN/m]0, model I
10, model I
20, model I
30, model I
0, model II
10, model II
20, model II
30, model II
Fig. 6.50. Normal force in the middle of bottom chord of the truss vs. the out-of-plane truss displacement v for different stiffnesses of braces (equal for the truss bottom and the top chord)
-5 0 5 10 15
v1[cm]
0
20
40
60
norm
al fo
rce
[kN
]
ktop=kbottom [kN/m]0
10
20
30
Fig. 6.51. Normal force in the built-up section of bottom truss chord vs. the out-of-plane truss displacement v1 at W1 for different braces stiffnesses (equal in the truss top and the bottom chord)
The limit forces calculated in the non-linear analysis are greater than the design normal forces and lower than the plastic resistance of the cross-section that is equal to 194 kN in the middle and 245 kN in the built-up section (fy = 215 MPa), which indicates that in the analysed example the truss chord is elastic.

6.4. Truss with braces placed in top and bottom chord 143
The buckling length of the compressed chord is calculated (Fig. 6.53). In the case of build up section the buckling length is 8.8–12.70 m and for the truss bottom chord 3.07–4.4 m. The buckling length is greater than the distance between the support and the brace located in the middle of the truss bottom chord.
The reaction in bracing was also under consideration. The reaction in bracing related to normal force in the chord due to the bracing stiffness is presented in Fig. 6.54. In the analysed range of stiffness of bracing the nonlinear relation between the reaction in bracing and the normal force in the truss chord has been obtained. The reaction in bracing corre-sponding to the design load was about 0.25% of the normal force in the chord.
0 2 4 6 8
v1 [cm]
10
20
30
40
norm
al fo
rce
[kN
] k, model II [kN/m]0, member a
0, member b
10, member a
10, member b
20, member a
20, member b
30, member a
30, member b
Fig. 6.52. Normal force in both members of built-up section (model II) of bottom truss chord vs. the out-of-plane truss displacement v1 at W1 for different braces stiffnesses
(equal in top and bottom chord)
0 10 20 30 40 50 60
ktop= kbottom [kN/m]2
4
6
8
10
12
14
16
buck
ling
leng
th [m
]
2L 50×50×6 (model I)
2L 50×50×6 (model II)
C65 (model I)
C65 (mode lI)
Fig. 6.53. Comparison of buckling length of truss bottom chord vs. stiffness of braces (equal in top and bottom chord)
The results of the conducted studies were used for the verification of code PN (1990) requirements of the load-bearing coefficient of the built-up lower chord section (Table 6.3). The critical forces calculated for truss model II were used to calculate the effective length of the built-up section of truss chord l1. Then the load-bearing coefficient of the built-up member was calculated. The results are different from the calculations carried out by
a b
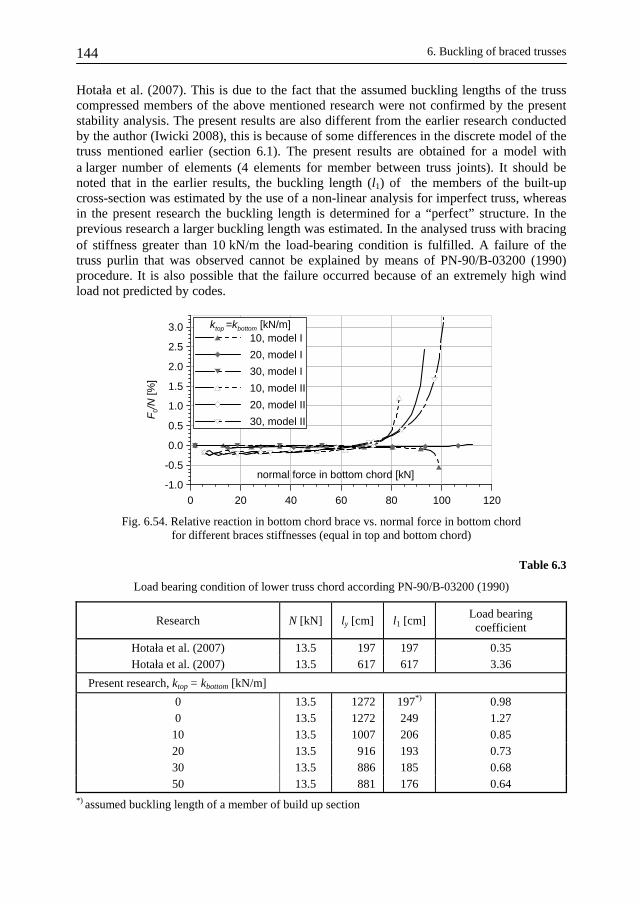
6. Buckling of braced trusses 144
Hotała et al. (2007). This is due to the fact that the assumed buckling lengths of the truss compressed members of the above mentioned research were not confirmed by the present stability analysis. The present results are also different from the earlier research conducted by the author (Iwicki 2008), this is because of some differences in the discrete model of the truss mentioned earlier (section 6.1). The present results are obtained for a model with a larger number of elements (4 elements for member between truss joints). It should be noted that in the earlier results, the buckling length (l1) of the members of the built-up cross-section was estimated by the use of a non-linear analysis for imperfect truss, whereas in the present research the buckling length is determined for a “perfect” structure. In the previous research a larger buckling length was estimated. In the analysed truss with bracing of stiffness greater than 10 kN/m the load-bearing condition is fulfilled. A failure of the truss purlin that was observed cannot be explained by means of PN-90/B-03200 (1990) procedure. It is also possible that the failure occurred because of an extremely high wind load not predicted by codes.
0 20 40 60 80 100 120
normal force in bottom chord [kN]-1.0
-0.5
0.0
0.5
1.0
1.5
2.0
2.5
3.0
F0/
N [%
]
ktop =kbottom [kN/m]10, model I
20, model I
30, model I
10, model II
20, model II
30, model II
Fig. 6.54. Relative reaction in bottom chord brace vs. normal force in bottom chord for different braces stiffnesses (equal in top and bottom chord)
Table 6.3
Load bearing condition of lower truss chord according PN-90/B-03200 (1990)
Research N [kN] ly [cm] l1 [cm] Load bearing
coefficient
Hotała et al. (2007) 13.5 197 197 0.35 Hotała et al. (2007) 13.5 617 617 3.36
Present research, ktop = kbottom [kN/m]
0 13.5 1272 197*) 0.98 0 13.5 1272 249 1.27
10 13.5 1007 206 0.85 20 13.5 916 193 0.73 30 13.5 886 185 0.68 50 13.5 881 176 0.64
*) assumed buckling length of a member of build up section
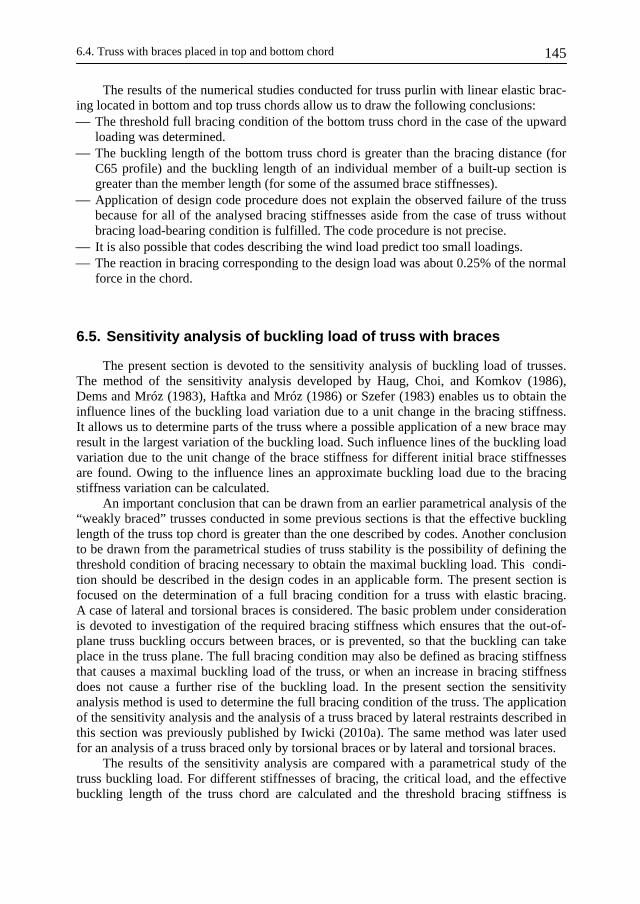
6.4. Truss with braces placed in top and bottom chord 145
The results of the numerical studies conducted for truss purlin with linear elastic brac-ing located in bottom and top truss chords allow us to draw the following conclusions: ⎯ The threshold full bracing condition of the bottom truss chord in the case of the upward
loading was determined. ⎯ The buckling length of the bottom truss chord is greater than the bracing distance (for
C65 profile) and the buckling length of an individual member of a built-up section is greater than the member length (for some of the assumed brace stiffnesses).
⎯ Application of design code procedure does not explain the observed failure of the truss because for all of the analysed bracing stiffnesses aside from the case of truss without bracing load-bearing condition is fulfilled. The code procedure is not precise.
⎯ It is also possible that codes describing the wind load predict too small loadings. ⎯ The reaction in bracing corresponding to the design load was about 0.25% of the normal
force in the chord.
6.5. Sensitivity analysis of buckling load of truss with braces
The present section is devoted to the sensitivity analysis of buckling load of trusses. The method of the sensitivity analysis developed by Haug, Choi, and Komkov (1986), Dems and Mróz (1983), Haftka and Mróz (1986) or Szefer (1983) enables us to obtain the influence lines of the buckling load variation due to a unit change in the bracing stiffness. It allows us to determine parts of the truss where a possible application of a new brace may result in the largest variation of the buckling load. Such influence lines of the buckling load variation due to the unit change of the brace stiffness for different initial brace stiffnesses are found. Owing to the influence lines an approximate buckling load due to the bracing stiffness variation can be calculated.
An important conclusion that can be drawn from an earlier parametrical analysis of the “weakly braced” trusses conducted in some previous sections is that the effective buckling length of the truss top chord is greater than the one described by codes. Another conclusion to be drawn from the parametrical studies of truss stability is the possibility of defining the threshold condition of bracing necessary to obtain the maximal buckling load. This condi-tion should be described in the design codes in an applicable form. The present section is focused on the determination of a full bracing condition for a truss with elastic bracing. A case of lateral and torsional braces is considered. The basic problem under consideration is devoted to investigation of the required bracing stiffness which ensures that the out-of-plane truss buckling occurs between braces, or is prevented, so that the buckling can take place in the truss plane. The full bracing condition may also be defined as bracing stiffness that causes a maximal buckling load of the truss, or when an increase in bracing stiffness does not cause a further rise of the buckling load. In the present section the sensitivity analysis method is used to determine the full bracing condition of the truss. The application of the sensitivity analysis and the analysis of a truss braced by lateral restraints described in this section was previously published by Iwicki (2010a). The same method was later used for an analysis of a truss braced only by torsional braces or by lateral and torsional braces.
The results of the sensitivity analysis are compared with a parametrical study of the truss buckling load. For different stiffnesses of bracing, the critical load, and the effective buckling length of the truss chord are calculated and the threshold bracing stiffness is
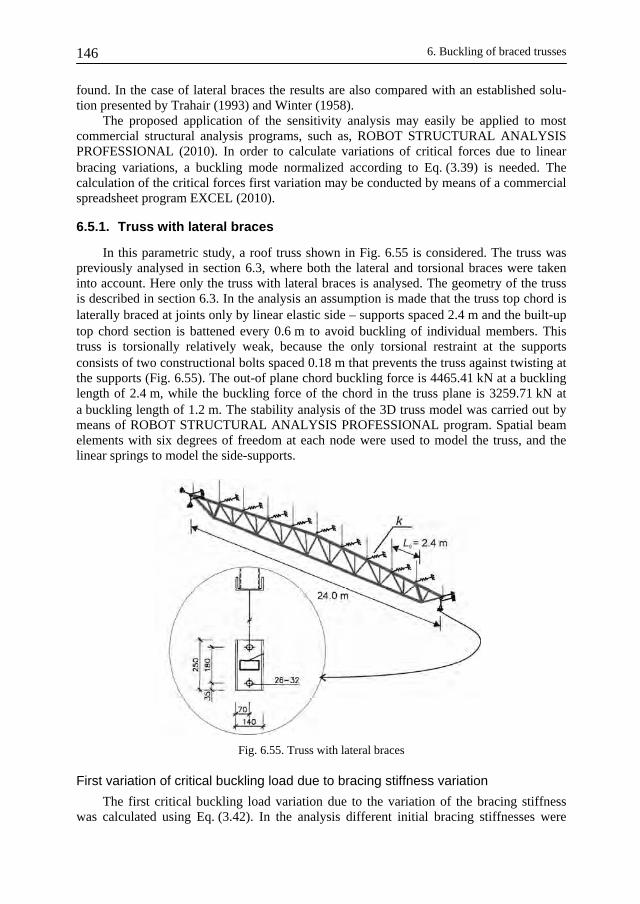
6. Buckling of braced trusses 146
found. In the case of lateral braces the results are also compared with an established solu-tion presented by Trahair (1993) and Winter (1958).
The proposed application of the sensitivity analysis may easily be applied to most commercial structural analysis programs, such as, ROBOT STRUCTURAL ANALYSIS PROFESSIONAL (2010). In order to calculate variations of critical forces due to linear bracing variations, a buckling mode normalized according to Eq. (3.39) is needed. The calculation of the critical forces first variation may be conducted by means of a commercial spreadsheet program EXCEL (2010).
6.5.1. Truss with lateral braces
In this parametric study, a roof truss shown in Fig. 6.55 is considered. The truss was previously analysed in section 6.3, where both the lateral and torsional braces were taken into account. Here only the truss with lateral braces is analysed. The geometry of the truss is described in section 6.3. In the analysis an assumption is made that the truss top chord is laterally braced at joints only by linear elastic side – supports spaced 2.4 m and the built-up top chord section is battened every 0.6 m to avoid buckling of individual members. This truss is torsionally relatively weak, because the only torsional restraint at the supports consists of two constructional bolts spaced 0.18 m that prevents the truss against twisting at the supports (Fig. 6.55). The out-of plane chord buckling force is 4465.41 kN at a buckling length of 2.4 m, while the buckling force of the chord in the truss plane is 3259.71 kN at a buckling length of 1.2 m. The stability analysis of the 3D truss model was carried out by means of ROBOT STRUCTURAL ANALYSIS PROFESSIONAL program. Spatial beam elements with six degrees of freedom at each node were used to model the truss, and the linear springs to model the side-supports.
Fig. 6.55. Truss with lateral braces
First variation of critical buckling load due to bracing stiffness variation
The first critical buckling load variation due to the variation of the bracing stiffness was calculated using Eq. (3.42). In the analysis different initial bracing stiffnesses were
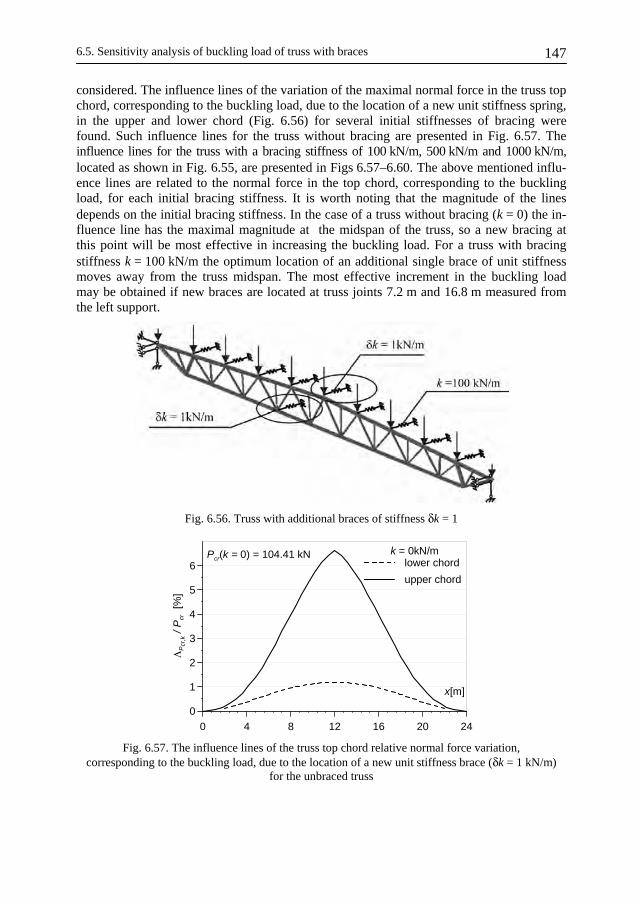
6.5. Sensitivity analysis of buckling load of truss with braces 147
considered. The influence lines of the variation of the maximal normal force in the truss top chord, corresponding to the buckling load, due to the location of a new unit stiffness spring, in the upper and lower chord (Fig. 6.56) for several initial stiffnesses of bracing were found. Such influence lines for the truss without bracing are presented in Fig. 6.57. The influence lines for the truss with a bracing stiffness of 100 kN/m, 500 kN/m and 1000 kN/m, located as shown in Fig. 6.55, are presented in Figs 6.57–6.60. The above mentioned influ-ence lines are related to the normal force in the top chord, corresponding to the buckling load, for each initial bracing stiffness. It is worth noting that the magnitude of the lines depends on the initial bracing stiffness. In the case of a truss without bracing (k = 0) the in-fluence line has the maximal magnitude at the midspan of the truss, so a new bracing at this point will be most effective in increasing the buckling load. For a truss with bracing stiffness k = 100 kN/m the optimum location of an additional single brace of unit stiffness moves away from the truss midspan. The most effective increment in the buckling load may be obtained if new braces are located at truss joints 7.2 m and 16.8 m measured from the left support.
Fig. 6.56. Truss with additional braces of stiffness δk = 1
0 4 8 12 16 20 24
x[m]
0
1
2
3
4
5
6
ΛP
cr,k /
Pcr [
%]
k = 0kN/mlower chord
upper chord
Pcr(k = 0) = 104.41 kN
Fig. 6.57. The influence lines of the truss top chord relative normal force variation, corresponding to the buckling load, due to the location of a new unit stiffness brace (δk = 1 kN/m)
for the unbraced truss

6. Buckling of braced trusses 148
0 4 8 12 16 20 24
x[m]
0
0.04
0.08
0.12
ΛP
cr,k / P
cr [
%]
k = 100 kN/mupper chord
lower chord
Pcr(k = 100) = 825.93 kN
Fig. 6.58. The influence lines of the truss top chord relative normal force variation, corresponding to the buckling load, due to the location of a new unit stiffness brace (δk = 1 kN/m)
for a truss with bracing stiffness k = 100 kN/m
0 4 8 12 16 20 24
x[m]
0
0.01
0.02
0.03
0.04
ΛP
cr,k / P
cr [
%]
(k=500)lower chord
upper chord
Pcr(k = 500) = 1675.06kN
Fig. 6.59. The influence lines of the truss top chord relative normal force variation, corresponding to the buckling load, due to the location of a new unit stiffness brace (δk = 1 kN/m)
for a truss with bracing stiffness k = 500 kN/m
0 4 8 12 16 20 24
x[m]
0.000
0.005
0.010
0.015
0.020
ΛP
cr,k /
Pcr [
%]
k = 1000 kN/mlower chord
upper chord
Pcr(k = 1000) = 2254.64kN
Fig. 6.60. The influence lines of the truss top chord relative normal force variation, corresponding to the buckling load, due to the location of a new unit stiffness brace (δk = 1 kN/m)
for a truss with bracing stiffness k = 1000 kN/m
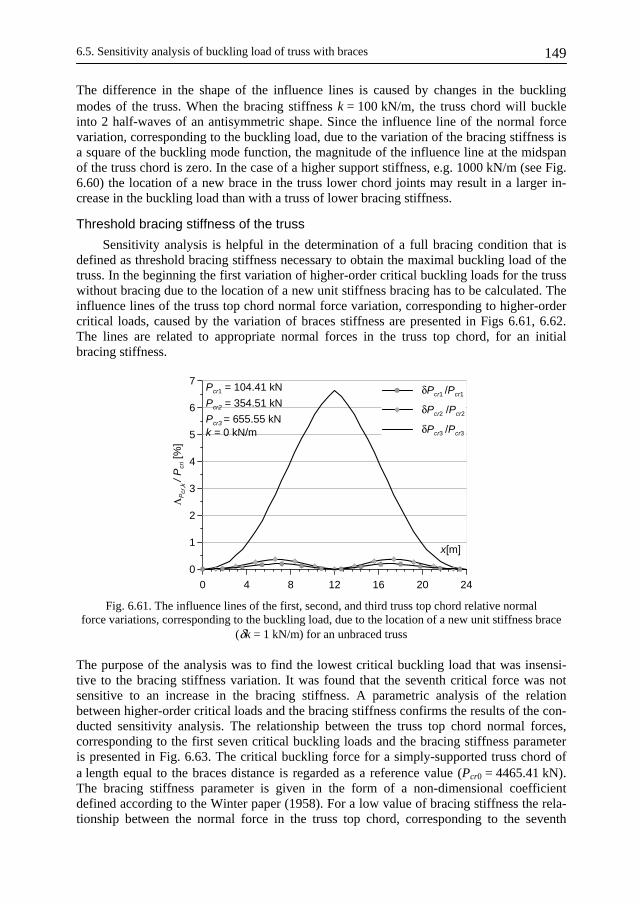
6.5. Sensitivity analysis of buckling load of truss with braces 149
The difference in the shape of the influence lines is caused by changes in the buckling modes of the truss. When the bracing stiffness k = 100 kN/m, the truss chord will buckle into 2 half-waves of an antisymmetric shape. Since the influence line of the normal force variation, corresponding to the buckling load, due to the variation of the bracing stiffness is a square of the buckling mode function, the magnitude of the influence line at the midspan of the truss chord is zero. In the case of a higher support stiffness, e.g. 1000 kN/m (see Fig. 6.60) the location of a new brace in the truss lower chord joints may result in a larger in-crease in the buckling load than with a truss of lower bracing stiffness.
Threshold bracing stiffness of the truss
Sensitivity analysis is helpful in the determination of a full bracing condition that is defined as threshold bracing stiffness necessary to obtain the maximal buckling load of the truss. In the beginning the first variation of higher-order critical buckling loads for the truss without bracing due to the location of a new unit stiffness bracing has to be calculated. The influence lines of the truss top chord normal force variation, corresponding to higher-order critical loads, caused by the variation of braces stiffness are presented in Figs 6.61, 6.62. The lines are related to appropriate normal forces in the truss top chord, for an initial bracing stiffness.
0 4 8 12 16 20 24
x[m]
0
1
2
3
4
5
6
7
ΛP
cr,k
/ P
cri [
%]
δPcr1 /Pcr1
δPcr2 /Pcr2
δPcr3 /Pcr3
Pcr1 = 104.41 kN
Pcr2 = 354.51 kN
Pcr3 = 655.55 kNk = 0 kN/m
Fig. 6.61. The influence lines of the first, second, and third truss top chord relative normal force variations, corresponding to the buckling load, due to the location of a new unit stiffness brace
(δk = 1 kN/m) for an unbraced truss
The purpose of the analysis was to find the lowest critical buckling load that was insensi-tive to the bracing stiffness variation. It was found that the seventh critical force was not sensitive to an increase in the bracing stiffness. A parametric analysis of the relation between higher-order critical loads and the bracing stiffness confirms the results of the con-ducted sensitivity analysis. The relationship between the truss top chord normal forces, corresponding to the first seven critical buckling loads and the bracing stiffness parameter is presented in Fig. 6.63. The critical buckling force for a simply-supported truss chord of a length equal to the braces distance is regarded as a reference value (Pcr0 = 4465.41 kN). The bracing stiffness parameter is given in the form of a non-dimensional coefficient defined according to the Winter paper (1958). For a low value of bracing stiffness the rela-tionship between the normal force in the truss top chord, corresponding to the seventh

6. Buckling of braced trusses 150
critical buckling load and the bracing stiffness, is constant. Therefore the seventh critical load in not sensitive to an increase of the bracing stiffness. At a certain level of the bracing stiffness, lower critical buckling loads become insensitive to the rise of the bracing stiffness. In the end, at the threshold bracing stiffness, the first buckling load becomes insensitive to the bracing stiffness variation. The magnitude of the bracing stiffness should be described as a design code requirement.
0 4 8 12 16 20 24
x[m]
0.00
0.02
0.04
0.06
ΛP
cr,k
/ P
cri [
%]
δPcr4 / Pcr4
δPcr5 / Pcr5
δPcr6 / Pcr6
δPcr7 / Pcr7
Pcr4 = 1114.23 Pcr5 = 1607.09 Pcr6 = 2275.85 Pcr7 = 2420.65 k = 0 kN/m
Fig. 6.62. The influence lines of the fourth-seventh truss top chord relative normal force variations, corresponding to the buckling load, due to the location of a new unit stiffness brace (δk = 1 kN/m)
for a truss without bracing
0 0.1 0.2 0.3 0.4 0.5 0.6 0.7
α = kL0/Pcr00.0
0.1
0.2
0.3
0.4
0.5
0.6
Pcr
k / P
cr0
Pcr7
Pcr6
Pcr5
Pcr4
Pcr3
Pcr2
Pcr1
Pcr0 = 4465.41 kNL0 = 2.4m
Fig. 6.63. Relationship between the truss top chord normal forces, corresponding to the first seven critical buckling loads vs. bracing stiffness parameter α
An interesting observation is, that a rise of the braces stiffness results in an increase in the first buckling load. However, the maximal first buckling load that may be reached is equal to that of the buckling loads of a higher order, for an initially unbraced truss, that is not sen-sitive to the changes in the bracing stiffness. The level of the critical buckling load insensi-tive to the bracing stiffness variations is constant. An advantage of the sensitivity analysis is that the maximal critical buckling load may be obtained from the sensitivity analysis of the truss with no bracing. The procedure for the determination of the full bracing condition

6.5. Sensitivity analysis of buckling load of truss with braces 151
is illustrated in Fig. 6.64. In order to calculate the threshold bracing stiffness at the beginning of the analysis, the truss without bracing is considered. The first variation of the first few critical buckling loads should be calculated. Then, two results should be secured by the sensitivity analysis. The first piece of information concerns the buckling load that is insensitive to the change of the bracing stiffness. That load level is the maximal value of the first buckling load that may be reached due to an increase in the bracing stiffness. The second result is related to the first variation of the first buckling load due to a variation of the bracing stiffness. A linear approximation of the exact relationship between the buckling load and bracing stiffness k can then be found as belows
1,01 1,0
crcr cr
PP P k
kδ
∂= +
∂ (6.3)
The first increment of the bracing stiffness can be calculated after assuming that the approximation of the buckling load is equal to the maximal buckling load (the critical buck-ling load that is insensitive to the bracing stiffness variation). In the next approximation step the first variation of the first critical buckling load for an increased bracing stiffness has to be determined and a new increment of bracing stiffness may be calculated.
Table 6.4
Approximation of threshold bracing stiffness obtained by sensitivity analysis for the truss with 9 lateral braces
Approximation number α k [kN/m] Pcr [kN] Pcr max δPcr [kN] δPcr/Pcr0 δk [kN/m]
1 0.000 0.00 104.41 2420.65 28.395 0.272 81.57
2 0.044 81.57 753.91 2420.65 4.056 0.039 410.89
3 0.265 492.46 1664.23 2420.65 1.400 0.013 540.14
4 0.555 1032.60 2287.25 2420.65 0.997 0.010 133.81
5 0.627 1166.41 2417.70 2420.65 0.955 0.009 3.09
6 0.629 1169.50 2420.64 2420.65 0.552 0.005 0.01
0 0.1 0.2 0.3 0.4 0.5 0.6 0.7 0.8
α = kL0/Pcr0
0.00
0.10
0.20
0.30
0.40
0.50
0.60
Pcr
/ P
cr0
exact
approximation 1
approximation 2
approximation 3
approximation 4Pcr0 = 4465.41 kNL0 = 2.4m
Fig. 6.64. Relative truss top chord normal force corresponding to the first critical buckling load vs. relative lateral bracing stiffness and its approximations constructed to find the threshold
full bracing condition

6. Buckling of braced trusses 152
The calculation should be repeated until the required accuracy is reached. In that way the threshold value of bracing stiffness for the full bracing condition is determined and presented in Table 6.4 and in Fig. 6.64. The calculation was conducted until the relative variation of the critical buckling force was less than 0.5%. The bracing stiffness parameter required for the full bracing condition is α = 0.629 (k = 1169.50 kN/m).
Application of sensitivity influence lines
Let us consider a truss with an initial bracing stiffness of 1000 kN/m. The influence lines of the location of a new unit stiffness brace for the variation of the critical buckling load of the truss are presented in Fig. 6.60. As an example of the application of the influ-ence lines let us assume two possible modifications to the truss bracing. In the first model (a) two additional braces are introduced in the lower truss chord, where the influence line has a relatively high magnitude. In the second model (b) the stiffness of the two braces located in the truss top chord with zero influence line magnitude is increased (Fig. 6.65). The additional braces stiffness increases. As a result, the relationship between the normal force in the truss top chord, corresponding to the first critical buckling load due to a larger bracing stiffness for the two models considered is found (Fig. 6.66).
Fig. 6.65. Two alternatives of the truss bracing modification for initial bracing stiffness k = 1000 kN/m
0 0.1 0.2 0.3 0.4 0.5 0.6 0.7
Δα = ΔkL0/Pcr0
0.500
0.505
0.510
0.515
0.520
Pcr
/ P
cr0 bracing model "a"
bracing model "b"
Pcr0 = 4465.41 kNL0 = 2.4m
Fig. 6.66. Relationship between the truss chord normal force, corresponding to the first critical buckling load, due to an increase of bracing stiffness for two alternatives
of the truss bracing modification

6.5. Sensitivity analysis of buckling load of truss with braces 153
It can be concluded that the same increase of bracing stiffness does not cause a rise in the buckling load in the case of model (b) but an increase in the critical buckling load of about 2% in model (a).
Effective length of braced truss chord
Although the present software allows us to model the whole roof structure and the bracing, some simplified diagrams or formulae for buckling length and equivalent stability force in the design of bracing are needed and are given in design codes. The truss top chord normal force, corresponding to the critical buckling load, makes it possible to determine the effective buckling length of the chord by Eq. (3.46). The effective buckling length related to the spacing of braces is presented in Fig. 6.67. The effective buckling length factor for a truss without bracing is 6.54 and in the case of a full bracing 1.36. The effective buckling length factor calculated for the 3D truss is greater than the one described in codes PN-90/B-03200 (1990) or Eurocode 3 (2005). The code requirements in fact give a greater critical force for the compressed chord than the one obtained by calculations for the ana-lysed truss. Similar results were described by Iwicki (2006, 2007a, 2007b, 2007d, 2008a), where a non-linear static analysis was conducted.
0 0.2 0.4 0.6 0.8 1
α = kL0/Pcr0
1
2
3
4
5
6
buck
ling
leng
th fa
ctor
μ
Pcr0 = 4465.41 kNL0 = 2.4m
Fig. 6.67. Buckling length related to brace distance vs. bracing stiffness parameter α
Comparison of the results of the 3D braced truss analysis with the established solutions
The threshold stiffness of the truss bracing is compared with the solution of the braced column presented by Trahair (1993). Trahair’s (1993) results are based on the Winter model (1958), that was extended by Yura (1996) to cases of bracing of stiffness smaller than the full bracing condition. In Winter’s paper the fictitious hinges were placed at the braced joints of the compressed column as shown in Fig. 6.33. The critical buckling force found for Winter’s column model is considered to be a safe, lower limit of buckling load for the assumed bracing stiffness. The compressed truss top chord is modelled as a column with vertical supports at diagonals and verticals, and is side-supported by braces. Some fictitious hinges at braced joints are introduced. In this model the truss diagonals, verticals and tension chord has no influence on the stabilization of the compressed chord against the out-of-plane buckling of the truss. It should be noted that in this case the model of the truss chord is horizontal. In the Winter model both a constant distribution of the normal forces along the chord and the distribution of the normal forces, as in the 3D truss model, are considered. A comparison of the results of the 3D truss analysis and Winter’s fictitious hinge models of the truss chord are presented in Fig. 6.68 (see, also Iwicki 2009b) .

6. Buckling of braced trusses 154
0 0.5 1 1.5 2 2.5 3 3.5 4 4.5
α = kL0/Pcr00.0
0.2
0.4
0.6
0.8
1.0
Pcr /
Pcr
0
3D truss model
Winter model
Winter model variable N
Pcr0 = 4465.41 kNL0 = 2.4m
Fig. 6.68. A comparison between the truss top chord normal forces, corresponding to the first critical buckling load with respect to the bracing stiffness parameter α
for the 3D truss model and the two Winter’s models
A similar analysis was conducted in section 6.3, but for a larger number of different braces and for a 3D truss, and the truss top chord model. For a low magnitude of bracing stiffness, the normal forces corresponding to the buckling load, obtained from the analysis of the 3D truss are about 10–15% higher than in the Winter model with constant normal force. This is caused by the variations of the normal forces in the truss top chord. The Winter model with variable normal forces gives almost the same result as in the 3D truss model. The restrain-ing effect of the diagonals, verticals and the bottom truss chord is in this case not signifi-cant. For a higher magnitude of bracing stiffness, the normal forces, corresponding to the buckling load of the 3D model are lower than the critical forces obtained by the Winter models. This is the effect of local buckling of compressed diagonals. The simplifications adopted in the Winter model of the truss chord for a larger bracing stiffness are responsible for an insecure result.
Comparison of the stability analysis results of the truss modelled by 1D and 3D by shell elements
The results obtained by the stability analysis of the truss modelled by beam-column elements with 6 degrees of freedom in node (ROBOT STRUCTURAL ANALYSIS PROFFESIONAL 2010) were compared to the similar analysis of the truss modeled by shell elements and program FEMAP with NX NASTRAN (2009). The 4-node shell ele-ments QUAD4 (with 6 degrees of freedom in node) were employed. In the truss modelled by beam-column elements the chords and two diagonals were assumed to be elements of built-up cross-section. This model does not take into account a possibility of local buckling of a single element of the built-up section. Therefore in the truss modelled by shell ele-ments braces between the truss top chord profiles were introduced. Two models are ana-lysed. In the first model (I) there are 16 braces along the truss top chord, in the model II there are 12 braces along the most compressed part of the chord. The braces are made of the same profile as the diagonals (U65 rolled profile). This approach was also used in real trusses. It was out of scope of the present analysis to investigate the influence of the braces length on the truss stability, but it should be stressed that those braces are important in the buckling resistance of the truss. It should be noted that in the dimensioning procedure according code PN(1990) such braces are also taken into account. The most loaded built-up compressed diagonals were unbraced. The above described models of the truss are pre-sented in Fig. 6.69. The total amount of finite elements was 30 000. The minimum 3 shell

6.5. Sensitivity analysis of buckling load of truss with braces 155
elements were used to describe the walls of the chord cross-sections and 2 elements on the walls of the U-diagonals cross-section. The element size on the U diagonals was about 20×30mm. For the truss top chord, the elements size was about 30×30 mm2 (800 elements are taken along the chord length). A linear buckling analysis of the perfect truss is conducted. Connections between the truss elements are modeled by rigid links between the adjacent members. The relation between the buckling load, for the truss modeled by 1D and 3D elements, and the stiffness of lateral braces is presented in Fig. 6.70. One can conclude that the stability analysis of the truss modeled by shell elements confirms the results of similar analysis of the truss modeled by beam-column elements.
Fig. 6.69. A truss modeled by 3D shell elements

6. Buckling of braced trusses 156
The difference between the buckling load for the truss modeled by shell and beam-column elements is 30–45% for the unbraced truss, 9–13% for k = 400kN/m and less than 1% at the threshold condition for full bracing of the truss (when the buckling load reaches maximal magnitude) (Fig. 6.71). The threshold bracing stiffness for full bracing condition found for the model I is the same as for the truss modelled by linear elements, but for the model II this condition is about 16% higher. The changes of buckled shape of the truss with the increase of the braces stiffness is also observed (Fig. 6.72). With the increase of the braces stiffness the buckled shape of the truss top chord increases from a one half-wave to five half-waves for k = 1000 kN/m. At the full bracing of the truss a local buckling of the most compressed diagonal made of U profile occurs. In the truss modelled by shell elements a more precise deformation of the truss has been obtained. The buckled shape of the truss confirms that at a threshold bracing stiffness local buckling of diagonal is interrelated with the deformation of the truss top chord Fig. 6.73.
0 0.1 0.2 0.3 0.4 0.5 0.6 0.7 0.8 0.9 1
α = kL0/Pcr0
0.00
0.10
0.20
0.30
0.40
0.50
0.60
Pcr
/ P
cr0
Robot model 1D
Nastran model I (3D)
Nastran model II (3D)
Pcr0 = 4465.41 kNL0 = 2.4m
Fig. 6.70. Relative truss top chord normal force corresponding to the first critical buckling load vs. relative lateral bracing stiffness for the truss modeled by beam-column and shell elements
0 0.1 0.2 0.3 0.4 0.5 0.6 0.7 0.8 0.9 1
α = kL0/Pcr0
-45
-40
-35
-30
-25
-20
-15
-10
-5
0
5
rela
tive
diffe
renc
e of
Pcr
/ P
cr0
[%]
difference between truss modelled by 1D and 3D elements
Nastran model I (3D)
Nastran model II (3D)
Fig. 6.71. Relative difference between buckling load found
for the truss modeled by 1D and 3D elements

6.5. Sensitivity analysis of buckling load of truss with braces 157
Fig. 6.72. Buckling mode corresponding to the truss buckling load for different stiffnesses of braces
Effect of the number of braces on threshold bracing stiffness
A stability analysis of the truss with different locations of braces was also carried out. It was assumed that the truss was side-supported at 1–9 nodes of the compressed chord, therefore in some of analysed cases the spacing between braces is not constant along the truss top chord. The truss with a continuous distribution of braces is also considered. The relationship between the truss top chord normal force, corresponding to the first buckling load, due to the bracing stiffness for trusses with different brace locations is presented in Fig. 6.74. For the truss with 1–5 braces the threshold condition for full bracing corresponds to the out-of-plane buckling of the truss between braces. In the case of the truss with a larger number of braces (6–9) the threshold condition for full bracing corresponds to a local buckling of the most compressed diagonals made of profile U65.
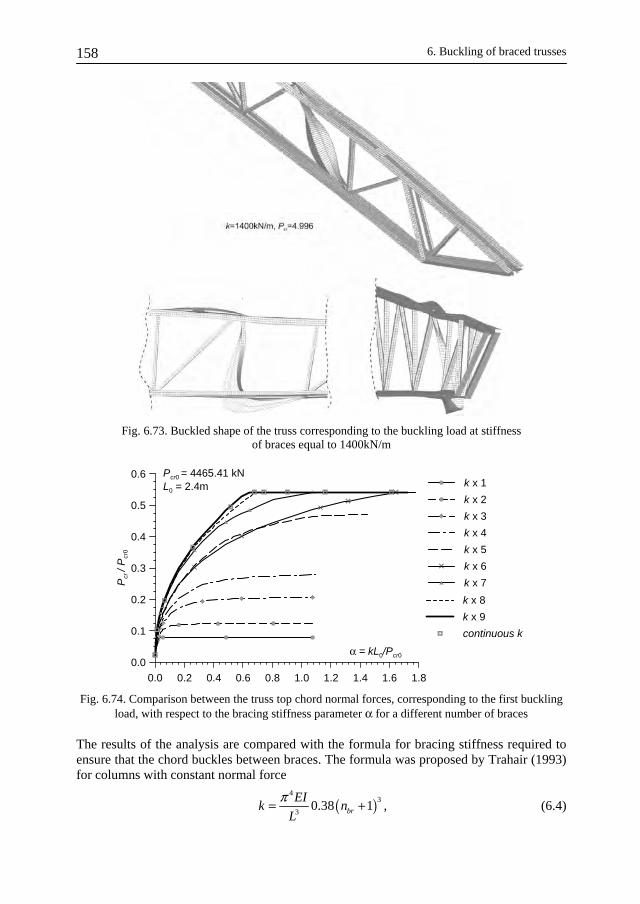
6. Buckling of braced trusses 158
Fig. 6.73. Buckled shape of the truss corresponding to the buckling load at stiffness of braces equal to 1400kN/m
0.0 0.2 0.4 0.6 0.8 1.0 1.2 1.4 1.6 1.8
α = kL0/Pcr00.0
0.1
0.2
0.3
0.4
0.5
0.6
Pcr
/ P
cr0
k x 1
k x 2
k x 3
k x 4
k x 5
k x 6
k x 7
k x 8
k x 9
continuous k
Pcr0 = 4465.41 kNL0 = 2.4m
Fig. 6.74. Comparison between the truss top chord normal forces, corresponding to the first buckling load, with respect to the bracing stiffness parameter α for a different number of braces
The results of the analysis are compared with the formula for bracing stiffness required to ensure that the chord buckles between braces. The formula was proposed by Trahair (1993) for columns with constant normal force
( )4
3
30.38 1br
EIk n
L
π= + , (6.4)

6.5. Sensitivity analysis of buckling load of truss with braces 159
where nbr denotes the number of braces, and L is the column length (Fig. 6.75). The relative normal force corresponding to the first buckling load, determined for the 3D truss model, together with the following relation for the column with discrete restraints:
2
02
0
1
cr
cr
r
P L
P L
n
=⎛ ⎞⎜ ⎟+⎝ ⎠
, (6.5)
is compared in Fig. 6.76. The effect of local buckling of the diagonals can be seen in Figs 6.75, 6.76.
0 1 2 3 4 5 6 7 8 9
number of restraints
0
1
2
3
4
thre
shol
d br
acin
g co
effic
ient
α
3D stability analysis
polynomial fit
Eq.6.4, Trahair
Fig. 6.75. Threshold bracing stiffness vs. number of braces for a 3D braced truss and for the column model according to Trahair (1993)
0 1 2 3 4 5 6 7 8 9
number of restraints
0.0
0.2
0.4
0.6
0.8
1.0
Pcr/P
cr0
3D stability analysis
polynomial fit
Eq.6.5
Fig. 6.76. Critical buckling force at full bracing condition vs. number of restraints for a 3D truss and a similar column model
The threshold bracing stiffness in the case of the analysed 3D truss is higher than in the column with the same number of braces. The relative normal force, corresponding to the buckling load of the 3D braced truss model is higher than for a similar column model with the same number of braces. The results of the buckling analysis for several configurations

6. Buckling of braced trusses 160
of braces are summarized in Table 6.5. The threshold bracing stiffness was determined by the sensitivity analysis on the assumption that the calculation was stopped when the relative variation of buckling force due to the variation of bracing stiffness parameter was less than 0.1. The calculated normal forces, corresponding to the buckling load, for the threshold bracing stiffness are compared with the forces for the rigid side-support truss model.
Table 6.5
Critical normal forces in the truss top chord at the threshold bracing stiffness and at rigid bracing for several lateral braces
Braces localization Number
of braces
Threshold bracing stiffness [kN/m]
Threshold bracing
parameter α
Pcr
[kN] 0cr
cr
P
P 0cr
crk
P
P ∞= ∞=crk
cr
P
P
[%]
0 – – 104.41 0.023 0.023 100.0
1 45.8 0.025 354.51 0.079 0.079 100.0
2 600.0 0.322 546.42 0.122 0.125 97.9
3 1220.0 0.656 917.32 0.205 0.211 97.1
4 2020.0 1.086 1245.17 0.279 0.289 96.5
5 2590.0 1.392 2101.07 0.471 0.481 96.5
6 3060.0 1.645 2420.65 0.542 0.542 100.0
7 1740.0 0.935 2420.65 0.542 0.542 100.0
8 1280.0 0.688 2420.65 0.542 0.542 100.0
9 1166.4 0.627 2420.65 0.542 0.542 100.0

6.5. Sensitivity analysis of buckling load of truss with braces 161
The results of the performed parametrical and sensitivity analyses provide a basis for drawing some conclusions regarding the effect of bracing stiffness on the critical buckling load. ⎯ The critical buckling load of the truss depends on the stiffness and spacing of braces. ⎯ The sensitivity analysis opens up an opportunity to obtain the influence lines of the
buckling load variation due to location of a new unit stiffness brace. The sensitivity in-fluence lines may be helpful in the design of bracing.
⎯ The sensitivity influence lines of the truss top chord normal force, corresponding to the buckling load variation, related to bracing stiffness variation depend on the initial brac-ing stiffness.
⎯ The threshold bracing stiffness of the truss top chord can be calculated by means of the sensitivity analysis. A higher-order critical load, calculated for the truss without bracing, that is insensitive to a change in bracing stiffness is the maximum of the first critical load to be reached by a rise in bracing stiffness.
⎯ In an examined truss with less than 5 braces the threshold condition for full bracing corresponds to an out-of-plane buckling of truss between braces. At a certain number of braces, local buckling in truss plane may occur. In such a case a further increase in bracing stiffness or the number of braces is not necessary, because it does not improve the stability of the structure.
⎯ The main difference in the stability analysis between the 3D truss model and the esta-blished solutions of the truss chord models consists in an effect of local buckling of other truss elements, neglected in models of the truss chords.
⎯ The threshold bracing stiffness and the truss top chord normal force, corresponding to the buckling load, of the braced 3D truss are greater than in similar column models with the same number of braces.
⎯ The stability analysis of the classical Winter model (with constant normal force) ensures that it is possible to obtain lower critical forces for the same bracing stiffness than for the 3D truss model with a low magnitude of bracing stiffness.
⎯ The critical forces obtained for the Winter model with variable normal force distribution and for the 3D truss model with the same bracing stiffness are similar for a low magni-tude of bracing stiffness
⎯ In the examined example the buckling length of the truss chord is greater than the distance between braces. The buckling length factor for truss chords is greater than the one predicted in design codes.
⎯ The use of the sensitivity analysis makes it possible to carry out the calculation of the threshold bracing stiffness and the maximal critical load in the truss chord by means of standard commercial structural analysis programs and commercial spreadsheet programs.
6.5.2. Truss with torsional braces
The same truss as analysed in the previous section but with torsional braces is investi-gated (Fig. 6.77). Roof purlins resting on a truss that undergoes bending when the truss is twisted are assumed to be a torsional brace, so the bending of the purlin is interrelated with the torsion of the truss. The roof truss may be restrained only with the torsional braces when there is no bracing at the end of the roof structure and under such circumstances the side displacements of the truss are not restrained. The first buckling load variation due to the variation of torsional braces stiffness was found. In the analysis different initial

6. Buckling of braced trusses 162
stiffnesses of torsional braces were considered. The influence lines of the variation of the maximal normal force in the truss top chord, corresponding to the buckling load, due to the location of a new unit stiffness torsional brace, in the truss top chord, for several initial stiffnesses of braces are presented in Fig. 6.78. One can draw a conclusion that the most effective increase in the buckling load may be obtained when an additional torsional brace or an increase of the existing brace stiffness in the middle of the truss top chord is assumed. The most effective increase of the buckling load is obtained for the truss without braces. One can also conclude that the shape of the influence lines is similar for different initial stiffnesses of braces. This is different in comparison with the case of the truss with lateral braces where the shape of the influence line depends on the initial braces stiffness (see for examples Figs 6.57–6.62).
Fig. 6.77. Truss with torsional braces
0 2.4 4.8 7.2 9.6 12 14.4 16.8 19.2 21.6 24
x[m]
0.0
0.1
0.2
0.3
0.4
0.5
0.6
0.7
0.8
0.9
1.0
ΛP
cr,k
θ / P
cr [
%]
kΘ [kNm/rad]0
113.64
418.52
Pcr(kΘ=0)=104.41 kN
Pcr(113.64)=295.65kN
Pcr(418.52)=422.91kN
Fig. 6.78. The influence lines of the truss top chord relative normal force variation, corresponding to the buckling load due to the location of a new unit stiffness torsional brace for a truss with braces
of stiffness 113.64 kNm/rad, 418.52 kNm/rad and for a truss with no torsional braces
In the truss with torsional braces the first buckling mode is similar for the whole range of the braces stiffnesses. Even for the truss with rigid torsional restraints, so when the torsion of the truss top chord is restraint, the truss buckles symmetrically as shown in Fig. 6.79. Higher buckling load multipliers were also investigated. The relation between the buckling loads and the torsional brace stiffness is different than the one of the lateral braces (com-pare Fig. 6.63 and Fig. 6.80). This is connected with the fact that the shape of the first buckling mode of the truss is the same for all of the analysed stiffnesses of the torsional

6.5. Sensitivity analysis of buckling load of truss with braces 163
braces. The seventh and the eighth buckling load are insensitive to the variation of the torsional brace stiffness for the initially unbraced truss (Fig. 6.81).
Fig. 6.79. Buckling mode corresponding to the first buckling load for torsional braces of stiffness kθ = 1000 kNm/rad
0 100 200 300 400 500 600 700 800
αθ = kθL0/GJd0.0
0.1
0.2
0.3
0.4
0.5
0.6
Pcr
/ P
cr0
Pcr8
Pcr7
Pcr6
Pcr5
Pcr4
Pcr3
Pcr2
Pcr1
L0= 2.4 mPcr0 = 4465.41 kN
Fig. 6.80. Relationship of the truss top chord normal forces corresponding to the first eight buckling loads vs. bracing stiffness parameter α
0 1 2 3 4 5 6 7 8
buckling load number
0
1
2
3
4
δPcr(δ
k θ=
1)[k
N]
Fig. 6.81. The first variation of the 1-8 buckling loads due to the variation of torsional braces stiffness

6. Buckling of braced trusses 164
0 100 200 300 400 500 600 700 800
αθ = kθL0/GJd
0.02
0.04
0.06
0.08
0.10
0.12
Pcr /
Pcr
0
exact
approximation 1
approximation 2
approximation 3
approximation 4
L0= 2.4 mPcr0 = 4465.41 kN
Fig. 6.82. Relative truss top chord normal force corresponding to the first buckling load vs. relative torsional bracing stiffness and its approximations constructed
to find the threshold full bracing condition
The bracing stiffness parameter αθ according to Trahair (1993) is introduced, and as the reference force, the critical force of the truss chord in the out-of-plane flexural buckling at buckling length L0 = 2.4 m is used. The threshold bracing stiffness may also be determined by the sensitivity analysis as in the case of the truss braced by lateral braces but at the beginning of the analysis an assumption is made, that the maximal first buckling load is con-sistent with the buckling load for the truss with rigid torsional braces (Fig. 6.82, Table 6.6).
Table 6.6
Approximation of threshold bracing stiffness obtained by sensitivity analysis for the truss with 9 torsional braces
Approximation number
kθ
[kNm/rad] Pcrmax
[kN] Pcr
[kN] δPcr(δk)
[kN] δkθ
[kNm/rad]
1 0.000 551.14 104.41 3.9310 113.6
2 113.641 551.14 295.65 0.8380 304.9
3 418.515 551.14 422.91 0.1988 645.1
4 1063.605 551.14 487.90 0.0478 1 322.1
5 2385.742 551.14 518.44 0.0128 2 562.9
The normal force, corresponding to the first buckling load at the threshold bracing condi-tion for the truss braced only by torsional braces, is equal to 23% of a similar force for the truss braced by lateral braces. The magnitude of a normal force in the truss top chord at buckling, is 551.14 kN, which is greater than the maximal normal force caused by the design load of the truss being equal to 482.9 kN. It should also be pointed out that the out-of-plane truss displacement found in the geometri-cally non-linear analysis of the truss braced only by torsional braces (Fig. 6.39) is 80–120 cm large, so the conclusion of Section 6.3 was positively verified by means of the

6.5. Sensitivity analysis of buckling load of truss with braces 165
sensitivity analysis. The torsional braces can improve the stability of the truss. However, the use of only the torsional braces would not satisfy the limit serviceability state.
6.5.3. Truss with torsional and lateral braces
The same truss as analysed in the previous sections but with both torsional and lateral braces is investigated (Fig. 6.31). In the analysis, different stiffnesses of lateral and torsional braces were considered. The stiffness of torsional braces depends on the braces span and the cross-section. For a typical roof purlin of 6m length this stiffness may be expected to range between 500 and 1500 kNm/rad.
The first critical buckling load variation due to the bracing stiffness variation is found by using Eq. (3.42). The influence lines of the variation of the maximal normal force in the truss top chord, corresponding to the buckling load, due to the location of a new unit stiff-ness lateral brace, in the upper and lower chord found in section 6.5.1 (Figs 6.58–6.60), for the truss with lateral braces 100 kN/m, 500 kN/m and 1000 kN/m, are compared with simi-lar lines for the truss with additional torsional braces of stiffness 500 kNm/rad (Figs 6.83–6.85). The lines are related to the normal force in the truss top chord, corresponding to the buckling load, for each initial bracing stiffness.
0 4 8 12 16 20 24
x[m]
0
0.02
0.04
0.06
0.08
0.1
0.12
0.14
ΛP
cr,k / P
cr [
%]
k=100kΘ=500
upper chord
lower chord
k=100upper chord
lower chord
k [kN/m], kΘ[kNm/rad], Pcr0 (k, kΘ)= 1123.41 kN
Pcr0 (k) = 825.93 kN
Fig. 6.83. The influence lines of the truss top chord relative normal force variation, corresponding to the buckling load, due to the location of a new unit stiffness lateral brace (δk = 1) for truss with lateral
bracing k = 100 kN/m and truss with lateral and torsional bracing k = 100 kN/m, kΘ = 500 kNm/rad
It is worth pointing out that the shape of the influence lines for the truss with additional torsional braces is different than in the case of the truss with only lateral braces. The differ-ences are quite significant. The regions of the truss where it is possible to use a unit lateral brace, differ in respect of location and magnitude. The largest difference between the influ-ence lines is in the truss with bracing k = 1000 kN/m. The torsional braces are responsible for the truss to become insensitive to the variation of the lateral bracing stiffness. The dif-ferences in the buckling load multiplier caused by applying the torsional braces of stiffness 500 kNm/rad is between 36.02% for the truss with lateral braces of 100 kN/m to 11.15%, for k = 500 kN/m to 7.37% for the truss with lateral braces of 1000 kN/m.

6. Buckling of braced trusses 166
0 4 8 12 16 20 24
x[m]
0
0.01
0.02
0.03
0.04
ΛP
cr,k / P
cr [
%]
k=500kφ=500
upper chord
lower chord
k=500upper chord
lower chord
k [kN/m], kΘ[kNm/rad]
Pcr0 (k, kΘ)= 1861.76 kN
Pcr0 (k) = 1675.06 kN
Fig. 6.84. The influence lines of the truss top chord relative normal force variation, corresponding to the buckling load, due to the location of a new unit stiffness brace for a truss with lateral bracing
stiffness of k = 500 kN/m and a truss with lateral and torsional bracing of k = 500 kN/m, kφ = 500 kNm/rad
0 4 8 12 16 20 24
x[m]
0.000
0.005
0.010
0.015
0.020
ΛP
cr,k / P
cr [
%]
k=1000kΘ=500
upper chord
lower chord
k=1000upper chord
lower chord
k [kN/m], kΘ[kNm/rad]
Pcr0 (k, kΘ)= 2420.64 kN
Pcr0 (k) = 2254.64 kN
Fig. 6.85. The influence lines of the truss top chord relative normal force variation, corresponding to the buckling load, due to the location of a new unit stiffness brace for a truss with lateral bracing of k = 1000 kNm/rad and a truss with lateral and torsional bracing of stiffness k = 1000 kNm/rad,
kΘ = 500 kNm/rad
The bracing stiffness parameter, at the threshold bracing condition when the truss appears only with the lateral bracing, is α = 0.629 (see Table 6.4.), and due to the torsional bracing stiffness of 1200 kNm/rad, this coefficient is reduced by about 20% to α = 0.5. A comparison of the relation between critical buckling load for the truss with lateral and torsional braces is presented in Fig. 6.86 andFig. 6.87.

6.5. Sensitivity analysis of buckling load of truss with braces 167
0 100 200 300 400 500 600 700 800
αΘ = kΘL0/GJd0.0
0.1
0.2
0.3
0.4
0.5
0.6
Pcr
/ P
cr0
k [kN/m]k=1200, α=0.645
k=1000, α=0.5375
k=800, α=0.43
k=600, α=0.3225
k=200, α=0.1075
k=100, α=0.0537
k=50, α=0.0269
k=0, α=0
L0= 2.4 m
Fig. 6.86. Relative truss top chord normal force corresponding to the first buckling load vs. relative torsional bracing stiffness for different stiffnesses of lateral braces
0.0 0.1 0.2 0.3 0.4 0.5 0.6 0.7
α = kL0/Pcr00.0
0.1
0.2
0.3
0.4
0.5
0.6
Pcr
/ P
cr0
kΘ[kNm/rad]kΘ=∝, αΘ=∝
kΘ=1200, αΘ=422.32
kΘ=600, αΘ=211.16
kΘ=200, αΘ=70.39
kΘ=0, αΘ=0
L0= 2.4 mPcr0 = 4465.41 kN
Fig. 6.87. Relative truss top chord normal force corresponding to the first buckling load vs. relative lateral bracing stiffness for different stiffnesses of torsional braces
0.0 0.1 0.2 0.3 0.4 0.5 0.6
α = kL0/Pcr0
0
10
20
30
40
50
60
70
80
[Pcr(k
,kΘ)-
Pcr(k
,kΘ=
0)] /
Pcr(k
,kφ)
[%]
kΘ=1200 kNm/rad
kΘ=10 kNm/rad
L0= 2.4 mPcr0 = 4465.41 kN
Fig. 6.88. Relative truss top chord normal force corresponding to the first buckling load vs. relative lateral bracing stiffness for different stiffnesses of torsional braces

6. Buckling of braced trusses 168
The results of the performed parametrical and sensitivity analyses allow us to draw some conclusions regarding the effect of the torsional bracing on the critical buckling load: ⎯ The sensitivity analysis may be applied in the case of the truss with both lateral and tor-
sional braces. ⎯ By the use of the sensitivity analysis it is possible to obtain the influence lines of the
buckling load variation caused by the location of a new unit stiffness brace. The sensi-tivity influence lines may be helpful in the design of bracing.
⎯ The sensitivity influence lines of the truss top chord normal force, corresponding to the buckling load, due to bracing stiffness variation depend on the initial bracing stiffness.
⎯ The mean increase of the critical buckling load arising from the torsional braces is between 10–30% depending on the stiffness of the torsional braces (100–1200 kNm/rad) (Fig. 6.88).
6.6. Sensitivity analysis of limit loads of truss with elastic braces
The present section is devoted to the sensitivity analysis of the truss limit load due to the bracing stiffness variation. The analysis is performed by means of the method presented by Chen and Ho (1994). This method is simple and can be carried out using the commercial finite element programs. The influence lines of the limit load variations due to a unit change of the brace stiffness are found. Those lines allow us to determine parts of the truss where the application of a brace may cause the largest variation of the limit load. By the use of the influence lines it is also possible to calculate an approximate limit load in function of the brace stiffness. A similar truss sensitivity analysis was performed by Iwicki (2007d) but the imperfections were slightly different and the discrete model had a lower number of finite elements that affected the results, especially for a higher magnitude of bracing stiff-ness (see comparison of the two models in section 6.1). The sensitivity of the truss limit loads concerns the non-linear analysis of the imperfect truss. The basic problem under consideration is devoted to the investigation of a required stiffness and the location of braces that ensures the limit truss load not to increase with the rise of bracing stiffness. The results of the sensitivity analysis are compared with a parametrical study of the truss limit load. The proposed sensitivity analysis may easily be applied to most commercial structural analysis programs.
In order to determine the influence line a nonlinear analysis of the truss both for initial stiffness kj and a new stiffness of brace with a given perturbation Δkj has to be carried out. The under-integral function ΛPcr,kj(x) is found by means of the finite difference method. The change of the limit load due to the brace stiffness perturbation according to Chen and Ho (1994) is computed as:
,
( ) ( )cr kj
cr j j cr jP
j
P k k P k
k
+ Δ −Λ =
Δ (6.6)
The calculations were performed by means of commercial finite element method program ROBOT STRUCTURAL ANALYSIS PROFESSIONAL (2010). In this method there is no need to differentiate the displacement vector or the stiffness matrix with respect to the design variable. The method is simple and can be performed by means of commercial finite element programs but all possible variations of the design vector must be assumed.
The geometry and the loading of the analysed truss are the same as in section 6.1 (Fig. 6.1). First the sensitivity of the truss limit load for the truss without bracing is carried out.
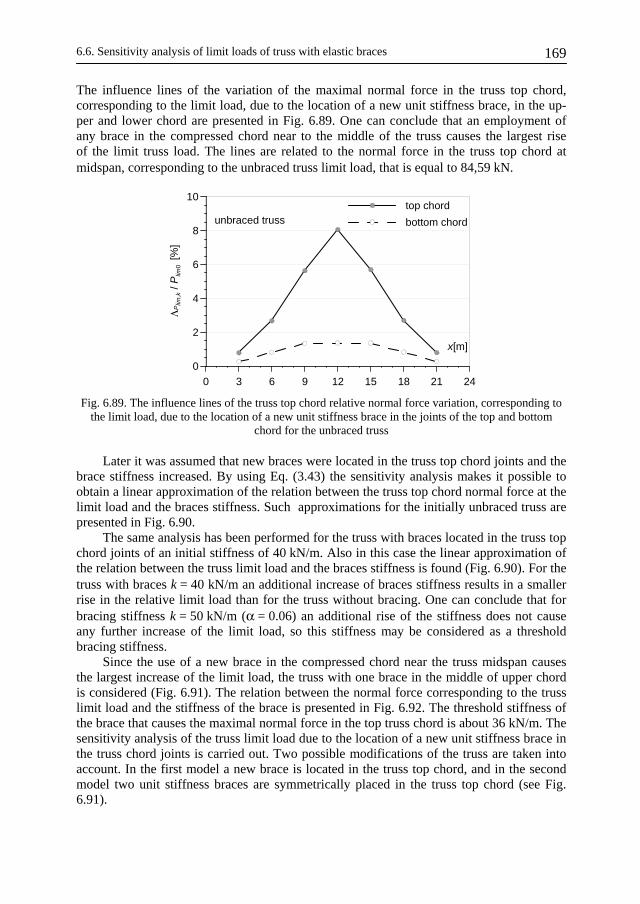
6.6. Sensitivity analysis of limit loads of truss with elastic braces 169
The influence lines of the variation of the maximal normal force in the truss top chord, corresponding to the limit load, due to the location of a new unit stiffness brace, in the up-per and lower chord are presented in Fig. 6.89. One can conclude that an employment of any brace in the compressed chord near to the middle of the truss causes the largest rise of the limit truss load. The lines are related to the normal force in the truss top chord at midspan, corresponding to the unbraced truss limit load, that is equal to 84,59 kN.
0 3 6 9 12 15 18 21 24
x[m]
0
2
4
6
8
10
ΛP
lim,k /
Plim
0 [%
]
top chord
bottom chordunbraced truss
Fig. 6.89. The influence lines of the truss top chord relative normal force variation, corresponding to the limit load, due to the location of a new unit stiffness brace in the joints of the top and bottom
chord for the unbraced truss
Later it was assumed that new braces were located in the truss top chord joints and the brace stiffness increased. By using Eq. (3.43) the sensitivity analysis makes it possible to obtain a linear approximation of the relation between the truss top chord normal force at the limit load and the braces stiffness. Such approximations for the initially unbraced truss are presented in Fig. 6.90.
The same analysis has been performed for the truss with braces located in the truss top chord joints of an initial stiffness of 40 kN/m. Also in this case the linear approximation of the relation between the truss limit load and the braces stiffness is found (Fig. 6.90). For the truss with braces k = 40 kN/m an additional increase of braces stiffness results in a smaller rise in the relative limit load than for the truss without bracing. One can conclude that for bracing stiffness k = 50 kN/m (α = 0.06) an additional rise of the stiffness does not cause any further increase of the limit load, so this stiffness may be considered as a threshold bracing stiffness.
Since the use of a new brace in the compressed chord near the truss midspan causes the largest increase of the limit load, the truss with one brace in the middle of upper chord is considered (Fig. 6.91). The relation between the normal force corresponding to the truss limit load and the stiffness of the brace is presented in Fig. 6.92. The threshold stiffness of the brace that causes the maximal normal force in the top truss chord is about 36 kN/m. The sensitivity analysis of the truss limit load due to the location of a new unit stiffness brace in the truss chord joints is carried out. Two possible modifications of the truss are taken into account. In the first model a new brace is located in the truss top chord, and in the second model two unit stiffness braces are symmetrically placed in the truss top chord (see Fig. 6.91).

6. Buckling of braced trusses 170
0 0.02 0.04 0.06 0.08 0.1
α = kL0 / Pcr0
1
2
3
4
5
6
Plim
/ P
lim0(
k=0)
approximation k=0
approximation k=40
exact
Pcr0 = 2490.87kNPlim(k = 0) = 84.59 kNL0 = 3mk [kN/m]
Fig. 6.90. Relative truss top chord normal force corresponding to the limit load vs. bracing stiffness parameter and its approximations for the truss with no braces and for brace k = 40 kN/m (α = 0.048)
Fig. 6.91. Truss with brace k = 40 kN/m in the middle of the top chord and with additional unit stiffness braces located in other truss joints
The influence line of the relative limit load due to the application of a new brace is presented in Fig. 6.93. The lines are related to the limit normal force of the truss with a side-support in the middle (with stiffness k = 40 kN/m) equal to 280.55 kN. It can be con-cluded that an additional increase of the brace stiffness in the middle does not cause an increase in the limit load. It is also interesting to analyse the sign and the shape of the influ-ence lines. One can conclude that the use of only one brace in the truss top chord results in a decrease of the maximal normal force in the midspan of the truss top chord in limit state conditions. The introducing of the two braces located symmetrically can improve the strength of the truss. It is also worth noting that one of the lines is not symmetrical. This is a difference in comparison with the influence lines found in the previous section. This may be explained by the fact that the normal force under investigation is not in the middle of the truss, but in an adjacent element (Fig. 6.91), and a new brace causes an asymmetrical normal force distribution in the non-linear analysis.

6.6. Sensitivity analysis of limit loads of truss with elastic braces 171
0 10 20 30 40 50 60 70
k [kN/m]1.0
1.5
2.0
2.5
3.0
3.5
4.0
Plim
/ P
lim0(
k=0)
Fig. 6.92. Relative truss top chord normal force corresponding to the limit load vs. bracing stiffness for the truss with one middle top chord brace
3 6 9 12 15 18 21 x[m]
-0.8
-0.4
0
0.4
0.8
ΛP
lim,k /
Plim
(k=
40)
[%]
k = 1 kN/m
k = 1 kN/m (symmetrical locaction)
truss with k=40kN/m Plim(k = 40) = 280.55 kN
Fig. 6.93. The influence lines of the truss top chord relative normal force variation, corresponding to the limit load (for the truss with one middle brace k = 40 kN/m), due to the location of one unit
stiffness brace or two unit stiffness braces located symmetrically in the joints of the top chord
0 5 10 15 20 25 30 35 40
Δk [kN/m]3.14
3.16
3.18
3.20
Plim
/ Plim
0(k=
0)
Fig.6.94. Relative truss top chord normal force corresponding to the limit load vs. variation of additional bracing stiffness located at x = 18 m
An important fact is that in other nodes of the truss the line has a negative sign and for this reason an additional side-brace introduced in these nodes may cause a decrease of the

6. Buckling of braced trusses 172
maximal normal force and may lower the limit loading of the truss. One can conclude that sometimes too many stiffeners placed in the wrong position do not increase the limit loads or may even cause a reduction of the load-bearing capacity of the truss. This effect was also verified by means of a parametrical study of the truss according to model I where an addi-tional brace is located in the node at x = 18 m from the left support (Fig. 6.94). The parametic study confirms the phenomenon predicted in the sensitivity analysis where the decrease of the limit load is equal to 1.74% for the new brace stiffness 40 kN/m.
6.7. Numerical verification of experimental research of truss with elastic braces
6.7.1. Description of model
In the research conducted by Kołodziej and Jankowska-Sandberg (2006) a stability of truss braced by elastic bracing was investigated. The truss model presented in Fig. 6.95 was tested. The main purpose of the experimental investigations was to determine the load-deflection relationship for different stiffnesses of bracing. The lateral bracing was modelled in the form of springs situated in the truss top chord joints. The springs characteristics were determined using a separate testing procedure. A detail of the brace attachment to the top truss chord is presented in Fig. 6.96.
Fig. 6.95. Experimental set-up of truss with elastic braces investigated by Kołodziej and Jankowska-Sandberg (2006)
The experimental investigation described above was verified in numerical studies by Iwicki (2007b). The results of the verification for another discrete model of the truss (4 elements / member) are presented in this section. The theoretical model of the experi-mentally tested truss that was a subject of the numerical analysis is presented in Fig. 6.97. The truss length L is equal to 7 m and its height is 0.7 m. It is assumed that the connections of the diagonals, the verticals, the lower and upper truss chords are rigid. The load is applied to the lower truss joints (7×1.9 kN). The truss chords and the verticals near the supports are made of profile 25×25×2, other truss elements consist of 20×20×2 profile.
Both the stability and the geometrically non-linear static analyses of the truss are performed. The model used for the stability analysis has no inaccuracies. In the non-linear

6.7. Numerical verification of experimental research of truss with elastic braces 173
analysis the truss with imperfection is considered. It is assumed that the top truss chord is bent out of the truss plane and the maximal imperfection is equal to L/500. The imperfec-tions assumed in the numerical analysis are consistent with code PN-B-06200. The bracing stiffnesses are assumed according to the research conducted by Kołodziej and Jankowska-Sandberg (2006) to be 0.8, 2.47, 5.5, 8.75, 12.90, 15, 20 kN/m.
Fig. 6.96. A detail of the brace modelled in the form of an elastic spring located at the truss top chord joints according to the research conducted by Kołodziej and Jankowska-Sandberg (2006)
Fig. 6.97. Truss with bracing
6.7.2. Results of numerical and experimental tests
For different bracing stiffnesses the relation between the normal forces in the truss compressed chord due to the out-of-plane truss displacements was determined by means of the geometrically non-linear static analysis (Fig. 6.98). In the analysis the load and arch length control method is used. One can conclude that an increase of bracing stiffness results in an increment of the limit force in the top truss chord. For a lower stiffness of bracing (k = 0.8 kN/m) the limit force in the truss chord is 7.71 kN and for bracing stiffness k = 20 kN/m it is 20.05 kN. The plastic resistance of the truss chord is 37.4 kN. Thus, in all of the analysed bracing stiffnesses the investigated buckling of truss is elastic. By the stability analysis of the truss it is possible to find the buckling load and the corresponding normal force in the truss chord. The relation of the limit and the critical normal force in the
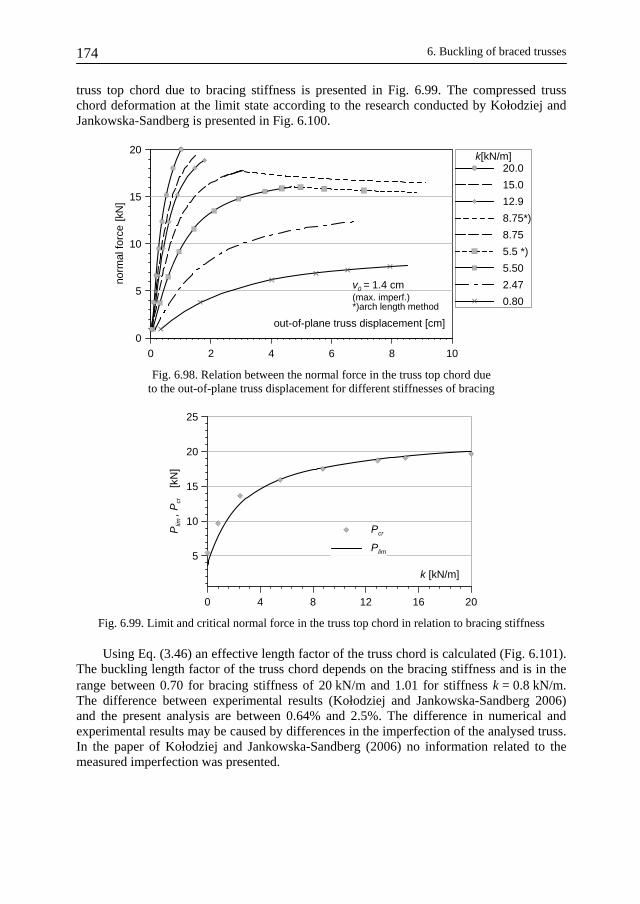
6. Buckling of braced trusses 174
truss top chord due to bracing stiffness is presented in Fig. 6.99. The compressed truss chord deformation at the limit state according to the research conducted by Kołodziej and Jankowska-Sandberg is presented in Fig. 6.100.
0 2 4 6 8 10
out-of-plane truss displacement [cm]0
5
10
15
20
norm
al fo
rce
[kN
]
k[kN/m]20.0
15.0
12.9
8.75*)
8.75
5.5 *)
5.50
2.47
0.80
v0 = 1.4 cm (max. imperf.)*)arch length method
Fig. 6.98. Relation between the normal force in the truss top chord due to the out-of-plane truss displacement for different stiffnesses of bracing
0 4 8 12 16 20
k [kN/m]
5
10
15
20
25
Plim
, P
cr
[kN
]
Pcr
Plim
Fig. 6.99. Limit and critical normal force in the truss top chord in relation to bracing stiffness
Using Eq. (3.46) an effective length factor of the truss chord is calculated (Fig. 6.101). The buckling length factor of the truss chord depends on the bracing stiffness and is in the range between 0.70 for bracing stiffness of 20 kN/m and 1.01 for stiffness k = 0.8 kN/m. The difference between experimental results (Kołodziej and Jankowska-Sandberg 2006) and the present analysis are between 0.64% and 2.5%. The difference in numerical and experimental results may be caused by differences in the imperfection of the analysed truss. In the paper of Kołodziej and Jankowska-Sandberg (2006) no information related to the measured imperfection was presented.

6.7. Numerical verification of experimental research of truss with elastic braces 175
Fig. 6.100. The compressed truss chord deformation at the limit state according to the research conducted by Kołodziej and Jankowska-Sandberg (2006)
0 4 8 12 16 20
k [kN/m]0.6
0.8
1.0
1.2
1.4
buck
ling
leng
th fa
ctor
Kołodziej, Jankowska-Sandberg (2006)
present analysis
L0= 1.75 m
Fig. 6.101. The effective length factor of the truss compressed chord vs. the bracing stiffness
The buckling length factor found in the tests by Kołodziej and Jankowska-Sandberg (2006) verified in the present section are lower then predicted by the code PN-90/B-03200 (1990). The results obtained for other trusses in the present chapter are different. In order to investigate the differences in the buckling length factor some modifications of the truss presented in Fig. 6.97 are assumed. The modifications of the truss geometry are as follows (see Fig. 6.102): a) a change of the diagonals and verticals bending and torsional stiffness (reduction factor:
22 – in out-of-plane direction, 16 – in the truss plane dirrection, 4.5 – reduction of torsional stiffness), the described modification allow to obtain a similar relation of stiff-nesses between the truss members, as in the previously investigated trusses,
b) change of the truss load location from the bottom chord to the top chord, c) modification of the supports (the supports are at the top chord), d) additional reduction of the torsional stiffness of diagonals (reduction factor: 211) e) modification of braces (L0 = 0.875m).
Then three models of the truss with different combinations of above described changes are analysed (Table 6.7, Fig. 6.102).

6. Buckling of braced trusses 176
Table 6.7
Modified models of a truss
MODEL 1 A B C
MODEL 2 A B C D
MODEL 3 A B C D E
Fig. 6.102. Truss with modified geometry
0 1 2 3
α = k L0 / Pcr0
5
10
15
20
Pcr
[kN
]
initial geometry
model 1
model 2
model 3
model 1 and 2: Pcr0 = 9.76 kN, L0= 1.75 m
model 3:L0=0.875 mPcr =39.06 kN
Fig. 6.103. Buckling loads of modified models of the truss
The results of the stability analysis: the buckling load and the buckling length of the truss compressed chord are presented in Fig. 6.103, and Fig. 6.104. The buckling length factor and the bracing stiffness parameter α are calculated for L0 = 1.75 m (model 1, 2) and 0.875 m (model 3). The decrease of the buckling load was obtained in the case of the model 1 and 2. For model 3 the buckling load is at first greater than for the truss model (Fig. 6.97), but then is constant with the increase of the bracing stiffness parameter α. The buckling length factor for the truss “initial” model and the models 1, 2 are lower than one for α > 2. In the case of the model 3 the similar effect as in the previously analysed trusses has been obtained. At a certain bracing stiffness a local buckling occurs and further increase of the bracing stiffness doesn’t result in an increase of the buckling load, and buckling length factor is constant. In the model 3 the buckling length factor was greater than one.

6.7. Numerical verification of experimental research of truss with elastic braces 177
0 1 2 3
α = k L0 / Pcr0 1
2
3
4
5
buck
ling
leng
th fa
ctor
initial geometry
model 1
model 2
model 3
model 1 and 2: Pcr0 = 9.76 kN, L0 = 1.75 m
model 3:L0=0.875 m, Pcr =39.06 kN
Fig. 6.104. Buckling length factor of modified models of the truss
The reaction in braces was also taken into consideration. The result of the numerical analysis of the bracing reaction in function of the truss top chord normal force (at the brace) is presented in Fig. 6.105. This relation is non-linear and depends on the bracing stiffness.
0 5 10 15 20
N [kN] (x = 0.5L)-1.6
-1.4
-1.2
-1.0
-0.8
-0.6
-0.4
-0.2
F0 /N
[%] k = 20
k = 15
k = 12.9
k = 8.75
k = 5.5
k = 2.47
k = 0.8
0 5 10 15
N [kN] (x = 0.25L)-0.8
-0.6
-0.4
-0.2
F0
/ N (
x =
0.2
5L)
[%]
Fig. 6.105. Relative reaction in the truss braces vs. normal force in the truss top chord for different brace stiffnesses
On the basis of the results of the conducted studies it is possible to conclude that: ⎯ the effective length, the limit force and the reaction in truss bracing depend on the
stiffness of bracing, ⎯ the experiment and the numerical results are coincidental, ⎯ the effective length of the top truss chord is in the range between 0.7 and 1.01, so the
effective length of the compression chord is considerably less than the distance between braces,
⎯ the analysed truss does not correspond to the practically designed trusses. Therefore the conclusion related to the effective length factor may not be generalized. An important fact is that the test confirms the numerical analysis and consequently the proposed method of the numerical research and the results presented in other analysed examples are reliable.

6. Buckling of braced trusses 178
6.8. Part of 3D roof structure with bracing
The present section is devoted to a non-linear static analysis (Section 6.8.1) and to a stability analysis (Section 6.8.2) of two models of part of a 3D roof structure consisting of trusses, purlins and bracing. The results of the present parametric study are compared with the outcomes of previously analysed 3D truss with lateral or torsional braces modelled as linear elastic springs (Section 6.3).
6.8.1. Part of the roof structure with truss bracing
In the parametric study a segment of the roof structure shown in Fig. 6.106 is con- sidered. The main constructional elements of the roof are the trusses that were analysed in Section 6.3 and 6.5. It is assumed that the load is applied to the top chord joints. The purlin is made of HEA120 rolled profiles, and two models of bracing are taken into account, the diagonals of L20×20×3 and 40×40×4. The case of a rigid and hinged (in one direction) truss (A) – purlin connection is studied. In the non-linear statics the upper and lower truss chords are bent in the truss out-of-plane direction in the opposite sides in the upper and lower truss chords, and the shape of imperfection is a poly-line with nodes located on a parabola with a maximal value of L/500 (same for all trusses). The compressed chord of the truss is dimensioned according to code PN-90/B-03200 (1990) for a maximal design value of axial force 700 kN, and the plastic resistance to normal force being Npl = 945 kN.
Fig. 6.106. Part of roof structure with bracing
The geometrically non-linear relation between the normal force in the truss com-pressed chord due to the out-of-truss plane displacement v calculated for the previously analysed truss with braces of different stiffnesses (Fig. 6.34) has been compared with simi-lar results for part of the roof structure (Fig. 6.107). The maximal normal (found by means of load control method) force increases with the rise of the braces stiffness.

6.8. Part of 3D roof structure with bracing 179
-20 -15 -10 -5 0 5
displacement (midspan) [cm]0
500
1000
1500
2000
2500
3000
3500no
rmal
forc
e in
com
pres
sed
chor
d [k
N]
k [kN/m]100
1000
20 x 3 rigid
20 x 3 hinged
40 x 3 rigid
40 x 3 hingedk [kN/m];
kΘ [kNm/deg]
100; 20
1000; 20
Npl
Pcrmax (20 x 3, rigid)=2581 kN
Npl = 945 kNv0= 4.8 cm
Fig. 6.107. Normal force in compressed chord due to the out-of-plane displacement for different stiffness of braces, and for a 3D model of part of the roof
The maximal loads of the roof structure with L20×3 and L40×4 bracing with hinged and rigid truss-purlin connection are greater than the plastic resistance of the chord.
The normal force in purlins was also under consideration. The bracing reaction that is a normal force in purlin is different depending on the purlin location. The normal force in purlins related to the mean values of the normal force in the truss top chord is presented in Fig. 6.108.
1 2 3 4 5 6 7 8 9 10 11
purlin number-1.0
-0.5
0.0
0.5
1.0
1.5
F0 / N
av [%
]
40 x 4 (rigid)
40 x 4 (hinged)
20 x 3 (rigid)
20 x 3 (hinged)
Nav = 394 - 397 kN
Fig. 6.108. Normal force in purlins related to mean values of normal force in truss top chord at purlin connection for different models of bracing
The maximal relative moment in torsional braces is 7% of bending design moment of purlins, caused by typical gravity loads (assumed to be M0 = 18.75 kNm). The maximal moment is in the torsional braces near the truss supports (Fig. 6.109). For this reason it is possible to consider the purlins to be rotational supports of the truss on condition that the connectors between the purlins and the truss are stiff enough and are designed to carry an arising moment. It should also be added that due to the fact that the truss is loaded in the top chord nodes, the obtained moments in purlins represents an increase of the moment needed to stabilize the truss. In the design, a moment due to the bending of the purlin should be added.

6. Buckling of braced trusses 180
1 2 3 4 5 6 7 8 9 10 11
purlin number-6.0
-4.0
-2.0
0.0
2.0
4.0
M /
M0
[%]
40 x 4 (rigid)
20 x 3 (rigid)
M0 = 18.75kNm
Fig. 6.109. Relative moment in truss-purlin connection for different models of bracing
The results of the conducted studies make it possible to conclude that: ⎯ The limit (maximal force in the non-linear analysis by load-control method) normal
force increases with a rise of the side bracing stiffness. ⎯ In the case of a roof model with purlins and truss bracing, an increase of the limit nor-
mal force obtained for a rigid and hinged connection between the truss and the purlin was greater than the plastic resistance of the chord.
⎯ The moment in rotational supports is lower than the bending design moment of purlins, caused be typical dead loads, therefore one can regard the purlins as rotational supports of the truss on condition that the connectors between the purlins and the truss are desi-gned to carry an arising moment.
⎯ The maximal reaction in the purlins for the design load level of the truss is 0.7–1.2% of average value of the normal force in the truss top chord (average reaction in braces is 0.1% of Nav).
6.8.2. Part of the roof structure with flexural bracing
The last example is a set of two trusses with purlins (HEA140) and flexural bracing. The truss-purlins connection is hinged. It is assumed that the flexural stiffness of one of the trusses top chord represents a flexural bracing located in the roof plane (Fig. 6.110). The stability of the roof is investigated in function of the flexural bracing stiffness. The geome-try of the truss is the same as in the previous section. The buckling loads in function of the bracing stiffness are presented in Fig. 6.111. The functions are similar to the results given in the previous sections, since both the threshold stiffnesses of bracing and the changes of the relations between higher buckling loads due to the bracing stiffness are obtained. In the present example the first buckling mode is in the form of a one half-wave (Fig. 6.112a) until the stiffness of the bracing reaches the threshold value of bracing. Then the buckling mode changes to the mode of the second buckling load for the truss with braces of a lower stiffness (Fig. 6.112b).
The results of the conducted analysis allow to conclude that the main difference between the truss braced by flexural bracing and braced by a set of lateral braces, that have been analysed before, is the buckling mode of the structure. In the trusses with lateral braces modelled as linear springs the buckling mode changes from a one half-wave to multiple half-waves with an increase of the bracing stiffness.

6.8. Part of 3D roof structure with bracing 181
Fig. 6.110. A set of two trusses with flexural bracing
0 20 40 60 80 100 120 140
JBr / Jz
0.0
0.1
0.2
0.3
0.4
0.5
0.6
0.7
0.8
Pcr
k / P
cr0
Pcr7
Pcr4
Pcr3
Pcr2
Pcr1
Jz = 1271cm4
Pcr0= 4465.41kN
Fig. 6.111. Relationship of the truss top chord normal forces, corresponding to the 1–4 and 7 critical buckling loads vs. stiffness of flexural bracing
a)
b)
Fig. 6.112. Buckling modes corresponding to the first and the second buckling load
for bracing stiffness Jbr/Jz = 65 a) first buckling mode, b) second buckling mode

Chapter 7
FINAL REMARKS
The presented research is devoted to some selected problems of stability analysis of various steel structures. In the study the influence of various design parameters on the criti-cal and limit load are considered. The analysis is conducted by means of both the sensitivity analysis method and the parametrical studies.
The work presents capabilities of the sensitivity analysis in solving the problem of sta-bility of various steel structures.
The sensitivity analysis provides a tool to anticipate changes in the critical forces due to variations of the design variables. In the studies the following design variables have been taken into account: ⎯ initial imperfection that models the design inaccuracies, ⎯ the material characteristics, ⎯ dimensions of the cross-section, ⎯ residual stresses, such as, post-welding or post-rolling stresses, ⎯ cross-section temperature, ⎯ position and stiffness of bracing.
By the use of the sensitivity analysis it is possible to determine: ⎯ the influence line of the variation of the critical and limit load of the structure due to
variation of the design parameters, ⎯ approximation of the relation between the critical forces and the design parameters, ⎯ the threshold bracing stiffness for a full bracing condition, ⎯ the threshold condition for full bracing may be found by the sensitivity analysis of an
initially unbraced structure, ⎯ the sensitivity analysis allows us to calculate the maximal buckling load that may be
obtained as a result of an increase in the bracing stiffness.
The sensitivity influence lines of the critical forces due to variation of cross-section dimensions, cross-section temperature, and location of various kinds of stiffeners for some selected structures are presented. The sensitivity analysis has shown a “paradox” that by adding some material or stiffeners to the structure it results in a decrease of the critical forces.
Studies devoted to the influence of elastic bracing on buckling of various structures, as for instance, beams, columns and frames can be found in professional literature, but in the case of trusses there is a lack of similar research. Only a very limited number of papers deal with the problem of stability of trusses stiffened by elastic braces. This was a motivation for undertaking these studies.
The results of geometrically nonlinear static, stability and sensitivity analysis of various selected steel structures restrained by various kinds of bracing make it possible to draw the following conclusions: ⎯ critical forces, effective lengths and the bracing reaction depend on bracing stiffness,

183
⎯ the minimal required bracing stiffness, called the threshold condition of full bracing, enables us to obtain the maximal critical forces, and for this reason an additional incre-ase of the bracing stiffness does not result in an increase of the structure buckling load,
⎯ the structure with braces of stiffness of the threshold bracing condition, buckles between braces or may buckle locally,
⎯ various simplified code requirements concerning an effective length of some compres-sed members and equivalent stability forces are not precise and may sometimes cause erroneous results,
⎯ in the examined trusses the effective buckling length of the compressed truss chords with elastic bracing of stiffness corresponding to the data given in the design codes is greater than the braces spacing,
⎯ in most of the design codes the problem of effective lengths of weakly braced frames in not taken into account,
⎯ rotational restraints and warping prevention restraints may have positive effects on stabilizing the structures,
⎯ in the examined trusses the spatial stability of trusses dimensioned according codes is provided even for side-supports assumed to be elastic springs and even for effective buckling length of truss chords greater than side-supports spacing,
⎯ the bracing reaction for the design load level in the worked examples is lower than the values predicted in code (PN-90/B-03200 1990),
⎯ there is a lack of code requirements concerning the sloping side-supports, and side-bracing of lower (normally tensioned) truss chords, or some other kind of bracing, as for example, warping preventing bracing and torsional bracings.
The designers need a simple formula for the required stiffness for full bracing and the relation between a coefficient of buckling lengths and the bracing stiffness. The codes re-quirements concerning bracings and buckling length of columns are presented in the form of tables or graphs or formulas that are not easily applicable.
There are plans for continuation of the presented research. The continuation will be focused on a verification of the proposed methods by means of 3D shell models of some selected structures, as it was successfully performed in the case of two I-columns and one of the analysed trusses. A further research may also be devoted to a threshold full bracing condition of warping stiffeners of columns and beams, or threshold condition for full brac-ing of space frames. An experimental verification of the presented research is also planned. In the future research of the buckling and the limit loads of the restrained structures, such problems as, the non-linear behaviour of braces, as it was presented in the case of the truss-binder, the stiffness of joints or the plasticity of material, should be also taken into account.

REFERENCES
[1] Aristizabal-Ochoa JD.: Story stability and minimum bracing in R/C framed structures: A general approach. ACI Structural Journal, 92, 6, 1995, 725–44.
[2] Aristizabal-Ochoa JD.: Story stability of braced, partially braced and unbraced frames: Classical approach. Journal of Structural Engineering. ASCE, 123, 6, 1997, 799–807.
[3] Biegus A.: Nośność graniczna stalowych konstrukcji prętowych. Warszawa-Wrocław: PWN 1997.
[4] Biegus A.: Stalowe budynki halowe. Warszawa: Arkady 2003. [5] Biegus A., Rykaluk K.: Collapse of Katowice Fair Building. Engineering Failure Analysis, 16,
2009, 1643–1654. [6] Biegus A., Rykaluk K.: Katastrofa hali Międzynarodowych Targów Katowickich w Chorzowie.
Inżynieria i Budownictwo, 4, 2006, 183–189. [7] Biegus A., Wojczyszyn D.: Długości wyboczeniowe pasów kratownic z płaszczyzny ustroju.
Inżynieria i Budownictwo, 11, 2004, 607–610. [8] Biegus A., Wojczyszyn D.: Ocena nośności pasów przy wyboczeniu z płaszczyzny kratownic.
Awarie Budowlane. Zapobieganie, diagnostyka, naprawy, rekonstrukcje. XXII konferencja naukowo-techniczna, Szczecin-Międzyzdroje, 2005, 661–668.
[9] Biegus A., Wojczyszyn D.: Współczynniki długości wyboczeniowej pasów z płaszczyzny ustro-ju „krótkich” kratownic. III Sympozjum Kompozyty, Konstrukcje Warstwowe, Wrocław, 2006, 19–26.
[10] Boverkets handbok om stalkonstruktioner. Stockholm: Boverket, Byggavdelningen 1994. [11] Bradford M.A.: Distortional buckling of elastically restrained cantilevers. Journal of Construc-
tional Steel Research, 47, 1998, 3–18. [12] British Standard 5950–1:2000, Structural use of steelwork in building, part 1: Code of practice
for design-rolled and welded sections. London: British Standards Institution 2000. [13] British Standard 5950, 1990: Structural use of steelwork in building, part 8: Code of practice for
fire resistant design. London: British Standards Institution 1990. [14] Bródka J., Barszcz A., Giżejowski M., Kozłowski A.: Sztywność i stateczność stalowych ram
przechyłowych o węzłach podatnych. Rzeszów: Oficyna Wydawnicza Politechniki Rzeszowskiej 2004.
[15] Bródka J., Garncarek R., Miłaczewski K.: Blachy faldowe w budownictwie stalowym. Warszawa: Arkady 1999.
[16] Budkowska B, Szymczak C.: The analysis of axially loaded pile with account for its varying length. Computers and Structures, 54, 6 , 1995, 1149–1154.
[17] Budkowska B. B., Szymczak C.: Sensitivity analysis of critical torsional buckling load of thin-walled I-columns resting on elastic foundation. Thin-Walled Structures, 14, 1992, 37–44.
[18] Budkowska B. B., Szymczak C.: Sensitivity analysis of thin – walled I-beams undergoing torsion. Thin-Walled Structures, 12, 1991, 51–61.
[19] Cichoń C., Pluciński P., Waszczuk S.: Buckling of thin-walled frames with partial warping restraints. Archives of Civil Engineering, 46, 2000, 243–254.
[20] Cichoń C., Waszczyszyn Z.: Numeryczna analiza wyboczenia sprężysto-plastycznych ram płaskich. Archiwum Inżynierii Lądowej, 25, 1979, 35–41.
[21] Chen J.L., Ho J.S.: A comparitive study of design sensitivity analysis by using commercial finite element programs. Finite Elements in Analysis and Design. The Interational Journal of Applied Finite Elements and Computer Aided Engineering, 15, 1994, 189–200.
[22] Chu X., Rickard J., Li L.: Influence of lateral restraint on lateral-torsional buckling of cold-formed steel purlins. Thin Walled Structures, 43, 2005, 800–810.
[23] Chróścielewski J., Lubowiecka I., Szymczak, C., Witkowski W.: On some aspects of torsional buckling of thin-walled I-beam columns. Computers and Structures, 84, 2006, 1946–1957.

References 185
[24] Chudzikiewicz A.: Wpływ sztywności giętnej przepon na stateczność pręta cienkościennego. Rozprawy Inżynierskie, 9, 4, 1961, 743–756.
[25] Cywiński Z., Kollbrunner C.F.: Drillknickecn dünnwandiger I-Stäbe mit veränderlichen, doppelt-symmetrischen Querschnitten. Institut für bauwissenschaftliche Forschung, Verlag Leemann Erich, 18, 1971, 1–35.
[26] Dąbrowski R.: W sprawie pewnego paradoksu w wyboczeniu skrętnym pręta dwuteowego. Zeszyty Naukowe Politechniki Gdańskiej, nr 36, Budownictwo Lądowe, 331, 1981, 75–80.
[27] Dems K., Mróz Z.: Variational approach by means of adjoint system to structural optimization and sensitivity analysis – I variation of material parameters within fixed domain. International Journal of Solids and Structures, 19, 8, 1983, 677–692.
[28] EN 1991-1-4. Eurocode 1: Basis of design and action on structures. Part 4: Actions in silos and tanks. Brussels: CEN 1995.
[29] ENV 1993-1-1. Eurocode 3: Design of Steel Structures. Part 1.1: General rules and rules for buildings. Brussels: CEN 1992.
[30] ENV 1993-1-1. Eurocode 3: Design of Steel Structures. Part 1.1: General rules and rules for buildings. Brussels: CEN 2005.
[31] ENV 1993-1-2. Eurocode 3: Design of Steel Structures. Part 1.2: General rules — Structural fire design, Brussels: CEN 2001.
[32] Excel: User Manual. Microsoft Corporation 2007. [33] Femap with NX Nastran. Version 10.1.1. Siemens Product Lifecyde Management Software Inc.
2009. [34] Gelfand I.M., Fomin S.W.: Rachunek wariacyjny. Warszawa: PWN 1970. [35] Gil H., Yura J.A.: Bracing requirements of inelastic columns. Journal of Constructional Steel
Research, 51, 1999, 1–19. [36] Girgin K., Ozmen G., Orakdogen E.: Buckling lengths of irregular frame columns. Journal of
Constructional Steel Research, 62, 2006, 605–613. [37] Giżejowski M.: Projektowanie ram przechyłowych o węzłach podatnych-aktualny stan i kierunki
rozwoju. Inżynieria i Budownictwo, 3, 1998, 140–145. [38] Giżejowski M.A., Barszcz A.M., Branicki C.J., Uzoegbo H.C.: Review of analysis methods for
inelastic design of steel semi-continuous frames. Journal of Constructional Steel Research, 62, 2006a, 81–92.
[39] Giżejowski M., Barszcz A., Kozłowski A., Ślęczka L.: Current practice and future development in modeling, analysis and design of semi-continuous frames. Archives of Civil Engineering, 53, 4, 2008, 73–128.
[40] Giżejowski M., Pancewicz Z., Żółtowski W., Kordiak J.: Ocena nośności szkieletu stalowego z uwzględnieniem błędów wykonawczych. Inżynieria i Budownictwo, 1, 1987, 125–130.
[41] Giżejowski M., Żółtowski W.: Długości wyboczeniowe prętów stalowych konstrukcji ramo-wych. Inżynieria i Budownictwo, 1, 1986, 14–19.
[42] Gosowski B.: Stateczność przestrzenna stężonych podłużnie i poprzecznie pełnościennych ele-mentów konstrukcji metalowych. Prace Naukowe Instytutu Budownictwa Politechniki Wrocław-skiej, Monografie 29, Wrocław: Wydawnictwo Politechniki Wrocławskiej 1992.
[43] Gosowski B.: Spatial stability of braced thin-walled members of steel structures. Journal of Con-structional Steel Research, 59, 2003, 839–865.
[44] Haftka R. T., Mróz Z.: First and second-order sensitivity analysis of linear and nonlinear struc-tures. AIAA Journal, 24, 7, 1986, 1187–1192.
[45] Haug E. J., Choi K. K., Komkov V.: Design sensitivity analysis of structural system. Orlando: Academic Press 1986.
[46] Heins C.P., Potocko R.A.: Torsional stiffening of I-grider webs. Journal of Structural Engineer-ing. ASCE, 105, 8, 1979, 689–1698.
[47] Hotała E., Hotała P., Bambrowicz M.: Bezpieczeństwo płatwi kratowych podczas obciążenia wiatrem lub śniegiem. Problemy naukowo-badawcze budownictwa, Konstrukcje budowlane i inżynierskie (pr. zbior. pod red. M. Broniewicza, J. A. Prusiel), Białystok: Wydawnictwo Poli-techniki Białostockiej, Białystok, 2, 2007, 241–248.

References 186
[48] Huang, Z.F, Tan, K.H.: Rankine approach for fire resistance of axially-and-flexurally restrained steel columns. Journal of Constructional Steel Research, 59, 12, 2003, 1553–1571.
[49] Iwicki P.: Analiza wrażliwości naprężeń normalnych w pręcie cienkościennym o przekroju bisymetrycznym otwartym. XLI Konferencja Naukowa Komitetu Inżynierii Lądowej i Wodnej PAN i Komitetu Nauki PZITB, Krynica, 3, 1995, 111–118.
[50] Iwicki P.: Problemy analizy wrażliwości prętów cienkościennych o przekroju bisymetrycznym otwartym poddanych działaniu obciążeń statycznych. Rozprawa doktorska. Politechnika Gdań-ska, Wydz. Budownictwa Lądowego 1997.
[51] Iwicki P.: Analiza wrażliwości siły krytycznej wyboczenia skrętnego pręta cienkościennego o przekroju bisymetrycznym otwartym ze stężeniami. IX Sympozjum Stateczności Konstrukcji, Zakopane, 2000, 69–76.
[52] Iwicki P.: Analiza wpływu naprężeń powalcowniczych i pospawalniczych na siłę krytyczną wy-boczenia skrętnego pręta dwuteowego. XLVIII Konferencja Naukowa Komitetu Inżynierii Lądo-wej i Wodnej PAN i Komitetu Nauki PZITB, Krynica, 2, 2002, 61–68.
[53] Iwicki P.: Analiza wrażliwości sił krytycznych pręta cienkościennego przy zmianach temperatu-ry na podstawie normy PN-90/B-03200. X Sympozjum Stateczności Konstrukcji, Zakopane, 2003a, 181–186.
[54] Iwicki P.: Wpływ stężeń typu bimomentowego na siłę krytyczną wyboczenia skrętnego cienko-ściennych prętów stalowych w podwyższonych temperaturach. Workshop Advanced Mechanics of Urban Structures, Sopot, 2003b, 161–164.
[55] Iwicki P.: Simulation of static response of thin walled bars with changed design parameters by means of second order sensitivity analysis. International Workshop Simulations in Urban Engi-neering, Gdańsk, 2004a, 133–136.
[56] Iwicki P.: Strengthening of thin-walled columns against flexural buckling at elevated tempera-ture. International Workshop Rehabilitation of Existing Urban Building Stock. Gdańsk, 2004b, 125–128.
[57] Iwicki P.: Wpływ sztywności podpór bocznych na nośność kratownic dachowych. XI Sympozjum Stateczności Konstrukcji, Zakopane, 2006, 69–76.
[58] Iwicki P.: Analiza wrażliwości kratownicy ze sprężystymi podporami bocznymi. Nowe Kierunki Rozwoju Mechaniki. Nowogród 2007a, CDROM.
[59] Iwicki P.: Niestateczność przestrzenna ściskanych pasów kratownic ze sprężystymi podporami bocznymi. Inżynieria i Budownictwo, 11, 2007b, 597–600.
[60] Iwicki P.: Sensitivity analysis of critical loads of I-columns. Archives of Civil Engineering, 53, 4, 2007c, 591–606.
[61] Iwicki P.: Stability of trusses with linear elastic side-supports. Thin Walled Structures, 45, 10–11, 2007d, 849–854.
[62] Iwicki P.: Stateczność przestrzenna kratownicy ze sprężystymi podporami bocznymi na przesuw i obrót. Problemy naukowo-badawcze budownictwa, Konstrukcje budowlane i inżynierskie (pr. zbior. pod red. M. Broniewicza, J. A. Prusiel), Białystok: Wydawnictwo Politechniki Biało-stockiej, 2007e, 2, 241–248.
[63] Iwicki P.: Stateczność przestrzenna podciągu kratowego z ukośnymi sprężystymi podporami bocznymi. Awarie Budowlane. Zapobieganie, diagnostyka, naprawy, rekonstrukcje, XXII konfe-rencja naukowo-techniczna, Szczecin-Międzyzdroje, 2007f, 593–601.
[64] Iwicki P., Comparison of non-linear statical analysis of truss with linear and rotational side supports and 3d roof model. 36th SolMech 2008: Proceedings of the 36th Solid Mechanics Conference, Gdańsk, 2008a, 365–357.
[65] Iwicki P.: Stability of truss with side – supports. The case of linear and rotational elastic supports. EUROSTEEL 2008: 5th European Conference on Steel and Composites Structures: research – practice – new materials, Graz, Austria, 2008b, 1641–1646.
[66] Iwicki P.: Stateczność przestrzenna płatwi kratowej obciążonej ssaniem wiatru, Problemy naukowo-badawcze budownictwa. Badawczo-projektowe zagadnienia w budownictwie (pr. zbiór. pod red. A. Łapko, M. Broniewicza, J. A. Prusiel), Białystok: Wydawnictwo Politechniki Biało-stockiej, 2008c, 6, 295–302.
[67] Iwicki P.: Odpowiedź autora artykułu. Inżynieria i Budownictwo, 4, 2008d, 228.

References 187
[68] Iwicki P.: Buckling of braced frames. XII Sympozjum Stateczności Konstrukcji, Zakopane, 2009a, 139–146.
[69] Iwicki P.: Comparison of classical Winter’s bracing requirements of compressed truss chord with stability analysis of 3D truss-model. PAMM, Proc. Appl. Math. Mech. 9, 2009b , 247 – 248.
[70] Iwicki P.: Sensitivity analysis of critical forces of trusses with side bracing, Journal of Construc-tional Steel Research, 66, 2010a, 923–930.
[71] Iwicki P.: Sensitivity analysis of buckling loads of bisymmetric I-section columns with bracing elements. Archives of Civil Engineering, 56, 1, 2010b, 69–88.
[72] Iwicki P.: Stability of roof trusses stiffened by corrugated sheets. Proceedings of the 9th Confe- rence „Shell Structures. Theory and Applications, Vol.2” (eds. W. Pietraszkiewicz, I. Kreja), Gdańsk–Jurata 2009, London: CRC Press/Balkema 2010c, 113–116.
[73] Iwicki P.: Buckling of frame braced by linear elastic springs. Mechanics and Mechanical Engi-neering, 14, 2, 2010d, 201–213.
[74] Iwicki P., Kin M.: Problemy współpracy nośnych elementów konstrukcji dachu kościoła w Grudziądzu. X Międzynarodowa Konferencja Naukowo-Techniczna "Konstrukcje Metalowe – Gdańsk 2001”, 3, 2001, 225–232.
[75] Iwicki P., Krutul P.: O zagrożeniu bezpieczeństwa konstrukcji dachu na skutek zastosowanych w projekcie uproszczonych schematów obliczeniowych. Inżynieria i Budownictwo, 9, 2006, 470–473.
[76] Iwicki P., Mikulski T., Szymczak C.: Eigenvalue sensitivity analysis of thin walled members. 32nd Solid Mechanics Conference, Zakopane, 1999a, 181–182.
[77] Iwicki P., Mikulski T., Szymczak C.: Some problems of sensitivity analysis of thin-walled members. Proceedings of IVth German-Polish Symposium Recent Developments in Civil Engineering and Environmental Engineering, Kaiserslautern, Gdańsk, 1999b, 209 –215.
[78] Jankowska–Sandberg J, Pałkowski S.: Parametric analysis of elastic lateral buckling of trusses. XLVIII Konferencja Naukowa Komitetu Inżynierii Lądowej i Wodnej PAN i Komitetu Nauki PZITB, Krynica, 2, 2002, 191–97.
[79] Jankowska–Sandberg J., Kołodziej J., Pałkowski S.: Badania doświadczalne zwichrzenia spręży-stego kratownic stalowych. XLIX Konferencja Naukowa Komitetu Inżynierii Lądowej i Wodnej PAN i Komitetu Nauki PZITB, 2, 2003a, 163–171.
[80] Jankowska–Sandberg J., Kołodziej J., Pałkowski S.: Analiza zwichrzenia sprężystego kratownicy stalowej. Inżynieria i Budownictwo, 7, 2003b.
[81] Kleiber M.: Parameter Sensitivity in Nonlinear Mechanics. Chichester: John Wiley & Sons 1997.
[82] Kołakowski Z., Kowal-Michalska K.(Eds.): Selected problems of instabilities in composite struc-tures. A series of monographs. Łódź: The Technical University Press 1999.
[83] Kołodziej J., Jankowska-Sandberg J.: Badania doświadczalne zwichrzenia sprężystego kratowni-cy stalowej z uwzględnieniem podatności stężeń bocznych. LII Konferencja Naukowa Komitetu Inżynierii Lądowej i Wodnej PAN i Komitetu Nauki PZITB, Krynica 2006, Zeszyty Naukowe Politechniki Gdańskiej, nr 601, Budownictwo Lądowe, 58, 2006, 123–129.
[84] Kozłowski A.: Kształtowanie szkieletów stalowych i zespolonych o węzłach półsztywnych. Rze-szów: Oficyna Wydawnicza Politechniki Rzeszowskiej 1999.
[85] Larue B., Khelil A., Gueury M.: Elastic flexural–torsional buckling of steel beams with rigid and continuous lateral restraints. Journal of Constructional Steel Research, 63, 2007, 692–708.
[86] Mageirou G.E., Charis J. Gantes C.J.: Buckling strength of multi-story sway, non-sway and par-tially-sway frames with semi-rigid connections. Journal of Constructional Steel Research, 62, 2006, 893–905.
[87] Magnucki K., Paczos P.: Theoretical shape optimization of cold-formed thin-walled channel beams with drop flanges in pure bending. Journal of Constructional Steel Research, 65, 8-9, 2009, 1731–1737.
[88] Marcinowski J.: Nieliniowa stateczność powłok sprężystych. Wrocław: Oficyna Wydawnicza Politechniki Wrocławskiej 1999.
[89] Matlab. Version 2007, The MathWorks Inc. 2007.

References 188
[90] Mohebkhah A., Showkati H.: Bracing requirements for inelastic castellated beams. Journal of Constructional Steel Research, 61, 2005, 1373–1386.
[91] Mróz Z., Haftka R.: Design sensitivity analysis of non-linear structures in regular and critical states. International Journal of Solids and Structures, 31, 15, 1994, 2071–2098.
[92] MSC Nastran for Windows. Version 2001. Los Angeles, USA: MSC Software Corporation [93] National Standard of People’s Republic of China. GB50017-2003: Code for design of steel
structures, Beijing: The Planning Press of China 2003 [in Chinese]. [94] Nguyen C.T., Moon J., Le V.N., Lee H-E.: Lateral-torsional buckling of I-griders with discrete
torsional bracings. Journal of Constructional Steel Research, 66, 2010, 170–177. [95] Niewiadomski L.: Wpływ początkowych wygięć pasów wiązarów na stan naprężeń w kon-
strukcji dachu. XLVIII Konferencja Naukowa Komitetu Inżynierii Lądowej i Wodnej PAN i Komitetu Nauki PZITB, Krynica, 2, 2002, 231–238.
[96] Özmen G., Girgin K.: Buckling lengths of unbraced multi-storey frame columns. Structural Engineering and Mechanics, 19, 1, 2005, 55–71.
[97] Pałkowski S.: Konstrukcje stalowe. Wybrane zagadnienia obliczania i projektowania. Warsza-wa: PWN 2009.
[98] Pałkowski S., Kołodziej J.: Wybrane zagadnienia stateczności ustrojów sprężyście podpartych. Zeszyty Naukowe Politechniki Gdańskiej, nr 51, Budownictwo Lądowe, 522, 1995, 295–309.
[99] Pałkowski S.: Obliczanie poprzecznych stężeń dachowych według normy PN-EN 1993-1-1. Problemy naukowo-badawcze budownictwa, Konstrukcje budowlane i inżynierskie (pr. zbiór. pod red. M. Broniewicza, J. A. Prusiel), Białystok: Wydawnictwo Politechniki Białostockiej, 2007, 2, 257–262.
[100] Pałkowski S., Kołodziej J., Jankowska-Sandberg J.: Uwagi do artykułu na temat niestateczności przestrzennej ściskanych pasów kratownic ze sprężystymi podporami bocznymi. Inżynieria i Budownictwo, 4, 2008, 227–228.
[101] Pi Y-L., Bradford M.A.: Inelastic buckling and strengths of steel I section arches with central torsional restraints. Thin-Walled Structures, 41, 2003, 663–689.
[102] Plum C.M., Svensson S.E.: Simple method to stabilize I – beams against lateral buckling. Journal of Structural Engineering. ASCE, 119, 10, 1993, 2855–2870.
[103] PN-90/B-03200: Konstrukcje stalowe. Obliczenia statyczne i projektowanie. Warszawa: PKN 1990.
[104] PN-EN 1993-1-1: Projektowanie konstrukcji stalowych. Cz.1.1: Reguły ogólne i reguły dla budynków, Warszawa: PKN 2006.
[105] PN-EN 1993-4-1: Projektowanie konstrukcji stalowych, Silosy. Warszawa: PKN 2007. [106] PN-B-06200: Konstrukcje stalowe budowlane – Warunki wykonania i odbioru, wymagania
podstawowe. Warszawa: PKN 1997.2002 [107] Robot Structural Analysis Professional. Version 2010. User Manual. Autodesk Inc 2010. [108] Rykaluk K.: Pozostające naprężenia spawalnicze w wybranych stanach granicznych nośności.
Prace Naukowe Instytutu Budownictwa Politechniki Wrocławskiej, Monografie 11, Wrocław: Wydawnictwo Politechniki Wrocławskiej 1981.
[109] Song C.Y., Teng J.G.: Buckling of circular steel silos subject to code-specified eccentric dis-charge pressures. Engineering Structures, 25, 2003, 1397–1417.
[110] Svensson S.E., Plum C.M.: Stiffener effects on torsional buckling of columns. Journal of Struc-tural Engineering. ASCE, 109, 1983,758–772.
[111] Szefer G.: Analiza wrażliwości i optymalizacja układów dynamicznych z rozłożonymi parame-trami. Mechanika, 1, 4, 1983, 5–36.
[112] Szewczak R.M., Smith E.A.: DeWolf J.T.: Beams with torsional stiffeners. Journal of Struc-tural Engineering. ASCE, 109, 7,1983, 1635–1647.
[113] Szymczak C.: Wyboczenie skrętne prętów cienkościennych o bisymetrycznym przekroju otwar-tym. Rozprawy Inżynierskie – Engineering Transactions, 26, 2, 1978, 323–330.
[114] Szymczak C.: Optymalne kształtowanie prętów cienkościennych o bisymetrycznym przekroju dwuteowym z uwagi na wartości własne. Zeszyty Naukowe Politechniki Gdańskiej, nr 322, Budownictwo Lądowe, 35, 1980, 1–85.

References 189
[115] Szymczak C.: On torsional buckling of thin-walled I-columns with variable cross-section. International Journal of Solids and Structures, 19, 6, 1983, 509–518.
[116] Szymczak C.: Analiza wrażliwości obciążenia krytycznego zwichrzenia belki dwuteowej. XXXVIII Konferencja Naukowa Komitetu Inżynierii Lądowej i Wodnej PAN i Komitetu Nauki PZITB, Krynica, 1, 1992, 107–113.
[117] Szymczak C.: Analiza wrażliwości obciążeń krytycznych prętów cienkościennych. XLII Konfe-rencja Naukowa Komitetu Inżynierii Lądowej i Wodnej PAN i Komitetu Nauki PZITB, Krynica, 2, 1996, 169–176.
[118] Szymczak C.: Effect of residual stresses on buckling and initial post buckling behavior of thin-walled columns. Archives of Civil Engineering, 44, 3, 1998, 287–297.
[119] Szymczak C.: Effect of elastic restraints on buckling loads and initial post-buckling behavior of thin-walled column. Archives of Civil Engineering, 45, 4, 1999a, 635–649.
[120] Szymczak C.: Sensitivity analysis of critical loads of flexural-torsional buckling of thin-walled I-beam. Archives of Civil Engineering, 45, 3, 1999b, 491–503.
[121] Szymczak C.: O wpływie stężeń pionowych na zachowanie się ramowych konstrukcji stalo-wych. Inżynieria i Budownictwo, 3, 2003a, 159–161.
[122] Szymczak C.: Sensitivity analysis of thin-walled members, problems and application. Thin-Walled Structures, 41, 2003b, 271–290.
[123] Szymczak C., Chróścielewski J., Lubowiecka I.: On the paradox of torsional buckling of thin-walled I columns. Archives of Civil Engineering, 49, 2003a, 3–13.
[124] Szymczak C., Iwicki P.: Analiza wrażliwości nośności osiowo ściskanych prętów na podstawie normy PN-90/B-03200. Inżynieria i Budownictwo, 8, 1996, 452–455.
[125] Szymczak Cz., Iwicki P., Mikulski T.: Sensitivity analysis of critical torsional loads of thin-walled columns with bisymetric open cross-section. Proceedings of the XIV Polish Conference on Computer Methods in Mechanics, Rzeszów, 1999a, 355–356.
[126] Szymczak C., Iwicki P., Mikulski T.: Analiza wrażliwości częstości skrętnych drgań swobod-nych belki dwuteowej z przeponami. Zeszyty Naukowe Politechniki Rzeszowskiej, nr 174, Mechanika, 52, 1999b, 351–356.
[127] Szymczak C., Iwicki P., Mikulski T.: Analiza wrażliwości w problemach dynamiki i stateczno-ści prętów cienkościennych o przekroju otwartym. Komitet Badań Naukowych. Projekt badaw-czy 7T07E 03512, 1998–2000, Gdańsk 2000a.
[128] Szymczak C., Iwicki P., Mikulski T.: Wpływ naprężeń pospawalniczych na siłę krytyczną wyboczenia skrętnego pręta cienkościennego o przekroju bisymetrycznym. Konferencja Zbior-niki Cienkościenne, Karłów, 1998, 79–82.
[129] Szymczak C., Mikulski T., Kreja I., Kujawa M.: Sensitivity Analysis of Beams and Frames Made of Thin-Walled Members. Monografia, Gdańsk: Wydawnictwo Politechniki Gdańskiej 2003b.
[130] Szymczak C., Mikulski T., Iwicki P.: Some problems of sensitivity analysis of thin-walled members with open cross-section. 4th Euromech Solid Mechanics Conference, Metz, 2000b, 565.
[131] Tang C.Y., Tan K.H., Ting S.K.: Basis and application of a simple interaction formula for steel columns under fire conditions. Journal of Structural Engineering. ASCE, 127, 10, 2001, 1206–13.
[132] Tan, K.H., Yuan, W.F.: Buckling of elastically restrained steel columns under longitudinal non-uniform temperature distribution. Journal of Constructional Steel Research, 64, 2008, 51–61.
[133] Tan K.H., Yuan W.F.: Inelastic buckling of pin-ended steel columns under longitudinal non-uniform temperature distribution. Journal of Constructional Steel Research, 65, 2009, 132–141.
[134] Thompson J.M.T., Hunt G.W.: A General Theory of Elastic Stability. London, New York, Sydney, Toronto: John Willey &Sons 1973.
[135] Toh W.S., Tan K.H., Fung T.C.: Rankine approach for steel columns in fire: numerical studies. Journal of Constructional Steel Research, 59, 2003, 315–334.
[136] Tong G.S. , Ji Y.: Buckling of frames braced by flexural bracing. Journal of Constructional Steel Research, 63, 2007, 229–236.
References 190
[137] Tong G.S., Shi Z.Y.: The stability of weakly braced frames. Advances in Structural Engineer-ing, 4, 4 , 2001, 221–225.
[138] Tong G.S., Xing G.R.: Determination of buckling mode for braced elastic–plastic frames. Engineering Structures, 2007, 29, 2487–2496.
[139] Trahair N.: Flexural-Torsional Buckling of Structures. London: E&FN Spon 1993. [140] Valentino J., Pi Y.-L., Trahair N.S.: Inelastic buckling of steel beams with central torsional
restraints. Journal of Structural Engineering. ASCE, 123, 9, 1997, 1180–1186. [141] Valentino J., Trahair N.S.: Torsional restraint against elastic lateral buckling, Journal of Struc-
tural Engineering. ASCE, 124, 10, 1998, 1217–1225. [142] Vlasov V. Z.: Thin-walled elastic beams. Jerusalem: Israel Program for Scientific Translations
1961. [143] Vrcelj Z., Bradford M.A.: Elastic distortional buckling of continuously restrained I-section
beam–columns. Journal of Constructional Steel Research, 62, 2006, 223–230. [144] Waszczyszyn Z., Cichoń C., Radwańska M.: Metoda elementów skończonych w stateczności
konstrukcji. Warszawa: Arkady 1990. [145] Weiss S., Giżejowski M.: Stateczność konstrukcji metalowych – Układy prętowe. Warszawa:
Arkady 1991. [146] Winter G.: Lateral bracing of columns and beams. Journal Structural Engineering. ASCE,
84(ST2), 1958, 1–22. [147] Wójcik M., Iwicki P., Tejchman J.: 3D buckling analysis of a cylindrical metal bin composed of
corrugated sheets strengthened by vertical ribs. Report. Department of Fundamentals of Build-ing and Material Engineering and Department of Structural Mechanics and Bridges, Faculty of Civil and Environmental Engineering, Gdansk University of Technology, 2010a.
[148] Wójcik M., Iwicki P., Tejchman J.: Failure and repair of cylindrical steel silos composed of horizontally corrugated sheets stiffened by vertical columns. Report. Department of Fundamen-tals of Building and Material Engineering and Department of Structural Mechanics and Bridges, Faculty of Civil and Environmental Engineering, Gdansk University of Technology, 2010b.
[149] Yura JA.: Winter’s bracing approach revisited. Engineering Structures, 18, 10, 1996, 821–825.

SELECTED PROBLEMS OF STABILITY OF STEEL STRUCTURES
In the presented work the results of research concerned with stability of selected steel structures are investigated. The problem of stability analysis is significant in the design of various steel structures, because the structural elements are usually responsible for bearing loading in their plane and are rela-tively weak out of this plane. Therefore those elements must be braced against the out-of-plane buckling. The stiffness of bracing, the cross-section dimension, the post-welding or post-rolling stresses, or the cross-section temperature may affect the load-bearing capacity, or the buckling load of steel structures. The problem is noted in the design codes. Various code requirements are devoted to the requirements concerning bracing and the effective lengths of the compression members. The buckling length of steel members related to critical elastic buckling load of a structure is therefore of crucial importance in the design code procedures. The elastic critical buckling load and the limit load of geometrically non-linear statics is under consideration. The research is based on the classical linear theory of thin-walled beams with non-deformable cross-section. The influence of various design parameters on buckling and the limit load of structures in both the parametric geometrically non-linear static, stability and sensitivity analyses are investigated.
The first order variation of the buckling load of thin-walled columns with bisymmetric open cross-section due to the following variations of the design variables is derived: ⎯ cross-section dimensions, ⎯ material characteristics, ⎯ the stiffness and location of the stiffeners, both the lateral stiffeners and the ones that restrain
warping and torsion of the cross-section, ⎯ residual welding or rolling stresses.
In the numerical examples dealing with an I-column the functions describing the effect of varia-tion of the dimensions of the cross-section, the variation of some parameters defining the residual post-welding or post-rolling stresses, the cross-section temperature, or the influence of the location of various kinds of stiffeners with unit stiffness on the critical load of torsional and flexural buckling are found. The linear approximations of the exact relationship of critical loads due to variations of the design variables are determined and the approximation errors are discussed. The sensitivity analysis of a silo column buckling load is also investigated
In the research some results of parametrical analyses of trusses with bracing are also presented. A nonlinear analysis of an illustrative truss with imperfections is also carried out, and limit loads and maximal forces in compressed chord due to stiffness of side supports are calculated.
The analysis is devoted to a study of lateral buckling of truss with linear elastic and rotational side-supports. In the research various localizations of bracing of truss are taken into account. The effect of slope of side-support on the limit and buckling load of trusses is also considered.
For different stiffnesses of bracing the following relations are determined: ⎯ the relation between a normal force in the truss chord and the out-of-plane truss displacements, ⎯ the elastic support reaction in relation to the force in a compressed chord, ⎯ buckling length related to side-support distance.
The design sensitivity analysis of the limit load and the critical load of some exemplary trusses due to side-support stiffness is carried out. The influence line of the variation of the limit load of the truss due to the use of side-supports of unit stiffness at chord joints, is found. It has been noted that for some side-support localization some additional new side-supports may cause a decrease of the limit load.
The lateral buckling of the 3D truss model and the one of the isolated truss chord were compared. The results are set against the design code requirements and the classical Winter bracing

Summary in english 192
requirements. It has been shown that the buckling length of the truss chord with side-supports regarded as elastic elements, is larger than the assumed one in the design codes. It has been found that the Winter method applied to an isolated truss chord does not give a safe condition for the truss brac-ing for a full range of bracing stiffness.
In this research the sensitivity analysis of critical buckling loads of truss due to bracing stiffness is carried out and the threshold bracing stiffness condition for full bracing of a truss is found. For various initial stiffnesses of bracing the influence lines of the unit change of bracing stiffness on the buckling load are found. The approximations of the exact relation between the buckling load and the bracing stiffness are determined.
In this paper the classical Winter model, developed originally for columns is applied to frame structures and compared with the results of a parametric study of frame with bracing. The sensitivity analysis of critical loads of a frame due to bracing stiffness is carried out, and the threshold bracing stiffness for full bracing is found. In the non-linear statical analysis the forces in bracing are calcu-lated.

Summary in polish 193
WYBRANE PROBLEMY STATECZNOŚCI KONSTRUKCJI STALOWYCH
W pracy przedstawiono wyniki badań dotyczących stateczności wybranych konstrukcji stalo-wych. Problemy stateczności są szczególnie ważne przy projektowaniu konstrukcji stalowych, ponieważ nośne elementy konstrukcyjne są zwykle projektowane do przenoszenia obciążeń w swojej płaszczyźnie i muszą być zabezpieczone przed utratą stateczności z tej płaszczyzny. Sztywność stę-żeń, charakterystyki przekroju poprzecznego, naprężenia pospawalnicze lub powalcownicze i tempe-ratura konstrukcji mogą wpływać na wielkość obciążeń krytycznych konstrukcji. Dlatego też proble-my te są ujęte w normach projektowania konstrukcji. Kluczowe znaczenie w normowych procedurach projektowania konstrukcji stalowych ma długość wyboczeniowa elementów konstrukcyjnych, która jest wyznaczana na podstawie obciążeń krytycznych konstrukcji. Prezentowane rozważania są oparte na klasycznych założeniach teorii prętów cienkościennych o nieodkształcalnym przekroju poprzecz-nym.
Wyznaczono pierwszą wariację sił krytycznych pręta cienkościennego o bisymetrycznym otwar-tym przekroju poprzecznym uwzględniając następujące zmienne projektowe: ⎯ wymiary przekroju poprzecznego, ⎯ charakterystyki materiałowe, ⎯ sztywność i lokalizacja różnego typu stężeń, jak na przykład stężeń poprzecznych lub stężeń
ograniczających skręcenie lub spaczenie pręta, ⎯ naprężenia pospawalnicze lub powalcownicze.
W przykładach numerycznych dotyczących słupów o przekroju dwuteowym wyznaczono funk-cje opisujące wpływ wariacji wymiarów przekroju poprzecznego, naprężeń pospawalniczych lub powalcowniczych, wpływ wariacji temperatury przekroju poprzecznego lub lokalizacji różnego typu stężeń na siłę krytyczną wyboczenia skrętnego lub giętnego. Wyznaczono liniowe aproksymacje zależności sił krytycznych od zmiennych projektowych i zbadano dokładność tych aproksymacji.
W pracy przedstawiono wyniki badań stateczności i geometrycznie nieliniowych analiz statycz-nych kratownic ze stężeniami. Przeprowadzono analizy przykładowych kratownic dachowych z imperfekcjami i wyznaczono obciążenia graniczne i odpowiadające im siły w pasach ściskanych kratownic oraz w stężeniach w zależności od sztywności stężeń.
W analizie zwichrzenia kratownic uwzględniono usztywnienia poprzeczne i stężenia ogranicza-jące skręcenie. W badaniach analizowano wpływ usytuowania tych stężeń w różnych miejscach kon-strukcji oraz wpływ pochylenia stężeń na nośność krytyczną i graniczną kratownic.
Dla różnych sztywności stężeń wyznaczono: ⎯ zależności pomiędzy siłą normalną w pasie ściskanym kratownic w funkcji przemieszczeń
z płaszczyzny kratownic, ⎯ reakcje w stężeniach w zależności od siły w pasie ściskanym kratownic, ⎯ współczynnik długości wyboczeniowej pasa ściskanego w odniesieniu do rozstawu stężeń.
Przeprowadzono analizę wrażliwości sił krytycznych i granicznych kilku kratownic w zależno-ści od sztywności stężeń poprzecznych. Dla różnych początkowych sztywności stężeń wyznaczono funkcje podcałkowe wrażliwości przedstawiające wpływ wprowadzenia kolejnych stężeń o jednost-kowej sztywności na zmiany sił krytycznych. Wyznaczono liniowe aproksymacje zależności sił kry-tycznych od sztywności stężeń. Stwierdzono, że w pewnych przypadkach dodanie dodatkowych stę-żeń może spowodować spadek obciążeń granicznych konstrukcji.
Porównano zachowanie się kratownicy przestrzennej z modelem opisującym tylko pas ściskany. Wyniki badań numerycznych porównano z wymogami norm projektowania konstrukcji i klasyczną metodą Wintera. Wykazano, że długości wyboczeniowe pasa ściskanego ze sprężystymi podporami bocznymi są większe niż to założono w normach. Wykazano ponadto, że klasyczna metoda Wintera

Summary in polish 194
zastosowana do analizy wyizolowanego pasa górnego kratownicy nie zapewnia bezpiecznego warun-ku stężenia kratownic.
W pracy zaproponowano również metodę wyznaczania minimalnej sztywności stężeń, zapewnia-jącej stateczność kratownicy, opartą na analizie wrażliwości. Metoda ta pozwala na wyznaczenie obcią-żeń krytycznych kratownic na podstawie analizy konstrukcji bez stężeń.
W pracy przedstawiono też analizę parametryczną i analizę wrażliwości ram ze stężeniami. Wyniki analiz numerycznych i analiz wrażliwości porównano z klasyczną metodą Wintera. Wyzna-czono też progowy warunek sztywności stężeń zapewniający nieprzesuwność konstrukcji ramowej.